Embed Size (px)
Citation preview


Hydrocarbon and Ecotoxicity of Water and Sediment from Iguassu and Barigui Rivers after the Oil Spill occurred in July/2000,
Parana, Brazil
PETROBRAS RESEARCH CENTER/CENPES
Irene T. Gabardo
Maria de Fátima Guadalupe Meniconi Eduardo Barcelos Platte
Letícia Veiga Falcão
Gilson Cruz da Silva (Fundação Gorceix)
PETROBRAS REFINERY-REPAR
Fernando Henrique Falkiewicz

About the accident
• On the 16th. of July, 2000
• 4000 m3 crude oil spilled
• cause: peline rupture
Iguassu River oil spill - July/2000
pi

Iguassu River oil spill - July/2000
Paraná
Site of the spill

Parana - Iguassu River
Rio Barigui
Rio Iguaçu
Ponto 0
1 2
3A45
6 (17 km)
(13 km)
(28 km)
(44 km)
6a
(84 km)
GAL. LÚCIOGAL. LÚCIO
7
(174 km)
8
(314 km) 9
2A3B 3
ento
Iguassu River oil spill - July/2000
o BOOMS
IGUASSU
FALLS

Iguassu River Ecosystem
Iguassu River oil spill - July/2000

Iguassu River - Booms at P6 - Balsa Nova
Iguassu River oil spill - July/2000
Iguassu River oil spill - July/2000
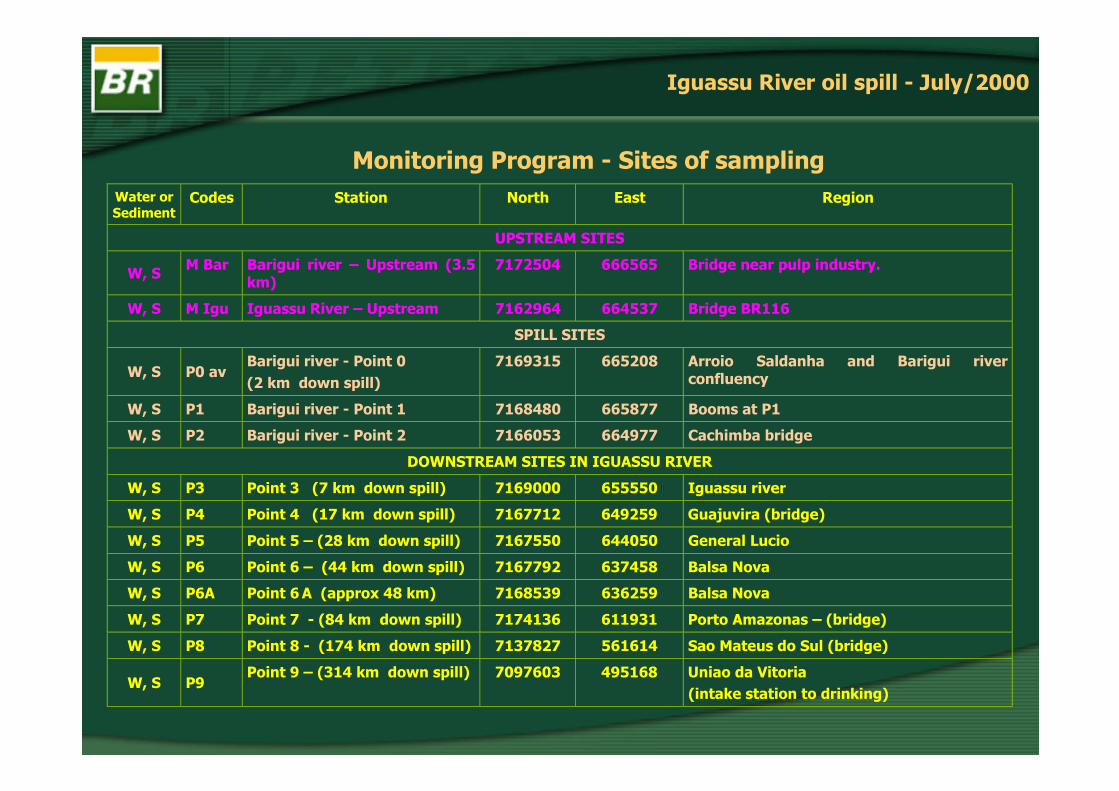
Monitoring Program - Sites of samplingWater or Sediment
Codes Station North East Region
UPSTREAM SITES
W, S M Bar Barigui river – Upstream (3.5 km)
7172504 666565 Bridge near pulp industry.
W, S M Igu Iguassu River – Upstream 7162964 664537 Bridge BR116
SPILL SITES
W, S P0 av Barigui river - Point 0 (2 km down spill)
7169315 665208 Arroio Saldanha and Barigui river confluency
W, S P1 Barigui river - Point 1 7168480 665877 Booms at P1
W, S P2 Barigui river - Point 2 7166053 664977 Cachimba bridge
DOWNSTREAM SITES IN IGUASSU RIVER
W, S P3 Point 3 (7 km down spill) 7169000 655550 Iguassu river
W, S P4 Point 4 (17 km down spill) 7167712 649259 Guajuvira (bridge)
W, S P5 Point 5 – (28 km down spill) 7167550 644050 General Lucio
W, S P6 Point 6 – (44 km down spill) 7167792 637458 Balsa Nova
W, S P6A Point 6 A (approx 48 km) 7168539 636259 Balsa Nova
W, S P7 Point 7 - (84 km down spill) 7174136 611931 Porto Amazonas – (bridge)
W, S P8 Point 8 (174 km down spill) 7137827 561614 Sao Mateus do Sul (bridge)
W, S P9 Point 9 – (314 km down spill) 7097603 495168 Uniao da Vitoria
(intake station to drinking)
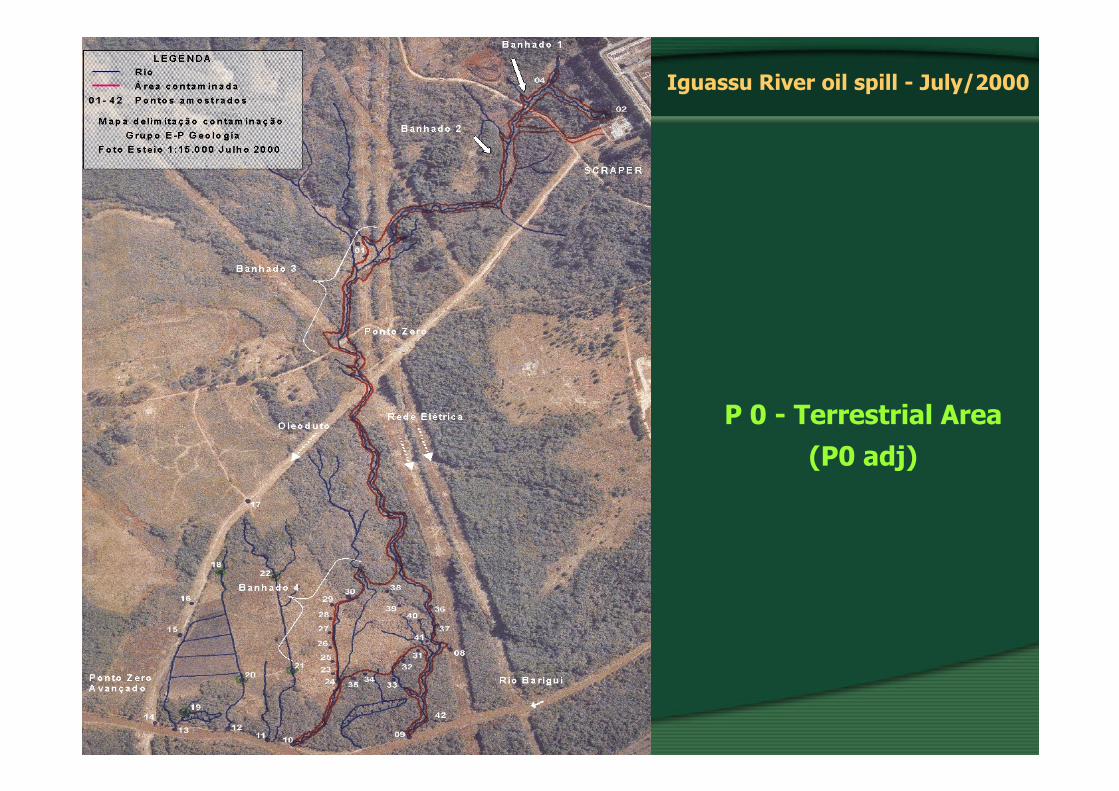
Iguassu River oil spill - July/2000
P 0 - Terrestrial Area (P0 adj)

oAPI: oC:
SIM DIS: <36 to 588oC residue 27% up to 588oC)
Evaporation estimative: % (up to 180oC)
SARA (% weight): 3 2 R=9.6 8
PAH: 16 mg/g (mainly naphtalenes, phenantrenes)
Spilled Oil CharacterizationSpilled Oil Characterization
Iguassu River oil spill - July/2000
Density 20/441 0,8164
(
26
S= 71. A=18. A=0.

Toxicity of the Spilled OilToxicity of the Spilled Oil
Iguassu River oil spill - July/2000
Spilled Oil Vibrio fischeri (Microtox)
Daphnia similis Brachydanio rerio
(Code 1447) CE5015min
(% WSF) CE5048h
(% WSF) CL5048h
(% WSF)
Test 1 7,13 - 28,15
Test 2 8,31 23,96 -
Test 3 7,69 49,52 -
WSF: Water soluble fraction

Iguassu River oil spill - July/2000
Water Analysis during 3 months (Jul to Aug/2000)
• 360 Chemical Analysis in 120 samples TPH (GC/FID) Biomarkers (GC/MS )
BTEX (P&T/GC/PID) Phenols (GC/MS )
PAH (UV-Fluorescence and GC/MS )
• Metals and Pesticides in 14 samples • 186 toxicity tests in 44 samples
Vibrio fisheri Daphnia similis Brachydanio rerio Ceriodaphnia dubia

TPH in the Rivers Waters
Iguassu River oil spill - July/2000
Estações
THP
-5000
0
5000
10000
15000
20000
25000
30000
35000
40000
M Bar M Igu P0 Adj P0 rio P4 P6 P7 P8 P9
MaxMin75%25%Mediana
Stations
TPH
(µg/
L)
Median
(µg/
g)

TPH (excluding P 0 terrestrial area)
TPH
(µg/
g)
Stations
Iguassu River oil spill - July/2000
Estações
THP
(µg/
L)
-1000
1000
3000
5000
7000
9000
M Bar M Igu P0 rio P4 6 P7 8 P9
MaxMin75%25%MedianaMedian
Stations
in the Rivers Waters
P P

BTEX and PAH rs Waters
BTEX
PAH (UV-Fluorescence)
Iguassu River oil spill - July/2000
Estações
HPA
(µg/
L
-200
200
600
1000
1400
1800
2200
2600
M Bar M Igu P0 Adj P0 rio P4 6 P7 8 9
MaxMin75%25%Mediana
Stations
PAH
(µg/
L) Median
Estações
BTE
X (µ
g/L)
-500
0
500
1000
1500
2000
2500
3000
3500
M Bar M Igu P0 Adj P0 rio P4 P6 P7 P8 P9
MaxMin75%25%Mediana
Stations
Median
in the Rive
P P P

BTEX in the Rivers Waters (excluding P 0)
Iguassu River oil spill - July/2000
Estações
BTE
X
-50
0
50
100
150
M Bar M Igu P0 rio P4 6 P7 8 P9
MaxMin75%25%Mediana
Stations
Median
(µg/
L)
P P

PAH in the Rivers Waters (excluding P 0)
Estações
HPA
(µg/
L)
-50
0
50
100
150
200
250
300
350
400
M Bar M Igu P0 rio P4 6 P7 8 P9
MaxMin75%25%Mediana
Stations
Median
PAH
(µg/
L)Iguassu River oil spill - July/2000
P P

Iguassu River oil spill - July/2000
Fingerprinting of Water Samples Extracts (TPH GC-FID) FID1 A, (D:\HPCHEM\1\REPAR\AGO\THP1608\SIG10003.D)
pA
100
80 Barigui River 60 Upstream 40
15/Aug/00 20
0 FID1 A, (C:\HPCHEM\1\2000\NOVEMBRO\07REP\SIG10008.D)
pA
800 P0 Terrestrial
600 nC12
nC13
nC14
nC15
nC16
d n
C16
nC17
Pr
ista
no
nC18
f
itano
nC19
nC
20d
nC
20
nC21
nC22
nC23
nC
24d
nC
24
nC25
nC26
nC27
nC
28
nC29
nC30
d nC
30
nC31
nC
32
nC33
nC
34
area 400
04/Oct/00 200
0 10 20 30 40 50 min0FID1 A, (C:\HPCHEM\1\2000\JULHO\23REPAR\SIG10005.D)
pA
P6 Guajuvira 175
150
125
nC12
nC13
nC14
nC15
nC16
dnC
16 nC
17
nC18
nC19
nC20
nC21
nC22
nC23
nC24
nC25
nC26
nC27
nC
28
nC29 nC
30d
nC30
nC
31
nC32
nC
33
20/Jul/00 100
75
50
25
0 10 20 30 40 50 min

Concentração (ng/L)
600400
1000 800
14001200
UPSTR
EAM
BA
RIG
UI R
IVER 20/July/2000
1600
200 0
2MN 1MN C2N C3N C4N Ace
Aceft
C1Flu C2Flu C3Flu
Fen C1Fen C2Fen C3Fen C4Fen
C1Pi C2Pi BaA
C1Cri C2Cri BbFt BkFt BaPi
DBahA BghiP
N
PA
H
by GC
-MS in
rivers water
Iguassu
River oil sp
ill -Ju
ly/20
00
Flu
Ant Ft Pi
Cri
I-Pi
PA
H
MS in
rivers water
Iguassu
River oil sp
ill -Ju
ly/20
00
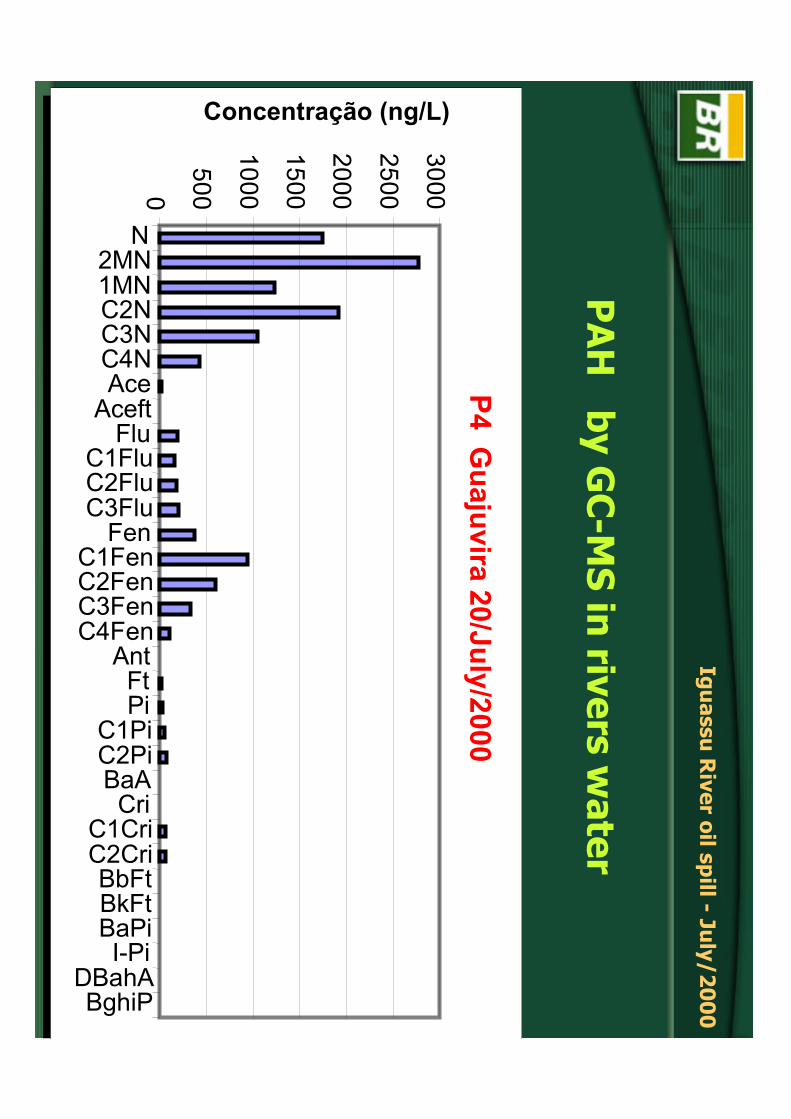
P4 uvira 20/July/2000
0
500
1000
1500
2000
2500
3000
N 2MN 1MN C2N C3N C4N Ace
Aceft Flu
C1Flu C2Flu C3Flu
Fen C1Fen C2Fen C3Fen C4Fen
Ant Ft Pi
C1Pi C2Pi BaA
Cri C1Cri C2Cri BbFt BkFt BaPi I-Pi
DBahA BghiP
Concentração (ng/L)
by GC
-
Guaj

TOXICITY IN RIVERS WATER
Iguassu River oil spill - July/2000
0
1
2
3
4
5
6
Samp ling site s
TU
Mic rotox Daphnia s im ilis B rac hydanio rerio Ceriodaphnia dub ia
Up s tream S pill area Down s tream
TU= Toxic Units (express the toxicity as a inverse of CL50

Iguassu River oil spill - July/2000
Water Toxicity
• The toxicity tests indicated the impact was restrict to P0 terrestrial area;
• it was observed toxicity in other parts of the rivers not related to the oil spill (caused by other sources)
Vibrio fisheri Daphnia similis Brachydanio rerio Ceriodaphnia dubia

Iguassu River oil spill - July/2000
CONCLUSIONS ABOUT RIVER WATER
⇒ No contamination was observed at Iguassu river at P7 (84 km), P8
(174 km), P9 (314km) stations during the monitoring after the spill;
⇒ The BTEX, TPH, PAH results indicated:
• the high concentrations were obtained at P0 terrestrial region;
• the upstream stations demonstrated high level of hydrocarbon;
• the downstream stations at Barigui and Iguassu rivers showed
background hydrocarbon levels after 1 week of the accident;
� No match with the Biomarkers of the spilled oil was observed
for the downstream stations even in Barigui or Iguassu river.

Iguassu River oil spill - July/2000
14 Sediment Samples (1 month after spill)
Chemical Analysis TPH (GC/FID)
BTEX (P&T/GC/PID)
PAH (GC/MS )
Metals Toxicological assays (Microtox and Daphnia similis)
n-Alkanes (GC/FID)
UCM (GC/FID)
Phenols (GC/MS )
Pesticides

Hydrocarbons in River Sediments µg/g ( ppm)
Iguaç
u Mo
nt
Barig
ui Mo
nt
P 0
-bar
1
P 0
-bar
2
P 1
P 2
P 3B
P 4
P 5
P 6
P 6A
P 7
P 8
P 9
n-a lc a nos
P AH
BTEX
UCM
TP H0
100
200
300
400
500
600
700
800
900
1000
Hydr
ocar
bons
( g
/g)
Stations
Iguassu River oil spill - July/2000
-

Iguaç
u Mo
nt
Barig
ui Mo
nt
P 0
-bar
1
P 0
-bar
2
P 1
P 2
P 3B
P 4
P 5
P 6
P 6A
P 7
P 8
P 9
B TEX PAH (1 6 )
PAH (3 2 )
0
100
200
300
400
500
600
700
800
900
1000
Hydr
ocar
bons
(ng
/g)
Stations
Hydrocarbons in River Sediments ng/g ( ppb)
Iguassu River oil spill - July/2000
-

0
Total extract (TEM)
n-alkan
es (after cleanu
p)10
20 30
40 50
m0
1020
3040
50m
P4 -
Gu
ajuvira
22/Au
g/00 m
0 10
20 30
40 50
pA
20
30
40
50
60
70
80
90
nC10 nC11
nC12 nC13
nC14 nC15
nC16d nC16 nC17Pristano
nC18fitano nC19nC20dnC20
nC21 nC22 nC23nC24d nC24
nC25 nC26
nC27 nC28
nC29nC30d nC30nC31
nC32nC33
nC34
m0
10 20
30 40
50
pA
20
40
60
80
100
nC13 nC14
nC15 nC16d nC16
nC17Pristano nC18fitano
nC19 nC20d nC20
nC21 nC22
nC23 nC24
nC25 nC26
nC27 nC28
nC29nC30d nC30 nC31 nC32nC33
nC34
pA
20
30
40
50
60
70
80
90 FID1 A,
nC13
nC15 nC16dnC16
nC17Pristano nC18fitano
nC19 nC20
nC21 nC22
nC23nC24d nC24
nC25 nC26
nC27 nC28
nC29nC30dnC30 nC31
nC32 nC33
nC34
pA
20
30
40
50
60
70
80
90 FID1 A,
nC12dnC12 nC13
nC14 nC15
nC16dnC16 nC17Pristano
nC18fitano nC19
nC20dnC20 nC21
nC22 nC23nC24dnC24 nC25 nC26 nC27 nC28 nC29nC30dnC30
nC31 nC32 nC33
nC34
Barigu
i
upstream
24/Au
g/00
(E:\UC
M-2000\O
UT\18ALL2\SIG
10005.D)
(C:\H
PCH
EM\1\2000\N
OVEM
BRO
\14ALL\SIG10024.D
)
River
FID1 A,
(E:\UC
M-2000\O
UT\18ALL2\SIG
10011.D)
FID1 A,
(C:\H
PCH
EM\1\2000\N
OVEM
BRO
\14ALL\SIG10045.D
)
Fingerpritin
g of Sedimen
t extracts (GC
-FID)
Iguassu
River oil sp
ill -Ju
ly/20
00

UP
STREA
M B
AR
IGU
I RIV
ER
0 10 20 30 40 50 60 70 80 90
100
N 2MN 1MN C2N C3N C4N Ace
Aceft Flu
C1Flu C2Flu C3Flu
DBT C1DBT C2DBT C3DBT
Fen C1Fen C2Fen C3Fen C4Fen
Ant Ft Pi
C1Pi C2Pi BaA Cri
C1Cri C2Cri BbFt BkFt BaPi I-Pi
DBahA BghiPe
Concentration (ng/g)
Iguassu
River oil sp
ill -Ju
ly/20
00
PA
H in
sedimen
t by GC
-MS

PA
H in
sedimen
t by GC
-MS
Iguassu
River oil sp
ill -Ju
ly/20
00
Station
-G
uaju
vira
0 20 40 60 80
100 120 140 160 180
N 2MN 1MN C2N C3N C4N Ace
Aceft Flu
C1Flu C2Flu C3Flu
DBT C1DBT C2DBT C3DBT
Fen C1Fen C2Fen C3Fen C4Fen
Ant Ft Pi
C1Pi C2Pi BaA Cri
C1Cri C2Cri BbFt BkFt BaPi I-Pi
DBahA BghiPe
Concentration (ng/g)
P4
Iguassu River oil spill - July/2000
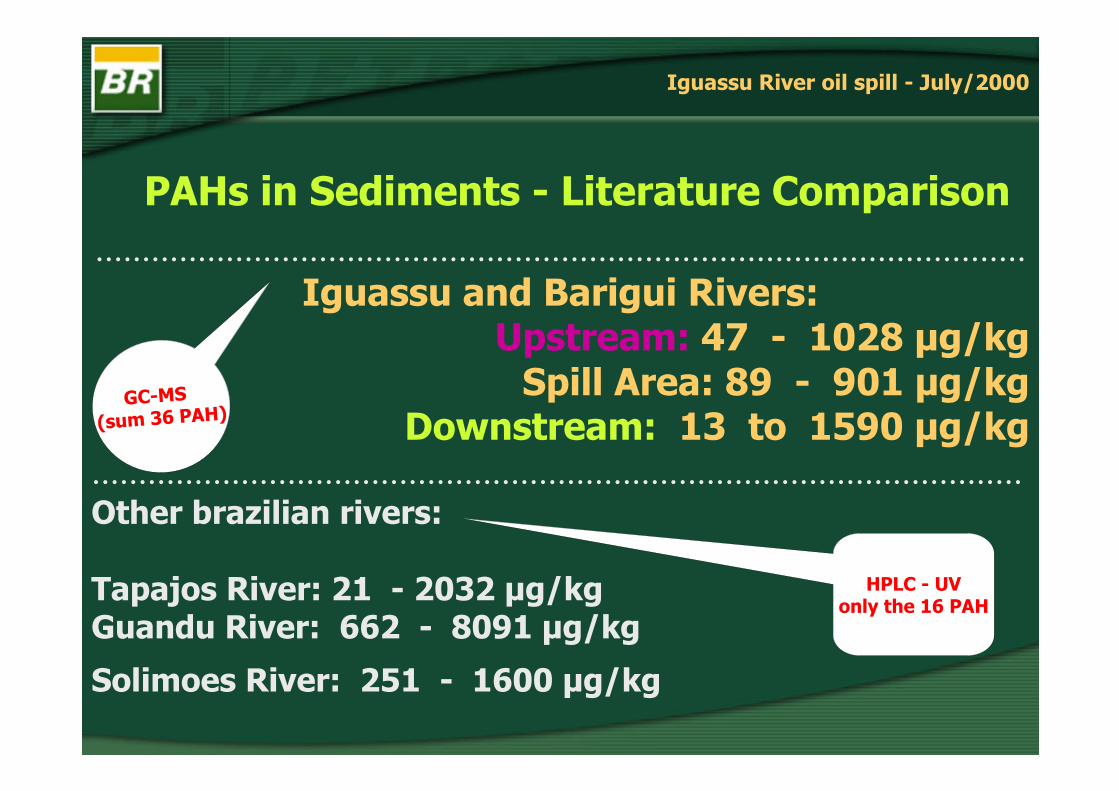
PAHs in Sediments - Literature Comparison ....................................................................................................
Iguassu and Barigui Rivers: Upstream: 47 1028 µg/kg
Spill Area: 89 901 µg/kg Downstream: 13
.................................................................................................... Other brazilian rivers:
Tapajos River: 21 2032 µg/kg Guandu River: 8091 µg/kg
Solimoes River: 1600 µg/kg
HPLC - UV only the 16 PAH
GC-MS (sum 36 PAH)
--1590 µg/kg to
--662
-251

Iguassu River oil spill - July/2000
Toxicity of the sediments leaching Microtox
(Vibrio fischeri) Daphnia similis
SAMPLES CE505min (%) CE5048h.(%)
Barigui River - UPSTREAM NT IT
Iguassu River UPSTREAM NT NT
P 0 s 1 IT 21,43
P 0 s 2 IT IT
P1 - Barigui River IT 100
P2 - Barigui River NT IT
P3 - Iguassu River NT NT
P4 - Iguassu River NT NT
P5 –-Iguassu River IT IT
P6 - guassu River IT 10,00
P6A - guassu River IT 22,36
P7- - Iguassu River NT 70,71
P8 - - Iguassu River IT < 10,00
P9 - - Iguassu River IT 10,00
Boom
Boom
I
I
NT – non toxic
IT – incipient toxicity
Iguassu River oil spill - July/2000
CONCLUSIONS About the River Sediments UPSTREAM:
- The background levels at the upstream stations from Barigui and Iguassu rivers showed high level of contamination (metals and hydrocarbons);
- Barigui river more contaminated than Iguassu river.
DOWNSTREAM:
- The sites more contaminated (P4 and P5) suggested some oil presence but the biomarkers (terpanes and steranes) analysis showed no matches with
the spilled oil ;
- Literature comparison of PAH in sediments showed similar concentration levels for other Brazilian rivers;
- High level of toxicity was observed to stations situated far from the spill site suggesting other sources of pollutants.

Iguassu River oil spill - July/2000
GENERAL CONCLUSION
About the Rivers
- It was not observed significant contamination in water or
sediments from Barigui and Iguassu rivers after the cleanup
step;
- Same level of hydrocarbon in upstream or dowstream the
accident (exception P4 and P5);
- Literature comparison of Hydrocarbon in sediments showed
similar concentration levels for other Brazilian rivers;
- High level of toxicity was observed to stations situated far
from the spill site suggesting other sources of pollutants.

Iguassu River oil spill - July/2000
P 0 - Terrestrial Area (P0 adj)
Groundwater 90 monitoring wells
(piezometers)
Soil monitoring of approx. 80 sites

Iguassu River oil spill - July/2000
GENERAL CONCLUSIONS
About the terrestrial area
- The more contaminated site was the P0 terrestrial area
(approx. 130,000 m2);
- The TPH, BTEX in groundwater revealed significant
decrease in last campaing (Aug/2001);
- Several recovery and bioremediation methods have
been implemented in this region;
- Long term soil and groundwater monitoring is still
being conducted in this area.