Embed Size (px)
Citation preview

Hydro-JULES
Workpackage 2.
Hydrometeorology
WP leader: Eleanor Blyth
Task leaders: 2.1: Steve Cole, 2.2: Matt Fry,
2.3: Alison Kay and 2.4: Eleanor Blyth

Relations between Climate/Weather and Hydrology
Weather is very variable and affects our
everyday life.
Hydrology has three impacts:
1. In its normal mode, it is implicit in almost
everything: food production, carbon
cycle, snow on the ground, types of food,
water resources
2. In its extremes (flood and drought), it has
a bigger impact than weather
3. Feedback into the weather and climate

Hydrology in the news – always the extremes
Drought in Ethiopia, 2016:
Hydrology affects timing and
drought recovery
Big Question: Are Floods and Droughts ‘business as usual’ for Hydrology?
Oxford flooding
2007. 200 properties affected
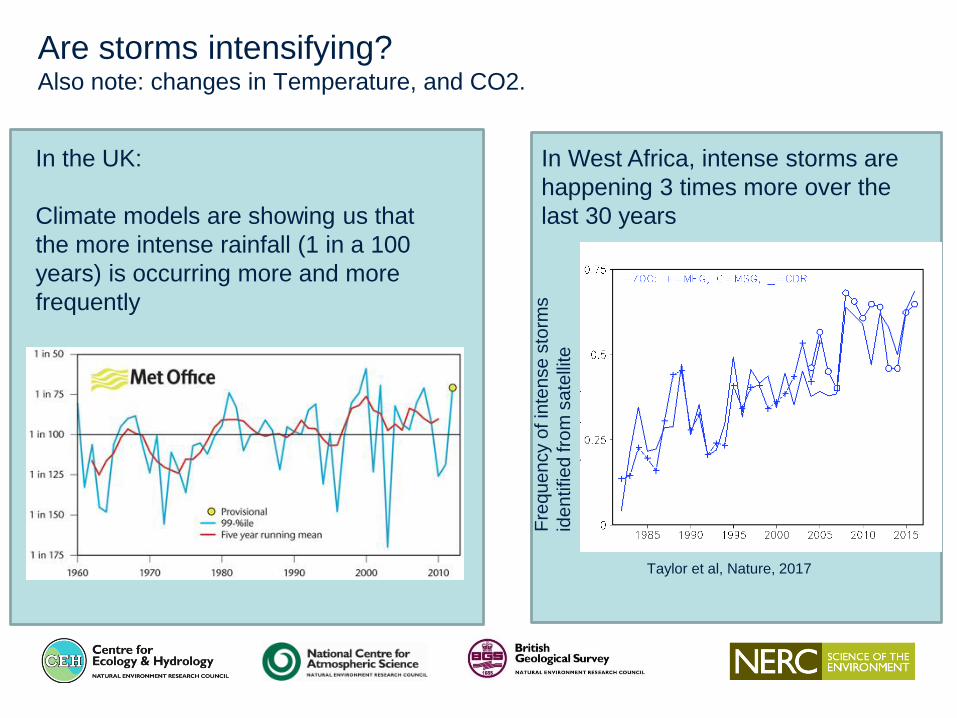
Are storms intensifying? Also note: changes in Temperature, and CO2.
Fre
qu
en
cy o
f in
ten
se
sto
rms
ide
ntifie
d fro
m s
ate
llite
Taylor et al, Nature, 2017
In the UK:
Climate models are showing us that
the more intense rainfall (1 in a 100
years) is occurring more and more
frequently
In West Africa, intense storms are
happening 3 times more over the
last 30 years

Are droughts becoming more frequent or extended?
Prudhomme, C., et al. (2013) Hydrological droughts in the 21st century, hotspots and uncertainties from a global multimodel ensemble experiment. PNAS
FUTURE CLIMATE
• x: proportion of land under ‘drought’ at the same time
• F(x): cumulated time this happened.
For JULES the maximum land extent under drought is 20% (0.2) and is reached under historical climate; for H08 maximum drought extent is ~ 55%
When JULES is run without dynamic CO2, the maximum land area under drought is 40%.

Land-atmosphere coupling strength diagnostic for boreal summer: Koster et al., 2004
Importance of feedbacks in the land-atmosphere system
Made some changed including changes to the
vegetation structure and the way that the water
drains through the soil when it arrives in clumps
rather than spread out.
Result: less frequent triggering of daytime convective
events. Warmer deeper boundary layer, more
prolonged rainfall.
Taylor and Blyth: 2000. JGR. Rainfall controls on evaporation at the regional
scale: an example from the Sahel.
Taylor and Clark: 2001. QJRMS. Diurnal cycle and African easterly waves: a land
surface perspective

Hydrometeorology to the rescue!
Questions being asked in this workpackage
• What are the extremes in precipitation?
• How can we observe them?
• How do changes in extremes affect floods and droughts?
• Does uncertainty in precipitation impact on uncertainty in hydrology?
• What are the feedbacks in the system?
Precipitation – short and long term
Floods and droughts modelling
Transpiration and evaporation

Modelling to deal with future climates
• Rainfall intensity and distribution
• Interception of rainfall WP2
• Evaporation and transpiration
• Snow packs and snow melt
• Runoff generation (saturation vs infiltration excess)
• Soil physics including freezing
• River routing and inundation
• Ground Water

Exploit novel measurement techniques for observing and understanding extreme events
NCAS X-band dual-polarisation radar
- High resolution data (500m)
- Uncertainty estimates
- Hydrometeor classification (rain/snow)
Snowfall/pack observations
- COSMOS-UK (CEH) and Snow Pack Analyser sensors (SEPA) (17/18 winter)
- New Snow Water Equivalent datasets
Datasets available for community use
Task 2.1: Improve understanding of hydro-
meteorological extremes

Demonstrate benefits for hydrological modelling and scalability to national scales
Applications to national C-band weather radar network (with Met Office)
- Merging local X-band with national C-band radar networks
- Wider use of dual-polarisation techniques
Hydrological modelling assessments at local and national scales
- Improve process representation in hydrological models for extremes
- Quantify modelling benefits of new observation sources
Task 2.1: Improve understanding of hydro-
meteorological extremes

Publish UK sub-daily gridded rainfall dataset
- Hourly, 1km gridded data for GB based on full set of raingauges from EA, Met Office, NRW, SEPA
- Incorporate into baseline UK driving dataset, update annually
- Assess benefit and requirements for 15 minute gridded rainfall data
15 minute river flow data for the UK
- Working with the National River Flow Archive and the UK Measuring Authorities / regulators
Enable access to datasets for community use (tools for catchment extraction, etc.)
Task 2.2: Data for current and future scenarios
for flood and drought risk modelling

Assess UKCP18 high resolution RCM outputs for future scenarios
- Enable easier access to UCKP18 data for hydrological modelling
- Easy access to CORDEX (RCM) data
- Produce UKCP18 Potential Evaporation datasets for future scenarios
Task 2.2: Data for current and future scenarios
for flood and drought risk modelling

Task 2.3: Quantify uncertainty in hydrological predictions
Sources of uncertainty in
hydrological modelling include
• driving data (observed or
modelled)
• ancillary data (e.g. soil
datasets)
• model parameters
• model structure
Investigate how these feed
through to simulated river flows
(especially extremes)
Time
Flo
w (
m3s
-1)
Thames @ Kingston
Current
natural
variability
GCM
structure
Future
natural
variability
Downscalin
g
GCM initial
conditions
RCM
structure
Emissions Hydro
model
structure
Hydro
model
parameters
Kay et al. (2009). Climatic Change

Product uncertainty in PRECIPITATION highs Product uncertainty in RUNOFF highs using JULES
0.0 to 4.0
extremes / mo
Product uncertainty in PRECIPITATION lows Product uncertainty in RUNOFF lows using JULES
0.0 to 4.0
extremes / mo
Task 2.3 Focus on
Spatial heterogeneity of rainfall extremes and its impact on extreme hydrology
Analysis of the uncertainty in extreme rainfall from satellite and its impact on
hydrological extremes at the global scale
Legend: number of events PER MONTH where the Satellite data is greater than the
90 or 10% of an agreed standard:

Task 2.4 Canopy processes and
evaporation from multiple sources
How does JULES evaporation perform in the UK?
Mean states are well represented.
Overestimating winter evaporation.
Due to interception and 3-D nature of surface

Task 2.4: Canopy processes and evaporation from
multiple sourcesInterception.
1. Evaporation from the wet canopy occurs at a higher rate than
transpiration. It therefore has a different feedback to rainfall – causing
rainfall recycling in continental systems (e.g. tropical forests)
2. Interception is a rainfall ‘loss’ to the land system
3. Dependent on distribution of rainfall, vegetation structure and
turbulence
Report from UK Forestry commission
based on data from CEH.
Interception as much as 35% of
rainfall

3-D surfaces – how to represent them? (in 2-D)
Energy budgets are more
complex than JULES single-
surface temperatures.
New generation evaporation will
address these issues.

Linked Transpiration and Photosynthesis
In review in Plant Cell and Environment,
Damour et al, 2010 show 35 different models
Links to the JULES community for research:
Soil Moisture Stress
Stomatal Conductance Modelling
Water Use Efficiency
• Prudhomme, C., et al. (2013) Hydrological droughts in the 21st century, hotspots and uncertainties from a global multimodel ensemble experiment. PNAS

Conclusions, links and further work
WP2 links to WP3 and WP4
which will be working on the
modelling of Soil Physics,
Runoff generation, inundation
and routing, groundwater
dynamics
In addition, links to the JULES
community:
- soil moisture stress
- stomatal conductance models
- water use efficiency.