Embed Size (px)
Citation preview
Summary of EC Prediction System
A PietroniroA. PietroniroA/Director Water SurveyHydrometeorology and Arctic Lab, Environment Canada, NHRC
Monitoring, Prediction and ForecastingMonitoring, Prediction and Forecasting
• Hydrological processes are highly variable in space and time y g p g y pat all scales from centimeters to continents.
– Data collection over such a range is difficult and expensive– Hydrological prediction fills the gapy g p g p
▪ Based on simple and homogenous models of nature▪ Range from deterministic to statistical/stochastic methods▪ Results are fair to good in well behaved basins▪ Scaling, pathways, dynamics, energy balance … still to be
resolved
• Significant advances are still made through observations– Environment Canada – Schisms between data collection and
hydrological science– In the excitement of “glamorous science” the scientific community
ft l t d t ll ti doften lets data collection programs erode– All models are wrong some are useful
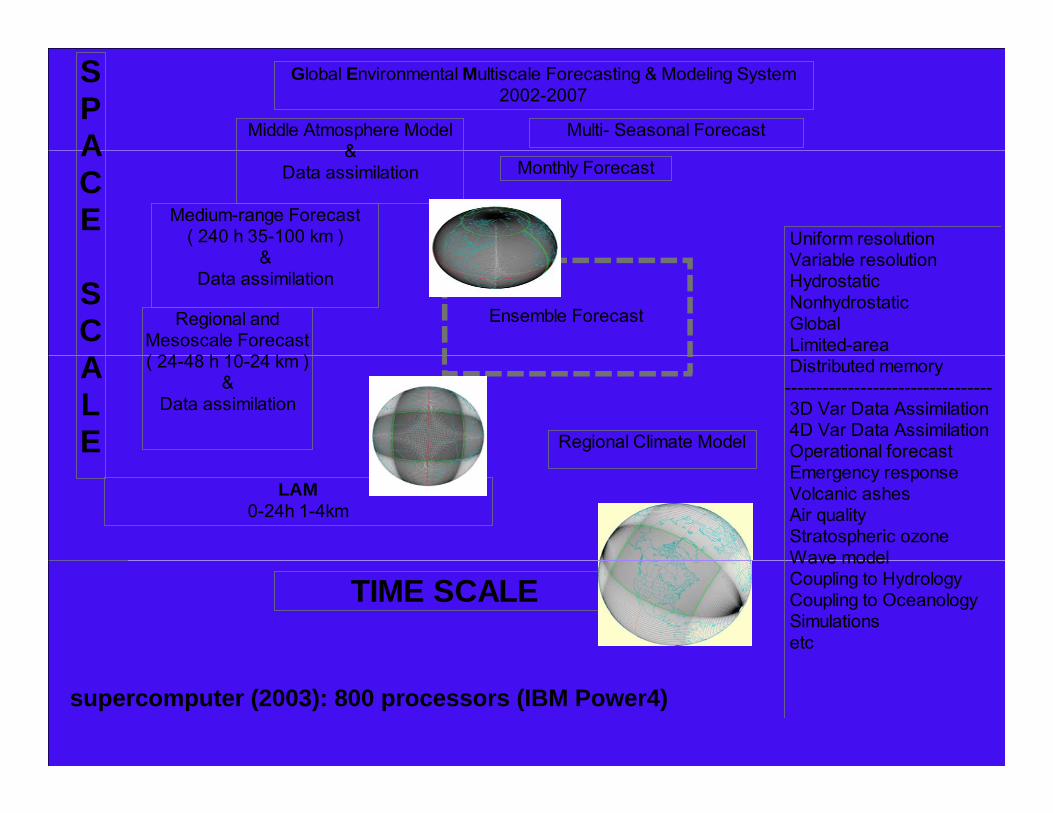
Global Environmental Multiscale Forecasting & Modeling System2002-2007
Middle Atmosphere Model&
Multi- Seasonal Forecast
SPA
Medium-range Forecast( 240 h 35-100 km )
&
&Data assimilation Monthly Forecast
Uniform resolutionV i bl l i
ACE
Regional andMesoscale Forecast( 24 48 h 10 24 k )
&Data assimilation
Ensemble Forecast
Variable resolution Hydrostatic Nonhydrostatic Global Limited-area
SC
( 24-48 h 10-24 km )&
Data assimilation
Regional Climate Model
Distributed memory--------------------------------- 3D Var Data Assimilation 4D Var Data AssimilationOperational forecast
ALE
LAM0-24h 1-4km
p Emergency response Volcanic ashes Air quality Stratospheric ozoneWave modelWave model Coupling to Hydrology Coupling to Oceanology Simulations etc
TIME SCALE
supercomputer (2003): 800 processors (IBM Power4)
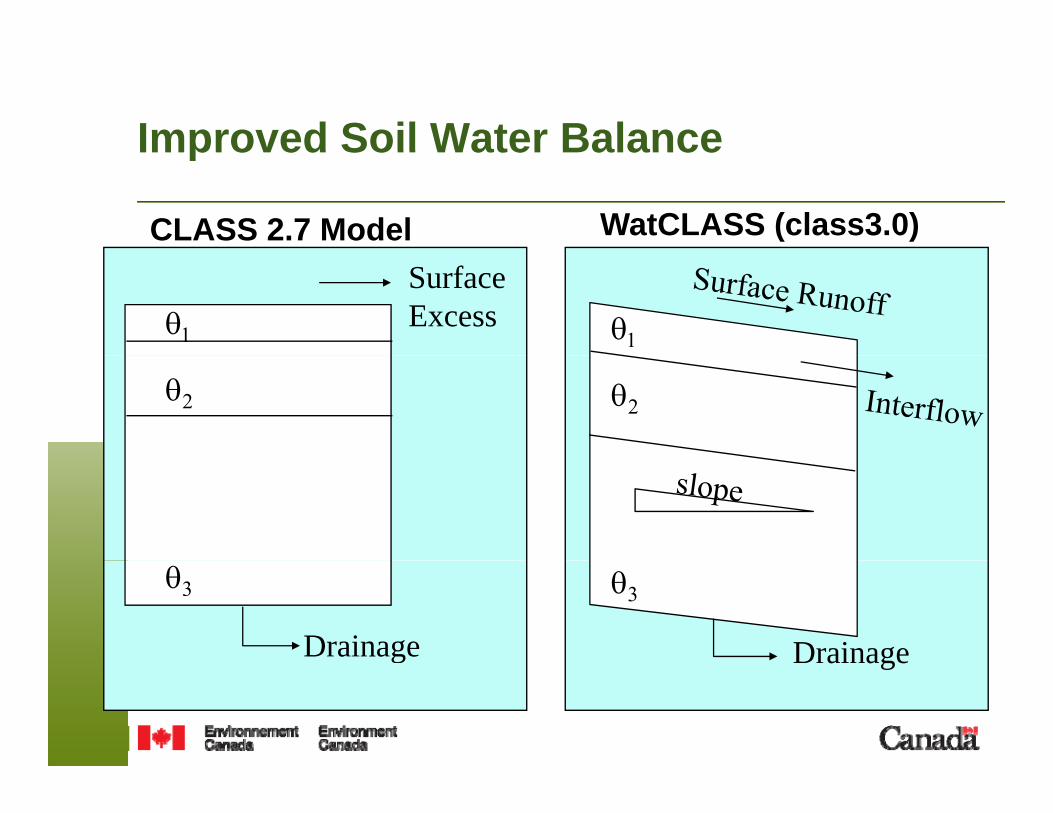
Improved Soil Water BalanceImproved Soil Water Balance
CLASS 2.7 Model WatCLASS (class3.0)
θ1
SurfaceExcess θ1
θ2 θ2
θ3
Drainage
θ3
Drainageg a age
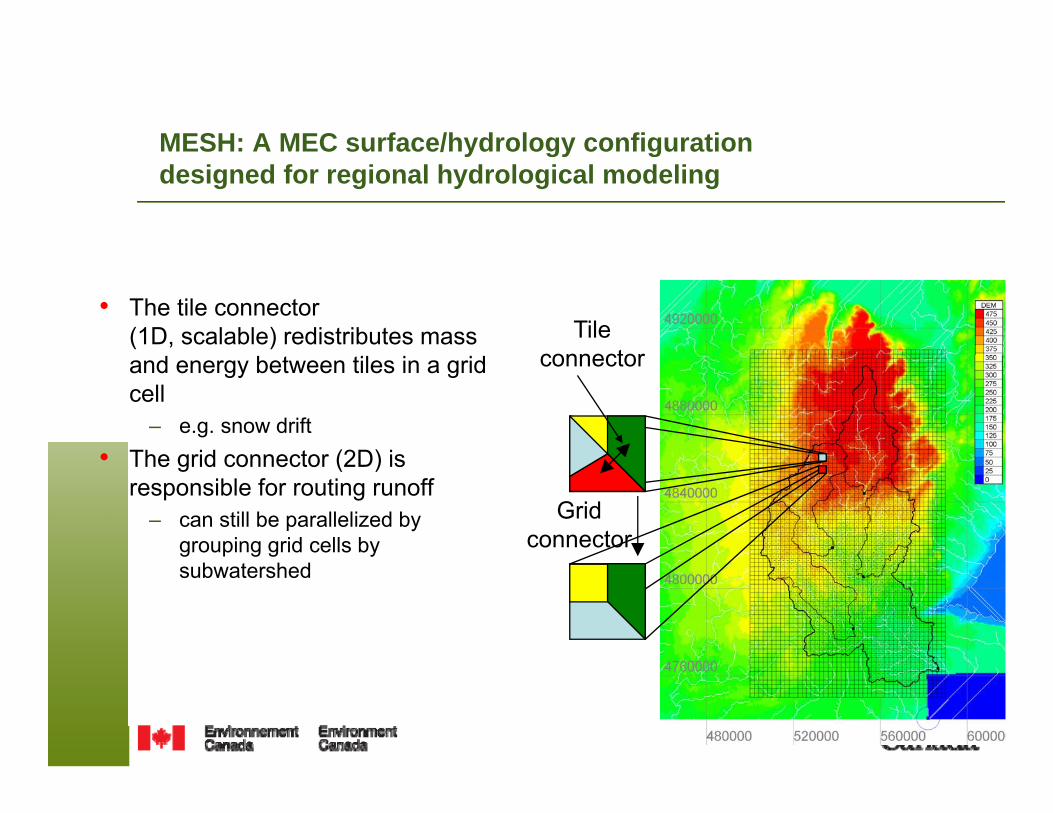
MESH: A MEC surface/hydrology configurationMESH: A MEC surface/hydrology configuration designed for regional hydrological modeling
• The tile connector(1D, scalable) redistributes mass Tile
connectorand energy between tiles in a grid cell
– e.g. snow drift• The grid connector (2D) is
connector
• The grid connector (2D) is responsible for routing runoff
– can still be parallelized by grouping grid cells by
Gridconnector
subwatershed

Hydrological Prediction FrameworkHydrological Prediction Framework
Upper airGEM atmospheric
Upper airobservations 4DVar model with
ISBA landsurface schemePrecipitation (forecasted)
E t i ti
Hydrological model
Evapotranspiration Snow water equivalentSoil moisture
Surfaceobservations
y gwith its own LSS
(e.g. WATFLOOD)
Precipitation (interpolated)Evapotranspiration Snow water equivalentSoil moisture
Who do you believe?Soil moistureStreamflow

Environmental Prediction Framework
Upper airobservations
GEM atmosphericmodel
4DVardata assimilation
“On-line”mode
“Off-line”mode
“On-line”mode
“Off-line”mode
CaPA:Canadian
precipitation
Surface scheme(CLASS or ISBA)
mode modemode mode
Surfaceobservations
C LDAS
p panalysis
( )and routing modelCaLDAS:
Canadianland data
assimilation
MESHModélisation environnementale
communautaire (MEC)ass at o communautaire (MEC)de la surface et de l’hydrologie
Spatially and physically coherent estimates of:- Precipitation
E i i- Evapotranspiration- Snow water equivalent- Soil moisture- Streamflow
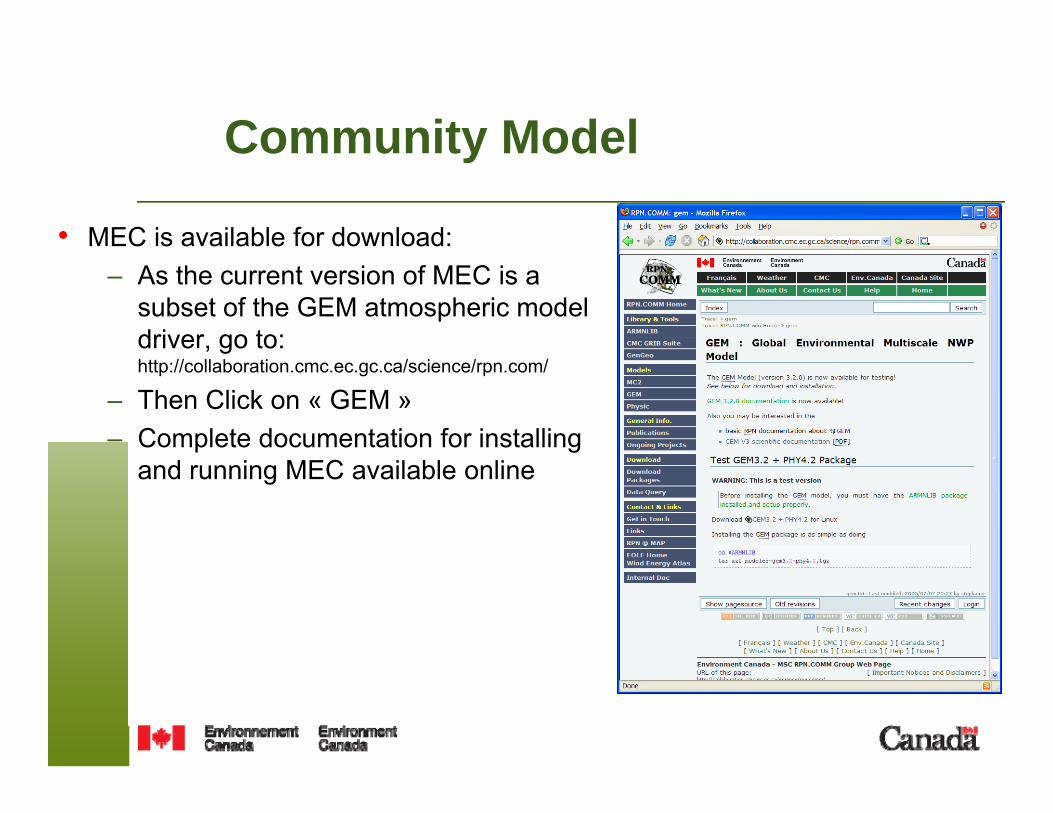
Community ModelCommunity Model
• MEC is available for download:– As the current version of MEC is a
subset of the GEM atmospheric model driver, go to: http://collaboration.cmc.ec.gc.ca/science/rpn.com/
– Then Click on « GEM »– Complete documentation for installing
and running MEC available online
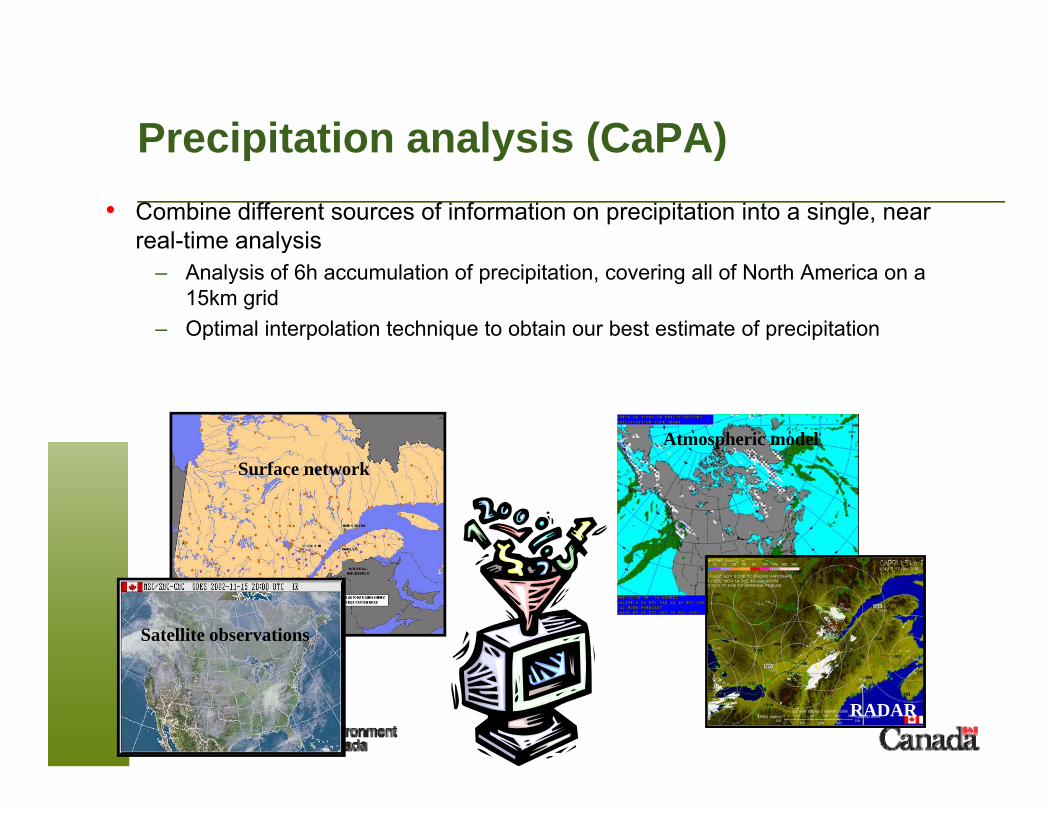
Precipitation analysis (CaPA)Precipitation analysis (CaPA)• Combine different sources of information on precipitation into a single, near
real-time analysisy– Analysis of 6h accumulation of precipitation, covering all of North America on a
15km grid– Optimal interpolation technique to obtain our best estimate of precipitation
Atmospheric modelSurface network
Satellite observations
RADAR
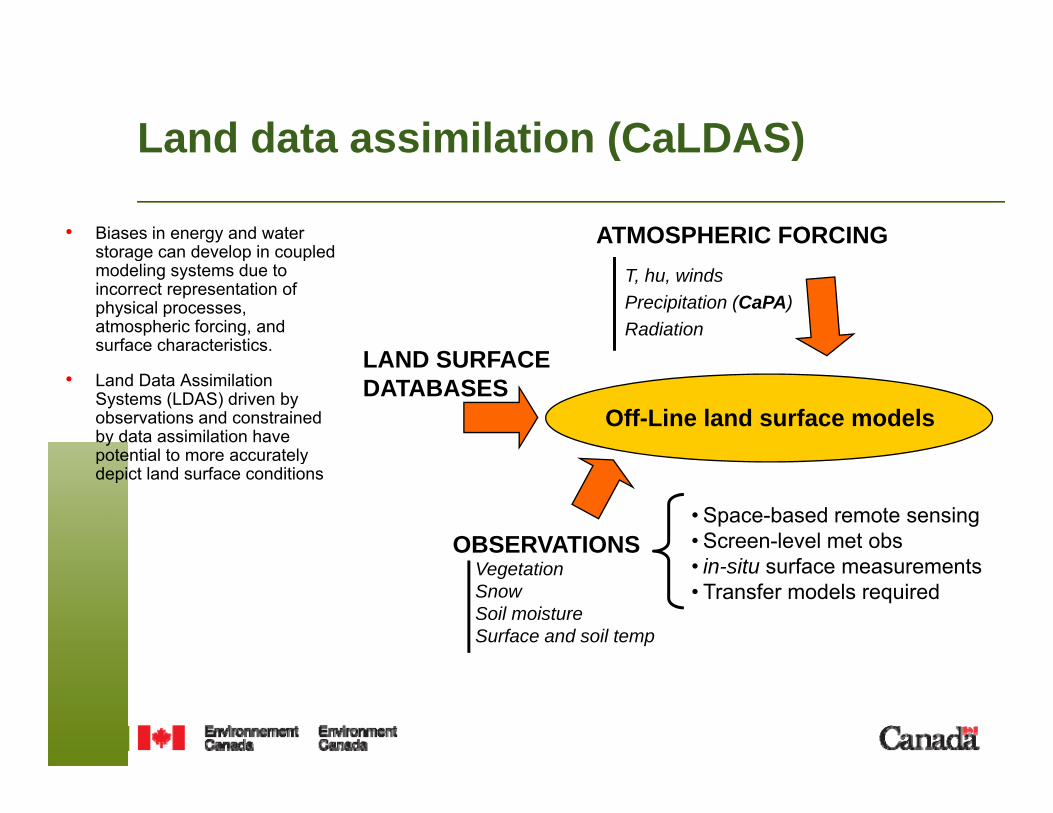
Land data assimilation (CaLDAS)Land data assimilation (CaLDAS)
• Biases in energy and water storage can develop in coupled
ATMOSPHERIC FORCINGstorage can develop in coupled modeling systems due to incorrect representation of physical processes, atmospheric forcing, and surface characteristics.
LAND SURFACE
T, hu, windsPrecipitation (CaPA)Radiation
• Land Data Assimilation Systems (LDAS) driven by observations and constrained by data assimilation have potential to more accurately
Off-Line land surface models
LAND SURFACEDATABASES
potential to more accurately depict land surface conditions
OBSERVATIONS• Space-based remote sensing• Screen-level met obsi it f t• in-situ surface measurements
• Transfer models requiredVegetationSnowSoil moistureSurface and soil temp
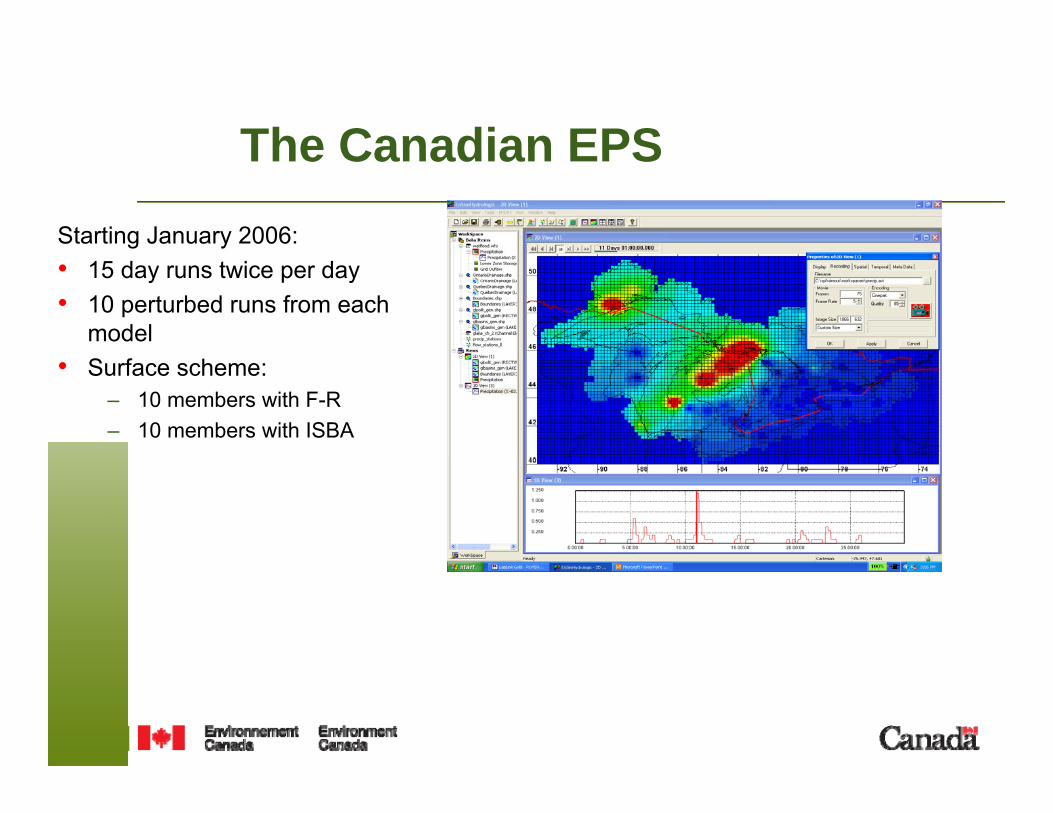
The Canadian EPSThe Canadian EPSStarting January 2006:• 15 day runs twice per day• 10 perturbed runs from each
model• Surface scheme:
– 10 members with F-R– 10 members with ISBA

Collaborative Studies
• Research – MESH testingResearch MESH testing– Canada DRI – Drought Research Initiative– IP3 – Process parameterization and Predictions –p– IPY– Great Lakes Ensemble Modelling– Climate Change Assessments – SSRB
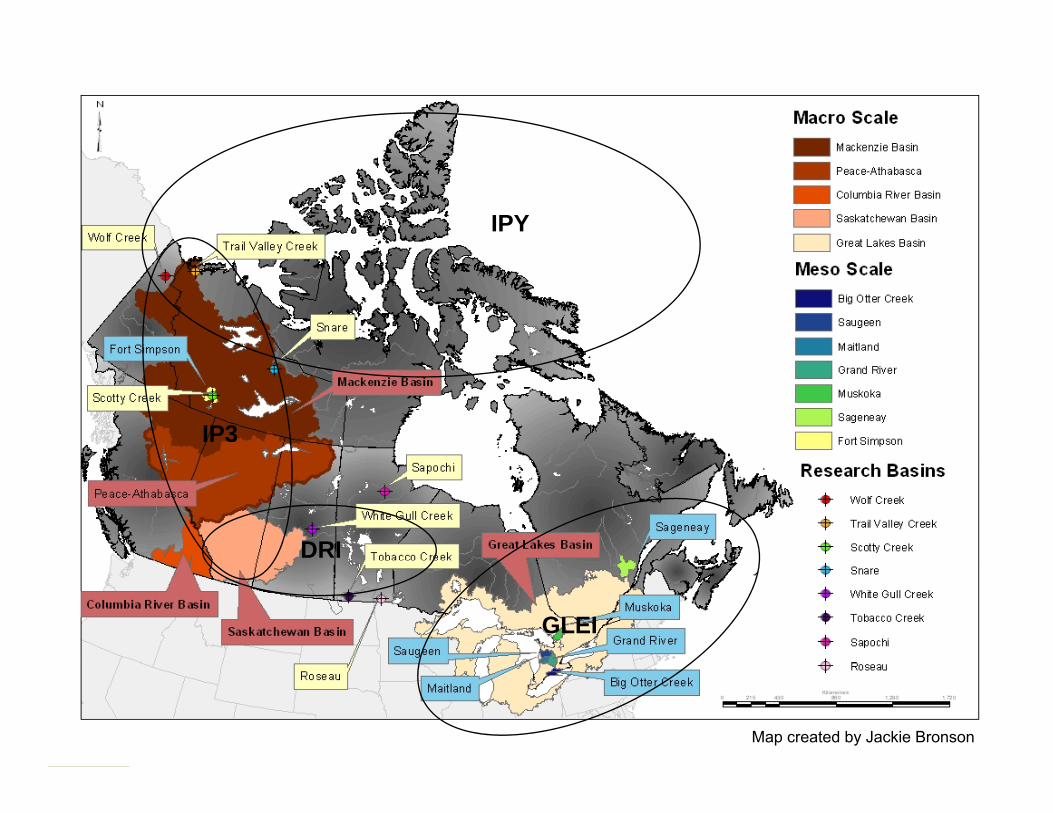
IPY
IP3
DRI
GLEI
Map created by Jackie Bronson
Glacier contribution to flow – IP3Glacier contribution to flow IP3

South Saskatchewan basinSouth Saskatchewan basin
North Saskatchewan basin
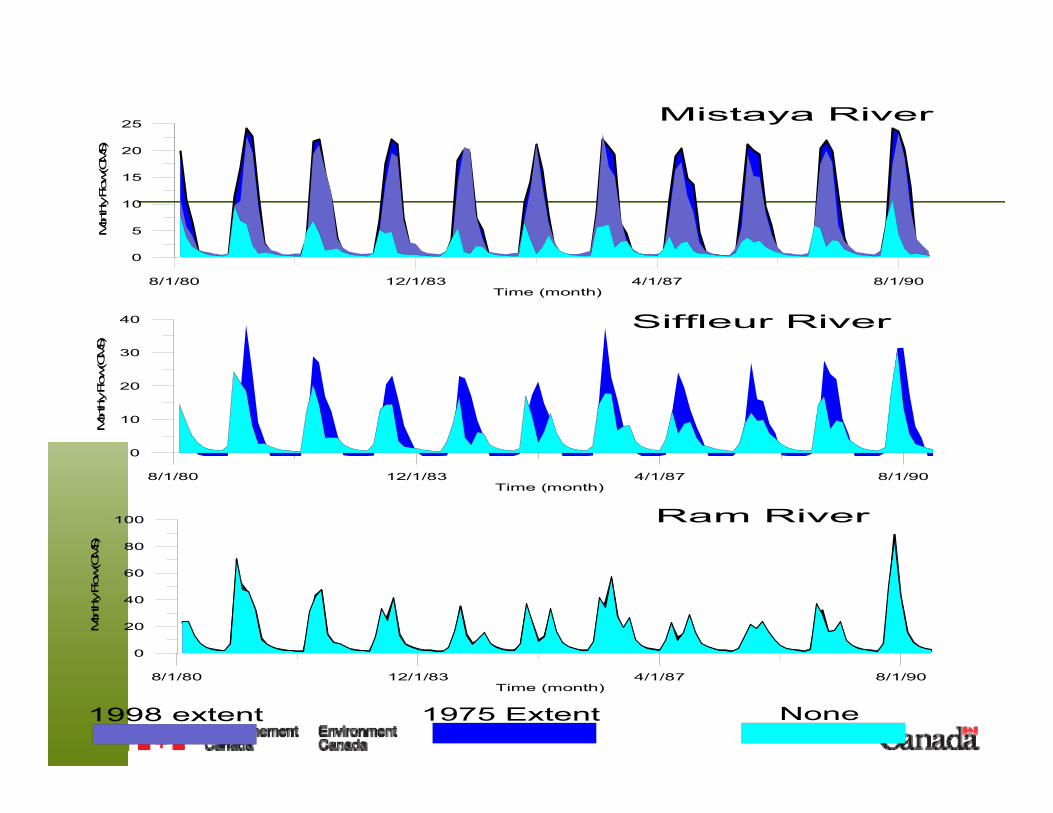
20
25
MS)Mistaya River
5
10
15
20
Mon
thly Flow (C
MS
8/1/80 12/1/83 4/1/87 8/1/90Time (month)
0
30
40
CMS)
Siffleur River
0
10
20
30
Mon
thly Flow (C
M
8/1/80 12/1/83 4/1/87 8/1/90Time (month)
80
100
CMS)
Ram River
0
20
40
60
Mon
thly Flow (C
8/1/80 12/1/83 4/1/87 8/1/90Time (month)
1975 Extent1998 extent None
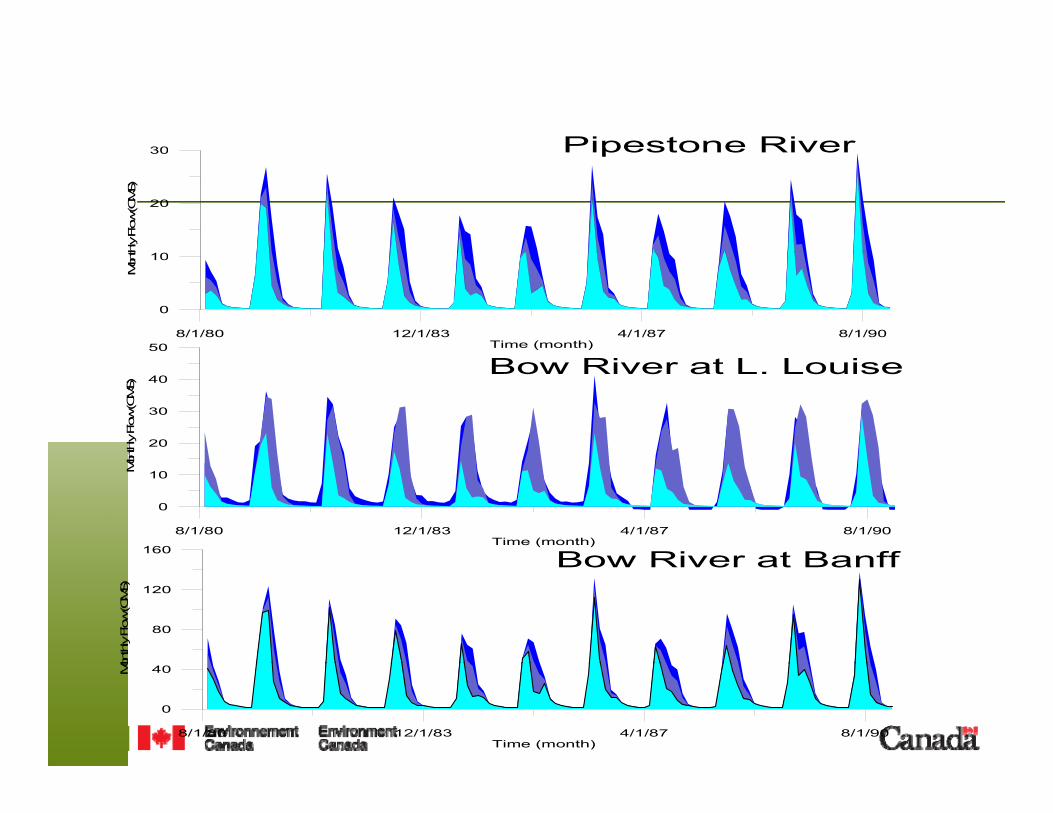
30 Pipestone River
10
20
30
thly Flow (C
MS)
Pipestone River
8/1/80 12/1/83 4/1/87 8/1/90Time (month)
0
10
Mon
t
50
20
30
40
onthly Flow (C
MS)
Bow River at L. Louise
8/1/80 12/1/83 4/1/87 8/1/90Time (month)
0
10Mo
160 Bow River at Banff
80
120
Mon
thly Flow (C
MS)
Bow River at Banff
8/1/80 12/1/83 4/1/87 8/1/90Time (month)
0
40Mo
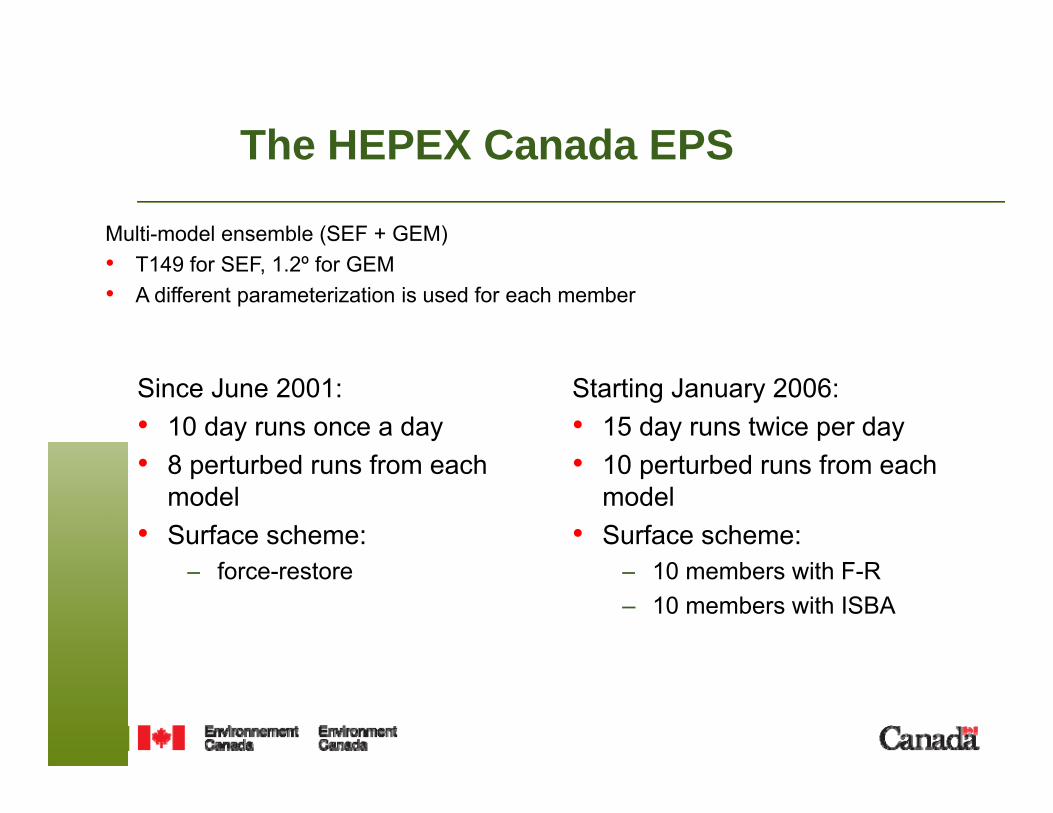
The HEPEX Canada EPSThe HEPEX Canada EPS
Multi-model ensemble (SEF + GEM)• T149 for SEF, 1.2º for GEM• A different parameterization is used for each member
Since June 2001:• 10 day runs once a day
8 t b d f h
Starting January 2006:• 15 day runs twice per day
10 t b d f h• 8 perturbed runs from each model
• Surface scheme:
• 10 perturbed runs from each model
• Surface scheme:– force-restore – 10 members with F-R
– 10 members with ISBA
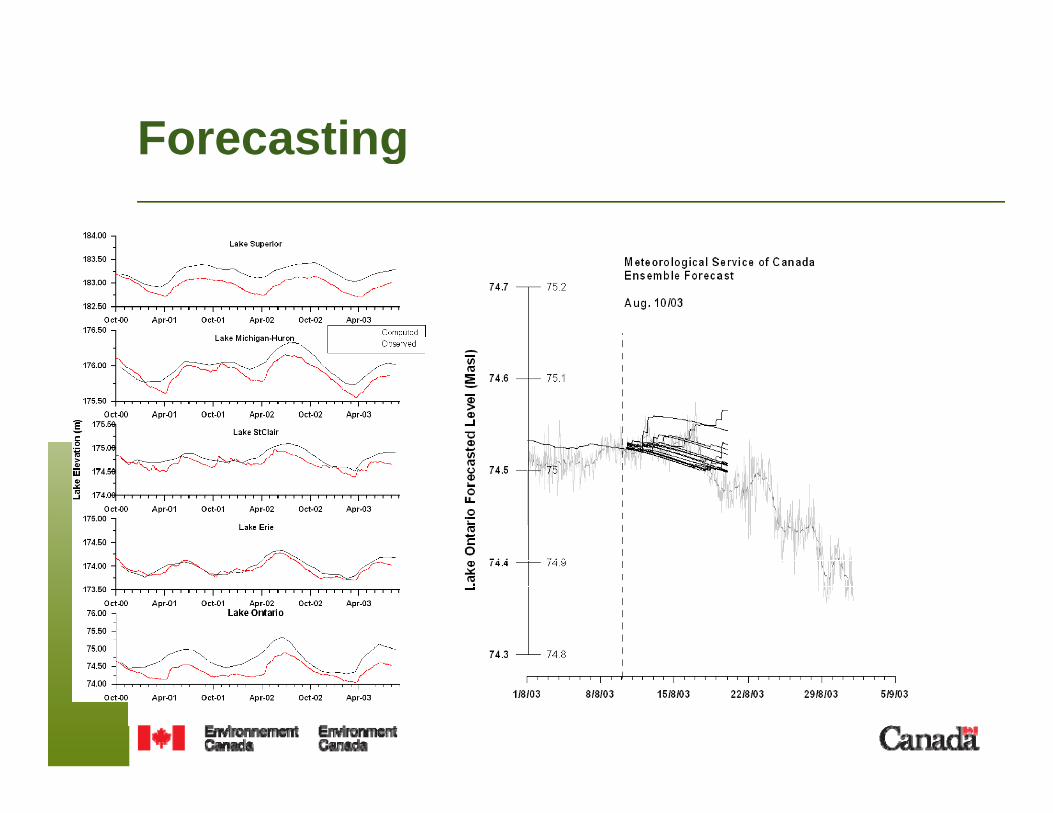
ForecastingForecasting
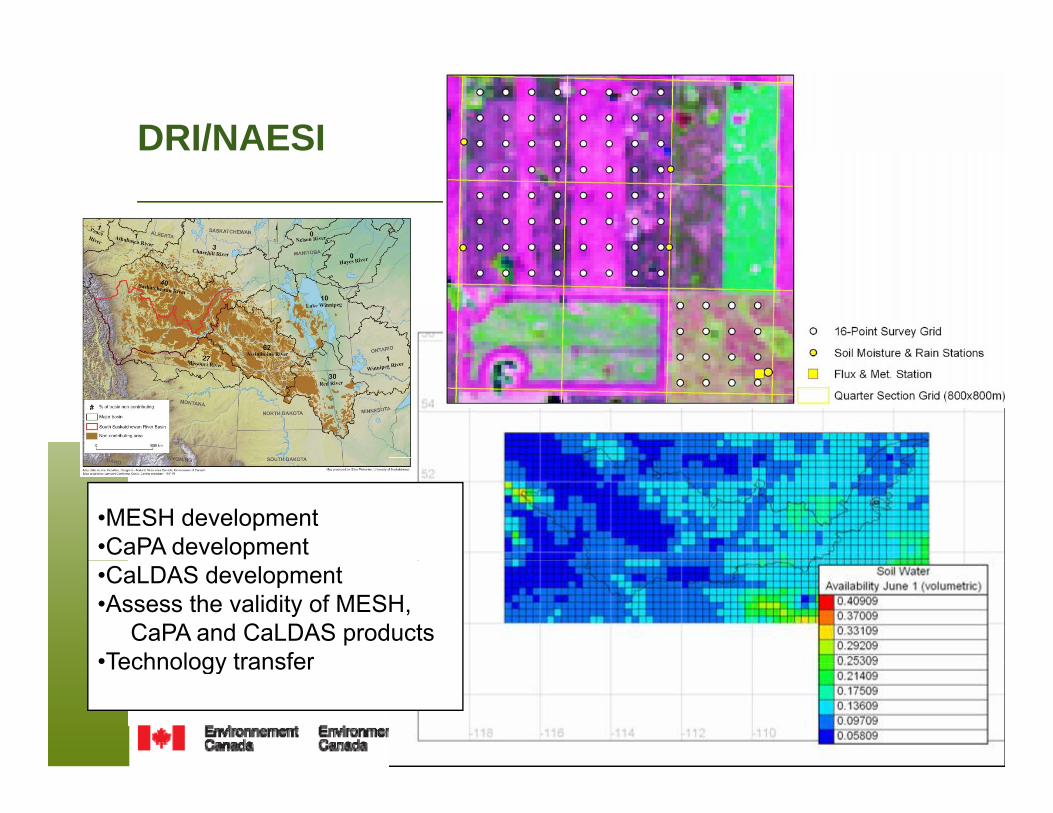
DRI/NAESI/ S
•MESH development•CaPA development•CaLDAS development•Assess the validity of MESH,
CaPA and CaLDAS products•Technology transfer•Technology transfer

Two nested modelling domainsTwo nested modelling domainsSSRBxOrigin -117.0000
Brightwater CreekxOrigin -106.6836g
yOrigin 48.0000
xCount 60yCount 27xDelta 0 2º
gyOrigin 51.199xCount 54 yCount 52 xDelta 800 m yDelta 800 mxDelta 0.2º
yDelta 0.2ºyDelta 800 m

Stand alone MESHStand alone MESH• MESH model physics (CLASS LSS)
with added routing based on Watroute– with added routing based on Watroute• Forcing with met tower data
– Temp, precip, station pressure, specific humidty, wind, lw and sw radiation
• May 15 to November, 2007, half hourlyy y
Soil Temperature - Layer 1 - Kenaston area - Soil Moisture - Kenaston area - Flux tower site [Fraction]Flux Tower site ( °C)
25
30
35
SIM OBS [5cm]
0.3
0.35
0.4
0.45
5
10
15
20
0.15
0.2
0.25
-5
0
15-May-07 15-Jun-07 15-Jul-07 15-Aug-07 15-Sep-07 15-Oct-07 0
0.05
0.1
15-May-07 15-Jun-07 15-Jul-07 15-Aug-07 15-Sep-07 15-Oct-07
SIMOBS [5cm]
Summary and future considerationsSummary and future considerations
• Stand alone MESH demonstrates that it is possible to reasonably replicate some water availability parameters.availability parameters.
• CaPa show some benefits to precipitation re-analysis. Will be operation this year.• A first version of CalDAS has been tested with ISBA.
– Future versions will▪ Assimilate soil moisture directly (if avaialbel)▪ Will be based on CLASS▪ Will be based on CLASS
MEC system is moving towards the same internal representation of the behavior of the stand-alone MESH and has the added benefit of the use of land surface data assimilation
• The goal is to provide calibration and verification from MEC and MESH and evaluate the system in an operation mode.
Further evaluation over the next 2 years– Further evaluation over the next 2 years.– Parameterizations and other changes to stand-alone MESH will be incorporated into the
operational model.• 10 Day forecasts
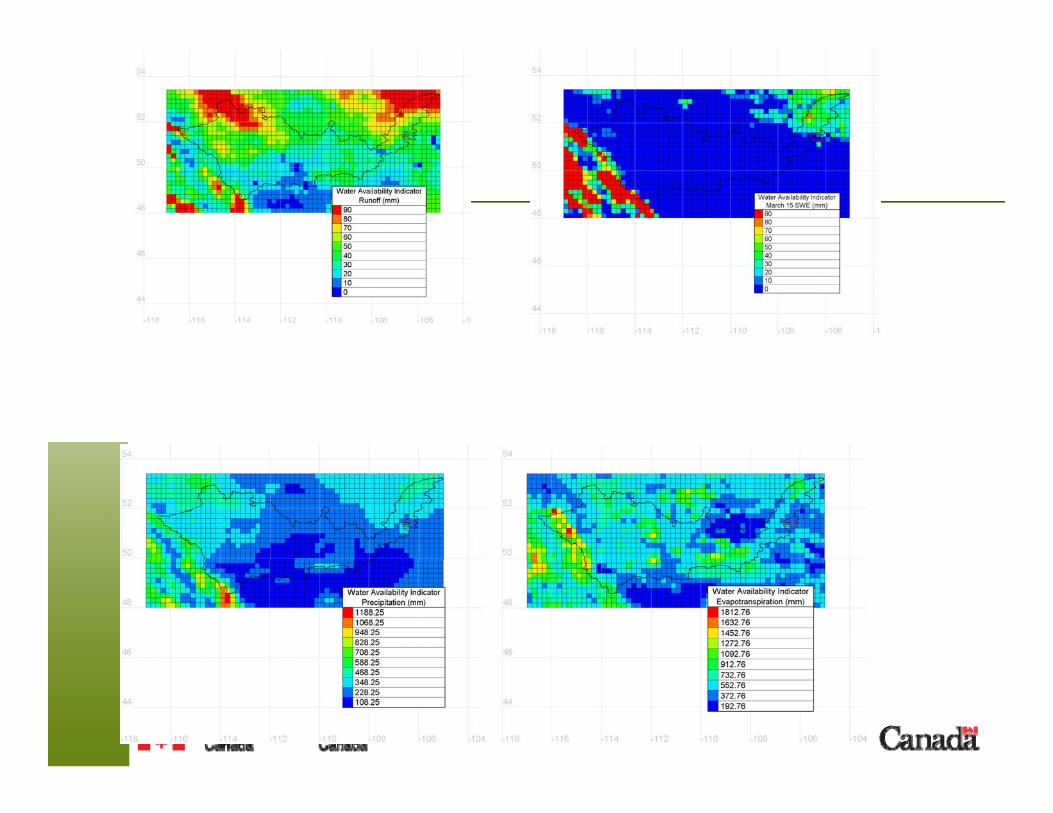
– MEC/MESH can already provide 10 forecasts using deterministic and ensembles forecastsAll water vaiability indicators could be forecasted– All water vaiability indicators could be forecasted
– Could be very useful for irrigation scheduling• Seasonal Forecast
– MEC/MESH will be incorporated into the Canadian Forecasting system • Climate change
– Force MESH standalone with RCM output– Run MEC in Climate Mode