Embed Size (px)
Citation preview

Hydration Technology Innovations
Presentation to Coconino Plateau Technical Advisory Committee
January 29th, 2015
www.htiwater.com
2
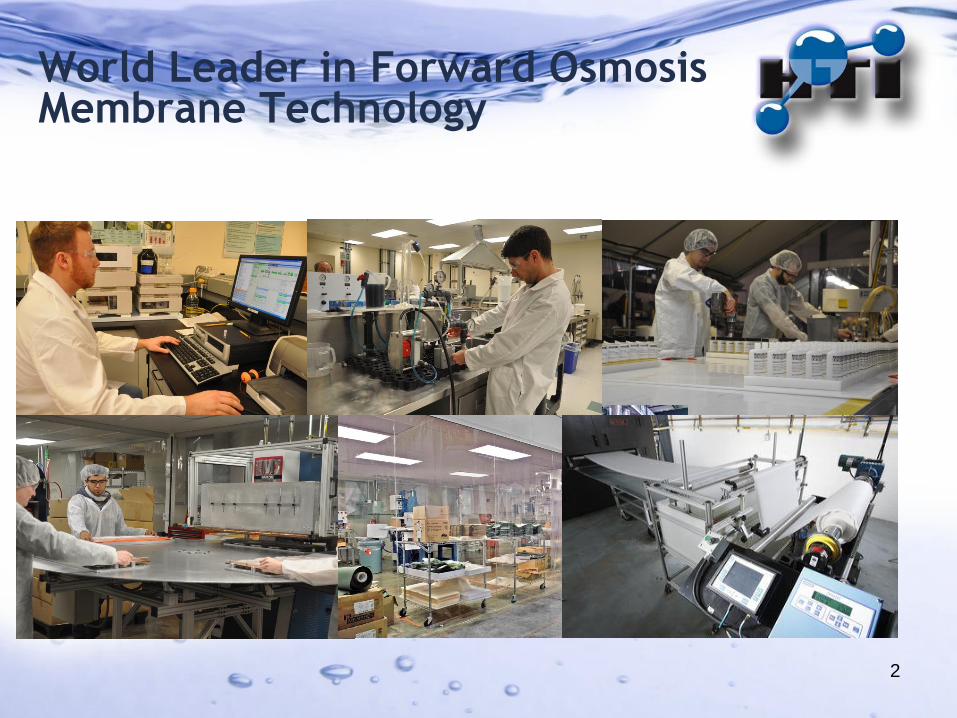
World Leader in Forward Osmosis Membrane Technology
HTI Background
• Corporate Headquarters – Scottsdale AZ
• Engineering and Manufacturing - Albany OR
• R&D - Corvallis OR
• Established 1990
• 50 plus employees including 5 PhD’s and 12 engineering / scientific technical staff
• Over 20 patents
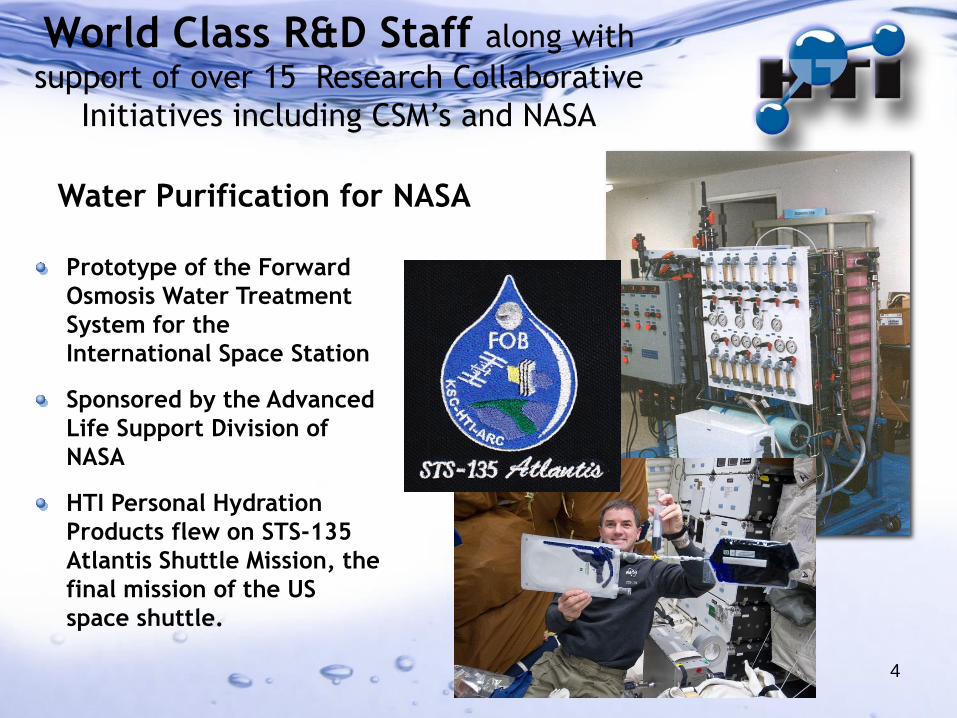
Water Purification for NASA
World Class R&D Staff along with
support of over 15 Research Collaborative
Initiatives including CSM’s and NASA
Prototype of the Forward
Osmosis Water Treatment
System for the
International Space Station
Sponsored by the Advanced
Life Support Division of
NASA
HTI Personal Hydration
Products flew on STS-135
Atlantis Shuttle Mission, the
final mission of the US
space shuttle.
4
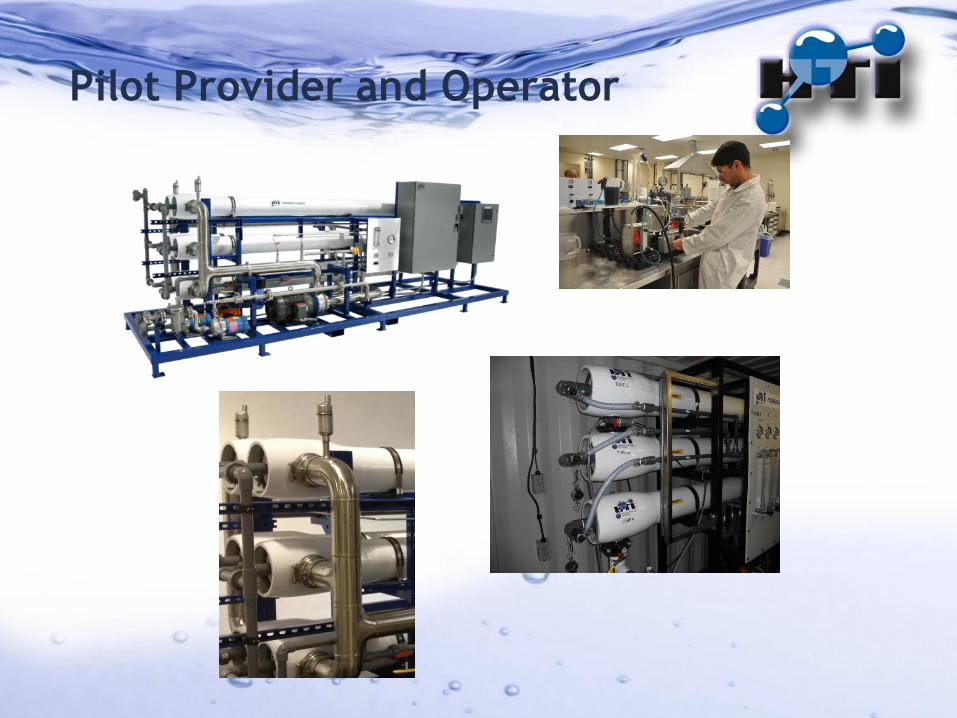
Pilot Provider and Operator
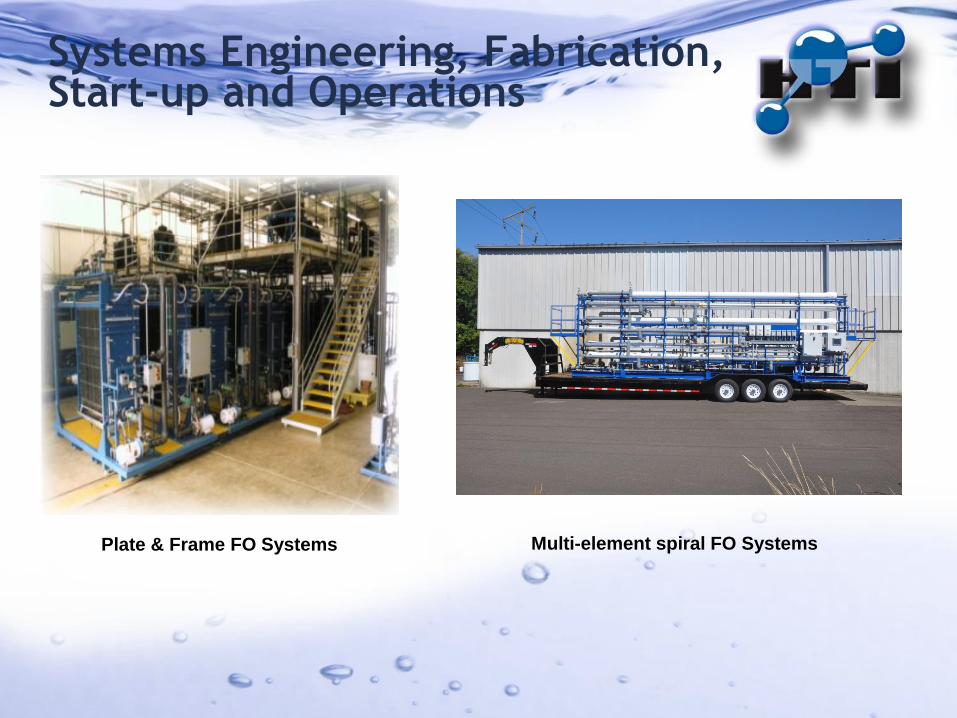
Systems Engineering, Fabrication, Start-up and Operations
Plate & Frame FO Systems Multi-element spiral FO Systems
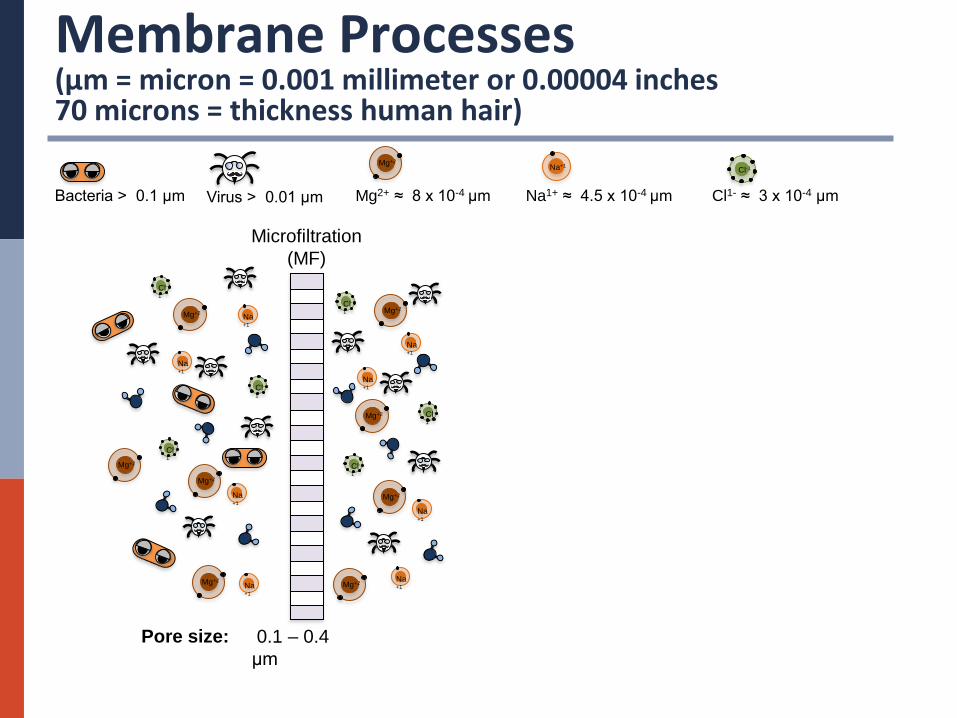
Membrane Processes (μm = micron = 0.001 millimeter or 0.00004 inches 70 microns = thickness human hair)
Na+1 Cl-1 Mg+2
Bacteria > 0.1 μm Virus > 0.01 μm Mg2+ ≈ 8 x 10⁻⁴ μm Cl1- ≈ 3 x 10⁻⁴ μm Na1+ ≈ 4.5 x 10⁻⁴ μm
Microfiltration
(MF)
Mg+2
Mg+2
Mg+2
Mg+2
Na+1
Cl-
1
Cl-
1
Mg+2
Mg+2
Mg+2
Mg+2
Na+1
Cl-
1
Na+1
Na+1
Cl-
1
Cl-
1
Na+1
Pore size: 0.1 – 0.4
μm
Na+1
Na+1
Cl-
1
Na+1
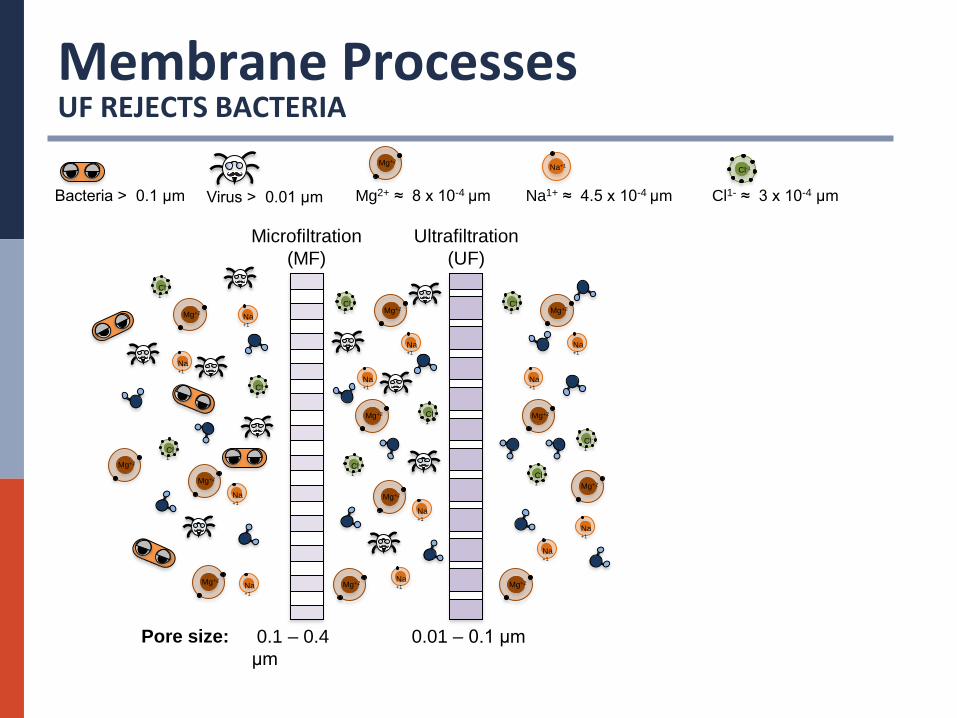
Membrane Processes UF REJECTS BACTERIA
Na+1 Cl-1 Mg+2
Bacteria > 0.1 μm Virus > 0.01 μm Mg2+ ≈ 8 x 10⁻⁴ μm Cl1- ≈ 3 x 10⁻⁴ μm Na1+ ≈ 4.5 x 10⁻⁴ μm
Microfiltration
(MF)
Ultrafiltration
(UF)
Mg+2
Mg+2
Mg+2
Mg+2
Na+1
Cl-
1
Na+1
Na+1
Cl-
1
Cl-
1
Na+1
Mg+2
Mg+2
Mg+2
Mg+2
Na+1
Cl-
1
Na+1
Na+1
Cl-
1
Cl-
1
Na+1
Mg+2
Mg+2
Mg+2
Mg+2
Na+1
Cl-
1
Na+1
Na+1
Cl-
1
Cl-
1
Na+1
Pore size: 0.1 – 0.4
μm
0.01 – 0.1 μm
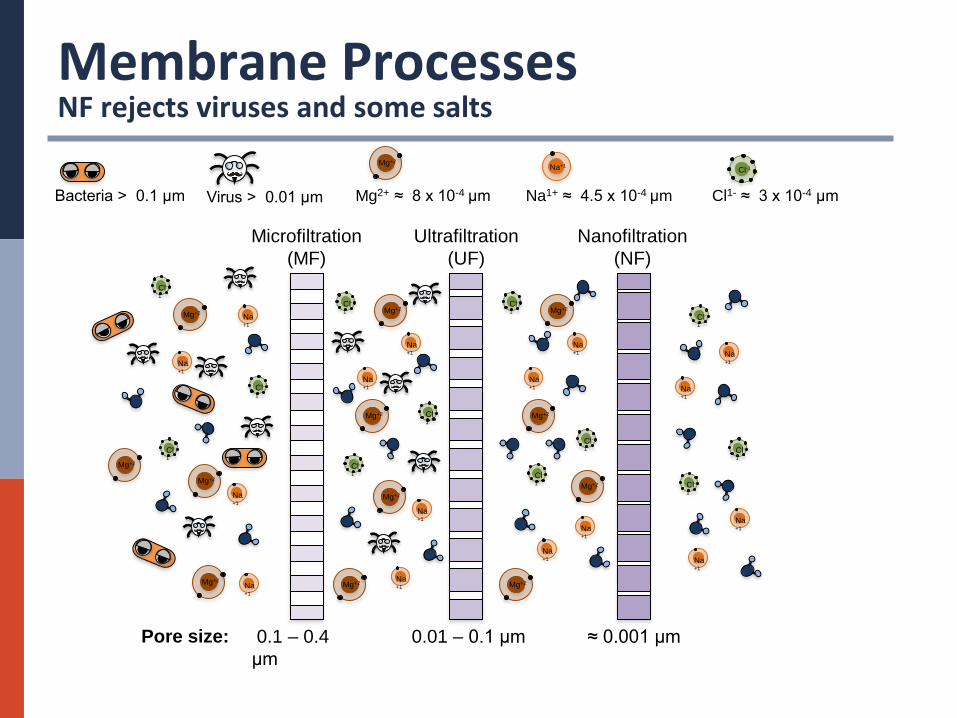
Membrane Processes NF rejects viruses and some salts
Pore size:
Na+1 Cl-1
Na+1
Cl-
1
Mg+2
Bacteria > 0.1 μm Virus > 0.01 μm Mg2+ ≈ 8 x 10⁻⁴ μm Cl1- ≈ 3 x 10⁻⁴ μm Na1+ ≈ 4.5 x 10⁻⁴ μm
Microfiltration
(MF)
Ultrafiltration
(UF)
Nanofiltration
(NF)
Na+1
Na+1
Cl-
1
Cl-
1
Mg+2
Mg+2
Mg+2
Mg+2
Na+1
Na+1
Cl-
1
Na+1
Cl-
1
Cl-
1
Na+1
Mg+2
Mg+2
Mg+2
Mg+2
Na+1
Cl-
1
Na+1
Na+1
Cl-
1
Cl-
1
Na+1
Mg+2
Mg+2
Mg+2
Mg+2
Na+1
Cl-
1
Na+1
Na+1
Cl-
1
Cl-
1
Na+1
Na+1
0.1 – 0.4
μm
0.01 – 0.1 μm ≈ 0.001 μm
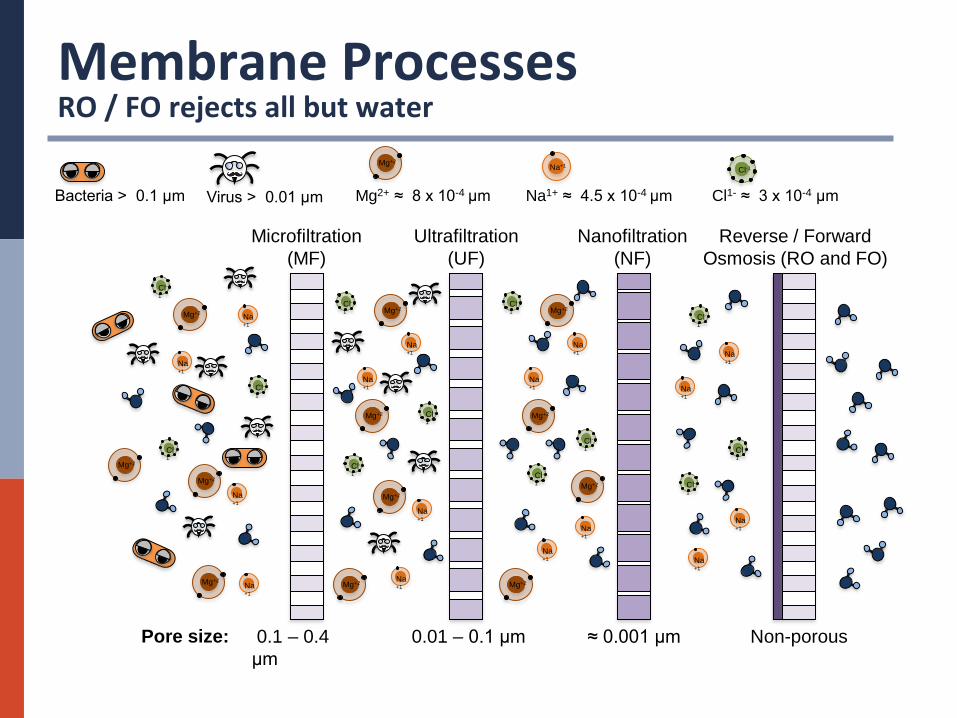
Membrane Processes RO / FO rejects all but water
Na+1 Cl-1
Na+1
Cl-
1
Mg+2
Bacteria > 0.1 μm Virus > 0.01 μm Mg2+ ≈ 8 x 10⁻⁴ μm Cl1- ≈ 3 x 10⁻⁴ μm Na1+ ≈ 4.5 x 10⁻⁴ μm
Microfiltration
(MF)
0.1 – 0.4
μm
Ultrafiltration
(UF)
0.01 – 0.1 μm
Nanofiltration
(NF)
Reverse / Forward
Osmosis (RO and FO)
Non-porous
Na+1
Na+1
Cl-
1
Cl-
1
Mg+2
Mg+2
Mg+2
Mg+2
Na+1
Na+1
Cl-
1
Na+1
Cl-
1
Cl-
1
Na+1
Mg+2
Mg+2
Mg+2
Mg+2
Na+1
Cl-
1
Na+1
Na+1
Cl-
1
Cl-
1
Na+1
Mg+2
Mg+2
Mg+2
Mg+2
Na+1
Cl-
1
Na+1
Na+1
Cl-
1
Cl-
1
Na+1
Na+1
Pore size: ≈ 0.001 μm
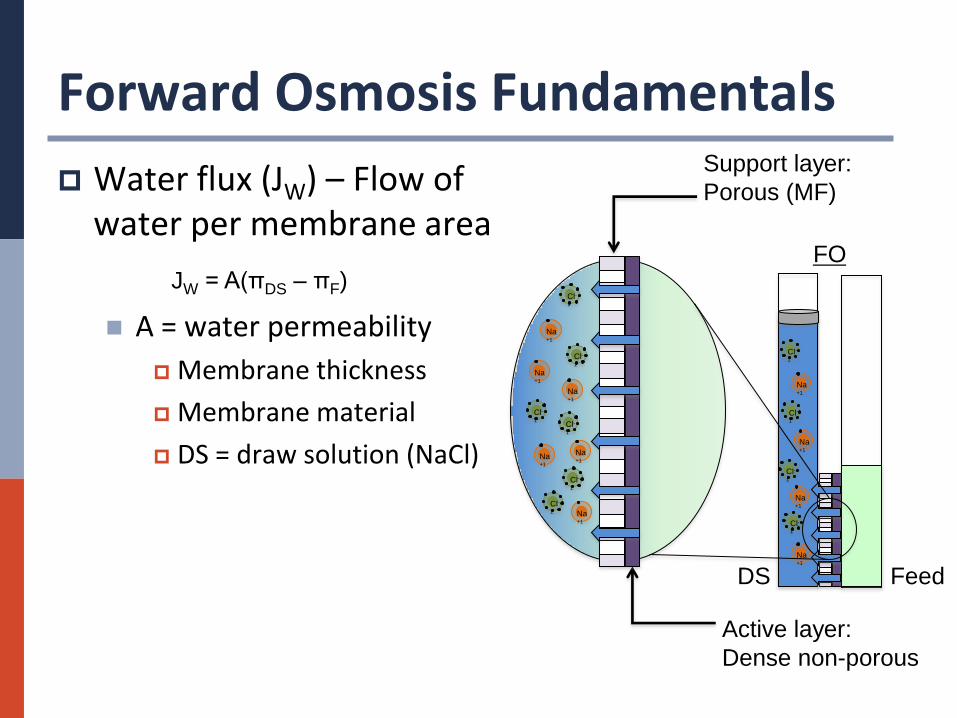
Forward Osmosis Fundamentals
FO
Cl-
1
Na+1
Cl-
1
Na+1
Na+1
Cl-
1
Cl-
1
Na+1
DS Feed
Cl-
1
Na+1
Cl-
1 Na+1
Na+1
Cl-
1
Cl-
1
Na+1
Na+1
Cl-
1
Na+1
Cl-
1
Active layer:
Dense non-porous
Support layer:
Porous (MF) Water flux (JW) – Flow of water per membrane area
A = water permeability
Membrane thickness
Membrane material
DS = draw solution (NaCl)
JW = A(πDS – πF)
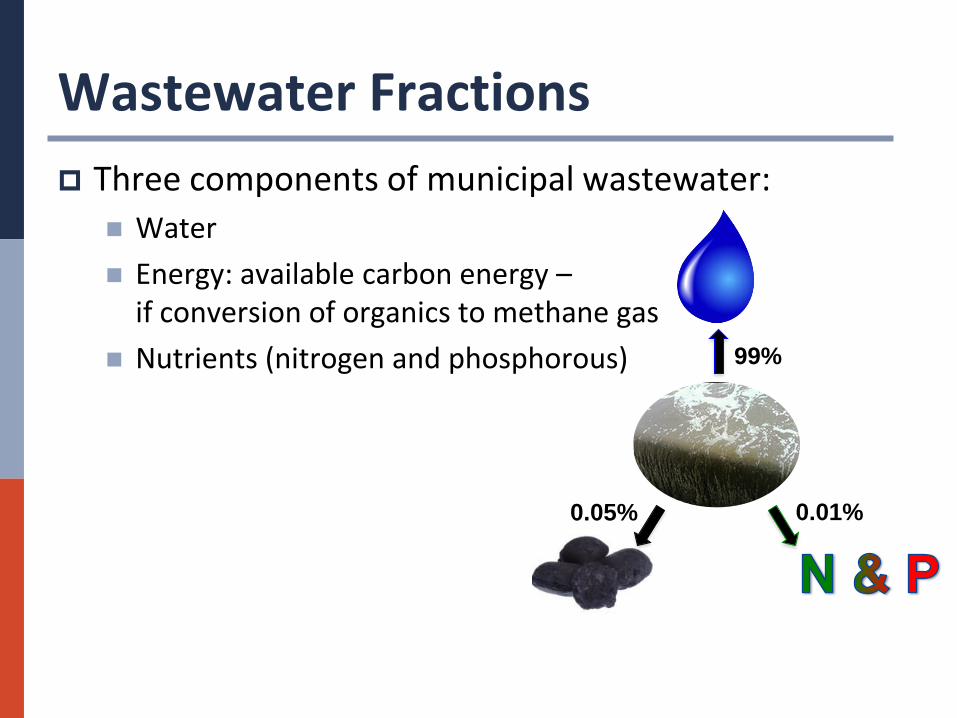
Wastewater Fractions
Three components of municipal wastewater:
Water
Energy: available carbon energy – if conversion of organics to methane gas
Nutrients (nitrogen and phosphorous) 99%
0.01% 0.05%
Fertilizer Human Footprint
Nutrient contribution
Nitrogen discharge = 7,400 g-N/year-capita
Phosphorus discharge = 2,600 g-P/year-capita
Problems with nutrient discharge
Toxic to aquatic life
Concern for drinking water
Contributes to eutrophication (algae blooms and low aquatic oxygen)
Fertilizer consumption and nutrient discharge can be reduced with nutrient recovery
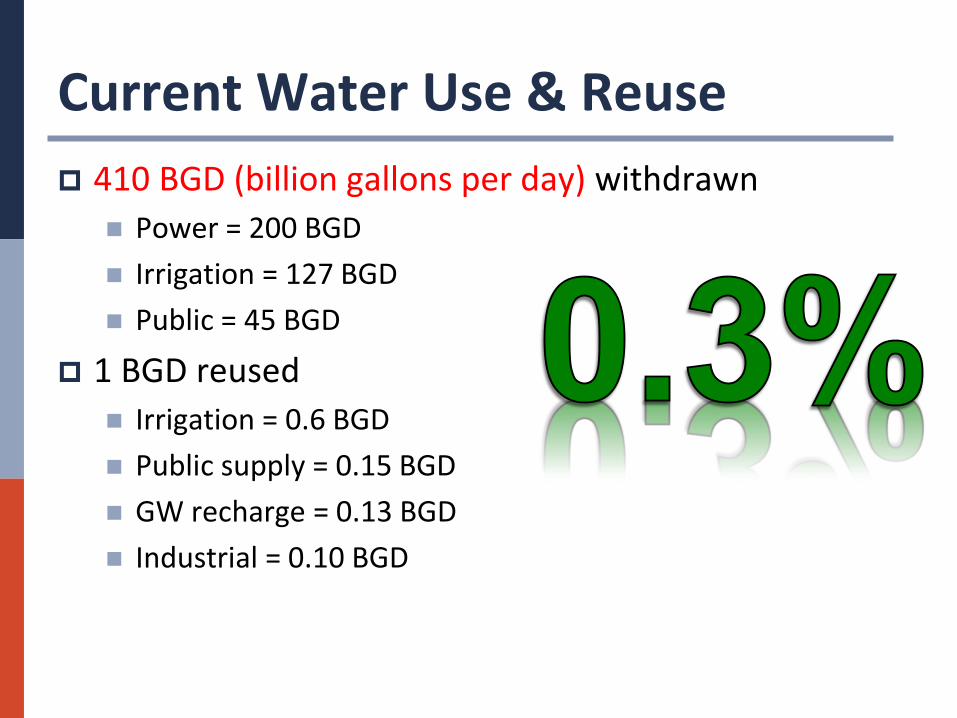
Current Water Use & Reuse
410 BGD (billion gallons per day) withdrawn
Power = 200 BGD
Irrigation = 127 BGD
Public = 45 BGD
1 BGD reused
Irrigation = 0.6 BGD
Public supply = 0.15 BGD
GW recharge = 0.13 BGD
Industrial = 0.10 BGD
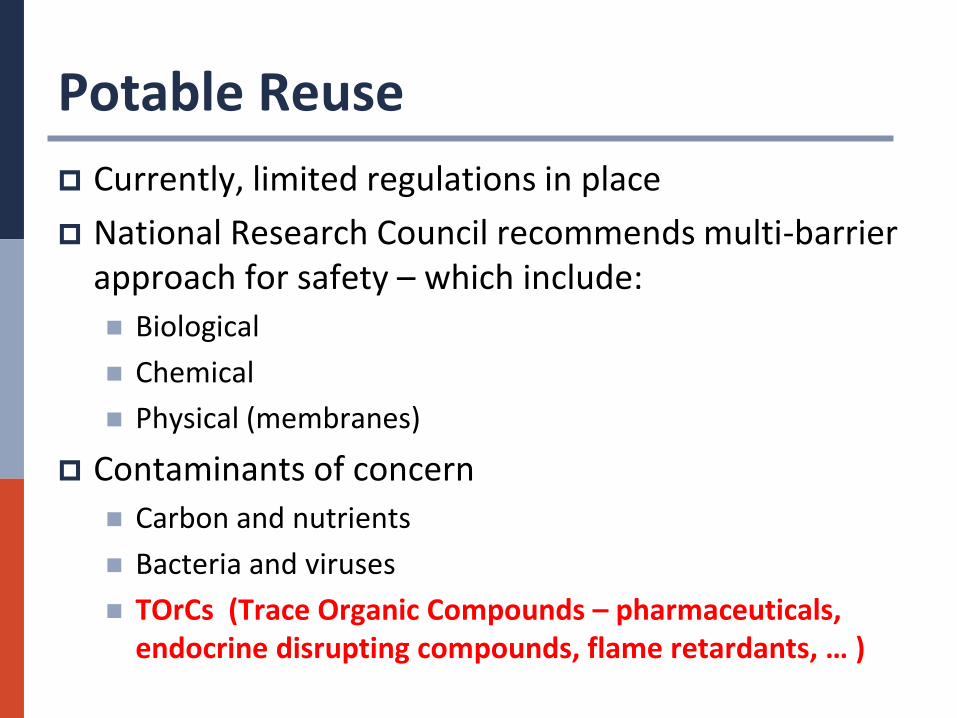
Potable Reuse
Currently, limited regulations in place
National Research Council recommends multi-barrier approach for safety – which include:
Biological
Chemical
Physical (membranes)
Contaminants of concern
Carbon and nutrients
Bacteria and viruses
TOrCs (Trace Organic Compounds – pharmaceuticals, endocrine disrupting compounds, flame retardants, … )
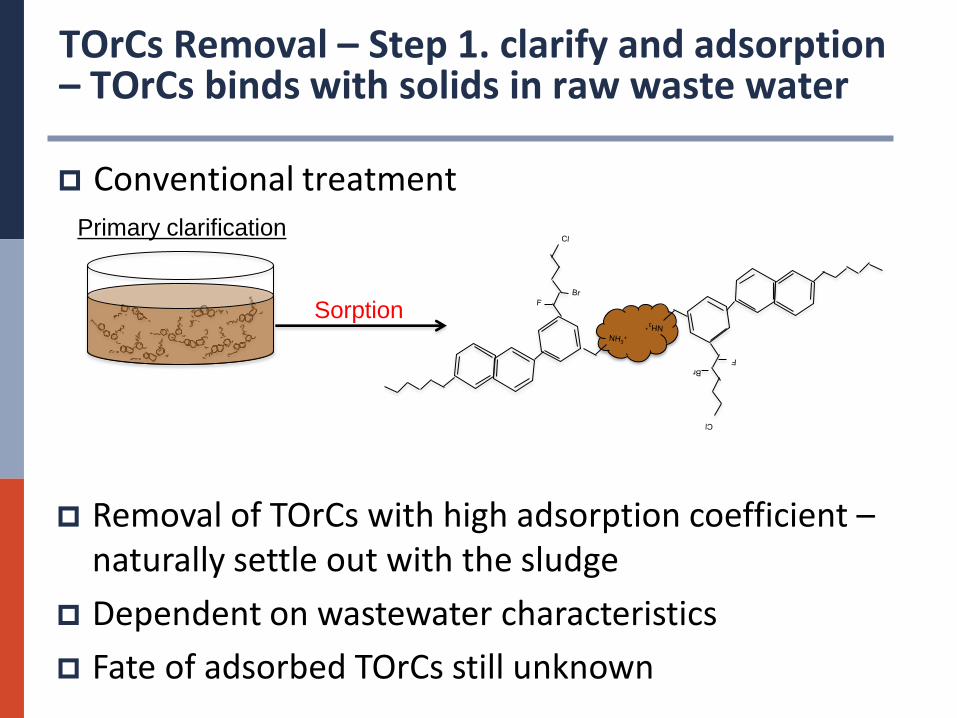
TOrCs Removal – Step 1. clarify and adsorption – TOrCs binds with solids in raw waste water
Conventional treatment Primary clarification
Sorption
Removal of TOrCs with high adsorption coefficient – naturally settle out with the sludge
Dependent on wastewater characteristics
Fate of adsorbed TOrCs still unknown
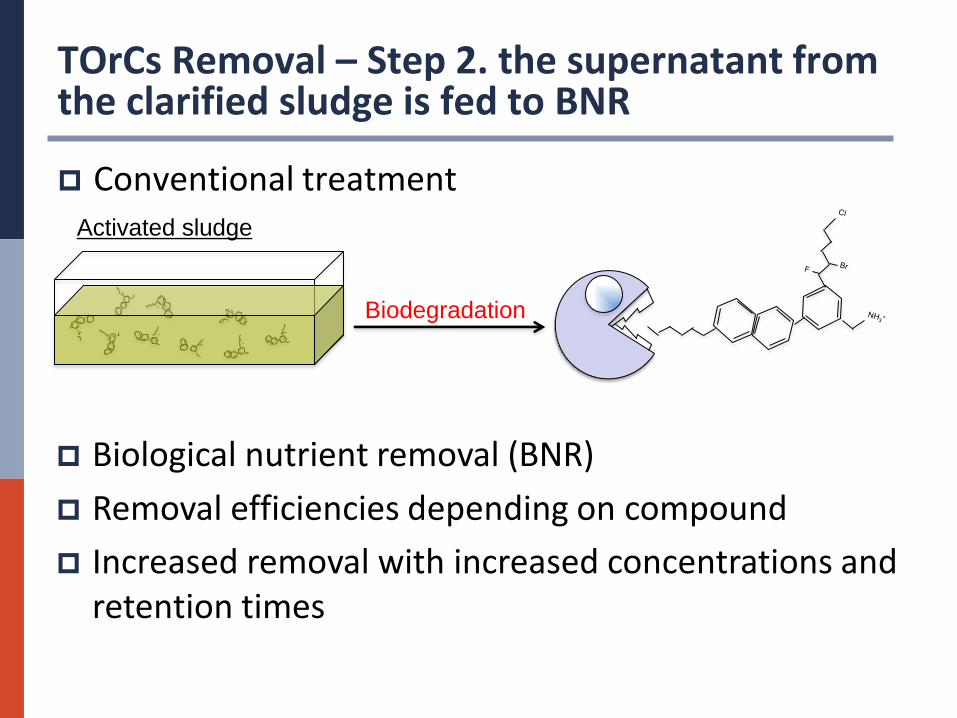
TOrCs Removal – Step 2. the supernatant from the clarified sludge is fed to BNR
Conventional treatment Activated sludge
Biodegradation
Biological nutrient removal (BNR)
Removal efficiencies depending on compound
Increased removal with increased concentrations and retention times
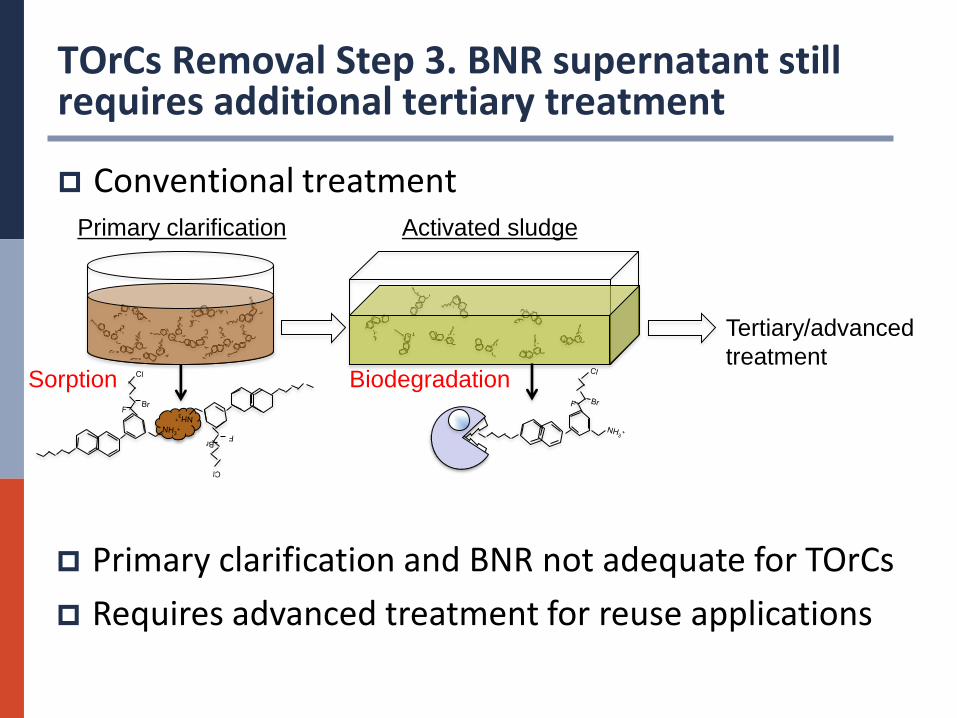
TOrCs Removal Step 3. BNR supernatant still requires additional tertiary treatment
Conventional treatment Primary clarification
Sorption
Activated sludge
Biodegradation
Tertiary/advanced
treatment
Primary clarification and BNR not adequate for TOrCs
Requires advanced treatment for reuse applications
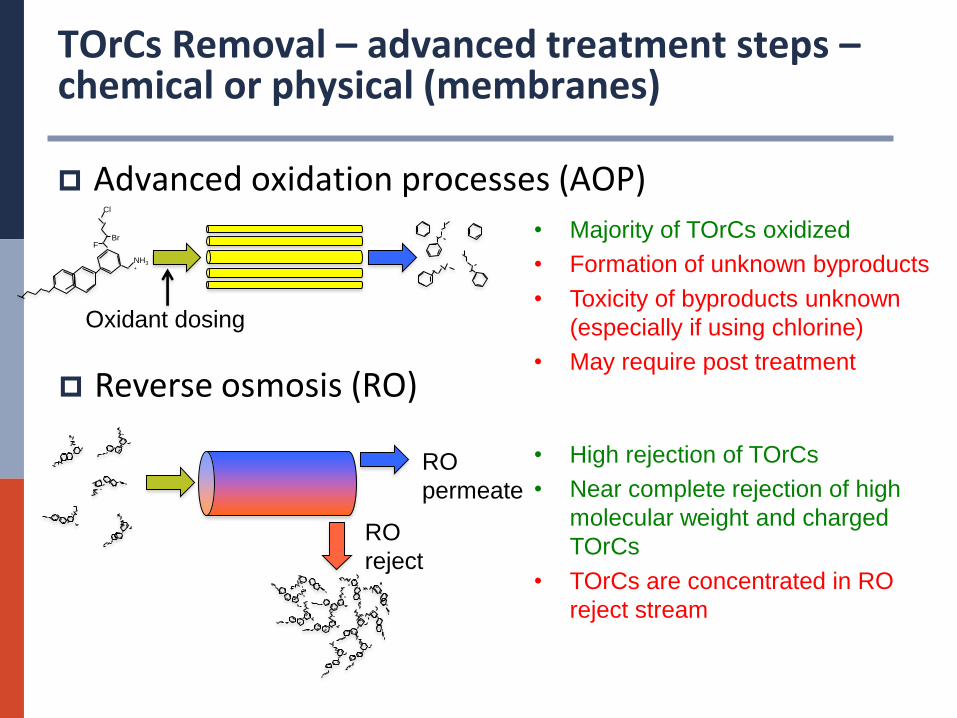
TOrCs Removal – advanced treatment steps – chemical or physical (membranes)
Advanced oxidation processes (AOP)
NH3+
F
Cl
Br
Oxidant dosing
• Majority of TOrCs oxidized
• Formation of unknown byproducts
• Toxicity of byproducts unknown
(especially if using chlorine)
• May require post treatment
RO
permeate
RO
reject
• High rejection of TOrCs
• Near complete rejection of high
molecular weight and charged
TOrCs
• TOrCs are concentrated in RO
reject stream
Reverse osmosis (RO)
How does HTI fit in?
The FO membrane is a physical barrier rejecting nutrients (N and P)
and TOrCs
The FO membrane in combination with a conventional MBR UF
membrane concentrates N and P to economic levels for recovery as a
solid fertilizer from the UF permeate.
The de-fertilized UF permeate can be used for secondary water uses
such as irrigation
The combined FO/RO membranes provide two very tight barriers to
TOrCs and nutrients
The following slides will review the testing results from piloting at CSM
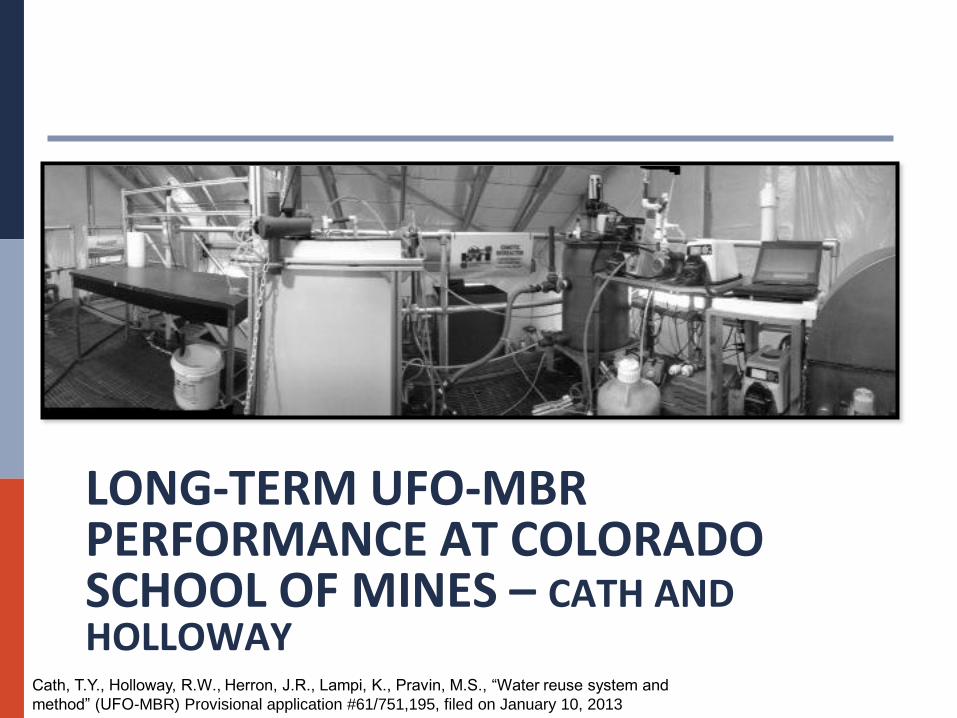
LONG-TERM UFO-MBR PERFORMANCE AT COLORADO SCHOOL OF MINES – CATH AND HOLLOWAY
Cath, T.Y., Holloway, R.W., Herron, J.R., Lampi, K., Pravin, M.S., “Water reuse system and
method” (UFO-MBR) Provisional application #61/751,195, filed on January 10, 2013
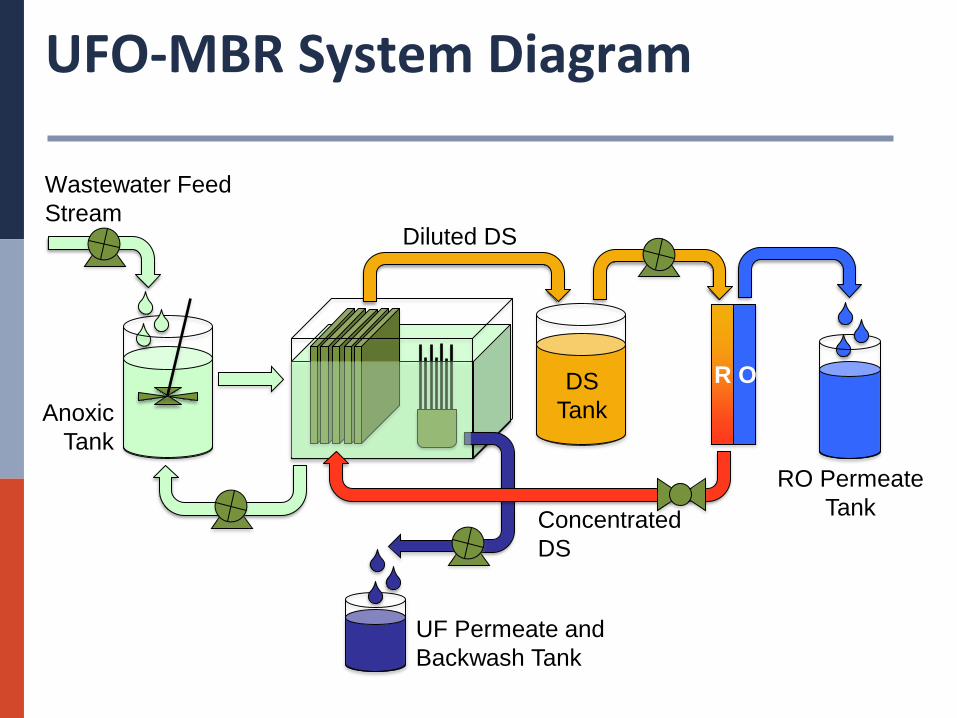
UFO-MBR System Diagram
Concentrated
DS
Wastewater Feed
Stream Diluted DS
UF Permeate and
Backwash Tank
DS
Tank
RO Permeate
Tank
Anoxic
Tank
R O
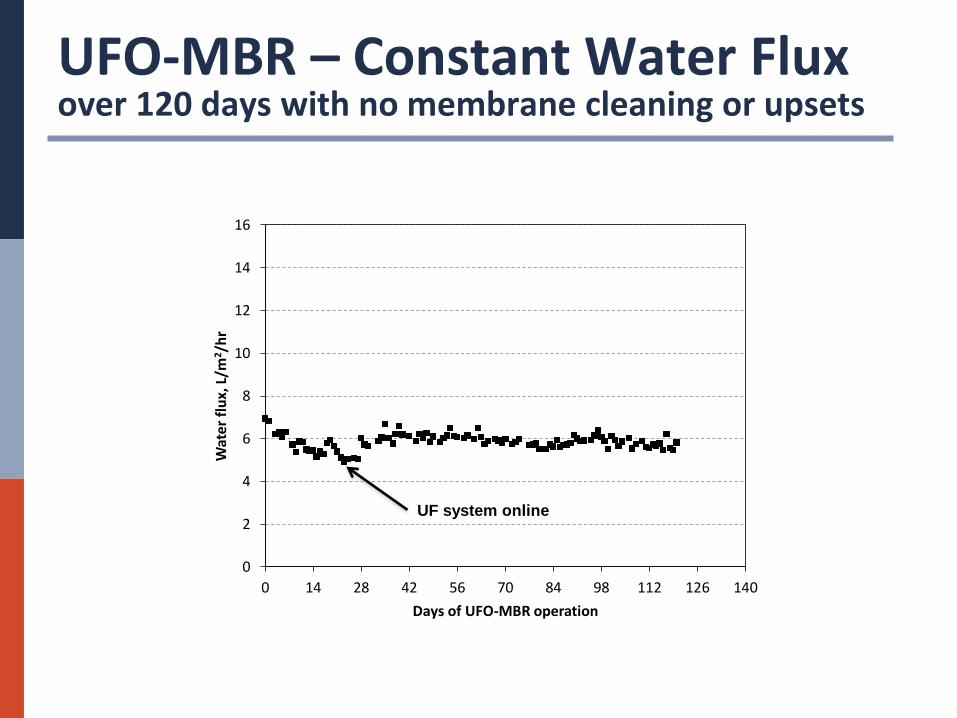
UFO-MBR – Constant Water Flux over 120 days with no membrane cleaning or upsets
0
2
4
6
8
10
12
14
16
0 14 28 42 56 70 84 98 112 126 140
Wat
er f
lux,
L/m
2 /h
r
Days of UFO-MBR operation
UF system online
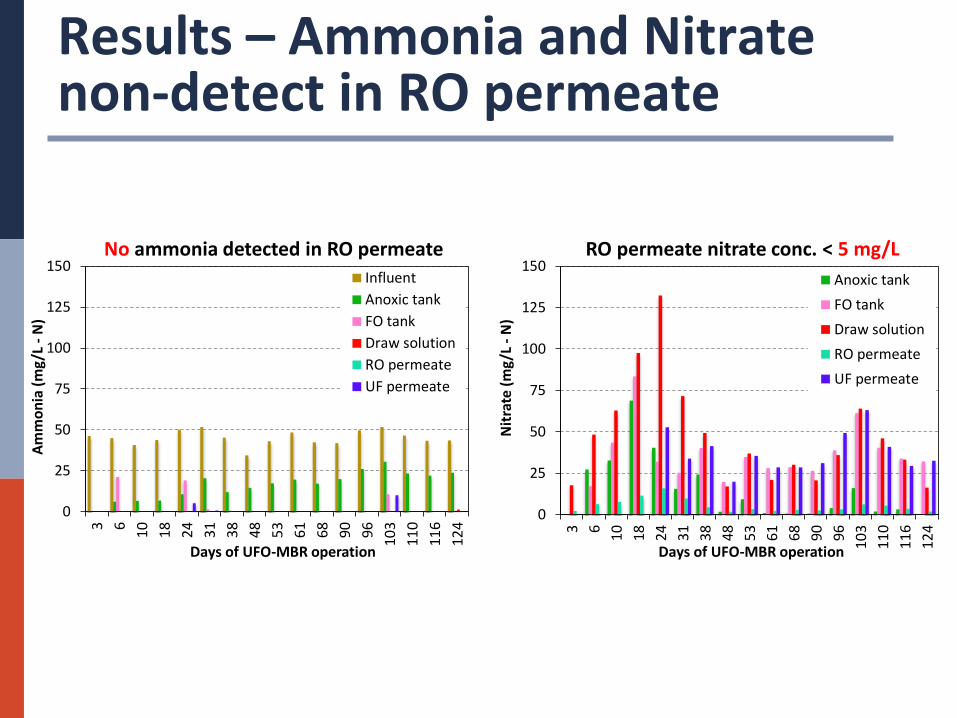
Results – Ammonia and Nitrate non-detect in RO permeate
0
25
50
75
100
125
150
3 6
10 18 24 31 38 48 53 61 68 90 96
103
110
116
124
Am
mo
nia
(m
g/L
- N
)
Days of UFO-MBR operation
Influent
Anoxic tank
FO tank
Draw solution
RO permeate
UF permeate
0
25
50
75
100
125
150
3 6
10 18 24 31 38 48 53 61 68 90 96
103
110
116
124
Nit
rate
(m
g/L
- N
)
Days of UFO-MBR operation
Anoxic tank
FO tank
Draw solution
RO permeate
UF permeate
No ammonia detected in RO permeate
RO permeate nitrate conc. < 5 mg/L
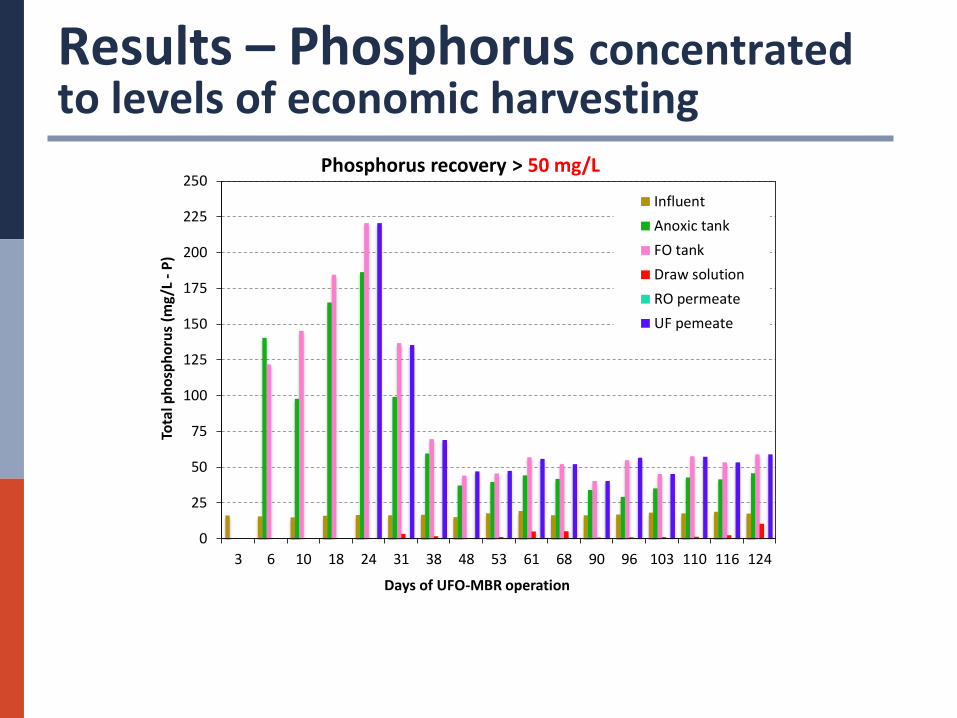
Results – Phosphorus concentrated to levels of economic harvesting
0
25
50
75
100
125
150
175
200
225
250
3 6 10 18 24 31 38 48 53 61 68 90 96 103 110 116 124
Tota
l ph
osp
ho
rus
(mg/
L -
P)
Days of UFO-MBR operation
Influent
Anoxic tank
FO tank
Draw solution
RO permeate
UF pemeate
Phosphorus recovery > 50 mg/L
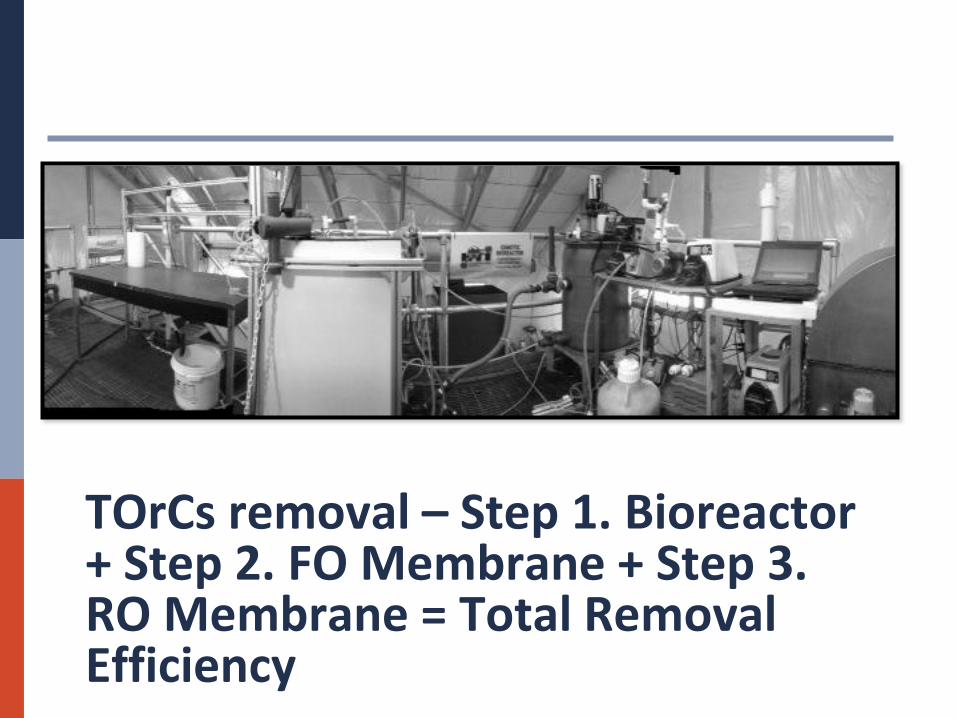
TOrCs removal – Step 1. Bioreactor + Step 2. FO Membrane + Step 3. RO Membrane = Total Removal Efficiency
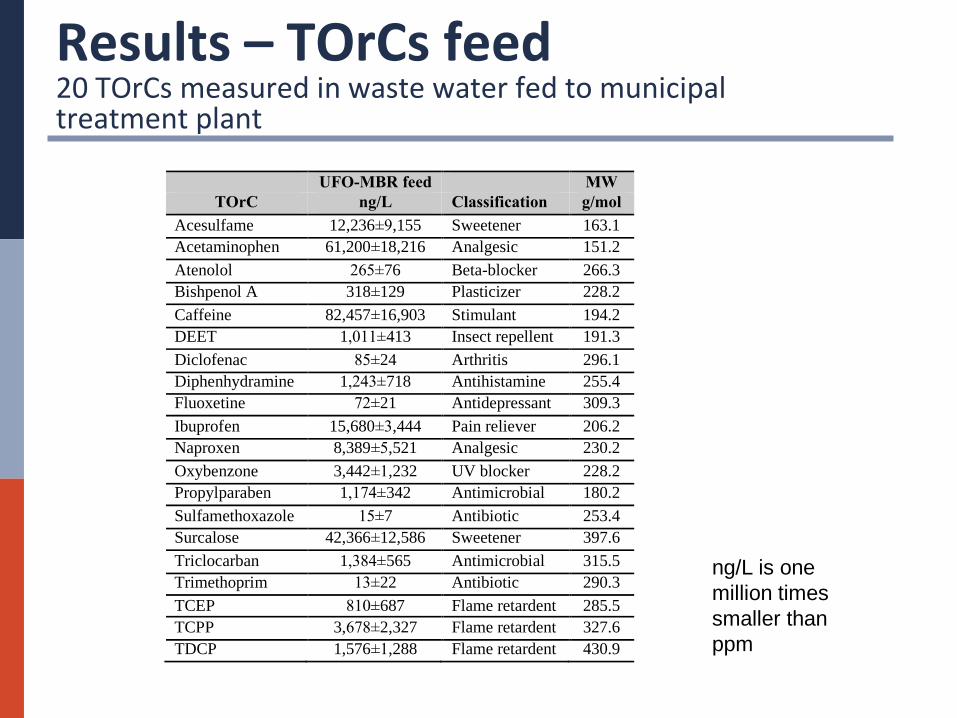
Results – TOrCs feed 20 TOrCs measured in waste water fed to municipal treatment plant
UFO-MBR feed MW
TOrC ng/L Classification g/mol
Acesulfame 12,236±9,155 Sweetener 163.1
Acetaminophen 61,200±18,216 Analgesic 151.2
Atenolol 265±76 Beta-blocker 266.3
Bishpenol A 318±129 Plasticizer 228.2
Caffeine 82,457±16,903 Stimulant 194.2
DEET 1,011±413 Insect repellent 191.3
Diclofenac 85±24 Arthritis 296.1
Diphenhydramine 1,243±718 Antihistamine 255.4
Fluoxetine 72±21 Antidepressant 309.3
Ibuprofen 15,680±3,444 Pain reliever 206.2
Naproxen 8,389±5,521 Analgesic 230.2
Oxybenzone 3,442±1,232 UV blocker 228.2
Propylparaben 1,174±342 Antimicrobial 180.2
Sulfamethoxazole 15±7 Antibiotic 253.4
Surcalose 42,366±12,586 Sweetener 397.6
Triclocarban 1,384±565 Antimicrobial 315.5
Trimethoprim 13±22 Antibiotic 290.3
TCEP 810±687 Flame retardent 285.5
TCPP 3,678±2,327 Flame retardent 327.6
TDCP 1,576±1,288 Flame retardent 430.9
ng/L is one
million times
smaller than
ppm
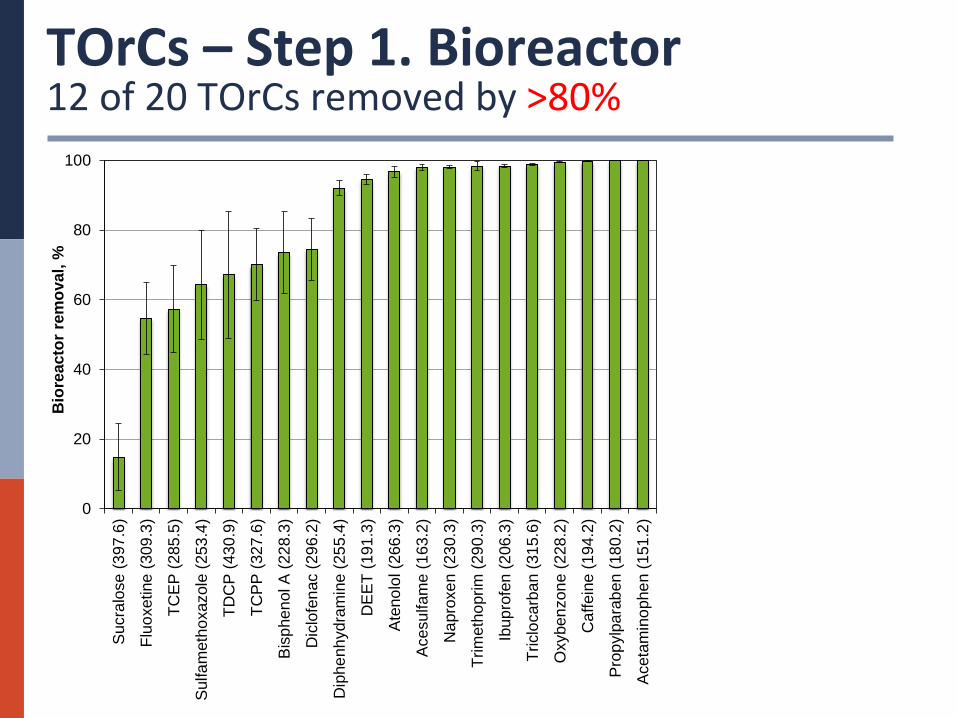
TOrCs – Step 1. Bioreactor 12 of 20 TOrCs removed by >80%
0
20
40
60
80
100
Sucra
lose
(3
97
.6)
Flu
oxetine
(309
.3)
TC
EP
(285
.5)
Sulfa
meth
oxazole
(253
.4)
TD
CP
(43
0.9
)
TC
PP
(327
.6)
Bis
phen
ol A
(22
8.3
)
Dic
lofe
nac (
29
6.2
)
Dip
he
nh
ydra
min
e (
25
5.4
)
DE
ET
(191
.3)
Ate
no
lol (2
66
.3)
Acesu
lfam
e (
163.2
)
Na
pro
xe
n (
23
0.3
)
Trim
eth
oprim
(29
0.3
)
Ibup
rofe
n (
206.3
)
Triclo
carb
an (
31
5.6
)
Oxyben
zon
e (
228
.2)
Ca
ffein
e (
194.2
)
Pro
pylp
ara
ben (
18
0.2
)
Aceta
min
ophe
n (
151
.2)
Bio
reacto
r re
mo
val,
%
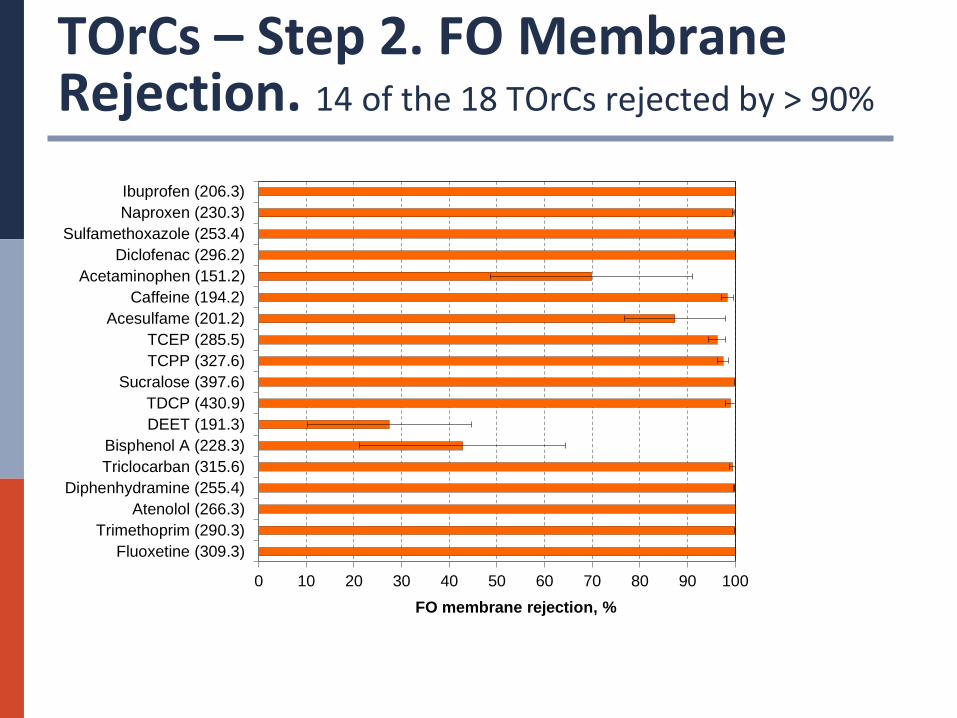
TOrCs – Step 2. FO Membrane Rejection. 14 of the 18 TOrCs rejected by > 90%
0 10 20 30 40 50 60 70 80 90 100
Ibuprofen (206.3)
Naproxen (230.3)
Sulfamethoxazole (253.4)
Diclofenac (296.2)
Acetaminophen (151.2)
Caffeine (194.2)
Acesulfame (201.2)
TCEP (285.5)
TCPP (327.6)
Sucralose (397.6)
TDCP (430.9)
DEET (191.3)
Bisphenol A (228.3)
Triclocarban (315.6)
Diphenhydramine (255.4)
Atenolol (266.3)
Trimethoprim (290.3)
Fluoxetine (309.3)
FO membrane rejection, %
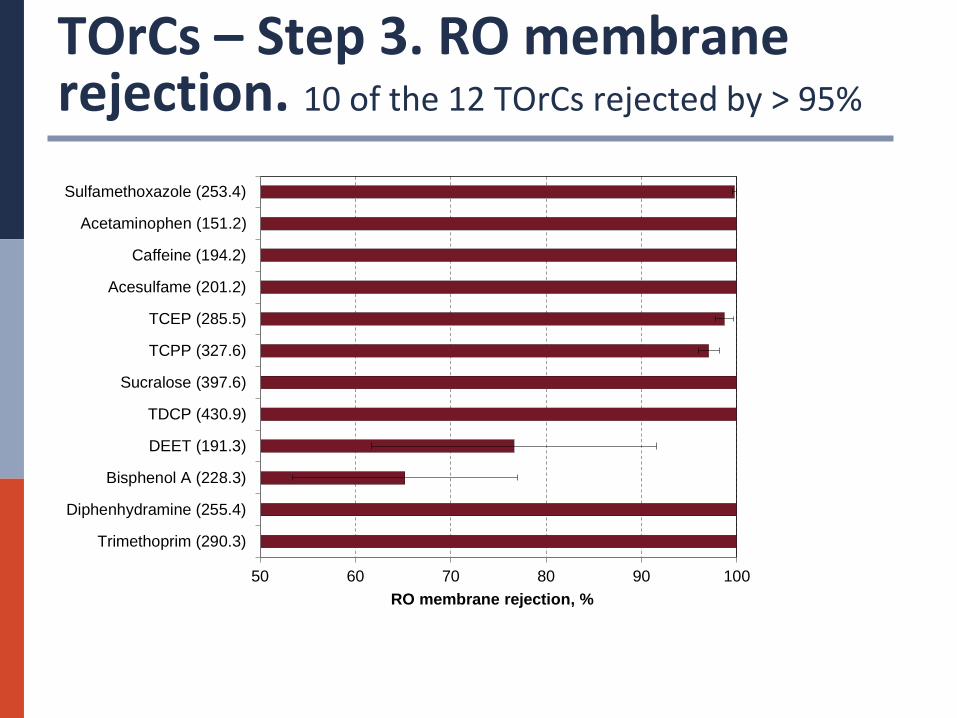
TOrCs – Step 3. RO membrane rejection. 10 of the 12 TOrCs rejected by > 95%
50 60 70 80 90 100
Sulfamethoxazole (253.4)
Acetaminophen (151.2)
Caffeine (194.2)
Acesulfame (201.2)
TCEP (285.5)
TCPP (327.6)
Sucralose (397.6)
TDCP (430.9)
DEET (191.3)
Bisphenol A (228.3)
Diphenhydramine (255.4)
Trimethoprim (290.3)
RO membrane rejection, %
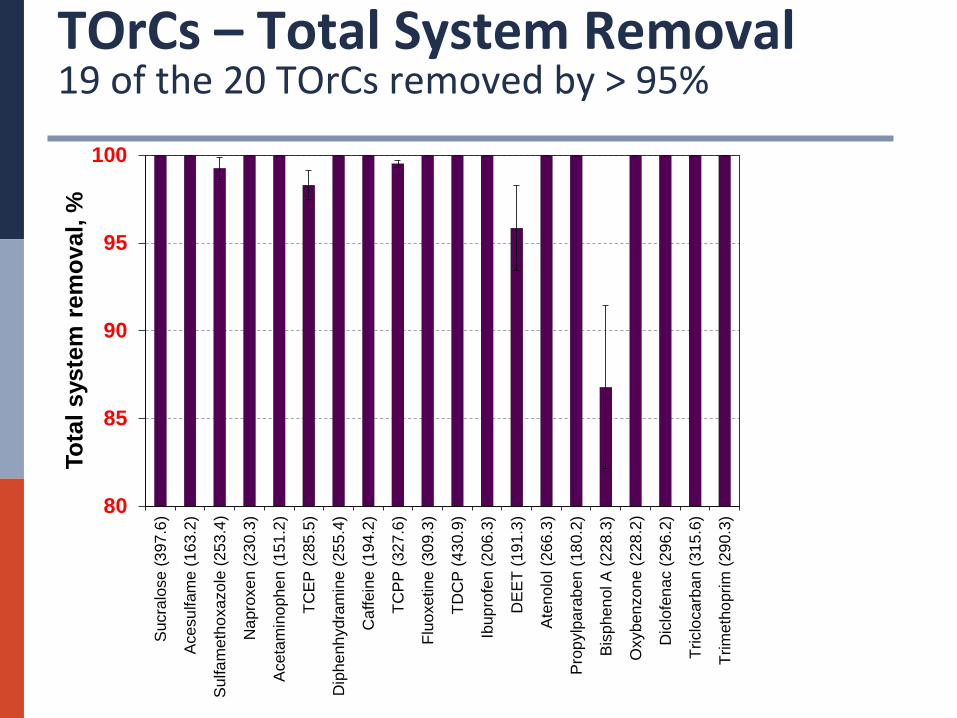
TOrCs – Total System Removal 19 of the 20 TOrCs removed by > 95%
80
85
90
95
100S
ucra
lose
(3
97
.6)
Acesu
lfam
e (
163.2
)
Su
lfa
me
tho
xazole
(253
.4)
Na
pro
xe
n (
23
0.3
)
Aceta
min
ophe
n (
151
.2)
TC
EP
(285
.5)
Dip
he
nh
ydra
min
e (
25
5.4
)
Ca
ffein
e (
194.2
)
TC
PP
(327
.6)
Flu
oxetine
(309
.3)
TD
CP
(43
0.9
)
Ibup
rofe
n (
206.3
)
DE
ET
(191
.3)
Ate
no
lol (2
66
.3)
Pro
pylp
ara
ben (
18
0.2
)
Bis
phen
ol A
(22
8.3
)
Oxyben
zon
e (
228
.2)
Dic
lofe
nac (
29
6.2
)
Triclo
carb
an (
31
5.6
)
Trim
eth
oprim
(29
0.3
)
To
tal
sys
tem
rem
oval, %
Conclusion:
A combination of conventional BNR and
UFO-MBR can economically treat
municipal waste water to:
1) Harvest nutrients from the UF permeate that
has been concentrated from the FO system
2) Very high rejection of TOrCs
3) Pursuing an opportunity to pilot the
technology with a municipality