Embed Size (px)
Citation preview

Hycroft Oxidation Pilot Plant Overview
Bill Pennstrom Pennstrom Consulting
Art Ibrado M3 Engineering
Dennis Gertenbach Hazen Research
Hazen Research: AAO Pilot Plant Tour Friday, February 21, 2014

Previous Test Work
Direct Cyanidation Test Work
• Direct cyanidation leach results of bulk samples taken from all zones on the deposit were conducted early in the test program in 2010
• Poor gold recovery results were obtained
• Concentrate was ground to a P80 of 325 mesh for this testing
• Recoveries from Brimstone and Vortex, the two largest components of the deposit, were in the mid-20% range for gold and 80% range for silver, while other smaller components of the deposit yielded recoveries ranging from 45 to 50% for gold and 55 to 83% for silver
Roaster Test Work
• Test work showed that roasting would work when tested on Brimstone ore
• Results indicated that average recoveries of 89% Au and 74% Ag are achievable from the concentrates by varying the leach and roast conditions slightly for the majority of the concentrate produced
INV
ES
TIG
AT
IVE
TE
ST
WO
RK
2

Previous Oxidation Testing
Autoclave or POX Test Work
• Test work showed that POX will work to oxidize the sulfide concentrate
• Gold liberation was good with gold recoveries achieving mid-90s
• Silver recoveries went down due to jarosite formation at low pH
• Oxidized concentrates that were treated using a lime boil were able to achieve silver recoveries in the 80s while maintaining gold recoveries in the mid-90s
Bio Oxidation Test Work
• Test work showed that bio oxidation works for Hycroft rougher and cleaner concentrates
• Rougher concentrate oxidation times were predicted to be 4.5 days to obtain 83% sulfide oxidation
INV
ES
TIG
AT
IVE
TE
ST
WO
RK
3

BIOX: Sulfide Oxidation versus Gold Recovery
BIOX test work results
showing percent sulfide
oxidation versus gold
recovery
The most important lessons learned from the BIOX testing were: • Hycroft concentrate does not require a high level of oxidation to achieve
economic metal recovery • Operating and capital cost intensive systems (autoclave, roasters) are not
required • Other simpler oxidation process options needed to be investigated
INV
ES
TIG
AT
IVE
TE
ST
WO
RK
4

Chlorine Oxidation Testing
0
10
20
30
40
50
60
70
0 10 20 30 40 50 60
Go
ld L
eac
h %
Sulfide Oxidation (%)
Chlorine Oxidation Test Work Gold Leach vs Sulfide Oxidation
• Test work showed that chlorine oxidation would work on Hycroft rougher and cleaner concentrates, but at high chlorine consumptions
• Silver recovery dropped with increasing sulfide oxidation percentages
INV
ES
TIG
AT
IVE
TE
ST
WO
RK
0
10
20
30
40
50
60
70
80
0 10 20 30 40 50 60
Silv
er
Leac
h %
Sulfide Oxidation (%)
Chlorine Oxidation Test Work Silver Leach vs Sulfide Oxidation
5
Pressure Alkaline Testing
0
20
40
60
80
100
120
0 20 40 60 80 100
Go
ld L
eac
h %
Sulfide Oxidation (%)
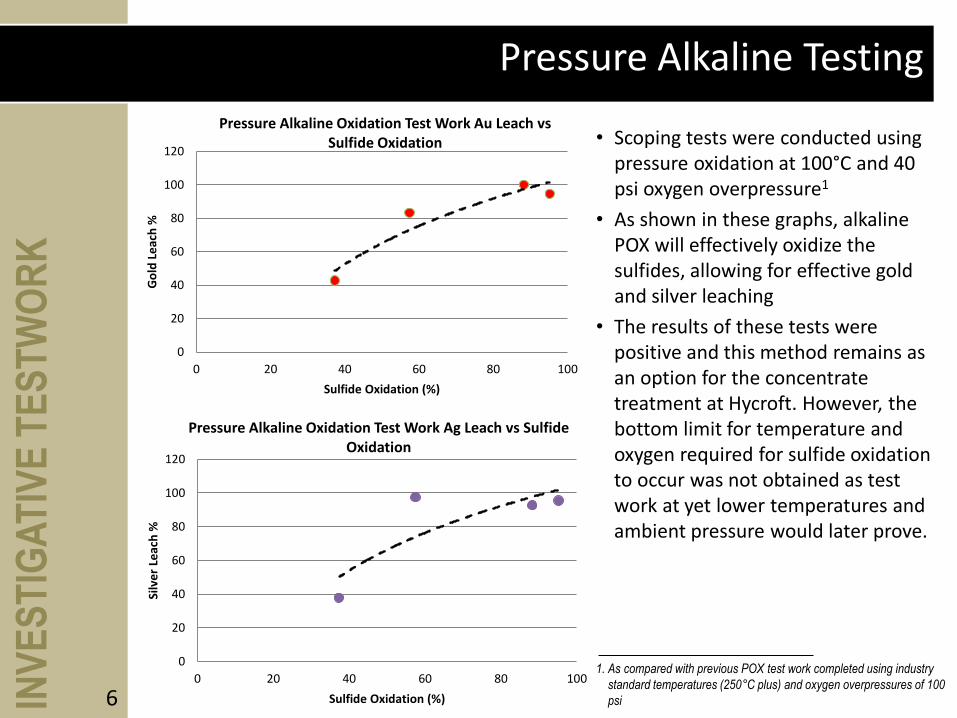
Pressure Alkaline Oxidation Test Work Au Leach vs Sulfide Oxidation • Scoping tests were conducted using
pressure oxidation at 100°C and 40 psi oxygen overpressure1
• As shown in these graphs, alkaline POX will effectively oxidize the sulfides, allowing for effective gold and silver leaching
• The results of these tests were positive and this method remains as an option for the concentrate treatment at Hycroft. However, the bottom limit for temperature and oxygen required for sulfide oxidation to occur was not obtained as test work at yet lower temperatures and ambient pressure would later prove.
INV
ES
TIG
AT
IVE
TE
ST
WO
RK
0
20
40
60
80
100
120
0 20 40 60 80 100
Silv
er
Leac
h %
Sulfide Oxidation (%)
Pressure Alkaline Oxidation Test Work Ag Leach vs Sulfide Oxidation
1. As compared with previous POX test work completed using industry
standard temperatures (250°C plus) and oxygen overpressures of 100
psi 6

Ambient Alkaline Oxidation (“AAO”)
• The sulfide mineral in Hycroft ore is predominantly pyrite and marcasite, with the gold associated on the rim of the sulfide crystal, not intimately associated within the sulfide crystal
• Hycroft concentrate is amenable to simple oxidation and leaching practices
• Ambient pressure oxidation is a process that has been used successfully for a number of years in the precious metals industry
– The Albion process is a common form of ambient pressure oxidation, however, other less familiar versions of the process have been, or are currently in operation globally
• The AAO process is simply described as: Air or oxygen is sparged into agitated tanks, and sufficient retention time, typically 4 to 24 hr, is provided to allow adequate oxidation and/or passivation of cyanide-consuming minerals
• AAO can be applied as a simple, low capital and operating cost step before cyanide leaching to oxidize and/or passivate the surfaces of some of the more reactive, reagent-consuming sulfides
• AAO, as it is intended to be applied in the concentrate oxidation process for Hycroft, involves using oxygen enriched air and heat generated from the oxidation process to oxidize the concentrate in an ambient pressure environment using trona to provide the alkaline environment and to neutralize the acid that is created during the oxidation process
BE
NC
H S
CA
LE
TE
ST
ING
7

Ambient Alkaline Oxidation (“AAO”)
0
20
40
60
80
100
120
0 20 40 60 80 100 120
Go
ld L
eac
h %
Sulfide Oxidation (%)
Alkaline Ambient Pressure Test Work Au Leach vs Sulfide Oxidation
• Test work was initially conducted on Alkaline Oxidation at Ambient pressure (AAO) using caustic (NaOH) as the pH modifier.
• The test showed that oxidation of the sulfides was effective and gold and silver liberation for cyanidation was achieved.
BE
NC
H S
CA
LE
TE
ST
ING
0
20
40
60
80
100
120
0 20 40 60 80 100 120
Silv
er
Leac
h %
Sulfide Oxidation (%)
Alkaline Ambient Pressure Test Work Ag Leach vs Sulfide Oxidation
8

Ambient Alkaline Oxidation (“AAO”)
Reagent Consumption
Test ID #
P80 PSA,
μm
Oxidant
Gas Time, h Reagent
Reagent
Consumption
(dry basis), lb/st
Sulfide
Oxidation, %
Gold
Extraction, %
Silver
Extraction, %
3738-16 15 O2 24 50% NaOH 491 95.2 95.5 99+
3738-27 15 O2 24 15% limestone slurry 220 18.9 10.6 54.3
3738-23 15 O2 24 K2CO3 2,537 58.8 86.1 96
3738-34 15 O2 24 Na2SiO3 1,921 81.1 77.8 86.7
3738-35 15 O2 9.5 Na2CO3 737 58.7 81.9 93.4
3738-44 15 O2 17.3
Na2CO3 • NaHCO3 • 2H2O
Trona 487 64.2 82.4 93
Oxidation Target Conditions Results
Table 1 - Results from Selected Tests Using Different pH Modifiers
• A review of possible pH modifying reagents for effectiveness and cost was conducted which included lime, sodium carbonate, sodium bicarbonate, potassium carbonate, sodium silicate, limestone and sodium sesquicarbonte (Trona).
BE
NC
H S
CA
LE
TE
ST
ING
9

Ambient Alkaline Oxidation (“AAO”)
• Trona was found to be the most cost effective reagent for oxidizing the Hycroft concentrates
• Trona has the added benefit of being readily available and within relatively close proximity to Hycroft
– The largest known trona source in the world is situated in Green River, Wyoming, with
readily accessible transportation lines to Hycroft
• The next phase of test work involved looking at different Trona addition rates
BE
NC
H S
CA
LE
TE
ST
ING
10

Ambient Alkaline Oxidation (“AAO”) with Trona
• The relationship between gold /silver recovery and sulfide oxidation with Trona as the pH modifier is shown in the following graphs
– Silver recovery at Hycroft is an important factor in the economic evaluation
• An economic evaluation on the degree of oxidation and gold and silver recovery versus the operating costs can be performed
• Initial calculations show an oxidation range between 55% and 70% will give the most economic return
BE
NC
H S
CA
LE
TE
ST
ING
11

Ambient Alkaline Oxidation (“AAO”) with Trona
• Gold extraction can be tied to Trona consumption as is depicted from the test data displayed in the following graph.
BE
NC
H S
CA
LE
TE
ST
ING
12

Ambient Alkaline Oxidation (“AAO”) with Trona
• The first parameter reviewed was the oxidation time required at varying Trona addition rates
• Trona addition effects the rate and degree of oxidation
BE
NC
H S
CA
LE
TE
ST
ING
13

Ambient Alkaline Oxidation (“AAO”) with Trona
• Additional operating parameters that have been reviewed include:
– reaction temperature
– concentrate particle size
– oxygen concentration, and
– percent solids of the concentrate slurry feeding AAO
The following graph shows
the effect of reaction
temperature on sulfide
oxidation rate. Higher
reaction temperatures
accelerate the oxidation
reaction
BE
NC
H S
CA
LE
TE
ST
ING
14

Ambient Alkaline Oxidation (“AAO”) with Trona
• Particle size of the rougher concentrate and percent solids of the slurry both have an obvious impact on the sulfide oxidation reaction rate
• Finer grinds and lower percent solids both improve reaction kinetics
BE
NC
H S
CA
LE
TE
ST
ING
15

Ambient Alkaline Oxidation (“AAO”) with Trona
• Two distinct reaction components are affected by the percent solids:
1) the lower percent solids improves reaction kinetics by diluting the reaction products; and
2) the amount of oxygen available in the slurry for the oxidation of the sulfide is higher the
lower the percent solids.
BE
NC
H S
CA
LE
TE
ST
ING
16

Ambient Alkaline Oxidation (“AAO”) with Trona
• The effect of oxygen concentration on the slurry pyrite oxidation rates is illustrated in the following graph
• If all other parameters are kept constant, the higher the oxygen concentration the faster the sulfide oxidation rate
• Although the degree of oxidation is directly proportional to the amount of oxygen consumed, higher oxygen concentrations accelerate the reaction rate
BE
NC
H S
CA
LE
TE
ST
ING
17

Oxidation Reaction
FeS2 + 4Na2CO3 + 2.5H2O + 3.75O2(g) = FeO*OH + 2Na2SO4 + 4NaHCO3
Oxygen supplied by water and O2 gas
EC
ON
OM
IC R
EV
IEW
18

Oxygen Gas Requirement
Stoichiometric 1.87 kg O2 per kg S
Utilization 85%
Consumption 2.2 kg O2 per kg S
EC
ON
OM
IC R
EV
IEW
19

Unit Cost of Oxygen
• Low pressure – lower power cost
• Comparable to Barrick Roaster supply
• Estimate based on Barrick Roaster cost, with adjustments to over-the-fence, cost is about $25/t O2 (including power cost)
• Air Products Estimate is $22.64/t O2 (including power cost)
• Cost reduction potential if construction of O2 plant can utilize construction capability during construction of the mill (e.g., use of cranes, etc.)
EC
ON
OM
IC R
EV
IEW
20

Oxygen Supply Options Barrick Roaster Barrick POX Estimated Hycroft
Air Products
Sale of Equipment
(SOE)
Air Liquide
Sale of Gas
(SOG)
Air Products
Sale of Gas
(SOG)
Short tons/day 1,100 600 2,469
Metric tons/day 998 544 2,240
O2 Pressure 25 500 35
Power Cost/month 650,000 500,000 1,271,453
Power unit cost, $/kWh 0.07 0.07 0.061
Capital Cost $ ? $ 0 $ 0
Owner Contribution to Construction Cost $ ? $ ? $ 0
Operating Fee or BFC, monthly $ 80,000 $ 500,000 $ 250,000
Power Draw, MW 12.90 9.92
28.95
tons/mo 29,937 16,329 67,200
$/ton O2 op fee $ 2.67 $ 30.62 $ 3.72
kWh/mo 9,285,714 7,142,857 20,843,491
kWh/t 310 437 310
$/t power
21.71
30.62
18.92
Total $/mt $ 24.38 $ 61.24 $ 22.64
Oxygen Cost Assumptions E
CO
NO
MIC
RE
VIE
W
21

Oxygen Gas Requirement
80:20 O2:Air Ratio
Purity 95% O2
80:20 Ratio = 80.2% O2 by Volume
= 82.2% O2 by Weight
Projected O2 Consumption:
At 60% oxidation = 2,090 tonnes/day
At 70% oxidation = 2,549 tonnes/day
EC
ON
OM
IC R
EV
IEW
22

60% Oxidation 200 kg trona/mt conc
10% Sulfide Sulfur 13.8% Mass Pull
Labor Staff $/hr $/day $/ton
Operator 4 $33.75 $1,620
Helper 4 $29.70 $1,426
Mechanic 2 $29.70 $713
Mechanic Helper 2 $29.70 $713
Total Labor $4,471 0.03
Power kWh/day $/kWh $/day
Conveyor 4,600 $0.061 $281
Agitators 35,000 $2,135
Blowers 705 $43
Pumps 2,837 $173
Thickener 150 $9
Total Power 43,292 $2,641 0.02
Reagents t/day $/t $/day
Oxygen 2,090 $25.00 $52,253 0.40
Trona 3,255 $110.23 $358,800 2.76
kg/t ore $/kg $/day
Flocculant 0.04 $3.90 $2,539 0.020
Total Reagents $413,592 3.18
Maintenance equip. cost % factor $/day
Parts $20,000,000 5.0% $2,740 0.02
t $/t $/day
Supplies & Services $117,935 $0.020 $2,358.70 0.02
Regrind Cost 16,275.06 $1.100 $17,903 0.14
Total Oxidation $443,705 3.41
AAO Preliminary Operating Cost
EC
ON
OM
IC R
EV
IEW
23

AAO Preliminary Capital Estimate Hycroft Project, Benchmarking and Scoping Capital Study Concentrate Oxidation and Leach
M3-PN130155
Concentrate Oxidation
Item Description Approximate Cost
($M) Notes
Rail Unloading System For Trona Rotary Car Dump, 6.00 Similar project
Auxiliary Trona Storage Storage Near Rail Unloading System for Dead Storage 2.00 Allowance
Rail Spur/Siding To park approximately 80 rail cars 0.00 Not included
Pipeline / Flush System for Trona 2 Miles 4.00
Trona Dry Storage Non Mechanized storage area near Rail Spur 1.00 Allowance
Trona Storage Tanks 2 - 100' Diameter Agitated Tanks 3.00 Estimated at $1.5 Million per tank
General Site Work Site Work, Infrastructure, etc. 3.00 Allowance
Steam System 5 Million BTU 2.00 Allowance
Oxidation Tanks 12, 60' x 62' Oxidation Tanks, 39.60 Project With Similar Sized Tanks, Approximately $3.3M per tank
Oxygen Plant Considered an "over the fence" contract, therefore, no capital costs 0.00
Pre-Leach Thickener 1, 180' Diameter Thickeners 3.50 Similar project, approximately $3.5M per Thickener
Subtotal 64.10
Indirect Costs@ 60% Includes EPCM, Owner's Costs, Contingency and Misc. Indirects 38.46
Total 102.56
Concentrate Leach
Item Description Approximate Cost
($M) Notes
Leach Tanks 10, 54'x56' Leach Tanks 27.00 Project With Similar Sized Tanks, Approximately $2.7M per tank
CCD Thickeners 4, 180' Diameter Thickeners 14.00 Similar project, approximately $3.5M per Thickener
Cyanide Destruct Tanks 2 tanks 2.00 Project With Similar Sized Tanks, Approximately $1.0M per tank
Upgrades to Merrill Crowe Plant Not Included 0.00
Subtotal 43.00
Indirect Costs@ 60% Includes EPCM, Owner's Costs, Contingency and Misc. Indirects 25.80
Total 68.80 EC
ON
OM
IC R
EV
IEW
24

Bench Scale Testing: Summary and Conclusions
• Hycroft concentrate is easily oxidized and can be processed by simple oxidation techniques
• Oxidation testing of rougher concentrate resulted in a sulfide oxidation percentage of 60% and recoveries of 85% gold and 82% silver
– oxidation time of 24 hours, a reaction temperature of 75˚C, slurry percent solids of 15% w/w, and a grind size of 15 microns
• Positive results from bench scale testing and preliminary economic review of the oxidation circuit warrant a pilot plant study
• Bench scale test results set pilot plant baseline target parameters
– AAO is a very flexible process
– Oxidation rates are driven by capital and operating costs
– The pilot plant will investigate various adjustments to the inputs to assess optimal operating parameters as compared to their associated capital and operating cost
SU
MM
AR
Y A
ND
CO
NC
LU
SIO
NS
25

Ambient Alkaline Oxidation (“AAO”) Pilot Plant
• Based on the knowledge obtained from the bench scale testing, the following baseline parameters for the pilot plant were developed:
Trona addition 300 kg/t Reaction temperature 75°C
Conc. particle size P80 25um Slurry percent solids 25% w/w
Oxygen concentration 100% O2 Reaction time 36 hours
PIL
OT
PL
AN
T T
ES
TIN
G
26

Mill General Arrangement
Crushing
Grinding and Flotation
AAO Circuit
Oxygen Plant
DE
VE
LO
PM
EN
T
27

Mill Flowsheet D
EV
EL
OP
ME
NT
28

Oxidation Circuit Flowsheet D
EV
EL
OP
ME
NT
29

Next Steps
• Refine optimal operating parameters based on pilot plant runs
• Refine capital and operating cost assumptions using pilot plant results
• Complete prefeasibility study for oxidation circuit by end of Q1 2014
• Assuming positive outcome of prefeasibility study, revise the mill feasibility study incorporating the oxidation circuit and changes to the mill flowsheet by the end of Q3 2014
PA
TH
FO
RW
AR
D
30

AAO Feed AAO Discharge
Flotation Cell
QUESTIONS
QU
ES
TIO
NS

32
Hycroft Operations Update
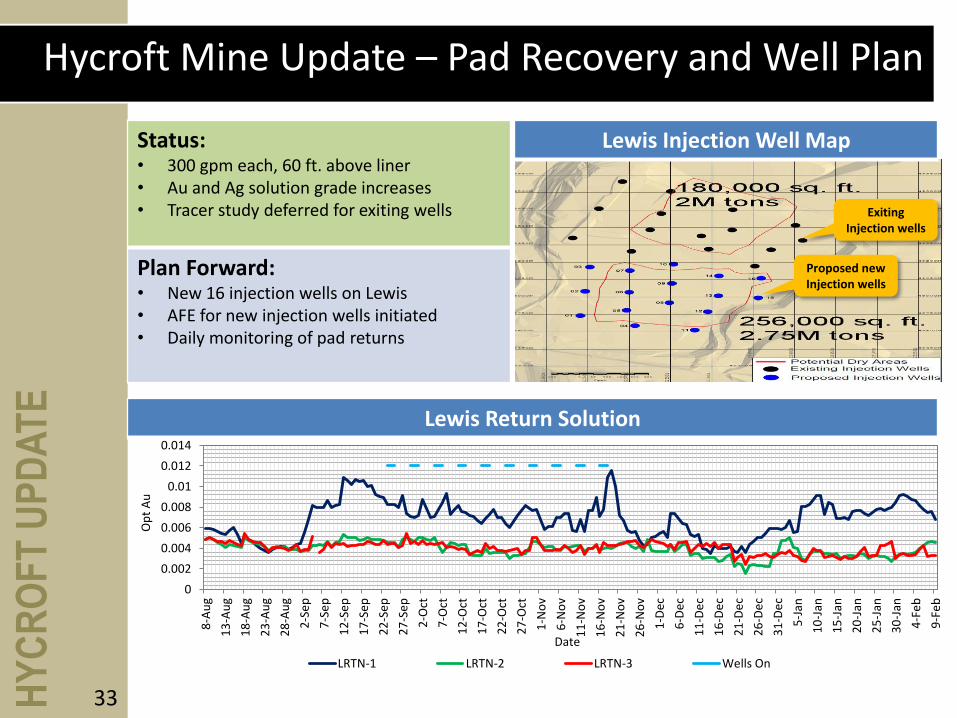
Hycroft Mine Update – Pad Recovery and Well Plan
0
0.002
0.004
0.006
0.008
0.01
0.012
0.014
8-A
ug
13
-Au
g
18
-Au
g
23
-Au
g
28
-Au
g
2-S
ep
7-S
ep
12
-Se
p
17
-Se
p
22
-Se
p
27
-Se
p
2-O
ct
7-O
ct
12
-Oct
17
-Oct
22
-Oct
27
-Oct
1-N
ov
6-N
ov
11
-No
v
16
-No
v
21
-No
v
26
-No
v
1-D
ec
6-D
ec
11
-De
c
16
-De
c
21
-De
c
26
-De
c
31
-De
c
5-J
an
10
-Jan
15
-Jan
20
-Jan
25
-Jan
30
-Jan
4-F
eb
9-F
eb
Op
t A
u
Date
LRTN-1 LRTN-2 LRTN-3 Wells On
Lewis Injection Well Map
Lewis Return Solution
Exiting Injection wells
Proposed new Injection wells
Status: • 300 gpm each, 60 ft. above liner • Au and Ag solution grade increases • Tracer study deferred for exiting wells
Plan Forward: • New 16 injection wells on Lewis • AFE for new injection wells initiated • Daily monitoring of pad returns
33 HY
CR
OF
T U
PD
AT
E

34
Reserve/Resource Update

Material Type
Tonnage AuFA Grade
AuCN Grade
AuCN/AuFA Ratio
AgFA Grade
AuFA oz AuCN oz AgFA oz
Leach Ore 27,277,079 0.0114 0.0074 64.9 0.241 310,250 201,296 6,575,839
Released Ore Control
Material Type
Tonnage AuFA Grade
AuCN Grade
AuCN/AuFA Ratio
AgFA Grade
AuFA oz AuCN oz AgFA oz
Leach Ore 25,647,983 0.0118 0.0082 71.2 0.235 303,145 209,529 6,031,460
Reserve Model
Positive Variances • 106% of Leach Tons • 103% of AgFA Grade • 102% of AuFA Ounces • 109% of AgFA Ounces
Negative Variances • 97% of AuFA Grade • 90% of AuCN Grade • 96% of AuCN Ounces
Rolling 6 Month Reconciliation
35 HY
CR
OF
T U
PD
AT
E

2013 Reconciliation
Material Type
Tonnage AuFA Grade
AuCN Grade
AuCN/AuFA Ratio
AgFA Grade
AuFA oz AuCN oz AgFA oz
Leach Ore 46,354,128 0.0113 0.0075 0.660 0.221 525,647 346,709 10,240,408
Released Ore Control
Material Type
Tonnage AuFA Grade
AuCN Grade
AuCN/AuFA Ratio
AgFA Grade
AuFA oz AuCN oz AgFA oz
Leach Ore 39,361,480 0.0110 0.0073 0.667 0.235 432,428 288,480 9,250,877
Reserve Model
Positive Variances • 118% of Leach Tons • 103% of AuFA Grade • 102% of AuCN Grade • 122% of AuFA Ounces • 120% of AuCN Ounces • 111% of AgFA Ounces
Negative Variances • 94% of AgFA Grade • 99% of AuCN/AuFA Ratio
36 HY
CR
OF
T U
PD
AT
E

Reconciliation by Material Types - 2013
Includes tons mined at Bay, Brimstone, and Gap Pits for 2013
Material Type Tons AuFA Grade AuCN Grade AuFA Oz AuCN Oz Gold Ratio
Waste 13,880,344
Oxide 13,903,387 0.0101 0.0078 140,582 108,940 0.77
Transitional 22,797,218 0.0124 0.0070 283,218 159,892 0.56
Sulfide 3,833,609 0.0204 0.0039 78,034 15,013 0.19
Total Ore Tons 40,534,214 0.0124 0.0070 501,834 283,845 0.57
Total Tons 54,414,558
Released Ore Control
Material Type Tons AuFA Grade AuCN Grade AuFA Oz AuCN Oz Gold Ratio
Waste 11,840,932
Oxide 13,954,404 0.0111 0.0101 154,688 140,283 0.91
Transitional 25,916,910 0.0116 0.0062 300,142 160,921 0.54
Sulfide 2,702,312 0.0180 0.0040 48,695 10,888 0.22
Total Ore Tons 42,573,626 0.0118 0.0073 503,525 312,092 0.62
Total Tons 54,414,558
Reserve Model
37 HY
CR
OF
T U
PD
AT
E
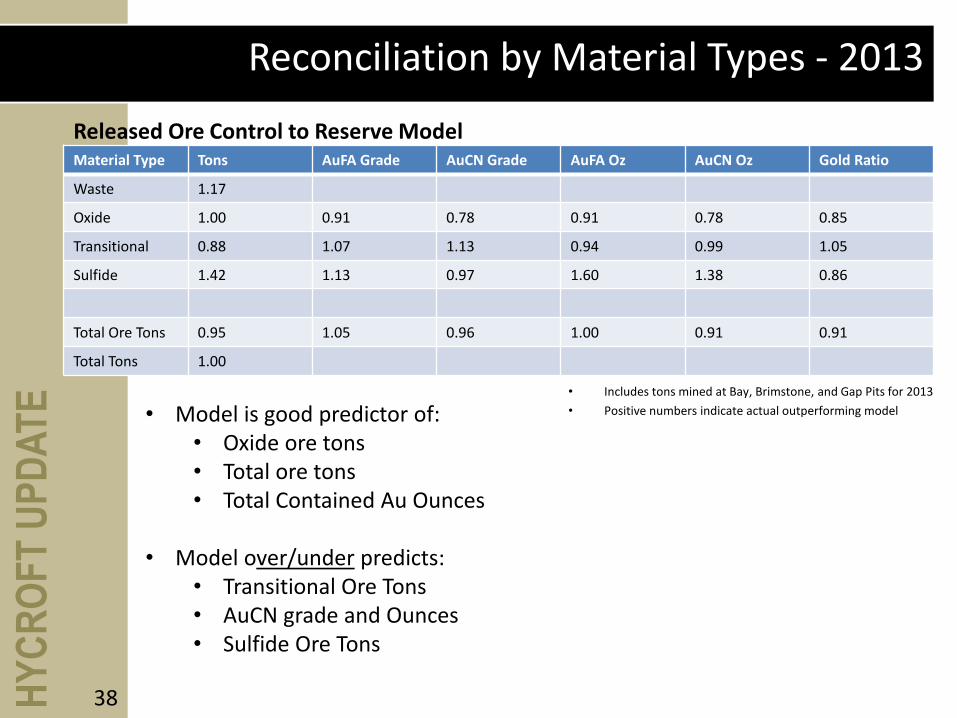
Reconciliation by Material Types - 2013
• Includes tons mined at Bay, Brimstone, and Gap Pits for 2013
• Positive numbers indicate actual outperforming model
Material Type Tons AuFA Grade AuCN Grade AuFA Oz AuCN Oz Gold Ratio
Waste 1.17
Oxide 1.00 0.91 0.78 0.91 0.78 0.85
Transitional 0.88 1.07 1.13 0.94 0.99 1.05
Sulfide 1.42 1.13 0.97 1.60 1.38 0.86
Total Ore Tons 0.95 1.05 0.96 1.00 0.91 0.91
Total Tons 1.00
Released Ore Control to Reserve Model
• Model is good predictor of: • Oxide ore tons • Total ore tons • Total Contained Au Ounces
• Model over/under predicts:
• Transitional Ore Tons • AuCN grade and Ounces • Sulfide Ore Tons
38 H
YC
RO
FT
UP
DA
TE

Shovel Efficiencies
4,500
5,000
5,500
6,000
6,500
7,000
7,500
8,000
8,500
9-Sep 23-Sep 7-Oct 21-Oct 4-Nov 18-Nov 2-Dec 16-Dec 30-Dec 13-Jan 27-Jan
Ton
s p
er
Ho
ur
Shovel Dig Rates 30 Day Moving Average
Shovel 6
Shovel 7
Linear (Shovel 6)
Linear (Shovel 7)
Dig rates do not include any wait or spot times. Truck load times only.
39 HY
CR
OF
T U
PD
AT
E

Shovel Efficiencies
75.0%
77.0%
79.0%
81.0%
83.0%
85.0%
87.0%
89.0%
Sept Oct Nov Dec Jan
Rope Shovel Availability and Utilization
Mechanical Utilization
40 HY
CR
OF
T U
PD
AT
E

Truck Efficiencies
Since the end of Q3:
• Average payload has increased from 290 tons to 305 tons per load – Goal is 320 tons per load
• Average operating hours has increased from 8 hours per shift to 9.7 hrs per shift
– Max possible with breaks and pre-shift inspection is 10.7 hrs
• First load has decreased by 6.6 minutes
0.0
5.0
10.0
15.0
20.0
25.0
30.0
Sep. Oct. Nov. Dec
First and Last Load Times (Minutes from start and end of shift)
First Load Last Load
41 HY
CR
OF
T U
PD
AT
E

Opportunities in 2014
• Increase payload – Dispatch has just started using the on-board truck scales to calculate daily production instead of a set payload
• Efficient drilling and blasting for optimum dig rates
• Improved planning for large shovels
– Shovels should be scheduled at 2 side loading 75% of the time
– Increase in TPH is estimated to be 1,000 TPH
• Improved utilization of truck fleet
• Drilling of fill material in Q4 increased oxide ore for 2014-2015 by 11.3 million tons and 106,000 ounces AuFA
42 HY
CR
OF
T U
PD
AT
E

2013 Flow and Ounces -v- Plan
0
5000
10000
15000
20000
25000
30000
Combined Flow
Flow Target
Hycroft Combined Flow-v- Targets
0
200
400
600
800
1000
1200
Au Produced
Budget
43 HY
CR
OF
T U
PD
AT
E

Leach Model Performance
• Major variance to model is application rate (0.002 v 0.0025)
• Impacts “Rate” of recovery
• Since February 2014 we have returned to an application rate of 0.0025 on the North Pad
• We expect to return to the recovery rate per the model predictions
44 HY
CR
OF
T U
PD
AT
E


![140221 EISTI Financial Analysis [Mode de Compatibilitu00E9]](https://img.pdfslide.us/doc/110x75/55cf9161550346f57b8d154a/140221-eisti-financial-analysis-mode-de-compatibilitu00e9.jpg)