Embed Size (px)
Citation preview

www.harriswilliams.com
Investment banking services are provided by Harris Williams LLC, a registered broker-dealer and member of FINRA and SIPC, and Harris Williams & Co. Ltd, which is authorised andregulated by the Financial Conduct Authority. Harris Williams & Co. is a trade name under which Harris Williams LLC and Harris Williams & Co. Ltd conduct business.
EUROPEAN TECHNOLOGY
0
INDUSTRY UPDATE │ NOVEMBER 2016
PAGE |
www.harriswilliams.com
HARRIS WILLIAMS & CO. OVERVIEW
1
EUROPEAN TECHNOLOGY
INDUSTRY UPDATE │ NOVEMBER 2016
CONTENTS
CASE STUDY
INDUSTRY INSIGHT
RECENT TRANSACTIONS
PUBLIC MARKET TRADING
SOFTWARE
IT SERVICES
COMMUNICATIONS
INTERNET AND DIGITAL MEDIA
TMT GROUP OVERVIEW
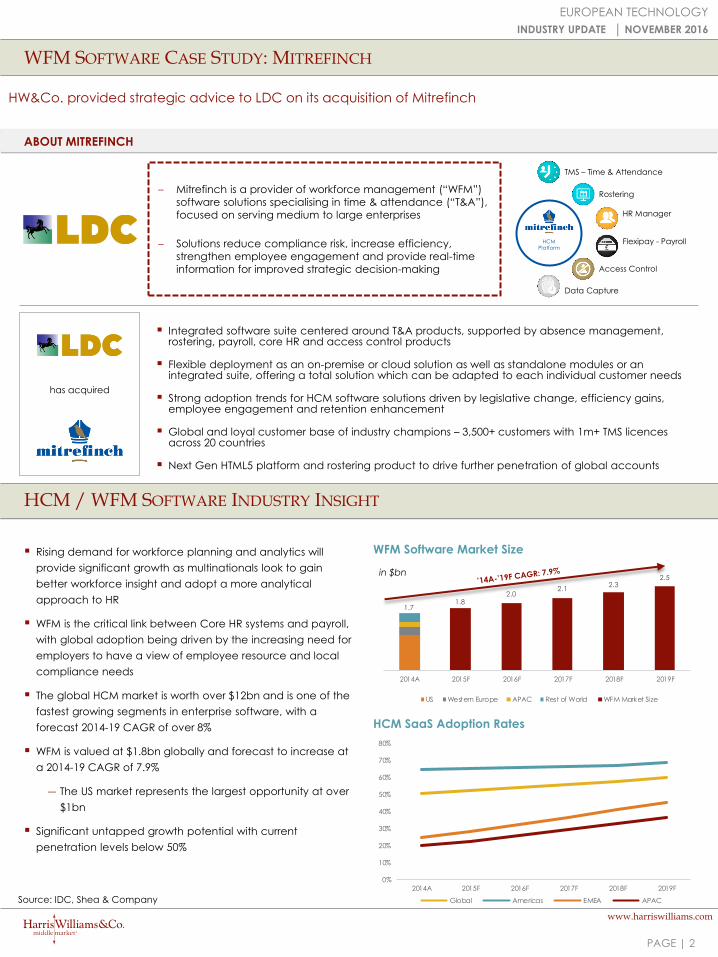
Our Technology, Media & Telecom (TMT) Group is dedicated to providing superior merger & acquisition and capital markets advisory services to market leading companies. Our extensive industry knowledge and transaction leadership experience spans the software, digital media, IT Services and communications sectors. Our professionals in London, Boston and San Francisco have global relationships with leading technology companies and financial investors. Thoughtful advice, deep experience and technology expertise, creativity and attention to detail from our senior technology bankers have resulted in a track record of consistently exceeding our clients' expectations.
CONTACTS
EUROPE
Thierry MonjauzeManaging [email protected]+44 (0) 20 7518 8901
Jonathan [email protected]+44 (0) 20 7518 8909
UNITED STATES
Jeff BistrongManaging [email protected]+1 (617) 482-7501
Michael WilkinsManaging [email protected]+1 (415) 288-4260
Sam HendlerManaging [email protected]+1 (617) 654-2117
HW&CO. TECHNOLOGY, MEDIA & TELECOM (TMT) GROUP FOCUS AREAS
SELECT RECENT HW&CO. TMT TRANSACTIONS
Enterprise Software
Data and
Analytics
Infrastructure and
Security Software
IT and Tech-
enabled Services
Data Centre and
Managed Services
AdTech and
Marketing Solutions
Consumer Internet
Mobile
Digital Media and
Content
eCommerce
SOFTWARE / SAAS AND SERVICES INTERNET & DIGITAL MEDIA
INTRODUCTION
Harris Williams & Co. is pleased to present our European Technology Industry
Update for November 2016. This report provides commentary and analysis on
current trading market trends, and merger and acquisition dynamics within the
technology industry.
We hope you find this edition helpful and we would encourage you to reach out to
either Thierry Monjauze or Jonathan Organ if you would like to discuss our
perspective on current industry trends and M&A opportunities or our relevant
industry experience.
Harris Williams & Co. is a leading advisor to the TMT industry. Our global practice has
significant experience that covers a broad range of sub-sectors and verticals.
a portfolio company of
has been acquired by
has acquired
a portfolio company of
a portfolio company of
has been acquired by
a portfolio company of
has been acquired by
a portfolio company of
has been acquired by
a portfolio company of
has been acquired by
Baarsma B2C trades as:
a portfolio company of
has been
recapitalized by
a portfolio company of
has been acquired by
a portfolio company of
has been acquired by
A majority stake in
has been acquired by
a portfolio company of
has been recapitalised
by
has acquired
PAGE |
www.harriswilliams.com
1.71.8
2.02.1
2.32.5
2014A 2015F 2016F 2017F 2018F 2019F
US Western Europe APAC Rest of World WFM Market Size
WFM SOFTWARE CASE STUDY: MITREFINCH
EUROPEAN TECHNOLOGY
INDUSTRY UPDATE │ NOVEMBER 2016
HW&Co. provided strategic advice to LDC on its acquisition of Mitrefinch
Rising demand for workforce planning and analytics will
provide significant growth as multinationals look to gain
better workforce insight and adopt a more analytical
approach to HR
WFM is the critical link between Core HR systems and payroll,
with global adoption being driven by the increasing need for
employers to have a view of employee resource and local
compliance needs
The global HCM market is worth over $12bn and is one of the
fastest growing segments in enterprise software, with a
forecast 2014-19 CAGR of over 8%
WFM is valued at $1.8bn globally and forecast to increase at
a 2014-19 CAGR of 7.9%
― The US market represents the largest opportunity at over
$1bn
Significant untapped growth potential with current
penetration levels below 50%
WFM Software Market Size
Source: IDC, Shea & Company
2
HCM SaaS Adoption Rates
Integrated software suite centered around T&A products, supported by absence management, rostering, payroll, core HR and access control products
Flexible deployment as an on-premise or cloud solution as well as standalone modules or an integrated suite, offering a total solution which can be adapted to each individual customer needs
Strong adoption trends for HCM software solutions driven by legislative change, efficiency gains, employee engagement and retention enhancement
Global and loyal customer base of industry champions – 3,500+ customers with 1m+ TMS licences across 20 countries
Next Gen HTML5 platform and rostering product to drive further penetration of global accounts
HCM / WFM SOFTWARE INDUSTRY INSIGHT
ABOUT MITREFINCH
– Mitrefinch is a provider of workforce management (“WFM”)
software solutions specialising in time & attendance (“T&A”),
focused on serving medium to large enterprises
– Solutions reduce compliance risk, increase efficiency,
strengthen employee engagement and provide real-time
information for improved strategic decision-making
has acquired
HR Manager
Flexipay - PayrollHCM Platform
TMS – Time & Attendance
Rostering
Access Control
Data Capture
in $bn
0%
10%
20%
30%
40%
50%
60%
70%
80%
2014A 2015F 2016F 2017F 2018F 2019F
Global Americas EMEA APAC
PAGE |
Close EV EV
Country Acquirer Country Date Target Description EV (m) LTM Rev. LTM EBITDA
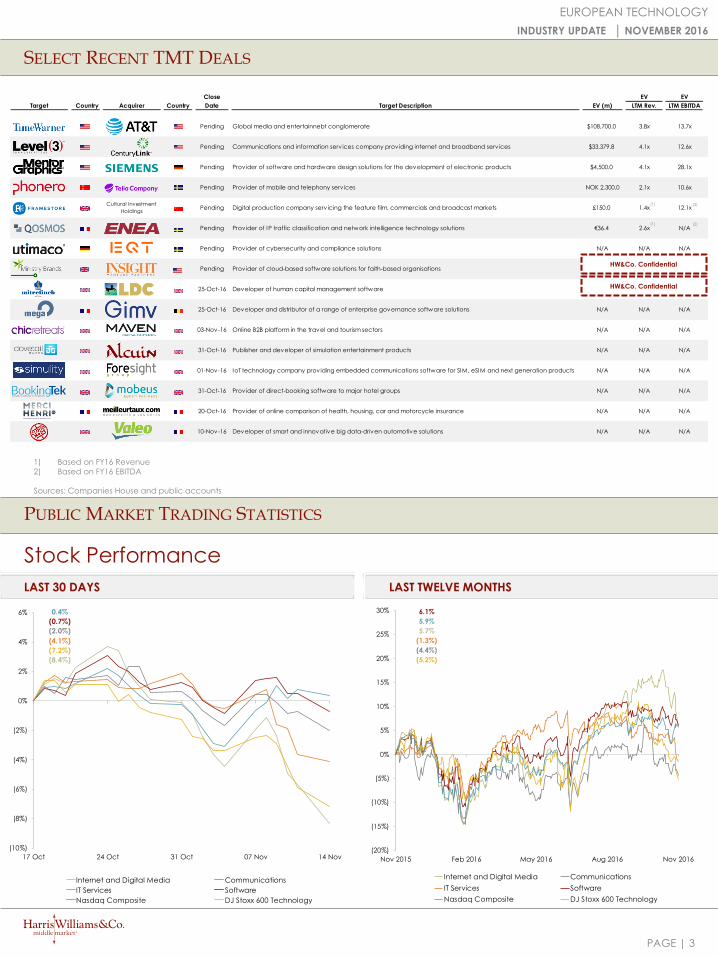
Pending Global media and entertainnebt conglomerate $108,700.0 3.8x 13.7x
Pending Communications and information serv ices company providing internet and broadband serv ices $33,379.8 4.1x 12.6x
Pending Provider of software and hardware design solutions for the development of electronic products $4,500.0 4.1x 28.1x
Pending Provider of mobile and telephony serv ices NOK 2,300.0 2.1x 10.6x
Cultural Investment
HoldingsPending Digital production company serv icing the feature film, commercials and broadcast markets £150.0 1.4x 12.1x
Pending Provider of IP traffic classification and network intelligence technology solutions €36.4 2.6x N/A
Pending Provider of cybersecurity and compliance solutions N/A N/A N/A
Pending Provider of cloud-based software solutions for faith-based organisations N/A N/A N/A
25-Oct-16 Developer of human capital management software N/A N/A N/A
25-Oct-16 Developer and distributor of a range of enterprise governance software solutions N/A N/A N/A
03-Nov-16 Online B2B platform in the travel and tourism sectors N/A N/A N/A
31-Oct-16 Publisher and developer of simulation entertainment products N/A N/A N/A
01-Nov-16 IoT technology company providing embedded communications software for SIM, eSIM and next generation products N/A N/A N/A
31-Oct-16 Provider of direct-booking software to major hotel groups N/A N/A N/A
20-Oct-16 Provider of online comparison of health, housing, car and motorcycle insurance N/A N/A N/A
10-Nov-16 Developer of smart and innovative big data-driven automotive solutions N/A N/A N/A
Target
HW&Co. Confidential
(10%)
(8%)
(6%)
(4%)
(2%)
0%
2%
4%
6%
17 Oct 24 Oct 31 Oct 07 Nov 14 Nov
Internet and Digital Media Communications
IT Services Software
Nasdaq Composite DJ Stoxx 600 Technology
(20%)
(15%)
(10%)
(5%)
0%
5%
10%
15%
20%
25%
30%
Nov 2015 Feb 2016 May 2016 Aug 2016 Nov 2016
Internet and Digital Media Communications
IT Services Software
Nasdaq Composite DJ Stoxx 600 Technology
SELECT RECENT TMT DEALS
3
EUROPEAN TECHNOLOGY
INDUSTRY UPDATE │ NOVEMBER 2016
LAST TWELVE MONTHS
Stock Performance
LAST 30 DAYS
PUBLIC MARKET TRADING STATISTICS
6.1%
5.9%
5.7%
(1.3%)
(4.4%)
(5.2%)
0.4%
(0.7%)
(2.0%)
(4.1%)
(7.2%)
(8.4%)
(2)
1) Based on FY16 Revenue
2) Based on FY16 EBITDA
Sources: Companies House and public accounts
(1)
(1) (2)
HW&Co. Confidential
PAGE |
PUBLIC MARKET TRADING STATISTICS
4
EUROPEAN TECHNOLOGY
INDUSTRY UPDATE │ NOVEMBER 2016
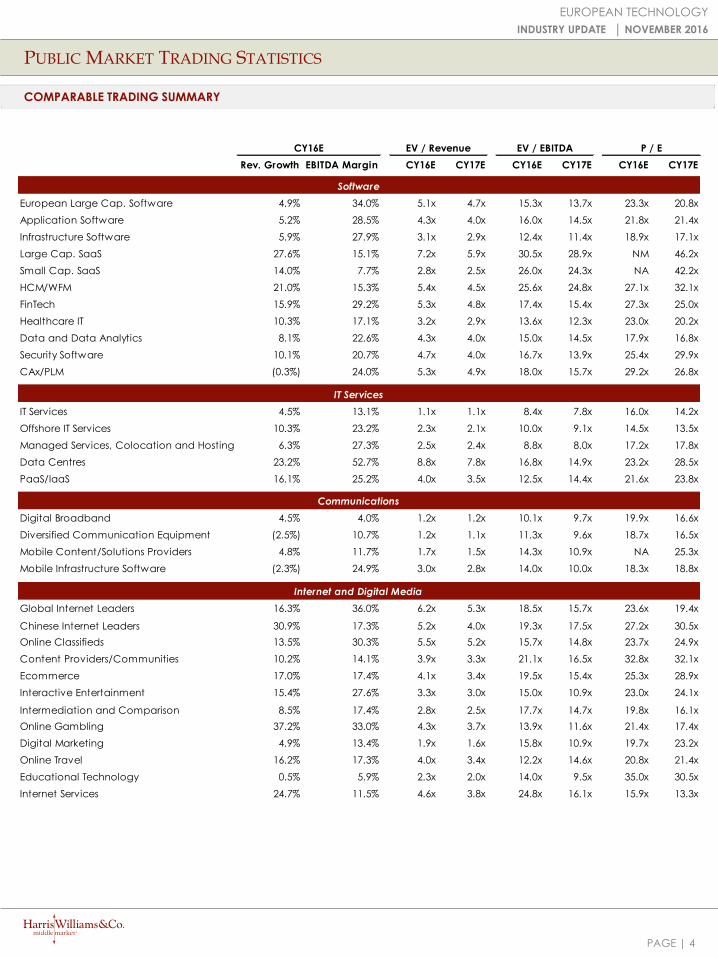
COMPARABLE TRADING SUMMARY
Rev. Growth EBITDA Margin CY16E CY17E CY16E CY17E CY16E CY17E
Software
European Large Cap. Software 4.9% 34.0% 5.1x 4.7x 15.3x 13.7x 23.3x 20.8x
Application Software 5.2% 28.5% 4.3x 4.0x 16.0x 14.5x 21.8x 21.4x
Infrastructure Software 5.9% 27.9% 3.1x 2.9x 12.4x 11.4x 18.9x 17.1x
Large Cap. SaaS 27.6% 15.1% 7.2x 5.9x 30.5x 28.9x NM 46.2x
Small Cap. SaaS 14.0% 7.7% 2.8x 2.5x 26.0x 24.3x NA 42.2x
HCM/WFM 21.0% 15.3% 5.4x 4.5x 25.6x 24.8x 27.1x 32.1x
FinTech 15.9% 29.2% 5.3x 4.8x 17.4x 15.4x 27.3x 25.0x
Healthcare IT 10.3% 17.1% 3.2x 2.9x 13.6x 12.3x 23.0x 20.2x
Data and Data Analytics 8.1% 22.6% 4.3x 4.0x 15.0x 14.5x 17.9x 16.8x
Security Software 10.1% 20.7% 4.7x 4.0x 16.7x 13.9x 25.4x 29.9x
CAx/PLM (0.3%) 24.0% 5.3x 4.9x 18.0x 15.7x 29.2x 26.8x
IT Services
IT Services 4.5% 13.1% 1.1x 1.1x 8.4x 7.8x 16.0x 14.2x
Offshore IT Services 10.3% 23.2% 2.3x 2.1x 10.0x 9.1x 14.5x 13.5x
Managed Services, Colocation and Hosting 6.3% 27.3% 2.5x 2.4x 8.8x 8.0x 17.2x 17.8x
Data Centres 23.2% 52.7% 8.8x 7.8x 16.8x 14.9x 23.2x 28.5x
PaaS/IaaS 16.1% 25.2% 4.0x 3.5x 12.5x 14.4x 21.6x 23.8x
Communications
Digital Broadband 4.5% 4.0% 1.2x 1.2x 10.1x 9.7x 19.9x 16.6x
Diversified Communication Equipment (2.5%) 10.7% 1.2x 1.1x 11.3x 9.6x 18.7x 16.5x
Mobile Content/Solutions Providers 4.8% 11.7% 1.7x 1.5x 14.3x 10.9x NA 25.3x
Mobile Infrastructure Software (2.3%) 24.9% 3.0x 2.8x 14.0x 10.0x 18.3x 18.8x
Internet and Digital Media
Global Internet Leaders 16.3% 36.0% 6.2x 5.3x 18.5x 15.7x 23.6x 19.4x
Chinese Internet Leaders 30.9% 17.3% 5.2x 4.0x 19.3x 17.5x 27.2x 30.5x
Online Classifieds 13.5% 30.3% 5.5x 5.2x 15.7x 14.8x 23.7x 24.9x
Content Providers/Communities 10.2% 14.1% 3.9x 3.3x 21.1x 16.5x 32.8x 32.1x
Ecommerce 17.0% 17.4% 4.1x 3.4x 19.5x 15.4x 25.3x 28.9x
Interactive Entertainment 15.4% 27.6% 3.3x 3.0x 15.0x 10.9x 23.0x 24.1x
Intermediation and Comparison 8.5% 17.4% 2.8x 2.5x 17.7x 14.7x 19.8x 16.1x
Online Gambling 37.2% 33.0% 4.3x 3.7x 13.9x 11.6x 21.4x 17.4x
Digital Marketing 4.9% 13.4% 1.9x 1.6x 15.8x 10.9x 19.7x 23.2x
Online Travel 16.2% 17.3% 4.0x 3.4x 12.2x 14.6x 20.8x 21.4x
Educational Technology 0.5% 5.9% 2.3x 2.0x 14.0x 9.5x 35.0x 30.5x
Internet Services 24.7% 11.5% 4.6x 3.8x 24.8x 16.1x 15.9x 13.3x
P / EEV / Revenue EV / EBITDACY16E
PAGE |
(15%)
(10%)
(5%)
0%
5%
10%
15%
17 Oct 24 Oct 31 Oct 07 Nov
Application Software CAx/PLM Data and Data Analytics European Large Cap. Software
Fintech HCM/WFM Healthcare IT Infrastructure Software
Large Cap. SaaS Security Software Small Cap. SaaS
SOFTWARE
5
EUROPEAN TECHNOLOGY
INDUSTRY UPDATE │ NOVEMBER 2016
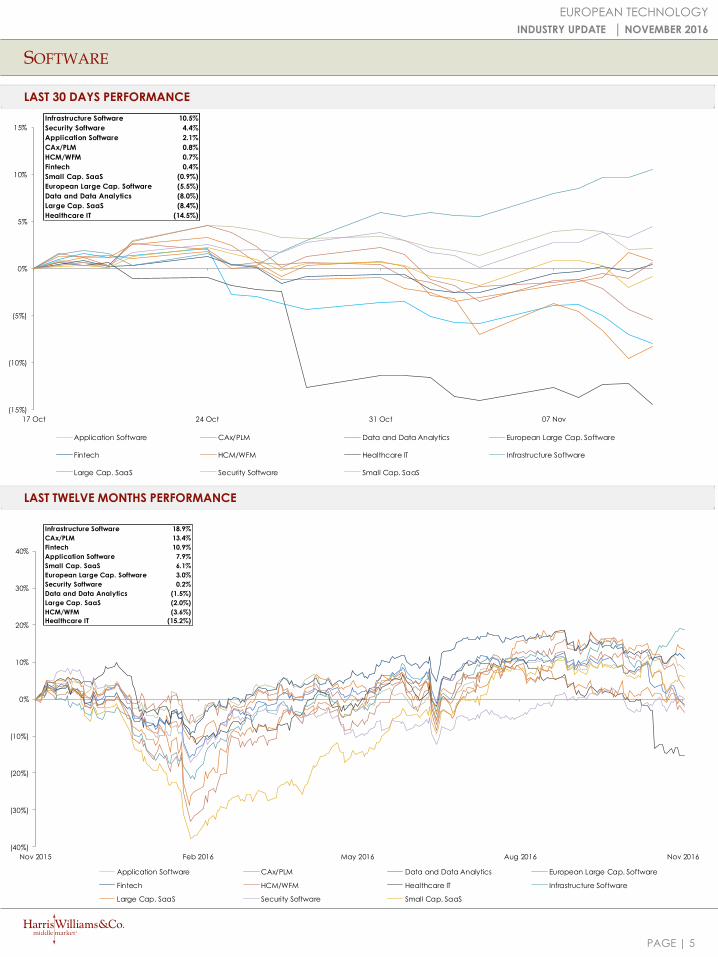
LAST 30 DAYS PERFORMANCE
LAST TWELVE MONTHS PERFORMANCE
(40%)
(30%)
(20%)
(10%)
0%
10%
20%
30%
40%
Nov 2015 Feb 2016 May 2016 Aug 2016 Nov 2016
Application Software CAx/PLM Data and Data Analytics European Large Cap. Software
Fintech HCM/WFM Healthcare IT Infrastructure Software
Large Cap. SaaS Security Software Small Cap. SaaS
Infrastructure Software 10.5%
Security Software 4.4%
Application Software 2.1%
CAx/PLM 0.8%
HCM/WFM 0.7%
Fintech 0.4%
Small Cap. SaaS (0.9%)
European Large Cap. Software (5.5%)
Data and Data Analytics (8.0%)
Large Cap. SaaS (8.4%)
Healthcare IT (14.5%)
Infrastructure Software 18.9%
CAx/PLM 13.4%
Fintech 10.9%
Application Software 7.9%
Small Cap. SaaS 6.1%
European Large Cap. Software 3.0%
Security Software 0.2%
Data and Data Analytics (1.5%)
Large Cap. SaaS (2.0%)
HCM/WFM (3.6%)
Healthcare IT (15.2%)

PAGE |
Enterprise Market As a 1-Year 3-Year CY16E EV/ EV/ Price /
Value Cap. percent of Stock Stock Rev. EBITDA Revenue EBITDA Earnings
($m) ($m) 52-wk High Perf. Perf. Growth Margin CY16E CY17E CY16E CY17E CY16E CY17E
European Large Cap. Software
SAP 102,136 100,129 87.9% 5.0% (0.7%) 4.4% 32.8% 4.3x 4.1x 13.2x 12.2x 20.0x 17.9x
Dassault Systemes 17,355 19,148 83.3% (4.2%) 27.9% 5.6% 33.7% 5.3x 4.9x 15.8x 14.2x 28.3x 25.5x
Sage 9,155 8,749 81.6% (1.0%) 44.4% (7.2%) 28.8% 4.6x 4.1x 15.8x 14.1x 22.9x 20.1x
Micro Focus 5,878 4,824 87.7% 0.1% 82.9% 21.3% 45.5% 4.4x 4.2x 9.6x 8.3x 13.0x 12.0x
Temenos 4,767 4,380 90.3% 34.3% 144.7% 15.6% 36.2% 7.6x 7.0x 21.0x 18.7x 30.5x 26.6x
Aveva 1,186 1,346 59.3% (32.4%) (49.1%) (10.1%) 26.8% 4.4x 4.2x 16.5x 14.6x 25.1x 22.8x
Mean 23,413 23,096 81.7% 0.3% 41.7% 4.9% 34.0% 5.1x 4.7x 15.3x 13.7x 23.3x 20.8x
Median 7,516 6,786 85.5% (0.4%) 36.1% 5.0% 33.3% 4.5x 4.2x 15.8x 14.1x 24.0x 21.4x
Application Software
Microsoft 351,910 404,657 90.6% 10.9% 47.8% 0.5% 37.7% 3.8x 3.6x 10.0x 9.4x 17.9x 16.6x
Oracle 150,507 159,956 92.8% 2.2% 11.6% (0.2%) 44.8% 4.0x 3.9x 9.0x 8.6x 14.8x 14.1x
SAP 102,136 100,129 87.9% 5.0% (0.7%) 4.4% 32.8% 4.3x 4.1x 13.2x 12.2x 20.0x 17.9x
Intuit 29,340 28,636 94.9% 14.5% 50.7% 10.3% 37.9% 6.1x 5.6x 16.0x 14.4x 27.6x 24.1x
Constellation Software 9,778 9,736 94.7% 10.2% 138.1% 15.8% 25.5% 4.6x 4.1x 18.0x 15.8x 24.5x 20.8x
Sage 9,155 8,749 81.6% (1.0%) 44.4% (7.2%) 28.8% 4.6x 4.1x 15.8x 14.1x 22.9x 20.1x
Tyler Technologies 5,745 5,478 81.3% (11.9%) 52.6% 31.0% 29.4% 7.4x 6.7x 25.2x 22.4x NM 37.8x
Guidewire Software 3,473 4,090 85.6% (3.5%) 16.6% 12.4% 20.8% 7.8x 6.9x 37.3x 33.5x NM NM
Cegid 612 554 99.2% 46.7% 189.2% 7.4% 27.8% 1.9x 1.8x 6.7x 6.2x 18.2x 16.2x
SDL 429 443 77.7% (13.7%) 27.7% (22.5%) 12.2% 1.4x 1.4x 11.5x 9.9x 18.4x 16.2x
American Software 238 309 88.8% 7.6% 16.1% 5.8% 15.4% 2.0x 2.0x 13.3x 13.1x 31.4x 30.4x
Mean 60,302 65,703 88.6% 6.1% 54.0% 5.2% 28.5% 4.3x 4.0x 16.0x 14.5x 21.8x 21.4x
Median 9,155 8,749 88.8% 5.0% 44.4% 5.8% 28.8% 4.3x 4.1x 13.3x 13.1x 20.0x 19.0x
Infrastructure Software
Hewlett-Packard Enterpise 39,933 30,692 93.0% NA NA (2.7%) 16.1% 0.8x 0.8x 4.9x 4.9x 9.5x 9.0x
VMware 25,955 31,666 97.2% 29.8% (2.5%) 6.1% 36.1% 3.7x 3.5x 10.2x 9.7x 17.6x 16.4x
Red Hat 13,474 13,793 90.9% (2.9%) 63.0% 18.2% 26.7% 5.7x 5.0x 21.3x 18.4x 35.0x 29.9x
Citrix Systems 13,177 13,281 94.5% 7.1% 49.5% 4.1% 34.8% 3.9x 3.7x 11.1x 11.0x 16.4x 15.8x
CA Technologies 12,444 13,038 89.1% 16.0% (5.1%) (0.6%) 37.4% 3.1x 3.0x 8.2x 8.1x 12.4x 12.0x
F5 Networks 8,851 9,346 99.4% 36.4% 69.1% 5.0% 39.0% 4.4x 4.1x 11.1x 10.3x 19.0x 16.9x
Brocade 5,810 4,969 99.5% 22.7% 52.8% 4.3% 25.9% 2.5x 2.2x 9.5x 9.0x 13.0x 12.2x
Netscout Systems 3,006 2,990 96.3% (1.1%) 13.3% 31.7% 28.8% 2.6x 2.4x 9.0x 8.1x 17.3x 15.5x
Pegasystems 2,563 2,603 95.4% 19.1% 39.1% 14.7% 15.3% 3.3x 2.9x 21.4x 19.1x 36.3x 30.5x
Software AG 2,548 2,750 79.4% 25.2% (9.2%) (0.7%) 32.0% 2.7x 2.6x 8.5x 8.1x 13.9x 13.3x
Progress Software 1,305 1,386 95.7% 19.1% 8.3% 0.3% 34.9% 3.2x 3.1x 9.1x 9.2x 17.9x 16.7x
Radware 357 564 77.3% (14.4%) (21.1%) (9.5%) 7.3% 1.8x 1.8x 24.8x 21.4x NM NM
Mean 10,785 10,590 92.3% 14.3% 23.4% 5.9% 27.9% 3.1x 2.9x 12.4x 11.4x 18.9x 17.1x
Median 7,330 7,157 94.9% 19.1% 13.3% 4.2% 30.4% 3.1x 3.0x 9.8x 9.4x 17.3x 15.8x
Large Cap. SaaS
Salesforce 53,013 50,443 87.9% (2.6%) 29.5% 24.7% 20.5% 6.5x 5.3x 31.6x 25.4x NM NM
Workday 14,441 15,890 86.8% 0.6% 7.0% 34.8% 8.1% 9.5x 7.2x NM NM NM NM
The Ultimate Software Group 5,923 5,730 88.1% (1.3%) 25.4% 26.3% 23.9% 7.6x 6.1x 31.8x 25.0x NM 49.4x
Veeva Systems 5,498 5,531 95.4% 50.4% 5.2% 28.9% 28.2% 10.6x 8.7x 37.7x 29.8x NM NM
Athenahealth 4,268 4,053 60.2% (37.0%) (23.1%) 18.8% 22.1% 3.9x 3.3x 17.6x 14.7x NM 46.9x
Guidewire Software 3,473 4,090 85.6% (3.5%) 16.6% 12.4% 20.8% 7.8x 6.9x 37.3x 33.5x NM NM
Medidata Solutions 3,164 3,228 97.9% 27.3% (1.7%) 18.3% 21.8% 6.8x 5.7x 31.2x 24.9x NM 45.7x
LogMeIn 2,354 2,544 95.0% 40.8% 211.8% 23.5% 26.7% 7.0x 6.1x 26.3x 22.3x NM 43.0x
Cornerstone OnDemand 2,142 2,144 80.3% 11.3% (21.4%) 24.6% 6.9% 5.1x 4.4x NM 47.2x NM NM
Paylocity 1,635 1,714 67.2% (22.3%) NA 37.6% 4.2% 6.2x 4.9x NM 36.9x NM NM
Xero 1,591 1,707 81.7% 1.8% (58.9%) 54.0% (16.5%) 8.1x 5.8x NM NM NM NM
Mean 8,864 8,825 84.2% 5.9% 19.1% 27.6% 15.1% 7.2x 5.9x 30.5x 28.9x NM 46.2x
Median 3,473 4,053 86.8% 0.6% 6.1% 24.7% 20.8% 7.0x 5.8x 31.6x 25.4x NM 46.3x
SOFTWARE
6
EUROPEAN TECHNOLOGY
INDUSTRY UPDATE │ NOVEMBER 2016
(1)
(3)
(1) Micro Focus has agreed to merge with Hewlett Packard Enterprise’s Software Business Segment; share price as at 7th July 2016
(2) Microsoft has agreed to acquire LinkedIn; share price as at 10th June 2016
(3) A consortium led by Silver Lake Partners and AltaOne Capital launched a tender offer to acquire Cegid Group; share price as at 15th April 2016
(2)
(1)
PAGE |
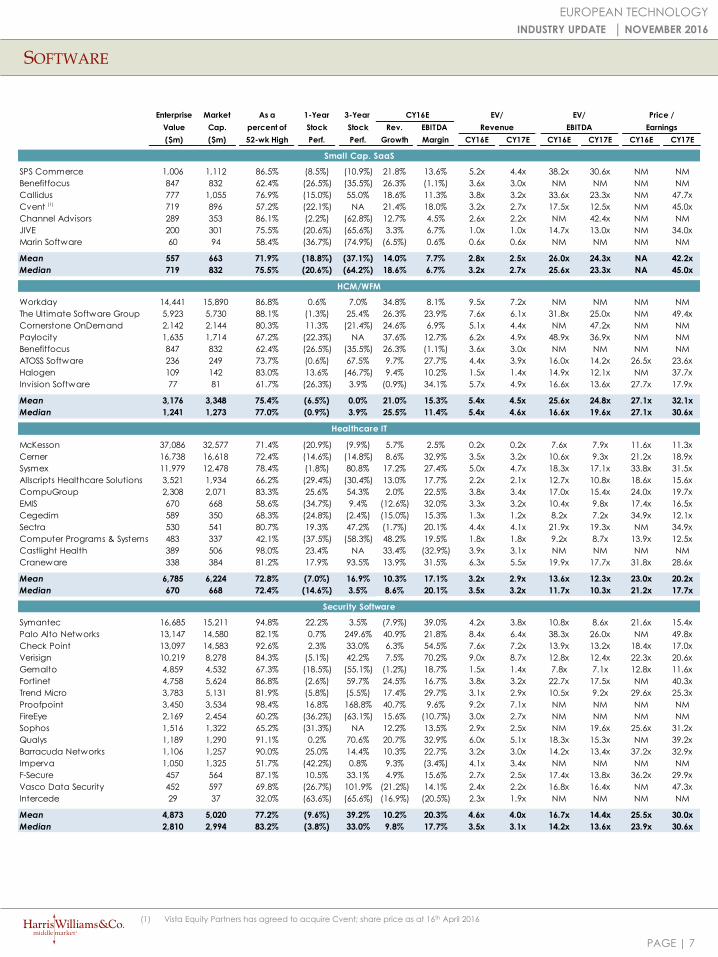
Enterprise Market As a 1-Year 3-Year CY16E EV/ EV/ Price /
Value Cap. percent of Stock Stock Rev. EBITDA Revenue EBITDA Earnings
($m) ($m) 52-wk High Perf. Perf. Growth Margin CY16E CY17E CY16E CY17E CY16E CY17E
Small Cap. SaaS
SPS Commerce 1,006 1,112 86.5% (8.5%) (10.9%) 21.8% 13.6% 5.2x 4.4x 38.2x 30.6x NM NM
Benefitfocus 847 832 62.4% (26.5%) (35.5%) 26.3% (1.1%) 3.6x 3.0x NM NM NM NM
Callidus 777 1,055 76.9% (15.0%) 55.0% 18.6% 11.3% 3.8x 3.2x 33.6x 23.3x NM 47.7x
Cvent 719 896 57.2% (22.1%) NA 21.4% 18.0% 3.2x 2.7x 17.5x 12.5x NM 45.0x
Channel Advisors 289 353 86.1% (2.2%) (62.8%) 12.7% 4.5% 2.6x 2.2x NM 42.4x NM NM
JIVE 200 301 75.5% (20.6%) (65.6%) 3.3% 6.7% 1.0x 1.0x 14.7x 13.0x NM 34.0x
Marin Software 60 94 58.4% (36.7%) (74.9%) (6.5%) 0.6% 0.6x 0.6x NM NM NM NM
Mean 557 663 71.9% (18.8%) (37.1%) 14.0% 7.7% 2.8x 2.5x 26.0x 24.3x NA 42.2x
Median 719 832 75.5% (20.6%) (64.2%) 18.6% 6.7% 3.2x 2.7x 25.6x 23.3x NA 45.0x
HCM/WFM
Workday 14,441 15,890 86.8% 0.6% 7.0% 34.8% 8.1% 9.5x 7.2x NM NM NM NM
The Ultimate Software Group 5,923 5,730 88.1% (1.3%) 25.4% 26.3% 23.9% 7.6x 6.1x 31.8x 25.0x NM 49.4x
Cornerstone OnDemand 2,142 2,144 80.3% 11.3% (21.4%) 24.6% 6.9% 5.1x 4.4x NM 47.2x NM NM
Paylocity 1,635 1,714 67.2% (22.3%) NA 37.6% 12.7% 6.2x 4.9x 48.9x 36.9x NM NM
Benefitfocus 847 832 62.4% (26.5%) (35.5%) 26.3% (1.1%) 3.6x 3.0x NM NM NM NM
ATOSS Software 236 249 73.7% (0.6%) 67.5% 9.7% 27.7% 4.4x 3.9x 16.0x 14.2x 26.5x 23.6x
Halogen 109 142 83.0% 13.6% (46.7%) 9.4% 10.2% 1.5x 1.4x 14.9x 12.1x NM 37.7x
Invision Software 77 81 61.7% (26.3%) 3.9% (0.9%) 34.1% 5.7x 4.9x 16.6x 13.6x 27.7x 17.9x
Mean 3,176 3,348 75.4% (6.5%) 0.0% 21.0% 15.3% 5.4x 4.5x 25.6x 24.8x 27.1x 32.1x
Median 1,241 1,273 77.0% (0.9%) 3.9% 25.5% 11.4% 5.4x 4.6x 16.6x 19.6x 27.1x 30.6x
Healthcare IT
McKesson 37,086 32,577 71.4% (20.9%) (9.9%) 5.7% 2.5% 0.2x 0.2x 7.6x 7.9x 11.6x 11.3x
Cerner 16,738 16,618 72.4% (14.6%) (14.8%) 8.6% 32.9% 3.5x 3.2x 10.6x 9.3x 21.2x 18.9x
Sysmex 11,979 12,478 78.4% (1.8%) 80.8% 17.2% 27.4% 5.0x 4.7x 18.3x 17.1x 33.8x 31.5x
Allscripts Healthcare Solutions 3,521 1,934 66.2% (29.4%) (30.4%) 13.0% 17.7% 2.2x 2.1x 12.7x 10.8x 18.6x 15.6x
CompuGroup 2,308 2,071 83.3% 25.6% 54.3% 2.0% 22.5% 3.8x 3.4x 17.0x 15.4x 24.0x 19.7x
EMIS 670 668 58.6% (34.7%) 9.4% (12.6%) 32.0% 3.3x 3.2x 10.4x 9.8x 17.4x 16.5x
Cegedim 589 350 68.3% (24.8%) (2.4%) (15.0%) 15.3% 1.3x 1.2x 8.2x 7.2x 34.9x 12.1x
Sectra 530 541 80.7% 19.3% 47.2% (1.7%) 20.1% 4.4x 4.1x 21.9x 19.3x NM 34.9x
Computer Programs & Systems 483 337 42.1% (37.5%) (58.3%) 48.2% 19.5% 1.8x 1.8x 9.2x 8.7x 13.9x 12.5x
Castlight Health 389 506 98.0% 23.4% NA 33.4% (32.9%) 3.9x 3.1x NM NM NM NM
Craneware 338 384 81.2% 17.9% 93.5% 13.9% 31.5% 6.3x 5.5x 19.9x 17.7x 31.8x 28.6x
Mean 6,785 6,224 72.8% (7.0%) 16.9% 10.3% 17.1% 3.2x 2.9x 13.6x 12.3x 23.0x 20.2x
Median 670 668 72.4% (14.6%) 3.5% 8.6% 20.1% 3.5x 3.2x 11.7x 10.3x 21.2x 17.7x
Security Software
Symantec 16,685 15,211 94.8% 22.2% 3.5% (7.9%) 39.0% 4.2x 3.8x 10.8x 8.6x 21.6x 15.4x
Palo Alto Networks 13,147 14,580 82.1% 0.7% 249.6% 40.9% 21.8% 8.4x 6.4x 38.3x 26.0x NM 49.8x
Check Point 13,097 14,583 92.6% 2.3% 33.0% 6.3% 54.5% 7.6x 7.2x 13.9x 13.2x 18.4x 17.0x
Verisign 10,219 8,278 84.3% (5.1%) 42.2% 7.5% 70.2% 9.0x 8.7x 12.8x 12.4x 22.3x 20.6x
Gemalto 4,859 4,532 67.3% (18.5%) (55.1%) (1.2%) 18.7% 1.5x 1.4x 7.8x 7.1x 12.8x 11.6x
Fortinet 4,758 5,624 86.8% (2.6%) 59.7% 24.5% 16.7% 3.8x 3.2x 22.7x 17.5x NM 40.3x
Trend Micro 3,783 5,131 81.9% (5.8%) (5.5%) 17.4% 29.7% 3.1x 2.9x 10.5x 9.2x 29.6x 25.3x
Proofpoint 3,450 3,534 98.4% 16.8% 168.8% 40.7% 9.6% 9.2x 7.1x NM NM NM NM
FireEye 2,169 2,454 60.2% (36.2%) (63.1%) 15.6% (10.7%) 3.0x 2.7x NM NM NM NM
Sophos 1,516 1,322 65.2% (31.3%) NA 12.2% 13.5% 2.9x 2.5x NM 19.6x 25.6x 31.2x
Qualys 1,189 1,290 91.1% 0.2% 70.6% 20.7% 32.9% 6.0x 5.1x 18.3x 15.3x NM 39.2x
Barracuda Networks 1,106 1,257 90.0% 25.0% 14.4% 10.3% 22.7% 3.2x 3.0x 14.2x 13.4x 37.2x 32.9x
Imperva 1,050 1,325 51.7% (42.2%) 0.8% 9.3% (3.4%) 4.1x 3.4x NM NM NM NM
F-Secure 457 564 87.1% 10.5% 33.1% 4.9% 15.6% 2.7x 2.5x 17.4x 13.8x 36.2x 29.9x
Vasco Data Security 452 597 69.8% (26.7%) 101.9% (21.2%) 14.1% 2.4x 2.2x 16.8x 16.4x NM 47.3x
Intercede 29 37 32.0% (63.6%) (65.6%) (16.9%) (20.5%) 2.3x 1.9x NM NM NM NM
Mean 4,873 5,020 77.2% (9.6%) 39.2% 10.2% 20.3% 4.6x 4.0x 16.7x 14.4x 25.5x 30.0x
Median 2,810 2,994 83.2% (3.8%) 33.0% 9.8% 17.7% 3.5x 3.1x 14.2x 13.6x 23.9x 30.6x
SOFTWARE
7
EUROPEAN TECHNOLOGY
INDUSTRY UPDATE │ NOVEMBER 2016
(1)
(1) Vista Equity Partners has agreed to acquire Cvent; share price as at 16th April 2016
PAGE |
SOFTWARE
8
EUROPEAN TECHNOLOGY
INDUSTRY UPDATE │ NOVEMBER 2016
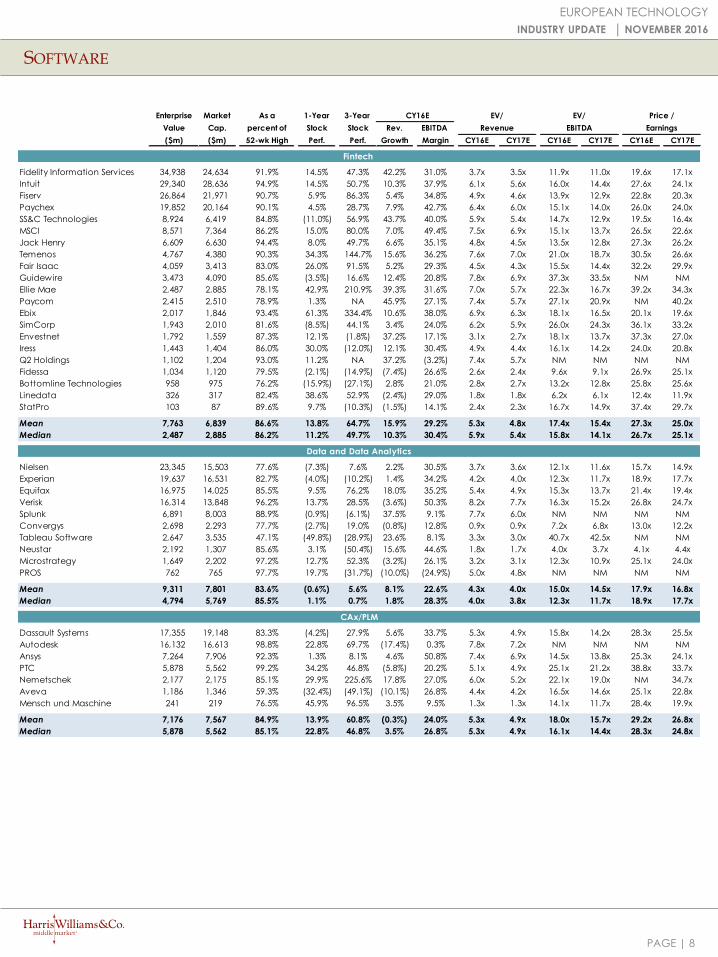
Enterprise Market As a 1-Year 3-Year CY16E EV/ EV/ Price /
Value Cap. percent of Stock Stock Rev. EBITDA Revenue EBITDA Earnings
($m) ($m) 52-wk High Perf. Perf. Growth Margin CY16E CY17E CY16E CY17E CY16E CY17E
Fintech
Fidelity Information Services 34,938 24,634 91.9% 14.5% 47.3% 42.2% 31.0% 3.7x 3.5x 11.9x 11.0x 19.6x 17.1x
Intuit 29,340 28,636 94.9% 14.5% 50.7% 10.3% 37.9% 6.1x 5.6x 16.0x 14.4x 27.6x 24.1x
Fiserv 26,864 21,971 90.7% 5.9% 86.3% 5.4% 34.8% 4.9x 4.6x 13.9x 12.9x 22.8x 20.3x
Paychex 19,852 20,164 90.1% 4.5% 28.7% 7.9% 42.7% 6.4x 6.0x 15.1x 14.0x 26.0x 24.0x
SS&C Technologies 8,924 6,419 84.8% (11.0%) 56.9% 43.7% 40.0% 5.9x 5.4x 14.7x 12.9x 19.5x 16.4x
MSCI 8,571 7,364 86.2% 15.0% 80.0% 7.0% 49.4% 7.5x 6.9x 15.1x 13.7x 26.5x 22.6x
Jack Henry 6,609 6,630 94.4% 8.0% 49.7% 6.6% 35.1% 4.8x 4.5x 13.5x 12.8x 27.3x 26.2x
Temenos 4,767 4,380 90.3% 34.3% 144.7% 15.6% 36.2% 7.6x 7.0x 21.0x 18.7x 30.5x 26.6x
Fair Isaac 4,059 3,413 83.0% 26.0% 91.5% 5.2% 29.3% 4.5x 4.3x 15.5x 14.4x 32.2x 29.9x
Guidewire 3,473 4,090 85.6% (3.5%) 16.6% 12.4% 20.8% 7.8x 6.9x 37.3x 33.5x NM NM
Ellie Mae 2,487 2,885 78.1% 42.9% 210.9% 39.3% 31.6% 7.0x 5.7x 22.3x 16.7x 39.2x 34.3x
Paycom 2,415 2,510 78.9% 1.3% NA 45.9% 27.1% 7.4x 5.7x 27.1x 20.9x NM 40.2x
Ebix 2,017 1,846 93.4% 61.3% 334.4% 10.6% 38.0% 6.9x 6.3x 18.1x 16.5x 20.1x 19.6x
SimCorp 1,943 2,010 81.6% (8.5%) 44.1% 3.4% 24.0% 6.2x 5.9x 26.0x 24.3x 36.1x 33.2x
Envestnet 1,792 1,559 87.3% 12.1% (1.8%) 37.2% 17.1% 3.1x 2.7x 18.1x 13.7x 37.3x 27.0x
Iress 1,443 1,404 86.0% 30.0% (12.0%) 12.1% 30.4% 4.9x 4.4x 16.1x 14.2x 24.0x 20.8x
Q2 Holdings 1,102 1,204 93.0% 11.2% NA 37.2% (3.2%) 7.4x 5.7x NM NM NM NM
Fidessa 1,034 1,120 79.5% (2.1%) (14.9%) (7.4%) 26.6% 2.6x 2.4x 9.6x 9.1x 26.9x 25.1x
Bottomline Technologies 958 975 76.2% (15.9%) (27.1%) 2.8% 21.0% 2.8x 2.7x 13.2x 12.8x 25.8x 25.6x
Linedata 326 317 82.4% 38.6% 52.9% (2.4%) 29.0% 1.8x 1.8x 6.2x 6.1x 12.4x 11.9x
StatPro 103 87 89.6% 9.7% (10.3%) (1.5%) 14.1% 2.4x 2.3x 16.7x 14.9x 37.4x 29.7x
Mean 7,763 6,839 86.6% 13.8% 64.7% 15.9% 29.2% 5.3x 4.8x 17.4x 15.4x 27.3x 25.0x
Median 2,487 2,885 86.2% 11.2% 49.7% 10.3% 30.4% 5.9x 5.4x 15.8x 14.1x 26.7x 25.1x
Data and Data Analytics
Nielsen 23,345 15,503 77.6% (7.3%) 7.6% 2.2% 30.5% 3.7x 3.6x 12.1x 11.6x 15.7x 14.9x
Experian 19,637 16,531 82.7% (4.0%) (10.2%) 1.4% 34.2% 4.2x 4.0x 12.3x 11.7x 18.9x 17.7x
Equifax 16,975 14,025 85.5% 9.5% 76.2% 18.0% 35.2% 5.4x 4.9x 15.3x 13.7x 21.4x 19.4x
Verisk 16,314 13,848 96.2% 13.7% 28.5% (3.6%) 50.3% 8.2x 7.7x 16.3x 15.2x 26.8x 24.7x
Splunk 6,891 8,003 88.9% (0.9%) (6.1%) 37.5% 9.1% 7.7x 6.0x NM NM NM NM
Convergys 2,698 2,293 77.7% (2.7%) 19.0% (0.8%) 12.8% 0.9x 0.9x 7.2x 6.8x 13.0x 12.2x
Tableau Software 2,647 3,535 47.1% (49.8%) (28.9%) 23.6% 8.1% 3.3x 3.0x 40.7x 42.5x NM NM
Neustar 2,192 1,307 85.6% 3.1% (50.4%) 15.6% 44.6% 1.8x 1.7x 4.0x 3.7x 4.1x 4.4x
Microstrategy 1,649 2,202 97.2% 12.7% 52.3% (3.2%) 26.1% 3.2x 3.1x 12.3x 10.9x 25.1x 24.0x
PROS 762 765 97.7% 19.7% (31.7%) (10.0%) (24.9%) 5.0x 4.8x NM NM NM NM
Mean 9,311 7,801 83.6% (0.6%) 5.6% 8.1% 22.6% 4.3x 4.0x 15.0x 14.5x 17.9x 16.8x
Median 4,794 5,769 85.5% 1.1% 0.7% 1.8% 28.3% 4.0x 3.8x 12.3x 11.7x 18.9x 17.7x
CAx/PLM
Dassault Systems 17,355 19,148 83.3% (4.2%) 27.9% 5.6% 33.7% 5.3x 4.9x 15.8x 14.2x 28.3x 25.5x
Autodesk 16,132 16,613 98.8% 22.8% 69.7% (17.4%) 0.3% 7.8x 7.2x NM NM NM NM
Ansys 7,264 7,906 92.3% 1.3% 8.1% 4.6% 50.8% 7.4x 6.9x 14.5x 13.8x 25.3x 24.1x
PTC 5,878 5,562 99.2% 34.2% 46.8% (5.8%) 20.2% 5.1x 4.9x 25.1x 21.2x 38.8x 33.7x
Nemetschek 2,177 2,175 85.1% 29.9% 225.6% 17.8% 27.0% 6.0x 5.2x 22.1x 19.0x NM 34.7x
Aveva 1,186 1,346 59.3% (32.4%) (49.1%) (10.1%) 26.8% 4.4x 4.2x 16.5x 14.6x 25.1x 22.8x
Mensch und Maschine 241 219 76.5% 45.9% 96.5% 3.5% 9.5% 1.3x 1.3x 14.1x 11.7x 28.4x 19.9x
Mean 7,176 7,567 84.9% 13.9% 60.8% (0.3%) 24.0% 5.3x 4.9x 18.0x 15.7x 29.2x 26.8x
Median 5,878 5,562 85.1% 22.8% 46.8% 3.5% 26.8% 5.3x 4.9x 16.1x 14.4x 28.3x 24.8x
PAGE |
(15%)
(10%)
(5%)
0%
5%
10%
15%
17 Oct 24 Oct 31 Oct 07 Nov 14 Nov
Data Centres IT Services Managed Services, Colocation and Hosting Offshore IT Services PaaS/IaaS
(20%)
(10%)
0%
10%
20%
30%
40%
50%
Nov 2015 Feb 2016 May 2016 Aug 2016 Nov 2016
Data Centres IT Services Managed Services, Colocation and Hosting Offshore IT Services PaaS/IaaS
IT SERVICES
9
EUROPEAN TECHNOLOGY
INDUSTRY UPDATE │ NOVEMBER 2016
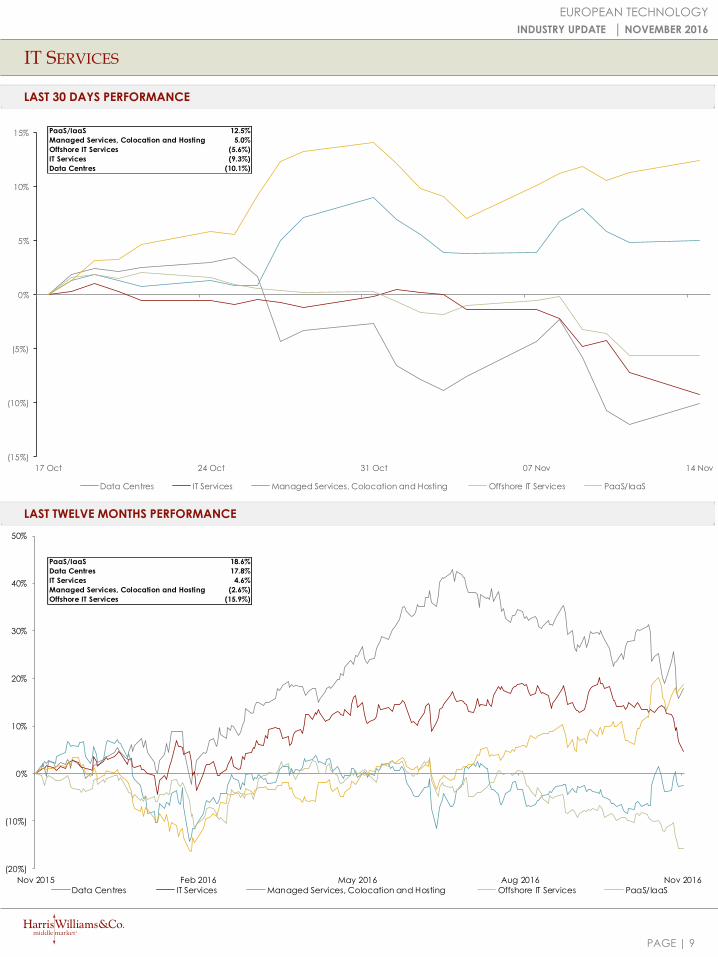
LAST 30 DAYS PERFORMANCE
LAST TWELVE MONTHS PERFORMANCE
PaaS/IaaS 18.6%
Data Centres 17.8%
IT Services 4.6%
Managed Services, Colocation and Hosting (2.6%)
Offshore IT Services (15.9%)
PaaS/IaaS 12.5%
Managed Services, Colocation and Hosting 5.0%
Offshore IT Services (5.6%)
IT Services (9.3%)
Data Centres (10.1%)
PAGE |
Enterprise Market As a 1-Year 3-Year CY16E EV/ EV/ Price /
Value Cap. percent of Stock Stock Rev. EBITDA Revenue EBITDA Earnings
($m) ($m) 52-wk High Perf. Perf. Growth Margin CY16E CY17E CY16E CY17E CY16E CY17E
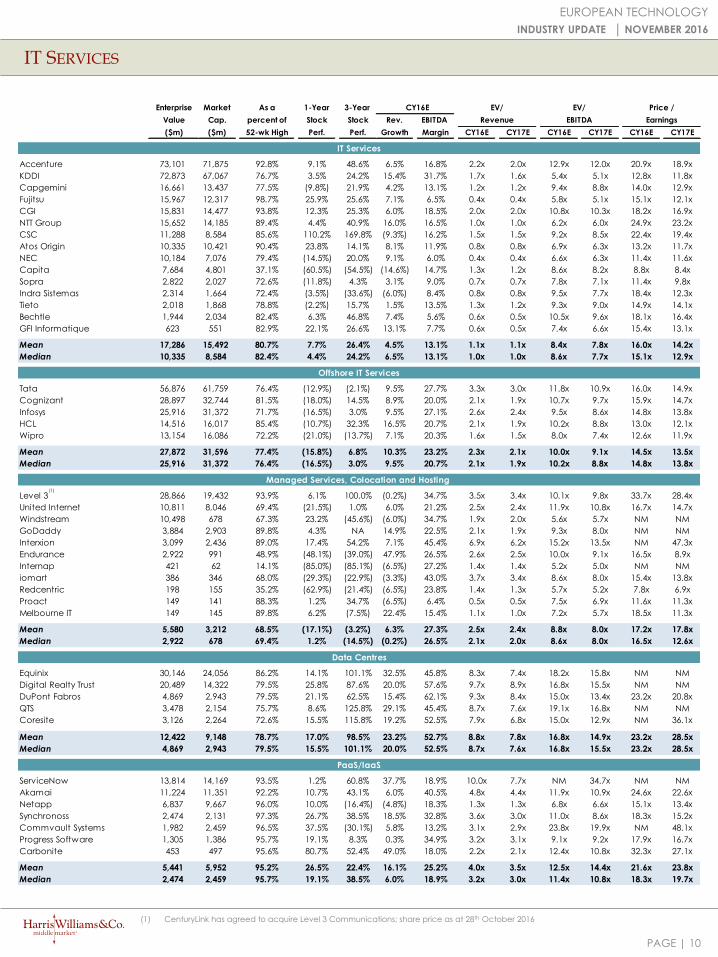
IT Services
Accenture 73,101 71,875 92.8% 9.1% 48.6% 6.5% 16.8% 2.2x 2.0x 12.9x 12.0x 20.9x 18.9x
KDDI 72,873 67,067 76.7% 3.5% 24.2% 15.4% 31.7% 1.7x 1.6x 5.4x 5.1x 12.8x 11.8x
Capgemini 16,661 13,437 77.5% (9.8%) 21.9% 4.2% 13.1% 1.2x 1.2x 9.4x 8.8x 14.0x 12.9x
Fujitsu 15,967 12,317 98.7% 25.9% 25.6% 7.1% 6.5% 0.4x 0.4x 5.8x 5.1x 15.1x 12.1x
CGI 15,831 14,477 93.8% 12.3% 25.3% 6.0% 18.5% 2.0x 2.0x 10.8x 10.3x 18.2x 16.9x
NTT Group 15,652 14,185 89.4% 4.4% 40.9% 16.0% 16.5% 1.0x 1.0x 6.2x 6.0x 24.9x 23.2x
CSC 11,288 8,584 85.6% 110.2% 169.8% (9.3%) 16.2% 1.5x 1.5x 9.2x 8.5x 22.4x 19.4x
Atos Origin 10,335 10,421 90.4% 23.8% 14.1% 8.1% 11.9% 0.8x 0.8x 6.9x 6.3x 13.2x 11.7x
NEC 10,184 7,076 79.4% (14.5%) 20.0% 9.1% 6.0% 0.4x 0.4x 6.6x 6.3x 11.4x 11.6x
Capita 7,684 4,801 37.1% (60.5%) (54.5%) (14.6%) 14.7% 1.3x 1.2x 8.6x 8.2x 8.8x 8.4x
Sopra 2,822 2,027 72.6% (11.8%) 4.3% 3.1% 9.0% 0.7x 0.7x 7.8x 7.1x 11.4x 9.8x
Indra Sistemas 2,314 1,664 72.4% (3.5%) (33.6%) (6.0%) 8.4% 0.8x 0.8x 9.5x 7.7x 18.4x 12.3x
Tieto 2,018 1,868 78.8% (2.2%) 15.7% 1.5% 13.5% 1.3x 1.2x 9.3x 9.0x 14.9x 14.1x
Bechtle 1,944 2,034 82.4% 6.3% 46.8% 7.4% 5.6% 0.6x 0.5x 10.5x 9.6x 18.1x 16.4x
GFI Informatique 623 551 82.9% 22.1% 26.6% 13.1% 7.7% 0.6x 0.5x 7.4x 6.6x 15.4x 13.1x
Mean 17,286 15,492 80.7% 7.7% 26.4% 4.5% 13.1% 1.1x 1.1x 8.4x 7.8x 16.0x 14.2x
Median 10,335 8,584 82.4% 4.4% 24.2% 6.5% 13.1% 1.0x 1.0x 8.6x 7.7x 15.1x 12.9x
Offshore IT Services
Tata 56,876 61,759 76.4% (12.9%) (2.1%) 9.5% 27.7% 3.3x 3.0x 11.8x 10.9x 16.0x 14.9x
Cognizant 28,897 32,744 81.5% (18.0%) 14.5% 8.9% 20.0% 2.1x 1.9x 10.7x 9.7x 15.9x 14.7x
Infosys 25,916 31,372 71.7% (16.5%) 3.0% 9.5% 27.1% 2.6x 2.4x 9.5x 8.6x 14.8x 13.8x
HCL 14,516 16,017 85.4% (10.7%) 32.3% 16.5% 20.7% 2.1x 1.9x 10.2x 8.8x 13.0x 12.1x
Wipro 13,154 16,086 72.2% (21.0%) (13.7%) 7.1% 20.3% 1.6x 1.5x 8.0x 7.4x 12.6x 11.9x
Mean 27,872 31,596 77.4% (15.8%) 6.8% 10.3% 23.2% 2.3x 2.1x 10.0x 9.1x 14.5x 13.5x
Median 25,916 31,372 76.4% (16.5%) 3.0% 9.5% 20.7% 2.1x 1.9x 10.2x 8.8x 14.8x 13.8x
Managed Services, Colocation and Hosting
Level 3 28,866 19,432 93.9% 6.1% 100.0% (0.2%) 34.7% 3.5x 3.4x 10.1x 9.8x 33.7x 28.4x
United Internet 10,811 8,046 69.4% (21.5%) 1.0% 6.0% 21.2% 2.5x 2.4x 11.9x 10.8x 16.7x 14.7x
Windstream 10,498 678 67.3% 23.2% (45.6%) (6.0%) 34.7% 1.9x 2.0x 5.6x 5.7x NM NM
GoDaddy 3,884 2,903 89.8% 4.3% NA 14.9% 22.5% 2.1x 1.9x 9.3x 8.0x NM NM
Interxion 3,099 2,436 89.0% 17.4% 54.2% 7.1% 45.4% 6.9x 6.2x 15.2x 13.5x NM 47.3x
Endurance 2,922 991 48.9% (48.1%) (39.0%) 47.9% 26.5% 2.6x 2.5x 10.0x 9.1x 16.5x 8.9x
Internap 421 62 14.1% (85.0%) (85.1%) (6.5%) 27.2% 1.4x 1.4x 5.2x 5.0x NM NM
iomart 386 346 68.0% (29.3%) (22.9%) (3.3%) 43.0% 3.7x 3.4x 8.6x 8.0x 15.4x 13.8x
Redcentric 198 155 35.2% (62.9%) (21.4%) (6.5%) 23.8% 1.4x 1.3x 5.7x 5.2x 7.8x 6.9x
Proact 149 141 88.3% 1.2% 34.7% (6.5%) 6.4% 0.5x 0.5x 7.5x 6.9x 11.6x 11.3x
Melbourne IT 149 145 89.8% 6.2% (7.5%) 22.4% 15.4% 1.1x 1.0x 7.2x 5.7x 18.5x 11.3x
Mean 5,580 3,212 68.5% (17.1%) (3.2%) 6.3% 27.3% 2.5x 2.4x 8.8x 8.0x 17.2x 17.8x
Median 2,922 678 69.4% 1.2% (14.5%) (0.2%) 26.5% 2.1x 2.0x 8.6x 8.0x 16.5x 12.6x
Data Centres
Equinix 30,146 24,056 86.2% 14.1% 101.1% 32.5% 45.8% 8.3x 7.4x 18.2x 15.8x NM NM
Digital Realty Trust 20,489 14,322 79.5% 25.8% 87.6% 20.0% 57.6% 9.7x 8.9x 16.8x 15.5x NM NM
DuPont Fabros 4,869 2,943 79.5% 21.1% 62.5% 15.4% 62.1% 9.3x 8.4x 15.0x 13.4x 23.2x 20.8x
QTS 3,478 2,154 75.7% 8.6% 125.8% 29.1% 45.4% 8.7x 7.6x 19.1x 16.8x NM NM
Coresite 3,126 2,264 72.6% 15.5% 115.8% 19.2% 52.5% 7.9x 6.8x 15.0x 12.9x NM 36.1x
Mean 12,422 9,148 78.7% 17.0% 98.5% 23.2% 52.7% 8.8x 7.8x 16.8x 14.9x 23.2x 28.5x
Median 4,869 2,943 79.5% 15.5% 101.1% 20.0% 52.5% 8.7x 7.6x 16.8x 15.5x 23.2x 28.5x
PaaS/IaaS
ServiceNow 13,814 14,169 93.5% 1.2% 60.8% 37.7% 18.9% 10.0x 7.7x NM 34.7x NM NM
Akamai 11,224 11,351 92.2% 10.7% 43.1% 6.0% 40.5% 4.8x 4.4x 11.9x 10.9x 24.6x 22.6x
Netapp 6,837 9,667 96.0% 10.0% (16.4%) (4.8%) 18.3% 1.3x 1.3x 6.8x 6.6x 15.1x 13.4x
Synchronoss 2,474 2,131 97.3% 26.7% 38.5% 18.5% 32.8% 3.6x 3.0x 11.0x 8.6x 18.3x 15.2x
Commvault Systems 1,982 2,459 96.5% 37.5% (30.1%) 5.8% 13.2% 3.1x 2.9x 23.8x 19.9x NM 48.1x
Progress Software 1,305 1,386 95.7% 19.1% 8.3% 0.3% 34.9% 3.2x 3.1x 9.1x 9.2x 17.9x 16.7x
Carbonite 453 497 95.6% 80.7% 52.4% 49.0% 18.0% 2.2x 2.1x 12.4x 10.8x 32.3x 27.1x
Mean 5,441 5,952 95.2% 26.5% 22.4% 16.1% 25.2% 4.0x 3.5x 12.5x 14.4x 21.6x 23.8x
Median 2,474 2,459 95.7% 19.1% 38.5% 6.0% 18.9% 3.2x 3.0x 11.4x 10.8x 18.3x 19.7x
10
IT SERVICES
EUROPEAN TECHNOLOGY
INDUSTRY UPDATE │ NOVEMBER 2016
(1)
(1) CenturyLink has agreed to acquire Level 3 Communications; share price as at 28th October 2016
PAGE |
(40%)
(30%)
(20%)
(10%)
0%
10%
20%
30%
40%
50%
60%
Nov 2015 Feb 2016 May 2016 Aug 2016 Nov 2016
Digital Broadband Diversified Communication Equipment Mobile Content / Solutions Providers Mobile Infrastructure Software
COMMUNICATIONS
11
EUROPEAN TECHNOLOGY
INDUSTRY UPDATE │ NOVEMBER 2016
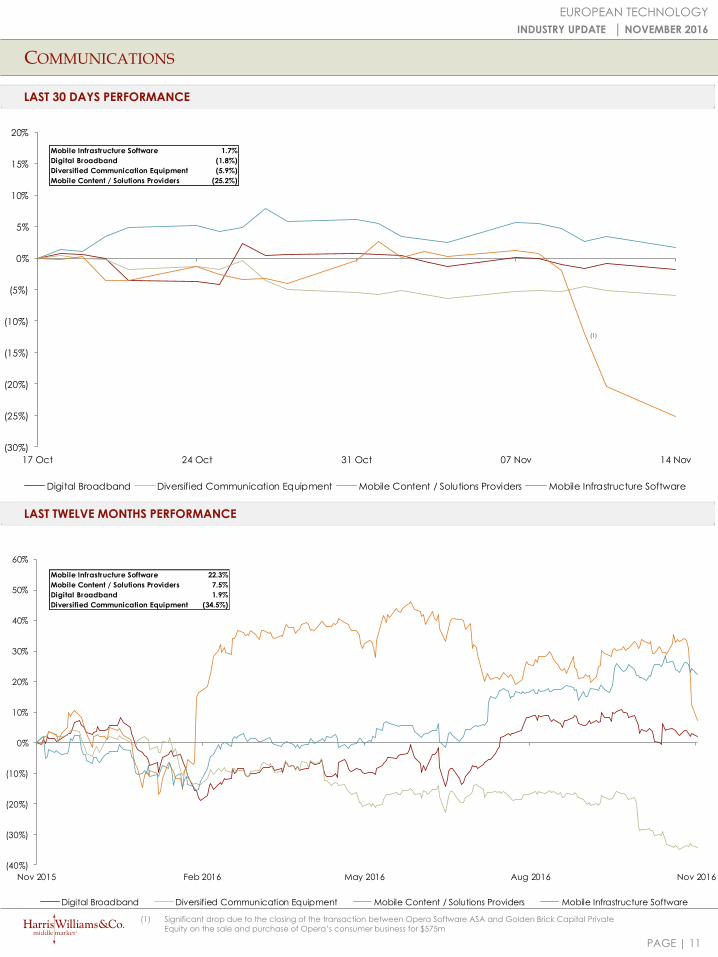
LAST 30 DAYS PERFORMANCE
LAST TWELVE MONTHS PERFORMANCE
Mobile Infrastructure Software 22.3%
Mobile Content / Solutions Providers 7.5%
Digital Broadband 1.9%
Diversified Communication Equipment (34.5%)
(30%)
(25%)
(20%)
(15%)
(10%)
(5%)
0%
5%
10%
15%
20%
17 Oct 24 Oct 31 Oct 07 Nov 14 Nov
Digital Broadband Diversified Communication Equipment Mobile Content / Solutions Providers Mobile Infrastructure Software
Mobile Infrastructure Software 1.7%
Digital Broadband (1.8%)
Diversified Communication Equipment (5.9%)
Mobile Content / Solutions Providers (25.2%)
(1) Significant drop due to the closing of the transaction between Opera Software ASA and Golden Brick Capital Private
Equity on the sale and purchase of Opera’s consumer business for $575m
(1)
PAGE |
Enterprise Market As a 1-Year 3-Year CY16E EV/ EV/ Price /
Value Cap. percent of Stock Stock Rev. EBITDA Revenue EBITDA Earnings
($m) ($m) 52-wk High Perf. Perf. Growth Margin CY16E CY17E CY16E CY17E CY16E CY17E
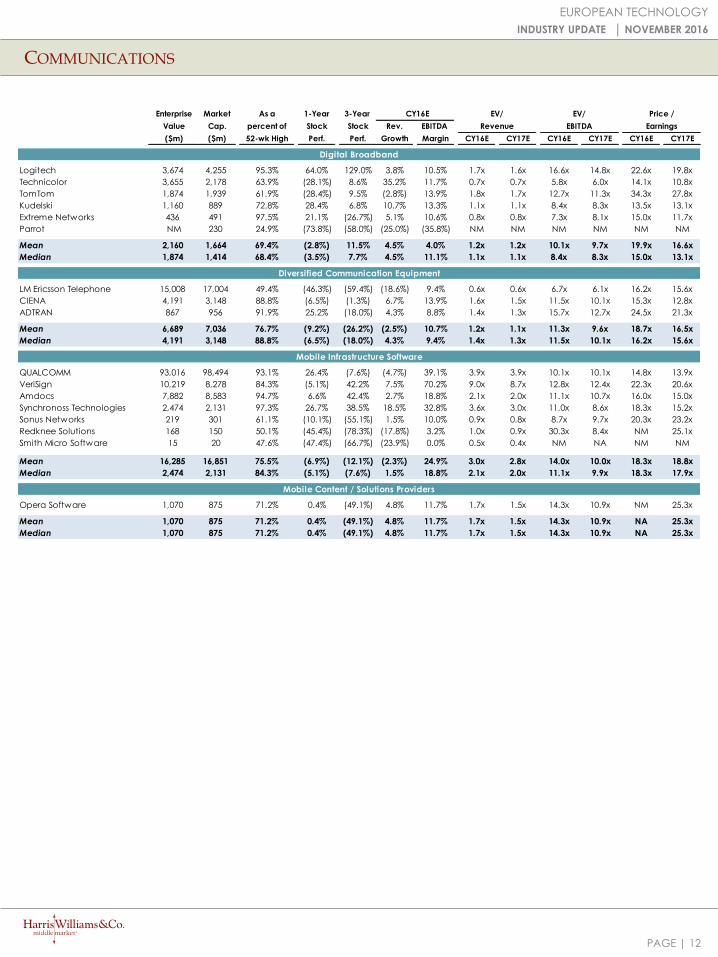
Digital Broadband
Logitech 3,674 4,255 95.3% 64.0% 129.0% 3.8% 10.5% 1.7x 1.6x 16.6x 14.8x 22.6x 19.8x
Technicolor 3,655 2,178 63.9% (28.1%) 8.6% 35.2% 11.7% 0.7x 0.7x 5.8x 6.0x 14.1x 10.8x
TomTom 1,874 1,939 61.9% (28.4%) 9.5% (2.8%) 13.9% 1.8x 1.7x 12.7x 11.3x 34.3x 27.8x
Kudelski 1,160 889 72.8% 28.4% 6.8% 10.7% 13.3% 1.1x 1.1x 8.4x 8.3x 13.5x 13.1x
Extreme Networks 436 491 97.5% 21.1% (26.7%) 5.1% 10.6% 0.8x 0.8x 7.3x 8.1x 15.0x 11.7x
Parrot NM 230 24.9% (73.8%) (58.0%) (25.0%) (35.8%) NM NM NM NM NM NM
Mean 2,160 1,664 69.4% (2.8%) 11.5% 4.5% 4.0% 1.2x 1.2x 10.1x 9.7x 19.9x 16.6x
Median 1,874 1,414 68.4% (3.5%) 7.7% 4.5% 11.1% 1.1x 1.1x 8.4x 8.3x 15.0x 13.1x
Diversified Communication Equipment
LM Ericsson Telephone 15,008 17,004 49.4% (46.3%) (59.4%) (18.6%) 9.4% 0.6x 0.6x 6.7x 6.1x 16.2x 15.6x
CIENA 4,191 3,148 88.8% (6.5%) (1.3%) 6.7% 13.9% 1.6x 1.5x 11.5x 10.1x 15.3x 12.8x
ADTRAN 867 956 91.9% 25.2% (18.0%) 4.3% 8.8% 1.4x 1.3x 15.7x 12.7x 24.5x 21.3x
Mean 6,689 7,036 76.7% (9.2%) (26.2%) (2.5%) 10.7% 1.2x 1.1x 11.3x 9.6x 18.7x 16.5x
Median 4,191 3,148 88.8% (6.5%) (18.0%) 4.3% 9.4% 1.4x 1.3x 11.5x 10.1x 16.2x 15.6x
Mobile Infrastructure Software
QUALCOMM 93,016 98,494 93.1% 26.4% (7.6%) (4.7%) 39.1% 3.9x 3.9x 10.1x 10.1x 14.8x 13.9x
VeriSign 10,219 8,278 84.3% (5.1%) 42.2% 7.5% 70.2% 9.0x 8.7x 12.8x 12.4x 22.3x 20.6x
Amdocs 7,882 8,583 94.7% 6.6% 42.4% 2.7% 18.8% 2.1x 2.0x 11.1x 10.7x 16.0x 15.0x
Synchronoss Technologies 2,474 2,131 97.3% 26.7% 38.5% 18.5% 32.8% 3.6x 3.0x 11.0x 8.6x 18.3x 15.2x
Sonus Networks 219 301 61.1% (10.1%) (55.1%) 1.5% 10.0% 0.9x 0.8x 8.7x 9.7x 20.3x 23.2x
Redknee Solutions 168 150 50.1% (45.4%) (78.3%) (17.8%) 3.2% 1.0x 0.9x 30.3x 8.4x NM 25.1x
Smith Micro Software 15 20 47.6% (47.4%) (66.7%) (23.9%) 0.0% 0.5x 0.4x NM NA NM NM
Mean 16,285 16,851 75.5% (6.9%) (12.1%) (2.3%) 24.9% 3.0x 2.8x 14.0x 10.0x 18.3x 18.8x
Median 2,474 2,131 84.3% (5.1%) (7.6%) 1.5% 18.8% 2.1x 2.0x 11.1x 9.9x 18.3x 17.9x
Mobile Content / Solutions Providers
Opera Software 1,070 875 71.2% 0.4% (49.1%) 4.8% 11.7% 1.7x 1.5x 14.3x 10.9x NM 25.3x
Mean 1,070 875 71.2% 0.4% (49.1%) 4.8% 11.7% 1.7x 1.5x 14.3x 10.9x NA 25.3x
Median 1,070 875 71.2% 0.4% (49.1%) 4.8% 11.7% 1.7x 1.5x 14.3x 10.9x NA 25.3x
COMMUNICATIONS
12
EUROPEAN TECHNOLOGY
INDUSTRY UPDATE │ NOVEMBER 2016
PAGE |
(60%)
(40%)
(20%)
0%
20%
40%
60%
80%
Nov 2015 Feb 2016 May 2016 Aug 2016 Nov 2016
Global Internet Leaders eCommerce Online Travel Digital Marketing
Content Providers / Communities Intermediation and Comparison Online Classifieds Interactive Entertainment
Online Gambling Chinese Internet Leaders Internet Services Educational Technology
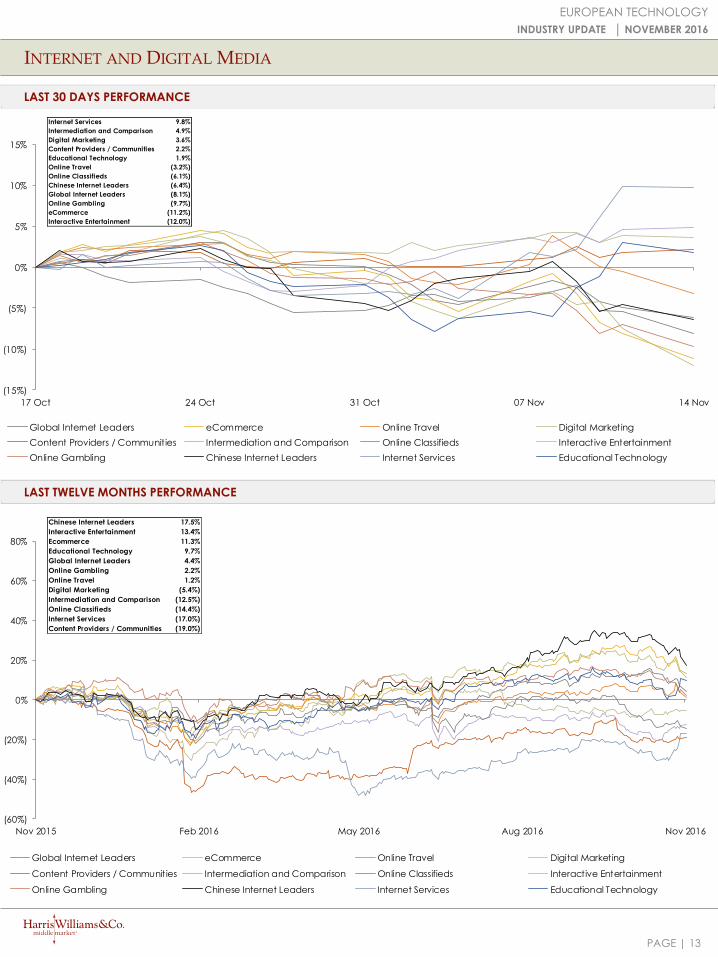
INTERNET AND DIGITAL MEDIA
13
EUROPEAN TECHNOLOGY
INDUSTRY UPDATE │ NOVEMBER 2016
LAST 30 DAYS PERFORMANCE
LAST TWELVE MONTHS PERFORMANCE
(15%)
(10%)
(5%)
0%
5%
10%
15%
17 Oct 24 Oct 31 Oct 07 Nov 14 Nov
Global Internet Leaders eCommerce Online Travel Digital Marketing
Content Providers / Communities Intermediation and Comparison Online Classifieds Interactive Entertainment
Online Gambling Chinese Internet Leaders Internet Services Educational Technology
Internet Services 9.8%
Intermediation and Comparison 4.9%
Digital Marketing 3.6%
Content Providers / Communities 2.2%
Educational Technology 1.9%
Online Travel (3.2%)
Online Classifieds (6.1%)
Chinese Internet Leaders (6.4%)
Global Internet Leaders (8.1%)
Online Gambling (9.7%)
eCommerce (11.2%)
Interactive Entertainment (12.0%)
Chinese Internet Leaders 17.5%
Interactive Entertainment 13.4%
Ecommerce 11.3%
Educational Technology 9.7%
Global Internet Leaders 4.4%
Online Gambling 2.2%
Online Travel 1.2%
Digital Marketing (5.4%)
Intermediation and Comparison (12.5%)
Online Classifieds (14.4%)
Internet Services (17.0%)
Content Providers / Communities (19.0%)
PAGE |
Enterprise Market As a 1-Year 3-Year CY16E EV/ EV/ Price /
Value Cap. percent of Stock Stock Rev. EBITDA Revenue EBITDA Earnings
($m) ($m) 52-wk High Perf. Perf. Growth Margin CY16E CY17E CY16E CY17E CY16E CY17E
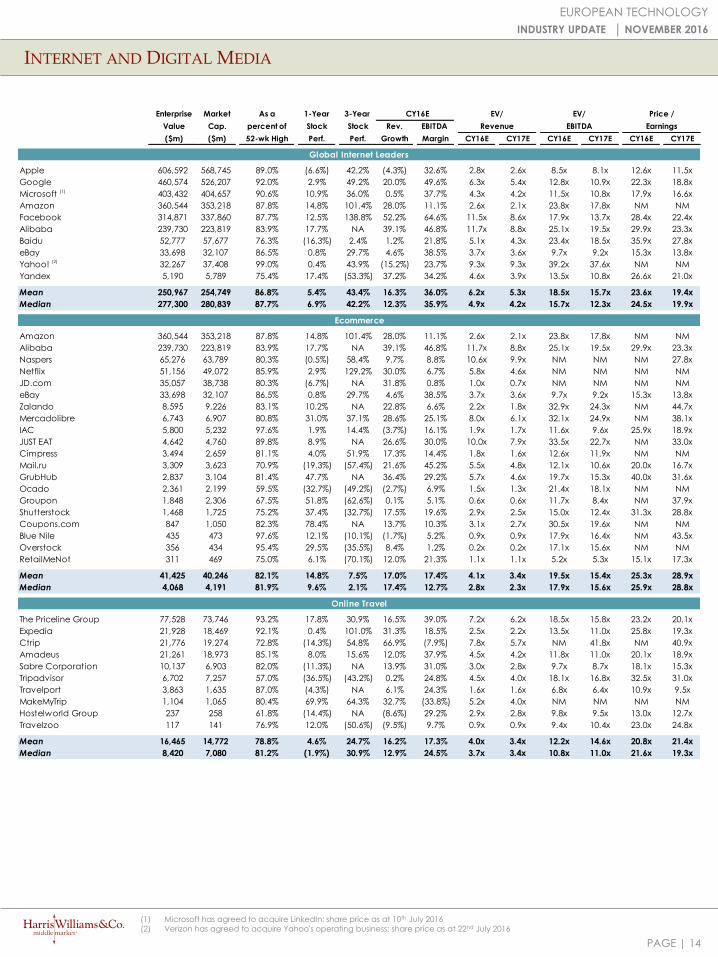
Global Internet Leaders
Apple 606,592 568,745 89.0% (6.6%) 42.2% (4.3%) 32.6% 2.8x 2.6x 8.5x 8.1x 12.6x 11.5x
Google 460,574 526,207 92.0% 2.9% 49.2% 20.0% 49.6% 6.3x 5.4x 12.8x 10.9x 22.3x 18.8x
Microsoft 403,432 404,657 90.6% 10.9% 36.0% 0.5% 37.7% 4.3x 4.2x 11.5x 10.8x 17.9x 16.6x
Amazon 360,544 353,218 87.8% 14.8% 101.4% 28.0% 11.1% 2.6x 2.1x 23.8x 17.8x NM NM
Facebook 314,871 337,860 87.7% 12.5% 138.8% 52.2% 64.6% 11.5x 8.6x 17.9x 13.7x 28.4x 22.4x
Alibaba 239,730 223,819 83.9% 17.7% NA 39.1% 46.8% 11.7x 8.8x 25.1x 19.5x 29.9x 23.3x
Baidu 52,777 57,677 76.3% (16.3%) 2.4% 1.2% 21.8% 5.1x 4.3x 23.4x 18.5x 35.9x 27.8x
eBay 33,698 32,107 86.5% 0.8% 29.7% 4.6% 38.5% 3.7x 3.6x 9.7x 9.2x 15.3x 13.8x
Yahoo! 32,267 37,408 99.0% 0.4% 43.9% (15.2%) 23.7% 9.3x 9.3x 39.2x 37.6x NM NM
Yandex 5,190 5,789 75.4% 17.4% (53.3%) 37.2% 34.2% 4.6x 3.9x 13.5x 10.8x 26.6x 21.0x
Mean 250,967 254,749 86.8% 5.4% 43.4% 16.3% 36.0% 6.2x 5.3x 18.5x 15.7x 23.6x 19.4x
Median 277,300 280,839 87.7% 6.9% 42.2% 12.3% 35.9% 4.9x 4.2x 15.7x 12.3x 24.5x 19.9x
Ecommerce
Amazon 360,544 353,218 87.8% 14.8% 101.4% 28.0% 11.1% 2.6x 2.1x 23.8x 17.8x NM NM
Alibaba 239,730 223,819 83.9% 17.7% NA 39.1% 46.8% 11.7x 8.8x 25.1x 19.5x 29.9x 23.3x
Naspers 65,276 63,789 80.3% (0.5%) 58.4% 9.7% 8.8% 10.6x 9.9x NM NM NM 27.8x
Netflix 51,156 49,072 85.9% 2.9% 129.2% 30.0% 6.7% 5.8x 4.6x NM NM NM NM
JD.com 35,057 38,738 80.3% (6.7%) NA 31.8% 0.8% 1.0x 0.7x NM NM NM NM
eBay 33,698 32,107 86.5% 0.8% 29.7% 4.6% 38.5% 3.7x 3.6x 9.7x 9.2x 15.3x 13.8x
Zalando 8,595 9,226 83.1% 10.2% NA 22.8% 6.6% 2.2x 1.8x 32.9x 24.3x NM 44.7x
Mercadolibre 6,743 6,907 80.8% 31.0% 37.1% 28.6% 25.1% 8.0x 6.1x 32.1x 24.9x NM 38.1x
IAC 5,800 5,232 97.6% 1.9% 14.4% (3.7%) 16.1% 1.9x 1.7x 11.6x 9.6x 25.9x 18.9x
JUST EAT 4,642 4,760 89.8% 8.9% NA 26.6% 30.0% 10.0x 7.9x 33.5x 22.7x NM 33.0x
Cimpress 3,494 2,659 81.1% 4.0% 51.9% 17.3% 14.4% 1.8x 1.6x 12.6x 11.9x NM NM
Mail.ru 3,309 3,623 70.9% (19.3%) (57.4%) 21.6% 45.2% 5.5x 4.8x 12.1x 10.6x 20.0x 16.7x
GrubHub 2,837 3,104 81.4% 47.7% NA 36.4% 29.2% 5.7x 4.6x 19.7x 15.3x 40.0x 31.6x
Ocado 2,361 2,199 59.5% (32.7%) (49.2%) (2.7%) 6.9% 1.5x 1.3x 21.4x 18.1x NM NM
Groupon 1,848 2,306 67.5% 51.8% (62.6%) 0.1% 5.1% 0.6x 0.6x 11.7x 8.4x NM 37.9x
Shutterstock 1,468 1,725 75.2% 37.4% (32.7%) 17.5% 19.6% 2.9x 2.5x 15.0x 12.4x 31.3x 28.8x
Coupons.com 847 1,050 82.3% 78.4% NA 13.7% 10.3% 3.1x 2.7x 30.5x 19.6x NM NM
Blue Nile 435 473 97.6% 12.1% (10.1%) (1.7%) 5.2% 0.9x 0.9x 17.9x 16.4x NM 43.5x
Overstock 356 434 95.4% 29.5% (35.5%) 8.4% 1.2% 0.2x 0.2x 17.1x 15.6x NM NM
RetailMeNot 311 469 75.0% 6.1% (70.1%) 12.0% 21.3% 1.1x 1.1x 5.2x 5.3x 15.1x 17.3x
Mean 41,425 40,246 82.1% 14.8% 7.5% 17.0% 17.4% 4.1x 3.4x 19.5x 15.4x 25.3x 28.9x
Median 4,068 4,191 81.9% 9.6% 2.1% 17.4% 12.7% 2.8x 2.3x 17.9x 15.6x 25.9x 28.8x
Online Travel
The Priceline Group 77,528 73,746 93.2% 17.8% 30.9% 16.5% 39.0% 7.2x 6.2x 18.5x 15.8x 23.2x 20.1x
Expedia 21,928 18,469 92.1% 0.4% 101.0% 31.3% 18.5% 2.5x 2.2x 13.5x 11.0x 25.8x 19.3x
Ctrip 21,776 19,274 72.8% (14.3%) 54.8% 66.9% (7.9%) 7.8x 5.7x NM 41.8x NM 40.9x
Amadeus 21,261 18,973 85.1% 8.0% 15.6% 12.0% 37.9% 4.5x 4.2x 11.8x 11.0x 20.1x 18.9x
Sabre Corporation 10,137 6,903 82.0% (11.3%) NA 13.9% 31.0% 3.0x 2.8x 9.7x 8.7x 18.1x 15.3x
Tripadvisor 6,702 7,257 57.0% (36.5%) (43.2%) 0.2% 24.8% 4.5x 4.0x 18.1x 16.8x 32.5x 31.0x
Travelport 3,863 1,635 87.0% (4.3%) NA 6.1% 24.3% 1.6x 1.6x 6.8x 6.4x 10.9x 9.5x
MakeMyTrip 1,104 1,065 80.4% 69.9% 64.3% 32.7% (33.8%) 5.2x 4.0x NM NM NM NM
Hostelworld Group 237 258 61.8% (14.4%) NA (8.6%) 29.2% 2.9x 2.8x 9.8x 9.5x 13.0x 12.7x
Travelzoo 117 141 76.9% 12.0% (50.6%) (9.5%) 9.7% 0.9x 0.9x 9.4x 10.4x 23.0x 24.8x
Mean 16,465 14,772 78.8% 4.6% 24.7% 16.2% 17.3% 4.0x 3.4x 12.2x 14.6x 20.8x 21.4x
Median 8,420 7,080 81.2% (1.9%) 30.9% 12.9% 24.5% 3.7x 3.4x 10.8x 11.0x 21.6x 19.3x
INTERNET AND DIGITAL MEDIA
14
EUROPEAN TECHNOLOGY
INDUSTRY UPDATE │ NOVEMBER 2016
(2)
(1)
(1) Microsoft has agreed to acquire LinkedIn; share price as at 10th July 2016
(2) Verizon has agreed to acquire Yahoo's operating business; share price as at 22nd July 2016
PAGE |
Enterprise Market As a 1-Year 3-Year CY16E EV/ EV/ Price /
Value Cap. percent of Stock Stock Rev. EBITDA Revenue EBITDA Earnings
($m) ($m) 52-wk High Perf. Perf. Growth Margin CY16E CY17E CY16E CY17E CY16E CY17E
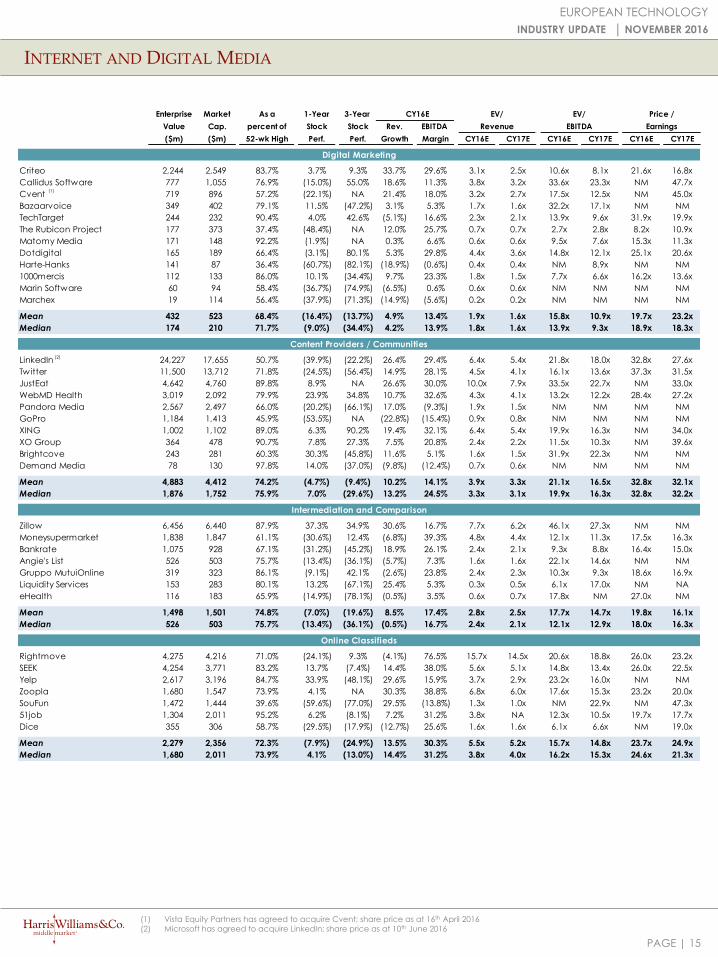
Digital Marketing
Criteo 2,244 2,549 83.7% 3.7% 9.3% 33.7% 29.6% 3.1x 2.5x 10.6x 8.1x 21.6x 16.8x
Callidus Software 777 1,055 76.9% (15.0%) 55.0% 18.6% 11.3% 3.8x 3.2x 33.6x 23.3x NM 47.7x
Cvent 719 896 57.2% (22.1%) NA 21.4% 18.0% 3.2x 2.7x 17.5x 12.5x NM 45.0x
Bazaarvoice 349 402 79.1% 11.5% (47.2%) 3.1% 5.3% 1.7x 1.6x 32.2x 17.1x NM NM
TechTarget 244 232 90.4% 4.0% 42.6% (5.1%) 16.6% 2.3x 2.1x 13.9x 9.6x 31.9x 19.9x
The Rubicon Project 177 373 37.4% (48.4%) NA 12.0% 25.7% 0.7x 0.7x 2.7x 2.8x 8.2x 10.9x
Matomy Media 171 148 92.2% (1.9%) NA 0.3% 6.6% 0.6x 0.6x 9.5x 7.6x 15.3x 11.3x
Dotdigital 165 189 66.4% (3.1%) 80.1% 5.3% 29.8% 4.4x 3.6x 14.8x 12.1x 25.1x 20.6x
Harte-Hanks 141 87 36.4% (60.7%) (82.1%) (18.9%) (0.6%) 0.4x 0.4x NM 8.9x NM NM
1000mercis 112 133 86.0% 10.1% (34.4%) 9.7% 23.3% 1.8x 1.5x 7.7x 6.6x 16.2x 13.6x
Marin Software 60 94 58.4% (36.7%) (74.9%) (6.5%) 0.6% 0.6x 0.6x NM NM NM NM
Marchex 19 114 56.4% (37.9%) (71.3%) (14.9%) (5.6%) 0.2x 0.2x NM NM NM NM
Mean 432 523 68.4% (16.4%) (13.7%) 4.9% 13.4% 1.9x 1.6x 15.8x 10.9x 19.7x 23.2x
Median 174 210 71.7% (9.0%) (34.4%) 4.2% 13.9% 1.8x 1.6x 13.9x 9.3x 18.9x 18.3x
Content Providers / Communities
LinkedIn 24,227 17,655 50.7% (39.9%) (22.2%) 26.4% 29.4% 6.4x 5.4x 21.8x 18.0x 32.8x 27.6x
Twitter 11,500 13,712 71.8% (24.5%) (56.4%) 14.9% 28.1% 4.5x 4.1x 16.1x 13.6x 37.3x 31.5x
JustEat 4,642 4,760 89.8% 8.9% NA 26.6% 30.0% 10.0x 7.9x 33.5x 22.7x NM 33.0x
WebMD Health 3,019 2,092 79.9% 23.9% 34.8% 10.7% 32.6% 4.3x 4.1x 13.2x 12.2x 28.4x 27.2x
Pandora Media 2,567 2,497 66.0% (20.2%) (66.1%) 17.0% (9.3%) 1.9x 1.5x NM NM NM NM
GoPro 1,184 1,413 45.9% (53.5%) NA (22.8%) (15.4%) 0.9x 0.8x NM NM NM NM
XING 1,002 1,102 89.0% 6.3% 90.2% 19.4% 32.1% 6.4x 5.4x 19.9x 16.3x NM 34.0x
XO Group 364 478 90.7% 7.8% 27.3% 7.5% 20.8% 2.4x 2.2x 11.5x 10.3x NM 39.6x
Brightcove 243 281 60.3% 30.3% (45.8%) 11.6% 5.1% 1.6x 1.5x 31.9x 22.3x NM NM
Demand Media 78 130 97.8% 14.0% (37.0%) (9.8%) (12.4%) 0.7x 0.6x NM NM NM NM
Mean 4,883 4,412 74.2% (4.7%) (9.4%) 10.2% 14.1% 3.9x 3.3x 21.1x 16.5x 32.8x 32.1x
Median 1,876 1,752 75.9% 7.0% (29.6%) 13.2% 24.5% 3.3x 3.1x 19.9x 16.3x 32.8x 32.2x
Intermediation and Comparison
Zillow 6,456 6,440 87.9% 37.3% 34.9% 30.6% 16.7% 7.7x 6.2x 46.1x 27.3x NM NM
Moneysupermarket 1,838 1,847 61.1% (30.6%) 12.4% (6.8%) 39.3% 4.8x 4.4x 12.1x 11.3x 17.5x 16.3x
Bankrate 1,075 928 67.1% (31.2%) (45.2%) 18.9% 26.1% 2.4x 2.1x 9.3x 8.8x 16.4x 15.0x
Angie's List 526 503 75.7% (13.4%) (36.1%) (5.7%) 7.3% 1.6x 1.6x 22.1x 14.6x NM NM
Gruppo MutuiOnline 319 323 86.1% (9.1%) 42.1% (2.6%) 23.8% 2.4x 2.3x 10.3x 9.3x 18.6x 16.9x
Liquidity Services 153 283 80.1% 13.2% (67.1%) 25.4% 5.3% 0.3x 0.5x 6.1x 17.0x NM NA
eHealth 116 183 65.9% (14.9%) (78.1%) (0.5%) 3.5% 0.6x 0.7x 17.8x NM 27.0x NM
Mean 1,498 1,501 74.8% (7.0%) (19.6%) 8.5% 17.4% 2.8x 2.5x 17.7x 14.7x 19.8x 16.1x
Median 526 503 75.7% (13.4%) (36.1%) (0.5%) 16.7% 2.4x 2.1x 12.1x 12.9x 18.0x 16.3x
Online Classifieds
Rightmove 4,275 4,216 71.0% (24.1%) 9.3% (4.1%) 76.5% 15.7x 14.5x 20.6x 18.8x 26.0x 23.2x
SEEK 4,254 3,771 83.2% 13.7% (7.4%) 14.4% 38.0% 5.6x 5.1x 14.8x 13.4x 26.0x 22.5x
Yelp 2,617 3,196 84.7% 33.9% (48.1%) 29.6% 15.9% 3.7x 2.9x 23.2x 16.0x NM NM
Zoopla 1,680 1,547 73.9% 4.1% NA 30.3% 38.8% 6.8x 6.0x 17.6x 15.3x 23.2x 20.0x
SouFun 1,472 1,444 39.6% (59.6%) (77.0%) 29.5% (13.8%) 1.3x 1.0x NM 22.9x NM 47.3x
51job 1,304 2,011 95.2% 6.2% (8.1%) 7.2% 31.2% 3.8x NA 12.3x 10.5x 19.7x 17.7x
Dice 355 306 58.7% (29.5%) (17.9%) (12.7%) 25.6% 1.6x 1.6x 6.1x 6.6x NM 19.0x
Mean 2,279 2,356 72.3% (7.9%) (24.9%) 13.5% 30.3% 5.5x 5.2x 15.7x 14.8x 23.7x 24.9x
Median 1,680 2,011 73.9% 4.1% (13.0%) 14.4% 31.2% 3.8x 4.0x 16.2x 15.3x 24.6x 21.3x
INTERNET AND DIGITAL MEDIA
15
EUROPEAN TECHNOLOGY
INDUSTRY UPDATE │ NOVEMBER 2016
(1) Vista Equity Partners has agreed to acquire Cvent; share price as at 16th April 2016
(2) Microsoft has agreed to acquire LinkedIn; share price as at 10th June 2016
(1)
(2)
PAGE |
INTERNET AND DIGITAL MEDIA
16
EUROPEAN TECHNOLOGY
INDUSTRY UPDATE │ NOVEMBER 2016
Enterprise Market As a 1-Year 3-Year CY16E EV/ EV/ Price /
Value Cap. percent of Stock Stock Rev. EBITDA Revenue EBITDA Earnings
($m) ($m) 52-wk High Perf. Perf. Growth Margin CY16E CY17E CY16E CY17E CY16E CY17E
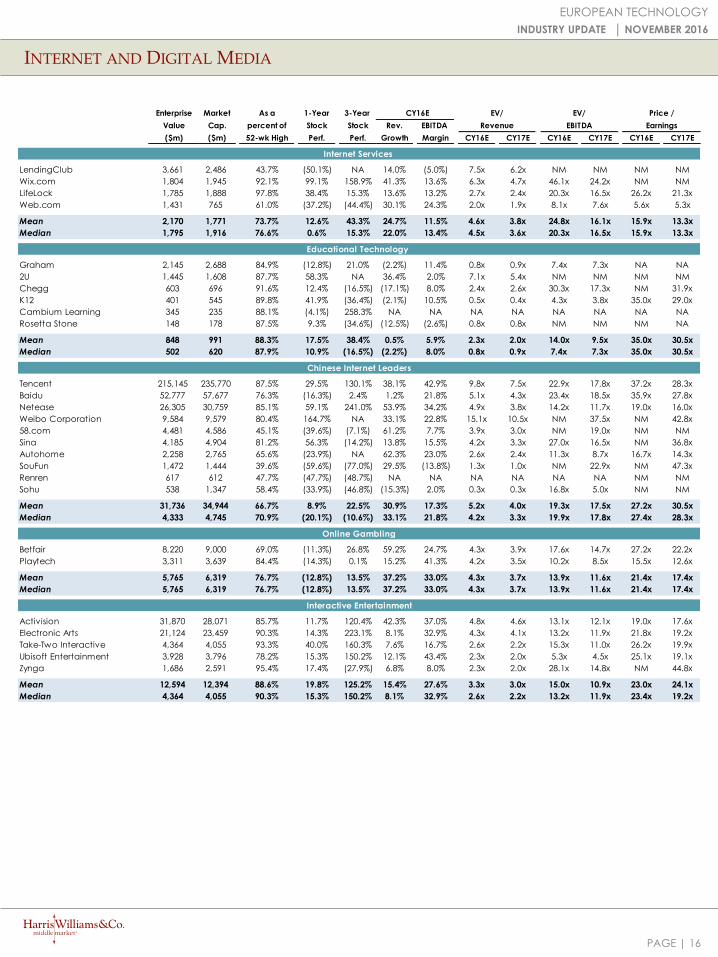
Internet Services
LendingClub 3,661 2,486 43.7% (50.1%) NA 14.0% (5.0%) 7.5x 6.2x NM NM NM NM
Wix.com 1,804 1,945 92.1% 99.1% 158.9% 41.3% 13.6% 6.3x 4.7x 46.1x 24.2x NM NM
LifeLock 1,785 1,888 97.8% 38.4% 15.3% 13.6% 13.2% 2.7x 2.4x 20.3x 16.5x 26.2x 21.3x
Web.com 1,431 765 61.0% (37.2%) (44.4%) 30.1% 24.3% 2.0x 1.9x 8.1x 7.6x 5.6x 5.3x
Mean 2,170 1,771 73.7% 12.6% 43.3% 24.7% 11.5% 4.6x 3.8x 24.8x 16.1x 15.9x 13.3x
Median 1,795 1,916 76.6% 0.6% 15.3% 22.0% 13.4% 4.5x 3.6x 20.3x 16.5x 15.9x 13.3x
Educational Technology
Graham 2,145 2,688 84.9% (12.8%) 21.0% (2.2%) 11.4% 0.8x 0.9x 7.4x 7.3x NA NA
2U 1,445 1,608 87.7% 58.3% NA 36.4% 2.0% 7.1x 5.4x NM NM NM NM
Chegg 603 696 91.6% 12.4% (16.5%) (17.1%) 8.0% 2.4x 2.6x 30.3x 17.3x NM 31.9x
K12 401 545 89.8% 41.9% (36.4%) (2.1%) 10.5% 0.5x 0.4x 4.3x 3.8x 35.0x 29.0x
Cambium Learning 345 235 88.1% (4.1%) 258.3% NA NA NA NA NA NA NA NA
Rosetta Stone 148 178 87.5% 9.3% (34.6%) (12.5%) (2.6%) 0.8x 0.8x NM NM NM NA
Mean 848 991 88.3% 17.5% 38.4% 0.5% 5.9% 2.3x 2.0x 14.0x 9.5x 35.0x 30.5x
Median 502 620 87.9% 10.9% (16.5%) (2.2%) 8.0% 0.8x 0.9x 7.4x 7.3x 35.0x 30.5x
Chinese Internet Leaders
Tencent 215,145 235,770 87.5% 29.5% 130.1% 38.1% 42.9% 9.8x 7.5x 22.9x 17.8x 37.2x 28.3x
Baidu 52,777 57,677 76.3% (16.3%) 2.4% 1.2% 21.8% 5.1x 4.3x 23.4x 18.5x 35.9x 27.8x
Netease 26,305 30,759 85.1% 59.1% 241.0% 53.9% 34.2% 4.9x 3.8x 14.2x 11.7x 19.0x 16.0x
Weibo Corporation 9,584 9,579 80.4% 164.7% NA 33.1% 22.8% 15.1x 10.5x NM 37.5x NM 42.8x
58.com 4,481 4,586 45.1% (39.6%) (7.1%) 61.2% 7.7% 3.9x 3.0x NM 19.0x NM NM
Sina 4,185 4,904 81.2% 56.3% (14.2%) 13.8% 15.5% 4.2x 3.3x 27.0x 16.5x NM 36.8x
Autohome 2,258 2,765 65.6% (23.9%) NA 62.3% 23.0% 2.6x 2.4x 11.3x 8.7x 16.7x 14.3x
SouFun 1,472 1,444 39.6% (59.6%) (77.0%) 29.5% (13.8%) 1.3x 1.0x NM 22.9x NM 47.3x
Renren 617 612 47.7% (47.7%) (48.7%) NA NA NA NA NA NA NM NM
Sohu 538 1,347 58.4% (33.9%) (46.8%) (15.3%) 2.0% 0.3x 0.3x 16.8x 5.0x NM NM
Mean 31,736 34,944 66.7% 8.9% 22.5% 30.9% 17.3% 5.2x 4.0x 19.3x 17.5x 27.2x 30.5x
Median 4,333 4,745 70.9% (20.1%) (10.6%) 33.1% 21.8% 4.2x 3.3x 19.9x 17.8x 27.4x 28.3x
Online Gambling
Betfair 8,220 9,000 69.0% (11.3%) 26.8% 59.2% 24.7% 4.3x 3.9x 17.6x 14.7x 27.2x 22.2x
Playtech 3,311 3,639 84.4% (14.3%) 0.1% 15.2% 41.3% 4.2x 3.5x 10.2x 8.5x 15.5x 12.6x
Mean 5,765 6,319 76.7% (12.8%) 13.5% 37.2% 33.0% 4.3x 3.7x 13.9x 11.6x 21.4x 17.4x
Median 5,765 6,319 76.7% (12.8%) 13.5% 37.2% 33.0% 4.3x 3.7x 13.9x 11.6x 21.4x 17.4x
Interactive Entertainment
Activision 31,870 28,071 85.7% 11.7% 120.4% 42.3% 37.0% 4.8x 4.6x 13.1x 12.1x 19.0x 17.6x
Electronic Arts 21,124 23,459 90.3% 14.3% 223.1% 8.1% 32.9% 4.3x 4.1x 13.2x 11.9x 21.8x 19.2x
Take-Two Interactive 4,364 4,055 93.3% 40.0% 160.3% 7.6% 16.7% 2.6x 2.2x 15.3x 11.0x 26.2x 19.9x
Ubisoft Entertainment 3,928 3,796 78.2% 15.3% 150.2% 12.1% 43.4% 2.3x 2.0x 5.3x 4.5x 25.1x 19.1x
Zynga 1,686 2,591 95.4% 17.4% (27.9%) 6.8% 8.0% 2.3x 2.0x 28.1x 14.8x NM 44.8x
Mean 12,594 12,394 88.6% 19.8% 125.2% 15.4% 27.6% 3.3x 3.0x 15.0x 10.9x 23.0x 24.1x
Median 4,364 4,055 90.3% 15.3% 150.2% 8.1% 32.9% 2.6x 2.2x 13.2x 11.9x 23.4x 19.2x
PAGE |
INTERNET AND DIGITAL MEDIA
17
EUROPEAN TECHNOLOGY
INDUSTRY UPDATE │ NOVEMBER 2016
has been acquiredby
has been acquiredby
has been acquiredby
has been acquiredby
has been acquiredby
has been acquiredby
has been acquiredby
has been acquiredby
has been acquiredby
has been acquiredby
has been acquiredby
has been acquiredby
has been acquiredby
has merged with
has received asignificant equity investment from
has acquired has acquired
has been acquired
by
has been acquired
byhas merged with
has been acquired
byhas been acquired
by
has been acquired
by
has been
Recapitalized by
has been acquiredby
has been acquiredby
has been acquiredby
has been acquiredby
has been acquiredby
has beenRecapitalized by
has been acquiredby
has been acquiredby
has been acquiredby
has been acquiredby
has been acquiredby
has been acquiredby
has become a
wholly- owned
subsidiary of
has received a
majority investment
from
has received a
majority equity
investment from
has been acquiredby
has been acquiredby
has been acquiredby
has been acquiredby
has received a
minority investment
from
has been acquiredby
has received ainvestment from
DIGITAL
MEDIA
ERP / BUSINESS
MANAGEMENT
DIGITAL
MEDIA
SUPPLY CHAIN
SOFTWARE
HEALTHCARE
TECHNOLOGY
DATA
ANALYTICS
ERP / BUSINESS
MANAGEMENT
HEALTHCARE
TECHNOLOGY
HEALTHCARE
TECHNOLOGY
APPLICATION
SOFTWARE
REAL ESTATE
SOFTWARE
EDUCATION
TECHNOLOGY
MARKETING
ANALYTICS
ERP / BUSINESS
MANAGEMENT
HEALTHCARE
TECHNOLOGY
NON-PROFIT
SOFTWARE
HEALTHCARE
TECHNOLOGY
HEALTHCARE
TECHNOLOGY
HEALTHCARE
TECHNOLOGY
LEGAL
TECHNOLOGY
MARKETING
TECHNOLOGY
HCM
SOFTWARE
HEALTHCARE
TECHNOLOGY
SUPPLY CHAIN
SOFTWARE
INFRASTRUCTURE
SOFTWARE
INFRASTRUCTURE
SOFTWARE
HEALTHCARE
TECHNOLOGY
HEALTHCARE
TECHNOLOGY
SUPPLY CHAIN
SOFTWARE
EDUCATION
TECHNOLOGY
INFRASTRUCTURE
SOFTWARE
ENERGY
TECHNOLOGY
ECOMMERCE
RETAIL
DATA
ANALYTICS
HEALTHCARE
TECHNOLOGY
FINANCIAL
TECHNOLOGY
HEALTHCARE
TECHNOLOGY
MANAGED
SERVICES
HEALTHCARE
TECHNOLOGY
PUBLIC SECTOR
SOFTWARE
MARKETING
ANALYTICS
TECH-ENABLED
SERVICES
ENERGY
TECHNOLOGY
HEALTHCARE
TECHNOLOGY
HCM
SOFTWARE
NON-PROFIT
SOFTWARE
a majority stake in
has been acquired
by
HEALTHCARE
TECHNOLOGY
has been recapitalised by
APPLICATION
SOFTWARE
has acquired
HCM
SOFTWARE

Energy, Power& Infrastructure
IndustrialsHealthcare & Life Sciences
Transportation & Logistics
Aerospace, Defense & Government
Services
Business Services
Building Products & Materials
Technology, Media & Telecom
Specialty Distribution
Consumer
PAGE |
HARRIS WILLIAMS & CO. OFFICE LOCATIONS
UNITED STATES EUROPE
BostonTwo International Place24th FloorBoston, Massachusetts 02110Phone: +1 (617) 482-7501
Cleveland1900 East 9th Street20th FloorCleveland, Ohio 44114Phone: +1 (216) 689-2400
Minneapolis222 South 9th StreetSuite 3350Minneapolis, Minnesota 55402Phone: +1 (612) 359-2700
Richmond (Headquarters)1001 Haxall Point9th FloorRichmond, Virginia 23219Phone: +1 (804) 648-0072
San Francisco575 Market Street31st FloorSan Francisco, California 94105Phone: +1 (415) 288-4260
Washington, D.C. 800 17th St. NW2nd FloorWashington, D.C. 20006Phone: +1 202-207-2300
FrankfurtBockenheimer Landstrasse 33-3560325 FrankfurtGermanyPhone: +49 069 3650638 00
London63 Brook StreetLondon W1K 4HS, EnglandPhone: +44 (0) 20 7518 8900
NETWORK OFFICES
Beijing
Hong Kong
Mumbai
New Delhi
Shanghai
Technology, Media & Telecom
Harris Williams & Co. has a broad range of industry expertise, which creates powerful opportunities.Our clients benefit from our deep-sector experience, integrated industry intelligence andcollaboration across the firm, and our commitment to learning what makes them unique. For moreinformation, visit our website at www.harriswilliams.com/industries
18
OUR FIRM
EUROPEAN TECHNOLOGY
INDUSTRY UPDATE │ NOVEMBER 2016
PAGE |
HARRIS WILLIAMS & CO.
FactSet as of 15th November 2016, broker reports and various industry news outlets
19
SOURCES
EUROPEAN TECHNOLOGY
INDUSTRY UPDATE │ NOVEMBER 2016
Harris Williams & Co. (www.harriswilliams.com) is a preeminent middle market investment bank focused on the advisory needs of clients worldwide. The firm has deep industry knowledge, global transaction expertise, and an unwavering commitment to excellence. Harris Williams & Co. provides sell-side and acquisition advisory, restructuring advisory, board advisory, private placements, and capital markets advisory services.
Investment banking services are provided by Harris Williams LLC, a registered broker-dealer and member of FINRA and SIPC, and Harris Williams & Co. Ltd, which is authorised and regulated by the Financial Conduct Authority. Harris Williams & Co. is a trade name under which Harris Williams LLC and Harris Williams & Co. Ltd conduct business.
THIS REPORT MAY CONTAIN REFERENCES TO REGISTERED TRADEMARKS, SERVICE MARKS AND COPYRIGHTS OWNED BY THIRD-PARTY INFORMATION PROVIDERS. NONE OF THE THIRD PARTY INFORMATION PROVIDERS IS ENDORSING THE OFFERING OF, AND SHALL NOT IN ANY WAY BE DEEMED AN ISSUER OR UNDERWRITER OF, THE SECURITIES, FINANCIAL INSTRUMENTS OR OTHER INVESTMENTS DISCUSSED IN THIS REPORT AND SHALL NOT HAVE ANY LIABILITY OR RESPONSIBILITY FOR ANY STATEMENTS MADE IN THE REPORT OR FOR ANY FINANCIAL STATEMENTS, FINANCIAL PROJECTIONS OR OTHER FINANCIAL INFORMATION CONTAINED OR ATTACHED AS AN EXHIBIT TO THE REPORT. FOR MORE INFORMATION ABOUT THE MATERIALS PROVIDED BY SUCH THIRD PARTIES, PLEASE CONTACT US AT +44 (0) 20 7518 8900.
The information and views contained in this report were prepared by Harris Williams & Co. Ltd (“Harris Williams”). It is not a research report, as such term is defined by applicable law and regulations, and is provided for informational purposes only. It is not to be construed as an offer to buy or sell or a solicitation of an offer to buy or sell any financial instruments or to participate in any particular trading strategy. The information contained herein is believed by Harris Williams to be reliable but Harris Williams makes no representation as to the accuracy or completeness of such information.
Harris Williams and/or its affiliates may be market makers or specialists in, act as advisers or lenders to, have positions in and effect transactions in securities of companies mentioned herein and also may provide, may have provided, or may seek to provide investment banking services for those companies. In addition, Harris Williams and/or its affiliates or their respective officers, directors and employees may hold long or short positions in the securities, options thereon or other related financial products of companies discussed herein. Opinions, estimates and projections in this report constitute Harris Williams’ judgment and are subject to change without notice. The financial instruments discussed in this report may not be suitable for all investors and investors must make their own investment decisions using their own independent advisors as they believe necessary and based upon their specific financial situations and investment objectives. Also, past performance is not necessarily indicative of future results. No part of this material may be copied or duplicated in any form or by any means, or redistributed, without Harris Williams’ prior written consent.
Copyright© 2016 Harris Williams & Co., all rights reserved.
DISCLOSURES