Embed Size (px)
Citation preview

HURRICANE REANALYSIS
__
Reanalysis of Great Mexico Hurricane 1959 – 02.03.16
© 2016 Hagen, Morgerman, Sereno, González page 1 / 12
storm Great Mexico Hurricane of 1959 (Storm No. 15 of 1959: 22-28 Oct)
basin Eastern North Pacific
date 03 February 2016
authors Andrew Hagen (StormGeo), Josh Morgerman (iCyclone), Erik Sereno Trabaldo, Jorge Abelardo González
Intro Mexico Landfall: 10/27/1959 12Z – 19.1N 104.4W – 120 kt – 955 mb – OCI 1007 mb – ROCI 175 n mi - RMW 7-8 n mi – forward speed 5 kt Minor track changes and major intensity changes are analyzed for this historic tropical cyclone that struck near Manzanillo, Mexico, as a devastating hurricane—the deadliest and most destructive landfall in the Eastern Pacific basin, and one of the strongest. Evidence for these alterations comes from the Historical Weather Maps Series; the COADS ships database; Mariners Weather Log; the NCDC EDADS2 Website; the monthly Climatological Data National Summary; Zeluff; Lozoya; the Mexican government’s report on the hurricane (in Boletin Hidrologico No. 16); Proceedings of the Merchant Marine Council; images of handwritten data logs from the Manzanillo Observatory; a letter from Observatory ex-supervisor Alejandro Ramos Mendez de Leon; letters from Observatory ex-supervisor Raul Martinez Venegas; personal communications with Mr. Martinez; and a letter with a personal firsthand account from Luis Garcia Castillo. (Note: In the source documents, most local times are believed to be Z minus 7 hours—however, the NCDC EDADS2 data and some personal accounts are believed to be Z minus 6 hours. Manzanillo is in the Central Time Zone and is Z minus 6 hours.)
Chronology & Observations
October 22 HWM analyzes a closed low of at most 1005 mb near 12.3N 94W. HURDAT did not previously list a system on this day. Ship highlights: 35 kt E and 1008 mb at 12Z at 14.7N 96.6W (COA); 35 kt NE and 1010 mb at 18Z at 14.5N 95.5W (COA). “This storm appears to have originated as a tropical depression about 250 miles south of the Gulf of Tehuantepec on October 22” (Oct. 1959 MWR p. 394). “[This system] first appeared on the weather charts October 22, at 1800, near 13N, 95.5W as a result of a report of east-northeast winds of 35 kt from the RUTH LYKES. The point of origin of this storm is uncertain but it probably occurred several degrees east of 95W” (Climatological Data National Summary).
October 23 HWM analyzes a tropical storm of at most 1000 mb near 13.9N 98.3W. HURDAT lists this as a 75-kt hurricane at 13.0N 98.5W. Ship highlights: 40 kt SSE and 1011 mb at 03Z at 13.1N 93.4W (COA); 25 kt WNW at 1002 mb at 09Z at 12.1N 98.3W (COA); 35 kt ESE and 1006 mb at 18Z at 16.0N 99.2W (COA); 40 kt E and 1007 mb at 18Z at 15.4N 98.9W (COA). One other gale of 35 kt and 5 other low pressures of 1003-1005 mb. “During October 23 and 24 the forward speed of the storm was about 9 kt. Highest wind speeds reported were 40 kt, including two reports from vessels directly in the path of the storm. Maximum wind speeds accompanying the storm at this time were estimated to be 55 kt” (Climatological Data National Summary).
HURRICANE REANALYSIS
__
Reanalysis of Great Mexico Hurricane 1959 – 02.03.16
© 2016 Hagen, Morgerman, Sereno, González page 2 / 12
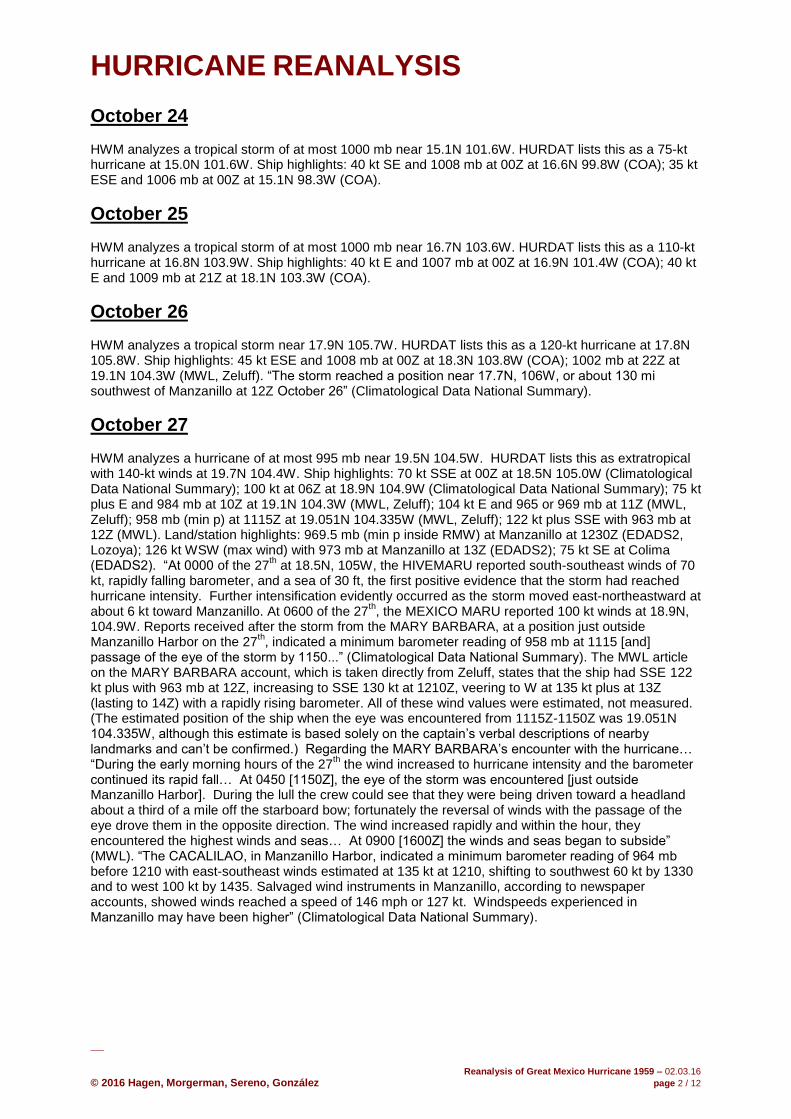
October 24 HWM analyzes a tropical storm of at most 1000 mb near 15.1N 101.6W. HURDAT lists this as a 75-kt hurricane at 15.0N 101.6W. Ship highlights: 40 kt SE and 1008 mb at 00Z at 16.6N 99.8W (COA); 35 kt ESE and 1006 mb at 00Z at 15.1N 98.3W (COA).
October 25 HWM analyzes a tropical storm of at most 1000 mb near 16.7N 103.6W. HURDAT lists this as a 110-kt hurricane at 16.8N 103.9W. Ship highlights: 40 kt E and 1007 mb at 00Z at 16.9N 101.4W (COA); 40 kt E and 1009 mb at 21Z at 18.1N 103.3W (COA).
October 26 HWM analyzes a tropical storm near 17.9N 105.7W. HURDAT lists this as a 120-kt hurricane at 17.8N 105.8W. Ship highlights: 45 kt ESE and 1008 mb at 00Z at 18.3N 103.8W (COA); 1002 mb at 22Z at 19.1N 104.3W (MWL, Zeluff). “The storm reached a position near 17.7N, 106W, or about 130 mi southwest of Manzanillo at 12Z October 26” (Climatological Data National Summary).
October 27 HWM analyzes a hurricane of at most 995 mb near 19.5N 104.5W. HURDAT lists this as extratropical with 140-kt winds at 19.7N 104.4W. Ship highlights: 70 kt SSE at 00Z at 18.5N 105.0W (Climatological Data National Summary); 100 kt at 06Z at 18.9N 104.9W (Climatological Data National Summary); 75 kt plus E and 984 mb at 10Z at 19.1N 104.3W (MWL, Zeluff); 104 kt E and 965 or 969 mb at 11Z (MWL, Zeluff); 958 mb (min p) at 1115Z at 19.051N 104.335W (MWL, Zeluff); 122 kt plus SSE with 963 mb at 12Z (MWL). Land/station highlights: 969.5 mb (min p inside RMW) at Manzanillo at 1230Z (EDADS2, Lozoya); 126 kt WSW (max wind) with 973 mb at Manzanillo at 13Z (EDADS2); 75 kt SE at Colima (EDADS2). “At 0000 of the 27
th at 18.5N, 105W, the HIVEMARU reported south-southeast winds of 70
kt, rapidly falling barometer, and a sea of 30 ft, the first positive evidence that the storm had reached hurricane intensity. Further intensification evidently occurred as the storm moved east-northeastward at about 6 kt toward Manzanillo. At 0600 of the 27
th, the MEXICO MARU reported 100 kt winds at 18.9N,
104.9W. Reports received after the storm from the MARY BARBARA, at a position just outside Manzanillo Harbor on the 27
th, indicated a minimum barometer reading of 958 mb at 1115 [and]
passage of the eye of the storm by 1150...” (Climatological Data National Summary). The MWL article on the MARY BARBARA account, which is taken directly from Zeluff, states that the ship had SSE 122 kt plus with 963 mb at 12Z, increasing to SSE 130 kt at 1210Z, veering to W at 135 kt plus at 13Z (lasting to 14Z) with a rapidly rising barometer. All of these wind values were estimated, not measured. (The estimated position of the ship when the eye was encountered from 1115Z-1150Z was 19.051N 104.335W, although this estimate is based solely on the captain’s verbal descriptions of nearby landmarks and can’t be confirmed.) Regarding the MARY BARBARA’s encounter with the hurricane… “During the early morning hours of the 27
th the wind increased to hurricane intensity and the barometer
continued its rapid fall… At 0450 [1150Z], the eye of the storm was encountered [just outside Manzanillo Harbor]. During the lull the crew could see that they were being driven toward a headland about a third of a mile off the starboard bow; fortunately the reversal of winds with the passage of the eye drove them in the opposite direction. The wind increased rapidly and within the hour, they encountered the highest winds and seas… At 0900 [1600Z] the winds and seas began to subside” (MWL). “The CACALILAO, in Manzanillo Harbor, indicated a minimum barometer reading of 964 mb before 1210 with east-southeast winds estimated at 135 kt at 1210, shifting to southwest 60 kt by 1330 and to west 100 kt by 1435. Salvaged wind instruments in Manzanillo, according to newspaper accounts, showed winds reached a speed of 146 mph or 127 kt. Windspeeds experienced in Manzanillo may have been higher” (Climatological Data National Summary).
HURRICANE REANALYSIS
__
Reanalysis of Great Mexico Hurricane 1959 – 02.03.16
© 2016 Hagen, Morgerman, Sereno, González page 3 / 12
October 28 HWM analyzes a spot low with no closed isobars near 21N 102.6W. HURDAT lists this as extratropical with 25-kt winds at 21.6N 102.9W. No gales or low pressures. ____ HURDAT began this cyclone originally on 23 October at 00Z as a 75-kt hurricane at 12.6N 96.7W. Available observations indicate that the precursor to this system was likely located in the general vicinity of 12N 93W at 18Z on 21 October. However, there is not enough observational evidence to close off a circulation as early as the 21
st. Observational evidence increases on 22 October, when W and SW
winds are observed less than 100 n mi SE and S of the analyzed center. In addition to the evidence of a closed circulation, there were two 35-kt gales observed on the 22
nd. Furthermore, commentary from
multiple sources and references indicate that the 22nd
was the first day of the cyclone’s existence. The cyclone is begun at 12Z on 22 October as a 40-kt tropical storm. Intensities of 50 and 55 kt are analyzed for 00Z and 06Z on the 23
rd (down from 75 kt originally at both times—major changes). The
cyclone is analyzed to have attained hurricane intensity at 18Z on the 23rd
—18 hours later than originally. On the 22
nd and 23
rd, there were a couple of ship observations at distances of 60-100 n mi
from the center. These were somewhat helpful in the track and intensity analysis. However, there were few (if any) ship observations within 50 n mi of the center those days. The largest track change made on the 23
rd is only 0.3 degrees. Data were much more sparse from the 24
th through 26
th, and it doesn’t
appear as though there were any observations within 100 n mi of the center. The largest track change made during this period was also just 0.3 degrees. Only minor intensity changes were implemented—at times—from the 24
th through the 26
th, and these were mainly implemented to smooth out the intensity in
the best track. There is no evidence to support the 25-kt intensity increase in 6 hours from the 18Z on the 24
th to 00Z on the 25
th, so this jump is smoothed out significantly. From genesis through the 26
th,
the strongest wind recorded was 45 kt and the lowest pressure recorded was 1002 mb. Nevertheless, the intensities on the 25
th and 26
th are only decreased by 5-10 kt from the original HURDAT values.
Once the cyclone was within 12 hours of the Manzanillo area, a ship recorded 70 kt SSE at 00Z on the 27
th at 18.5N 105.0W. Utilizing this observation along with other data, a position of 18.4N 105.1W is
analyzed at 00Z on the 27th (18.8N 105.3W originally). At 06Z on the 27
th, another ship recorded 100 kt
(no direction) and 995 mb around the same time. The ship was at 18.9N 104.9W at the time, and the reanalyzed position at the time is 18.8N 104.7W (originally 19.3N 104.8W). The ships that reported the 00Z and 06Z observations were located over the Pacific Ocean and were not in or near Manzanillo Harbor.
HURRICANE REANALYSIS
__
Reanalysis of Great Mexico Hurricane 1959 – 02.03.16
© 2016 Hagen, Morgerman, Sereno, González page 4 / 12
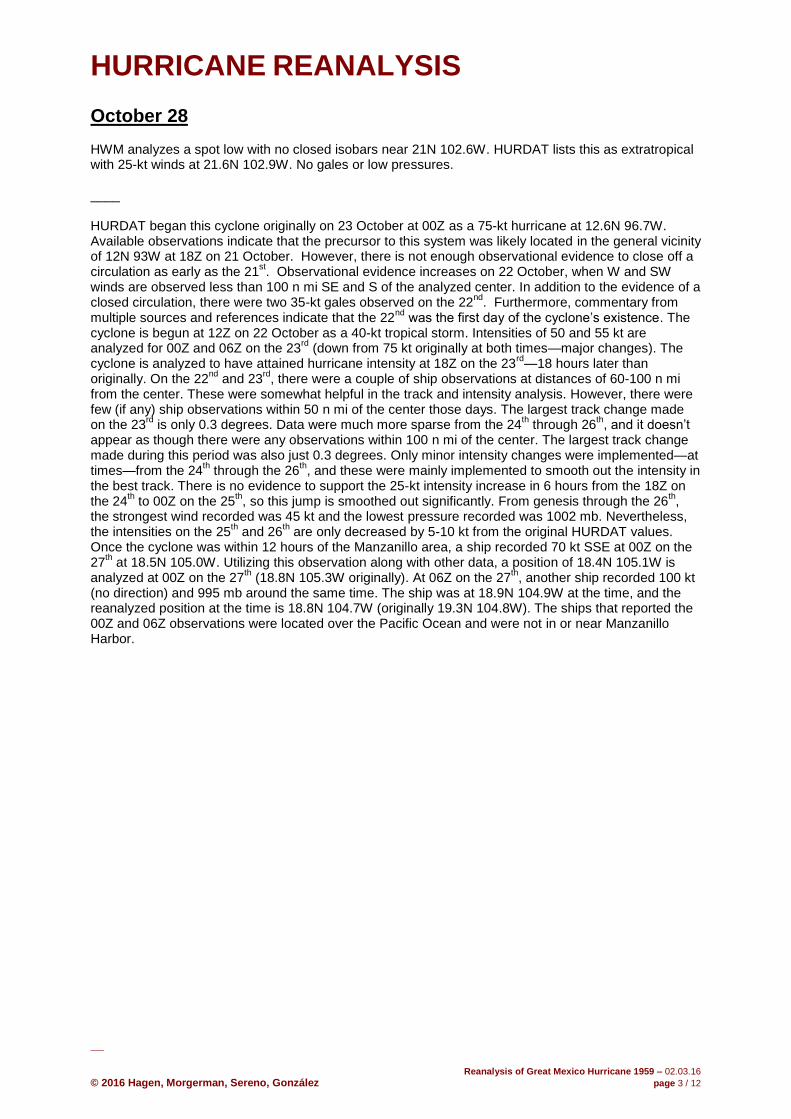
Landfall Analysis
Figure 1: Zoomed-in view of landfall region.
Location & Eye Size Landfall is analyzed to have occurred at 19.1N 104.4W—which is in Santiago Bay, approximately 5 n mi NW of Manzanillo, Mexico—at 12Z on the 27
th.
There is a high degree of confidence in this landfall location/time, as it’s well-supported by observations from the two aforementioned ships as well as observations from Manzanillo. Additionally, this landfall location is supported by the Mexican government’s report (translated from Spanish): “According to the rotation of cyclones, and the general direction of the winds, it is assumed that the vortex was close to or came ashore in Santiago Bay” (Boletin Hidrologico No. 16). The original HURDAT track indicates landfall 6 hours too soon and too far NW—thus the adjustment of the track by half a degree on the 27
th.
The Manzanillo Observatory supervisor, Mr. Alejandro Ramos Mendez de Leon, said in a certified letter that the “vortex” moved SW to NE, passing near and to the W of the Harbor, and that they failed to see a “central calm”. Mr. Raul Martinez Venegas, a later Observatory supervisor, suggested in a letter that the eye passed very close to the port, and there was a very brief calm. A firsthand account from an unspecified location in Manzanillo—shared in a personal letter by Mr. Luis Garcia Castillo—described some calm, with stars appearing in the sky, before powerful winds resumed, now from the S. Wind observations at 15-minute intervals from Manzanillo indicate that the sustained winds likely only dropped to strong tropical storm force within the lull. It’s possible the winds could have dropped further in between one of the 15-minutely observations. The ships MARY BARBARA and CACALILAO—believed to be near the SE corner of Manzanillo Harbor, close to the port—reported periods of partial calm. Based on the data as well as the personal accounts taken together, Manzanillo most certainly

HURRICANE REANALYSIS
__
Reanalysis of Great Mexico Hurricane 1959 – 02.03.16
© 2016 Hagen, Morgerman, Sereno, González page 5 / 12
experienced the inside of the right RMW. The edge of the calm eye likely passed very near or just NW of Manzanillo. The analyzed landfall point (19.1N 104.4W) and reports of very brief calm near or in Manzanillo (5-6 n mi away) suggest the eye was ~11 n mi wide. This estimated eye diameter falls within the estimated 20-35 km (11-19 n mi) described in Mr. Raymundo Padilla Lozoya’s book, “El huracan del 59.”
Pressure There were three observational platforms—two ships in Manzanillo Bay and the Manzanillo Observatory– that aided in the intensity analysis of the landfall. The lowest pressure recorded for the lifetime of the storm was 958 mb from the ship MARY BARBARA. This observation was recorded inside the right RMW, and it may have been recorded inside the right half of the eye. Based on commentary, we are judging that the winds likely decreased to the lower limits of tropical storm force within the RMW, but it is possible winds may have been less than tropical storm force in the eye for several minutes. The lull lasted for 35 minutes, from 1115Z-1150Z. Based on all available observations and commentary, the best estimate is that the ship was located within the E edge of the eye, but a few n mi to the E of the exact center. Since this occurred less than 1 hour prior to landfall, we can estimate a landfall central pressure from this data. A central pressure of 955 mb is analyzed for the 12Z/27
th landfall, due to the likelihood that the central pressure was a few mb lower
than the minimum pressure value of 958 mb recorded by the MARY BARBARA. Although the central pressure could have been a few mb lower than that value, it is highly unlikely that the central pressure was less than 950 mb, since the 958 mb was measured within a lull that lasted for at least 35 minutes. Another ship, the CACALILAO, located inside Manzanillo Harbor and slightly farther away from the path of the center, recorded a minimum pressure of 964 mb. The CACALILAO’s winds decreased to 60 kt inside the RMW (it is unclear if the winds got lower than that). The timing of the ship's lowest pressure (1210Z) doesn't appear to correspond well to the time of the apparent lull. Although there are no data in between the 1210Z and 1330Z observations, the 60 kt 1330Z observation indicates the ship was likely experiencing a lull at that time, since winds were higher again later. The Manzanillo Observatory recorded a minimum pressure of 969.5 mb at 1230Z. The pressure was 972.9 mb at 13Z, and this was also about the time when the max wind of 126 kt WSW is reported to have occurred. (More information on this wind observation can be found in the Winds section, below.) It should be noted that the Observatory pressure was recorded at a different location in the City than the winds—at the home of the Observatory supervisor, Mr. Alejandro Ramos Mendez de Leon: 19.04917N 104.3156W, ~ 6-7 m ASL. Observations from the CACALILAO, MARY BARBARA, and the Observatory all support the analyzed landfall pressure of 955 mb.
Winds A central pressure of 955 mb equals 108 kt according to the Brown et al. (2006) S-of-25N and intensifying relationship. The forward speed of the hurricane was a slow 5-6 kt. The radius of maximum winds (RMW) of this hurricane at landfall is estimated to have been in the range of 5-10 n mi—and likely around 7-8 n mi. This estimate is based on wind observations (and lulls) from multiple points, the storm’s forward speed, and the Mexican government’s report (in Boletin Hidrologico No. 16) which describes a small, compact cyclone, with the maximum winds occurring in Manzanillo and Santiago Bays (a small area, only ~6 n mi wide), and the zone of “considerable damage” being “relatively small”, stretching only 120 km (65 n mi) along the Colima coast, from Barra de Navidad, Jalisco, to Coahuayana, Michoacan. Based on the size and speed taken together, 5 kt is added to the pressure-wind relationship to arrive at a value of 113 kt—for a first guess at the intensity based on the pressure-wind relationship alone. The CACALILAO and the MARY BARBARA both estimated winds at or above 135 kt—however, ship estimates of major hurricane winds have limited accuracy.
HURRICANE REANALYSIS
__
Reanalysis of Great Mexico Hurricane 1959 – 02.03.16
© 2016 Hagen, Morgerman, Sereno, González page 6 / 12
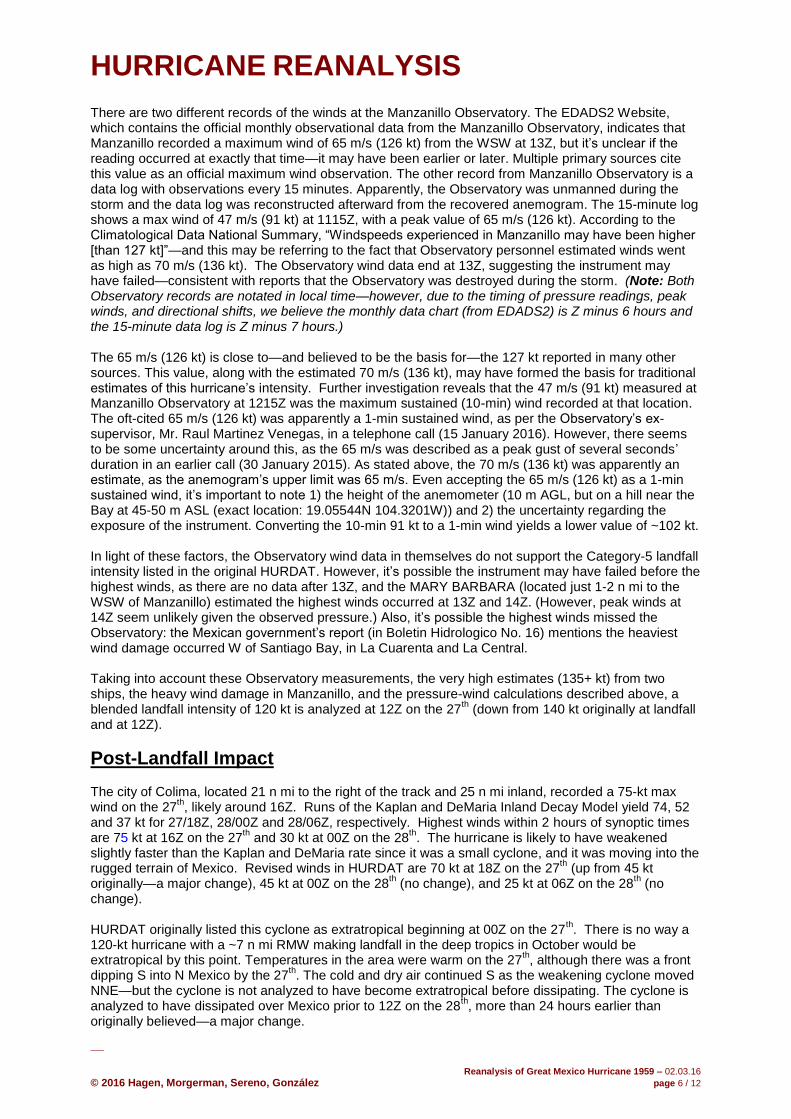
There are two different records of the winds at the Manzanillo Observatory. The EDADS2 Website, which contains the official monthly observational data from the Manzanillo Observatory, indicates that Manzanillo recorded a maximum wind of 65 m/s (126 kt) from the WSW at 13Z, but it’s unclear if the reading occurred at exactly that time—it may have been earlier or later. Multiple primary sources cite this value as an official maximum wind observation. The other record from Manzanillo Observatory is a data log with observations every 15 minutes. Apparently, the Observatory was unmanned during the storm and the data log was reconstructed afterward from the recovered anemogram. The 15-minute log shows a max wind of 47 m/s (91 kt) at 1115Z, with a peak value of 65 m/s (126 kt). According to the Climatological Data National Summary, “Windspeeds experienced in Manzanillo may have been higher [than 127 kt]”—and this may be referring to the fact that Observatory personnel estimated winds went as high as 70 m/s (136 kt). The Observatory wind data end at 13Z, suggesting the instrument may have failed—consistent with reports that the Observatory was destroyed during the storm. (Note: Both Observatory records are notated in local time—however, due to the timing of pressure readings, peak winds, and directional shifts, we believe the monthly data chart (from EDADS2) is Z minus 6 hours and the 15-minute data log is Z minus 7 hours.) The 65 m/s (126 kt) is close to—and believed to be the basis for—the 127 kt reported in many other sources. This value, along with the estimated 70 m/s (136 kt), may have formed the basis for traditional estimates of this hurricane’s intensity. Further investigation reveals that the 47 m/s (91 kt) measured at Manzanillo Observatory at 1215Z was the maximum sustained (10-min) wind recorded at that location. The oft-cited 65 m/s (126 kt) was apparently a 1-min sustained wind, as per the Observatory’s ex-supervisor, Mr. Raul Martinez Venegas, in a telephone call (15 January 2016). However, there seems to be some uncertainty around this, as the 65 m/s was described as a peak gust of several seconds’ duration in an earlier call (30 January 2015). As stated above, the 70 m/s (136 kt) was apparently an estimate, as the anemogram’s upper limit was 65 m/s. Even accepting the 65 m/s (126 kt) as a 1-min sustained wind, it’s important to note 1) the height of the anemometer (10 m AGL, but on a hill near the Bay at 45-50 m ASL (exact location: 19.05544N 104.3201W)) and 2) the uncertainty regarding the exposure of the instrument. Converting the 10-min 91 kt to a 1-min wind yields a lower value of ~102 kt. In light of these factors, the Observatory wind data in themselves do not support the Category-5 landfall intensity listed in the original HURDAT. However, it’s possible the instrument may have failed before the highest winds, as there are no data after 13Z, and the MARY BARBARA (located just 1-2 n mi to the WSW of Manzanillo) estimated the highest winds occurred at 13Z and 14Z. (However, peak winds at 14Z seem unlikely given the observed pressure.) Also, it’s possible the highest winds missed the Observatory: the Mexican government’s report (in Boletin Hidrologico No. 16) mentions the heaviest wind damage occurred W of Santiago Bay, in La Cuarenta and La Central. Taking into account these Observatory measurements, the very high estimates (135+ kt) from two ships, the heavy wind damage in Manzanillo, and the pressure-wind calculations described above, a blended landfall intensity of 120 kt is analyzed at 12Z on the 27
th (down from 140 kt originally at landfall
and at 12Z).
Post-Landfall Impact The city of Colima, located 21 n mi to the right of the track and 25 n mi inland, recorded a 75-kt max wind on the 27
th, likely around 16Z. Runs of the Kaplan and DeMaria Inland Decay Model yield 74, 52
and 37 kt for 27/18Z, 28/00Z and 28/06Z, respectively. Highest winds within 2 hours of synoptic times are 75 kt at 16Z on the 27
th and 30 kt at 00Z on the 28
th. The hurricane is likely to have weakened
slightly faster than the Kaplan and DeMaria rate since it was a small cyclone, and it was moving into the rugged terrain of Mexico. Revised winds in HURDAT are 70 kt at 18Z on the 27
th (up from 45 kt
originally—a major change), 45 kt at 00Z on the 28th (no change), and 25 kt at 06Z on the 28
th (no
change). HURDAT originally listed this cyclone as extratropical beginning at 00Z on the 27
th. There is no way a
120-kt hurricane with a ~7 n mi RMW making landfall in the deep tropics in October would be extratropical by this point. Temperatures in the area were warm on the 27
th, although there was a front
dipping S into N Mexico by the 27th. The cold and dry air continued S as the weakening cyclone moved
NNE—but the cyclone is not analyzed to have become extratropical before dissipating. The cyclone is analyzed to have dissipated over Mexico prior to 12Z on the 28
th, more than 24 hours earlier than
originally believed—a major change.

HURRICANE REANALYSIS
__
Reanalysis of Great Mexico Hurricane 1959 – 02.03.16
© 2016 Hagen, Morgerman, Sereno, González page 7 / 12
Original & Recommended Revised HURDAT Format where there are changes to the existing HURDAT: Original Line Revised Line ___ The 22
nd is new to HURDAT
10/22 12Z: 12.2N 95.1W 40 kt 10/22 18Z: 12.4N 95.7W 45 kt 10/23 00Z: 12.6N 96.7W 75 kt (original) 10/23 00Z: 12.6N 96.5W 50 kt (revised) 10/23 06Z: 12.7N 97.6W 75 kt 10/23 06Z: 12.8N 97.3W 55 kt 10/23 12Z: 13.0N 98.5W 75 kt 10/23 12Z: 13.1N 98.2W 60 kt 10/23 18Z: 13.5N 99.3W 75 kt 10/23 18Z: 13.5N 99.2W 70 kt 10/24 00Z: 14.0N 100.0W 75 kt (no changes) 10/24 06Z: 14.5N 100.8W 75 kt (no changes) 10/24 12Z: 15.0N 101.6W 75 kt (no changes) 10/24 18Z: 15.6N 102.3W 75 kt 10/24 18Z: 15.5N 102.2W 80 kt 10/25 00Z: 16.1N 102.9W 100 kt 10/25 00Z: 16.0N 102.7W 90 kt 10/25 06Z: 16.5N 103.4W 100 kt 10/25 06Z: 16.4N 103.3W 95 kt 10/25 12Z: 16.8N 103.9W 110 kt 10/25 12Z: 16.7N 103.9W 100 kt 10/25 18Z: 17.0N 104.5W 110 kt 10/25 18Z: 17.0N 104.5W 105 kt 10/26 00Z: 17.2N 105.2W 120 kt 10/26 00Z: 17.2N 105.1W 110 kt 10/26 06Z: 17.5N 105.6W 120 kt 10/26 06Z: 17.5N 105.4W 115 kt 10/26 12Z: 17.8N 105.8W 120 kt 10/26 12Z: 17.8N 105.5W 115 kt 10/26 18Z: 18.3N 105.7W 120 kt 10/26 18Z: 18.1N 105.4W 115 kt
HURRICANE REANALYSIS
__
Reanalysis of Great Mexico Hurricane 1959 – 02.03.16
© 2016 Hagen, Morgerman, Sereno, González page 8 / 12
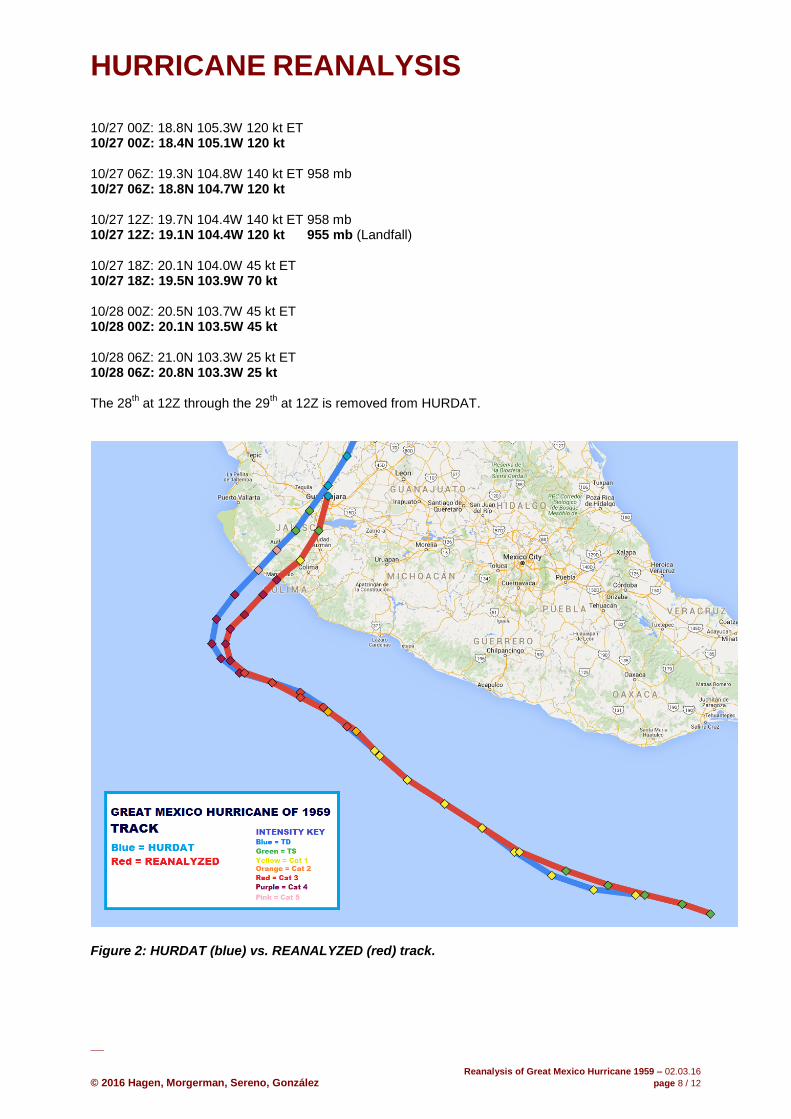
10/27 00Z: 18.8N 105.3W 120 kt ET 10/27 00Z: 18.4N 105.1W 120 kt 10/27 06Z: 19.3N 104.8W 140 kt ET 958 mb 10/27 06Z: 18.8N 104.7W 120 kt 10/27 12Z: 19.7N 104.4W 140 kt ET 958 mb 10/27 12Z: 19.1N 104.4W 120 kt 955 mb (Landfall) 10/27 18Z: 20.1N 104.0W 45 kt ET 10/27 18Z: 19.5N 103.9W 70 kt 10/28 00Z: 20.5N 103.7W 45 kt ET 10/28 00Z: 20.1N 103.5W 45 kt 10/28 06Z: 21.0N 103.3W 25 kt ET 10/28 06Z: 20.8N 103.3W 25 kt The 28
th at 12Z through the 29
th at 12Z is removed from HURDAT.
Figure 2: HURDAT (blue) vs. REANALYZED (red) track.
HURRICANE REANALYSIS
__
Reanalysis of Great Mexico Hurricane 1959 – 02.03.16
© 2016 Hagen, Morgerman, Sereno, González page 9 / 12
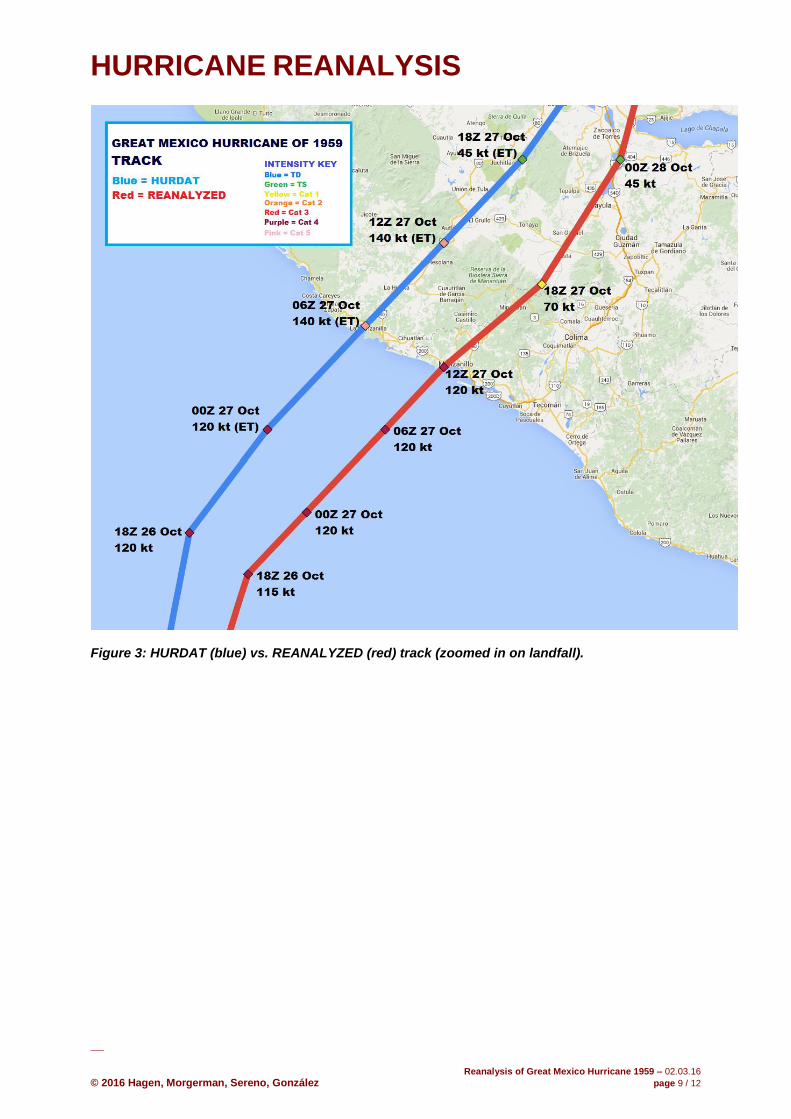
Figure 3: HURDAT (blue) vs. REANALYZED (red) track (zoomed in on landfall).
HURRICANE REANALYSIS
__
Reanalysis of Great Mexico Hurricane 1959 – 02.03.16
© 2016 Hagen, Morgerman, Sereno, González page 10 / 12
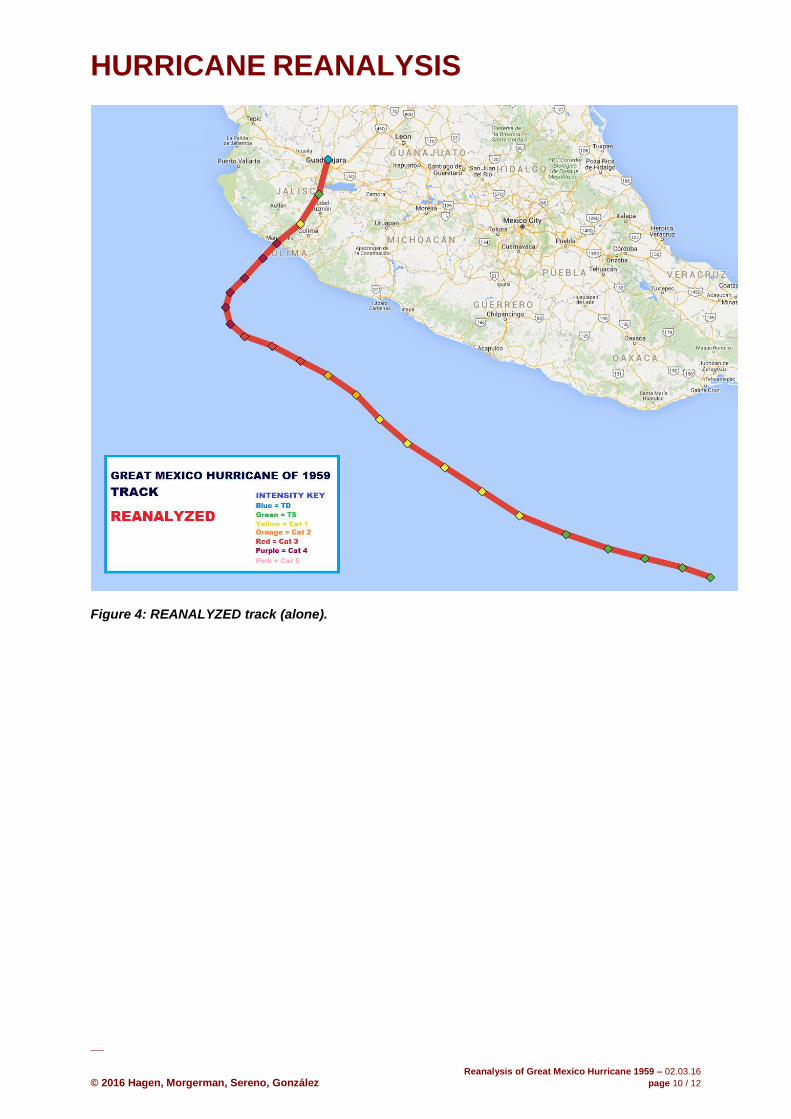
Figure 4: REANALYZED track (alone).

HURRICANE REANALYSIS
__
Reanalysis of Great Mexico Hurricane 1959 – 02.03.16
© 2016 Hagen, Morgerman, Sereno, González page 11 / 12
Interactive Map
A Google Map of this reanalysis is available at: http://goo.gl/tM5rfc The map has four layers:
Original HURDAT Track. This is the current, official best track. Blue vectors connect the 6-hour positions. Each point can be clicked for coordinates and intensity.
REANALYZED Track. This is our recommended, revised best track. Red vectors connect the 6-hour positions. Each point can be clicked for coordinates and intensity.
Boletin Hidrologico No.16. This maps the cyclone’s wind impacts, as described by the Mexican government’s report.
Key Locations. This maps important geographical locations and observation points mentioned in the analysis, as well as the estimated E edge of the eye at landfall.
When the map is first opened, all four layers are visible—however, layers can be turned off or on in any combination, depending on what the user would like to see. The user can also zoom in on specific locations, click map features to get more info, and use map tools to measure distances.
Figure 5: Interactive Google Map with layers tool.

HURRICANE REANALYSIS
__
Reanalysis of Great Mexico Hurricane 1959 – 02.03.16
© 2016 Hagen, Morgerman, Sereno, González page 12 / 12
Sources The following sources contributed to this reanalysis. Several of them are compiled in this Dropbox
folder: https://goo.gl/SjEc5p
Books & Documents Lozoya, Raymundo Padilla. El huracan del 59. Colima, Mexico: Universidad de Colima, 2006. Print. Secretaría de Recursos Hidráulicos (1961) Boletín Hidrológico No. 16., datos de la región Pacífico-Centro. Dirección de Hidrología, México, D.F. Zeluff, George N. (1960). Hurricane Off Manzanillo, Proceedings of the Merchant Marine Council, 17(5), 76-79. Fuller, John W. (1960). Mary Barbara Encounters Manzanillo Hurricane, Mariners Weather Log, 4(2), 27-29. Crooks, Raymond C. (1960). Tropical Cyclones in the Eastern North Pacific, 1959, Climatological Data National Summary—Annual 1959, 10(13), 63-66.
Historical Letters Garcia Castillo, Luis (1959). Personal letter, written to Claudia C. de Garcia in Manzanillo on 14 December 1959. Ramos Mendez de Leon, Alejandro (1960). Official, government-certified letter Re: observations in Manzanillo during the hurricane (by the Manzanillo Observatory’s supervisor at the time), written on 18 April 1960. Martinez Venegas, Raul (2010). Letter about the hurricane’s effects in Manzanillo (by one of the Manzanillo Observatory’s ex-supervisors), written on 27 October 2010.
Data Records Monthly data record from the Manzanillo Observatory (Servicio Meteorologico Mexicano) for October 1959. Handwritten, 15-minutely wind data log from the Manzanillo Observatory (Servicio Meteorologico Mexicano) for 27 October 1959.
Personal Communications Personal letter from Raul Martinez Venegas, ex-supervisor of the Manzanillo Observatory. Phone calls with Raul Martinez Venegas, ex-supervisor of the Manzanillo Observatory, on 30 January 2015 and 15 January 2016.
Internet http://goo.gl/lsTM3x (firsthand account of storm) http://goo.gl/Slx3S2 (images of hurricane’s aftermath in Manzanillo) http://goo.gl/4WMFLp (images of hurricane’s aftermath in Manzanillo)