Embed Size (px)
Citation preview
NOAA Water Level and Meteorological Data Report HURRICANE MATTHEW
Silver Spring, Maryland February 28, 2017
noaa National Oceanic and Atmospheric Administration U.S. DEPARTMENT OF COMMERCE National Ocean Service Center for Operational Oceanographic Products and Services
Photo Credit: NOAA National Environmental Satellite, Data & Information Service GOES Imagery
NOAA Water Level and Meteorological Data Report Hurricane MATTHEW Kiera O’Donnell, Alison Carisio, Ashley Miller, Paul Fanelli February 17, 2017
noaa National Oceanic and Atmospheric Administration U.S. DEPARTMENT National Oceanic and National Ocean Service OF COMMERCE Atmospheric Administration Russell Callender Wilbur Ross Ben Friedman Assistant Administrator Secretary Acting Administrator
Center for Operational Oceanographic Products and Services Director, Richard Edwing
NOAA NOS Hurricane Matthew Water Level & Meteorological Data Report 3
Table of Contents Overview ...................................................................................................................................................... 4 Hurricane Matthew Summary ................................................................................................................... 5 Map of NOS Water Level Station Locations ............................................................................................ 6 Table of Maximum Recorded Water Levels (Storm Tide) ...................................................................... 8 Table of Maximum Recorded Water Level Residuals (Storm Surge).................................................. 10 Table of Maximum Wind Speed and Minimum Barometric Pressure ................................................ 11 Stations that Exceeded Historical Maximum Water Levels ................................................................. 13 Time-Series Plots of Observed, Predicted and Residual Water Levels ................................................ 14 Acknowledgements ................................................................................................................................... 28 Contact Information ................................................................................................................................. 29 Table of NOS Water Level Station Locations ........................................................................................ 30 Definitions .................................................................................................................................................. 31
NOAA NOS Hurricane Matthew Water Level & Meteorological Data Report 4
Overview
The National Oceanic and Atmospheric Administration (NOAA) Center for Operational Oceanographic Products and Services (CO-OPS) maintains a network of oceanographic and meteorological stations along the United States coastlines and Great Lakes to monitor water levels, winds (speed, direction and gusts), barometric pressure, and air/water temperature. This report documents the elevated water levels, high winds and reduced barometric pressures recorded at stations along the East Coast of the U.S. from Florida to Delaware during Hurricane Matthew, which occurred September 28 – October 10, 2016.
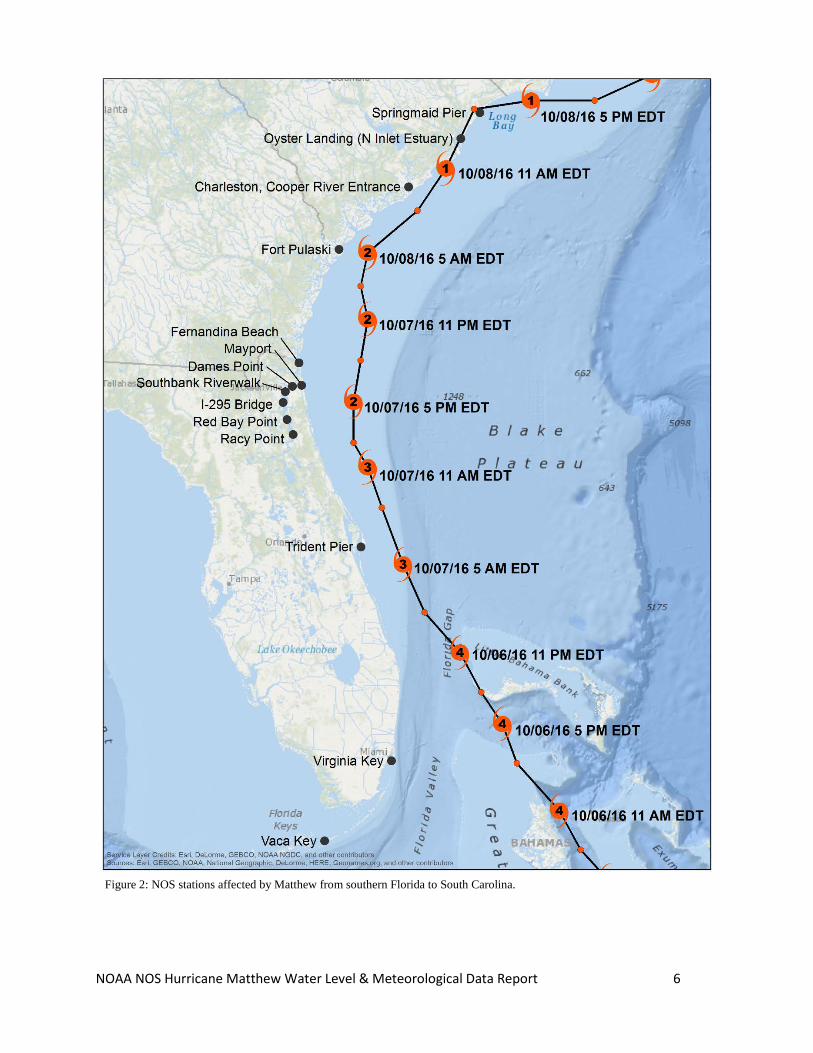
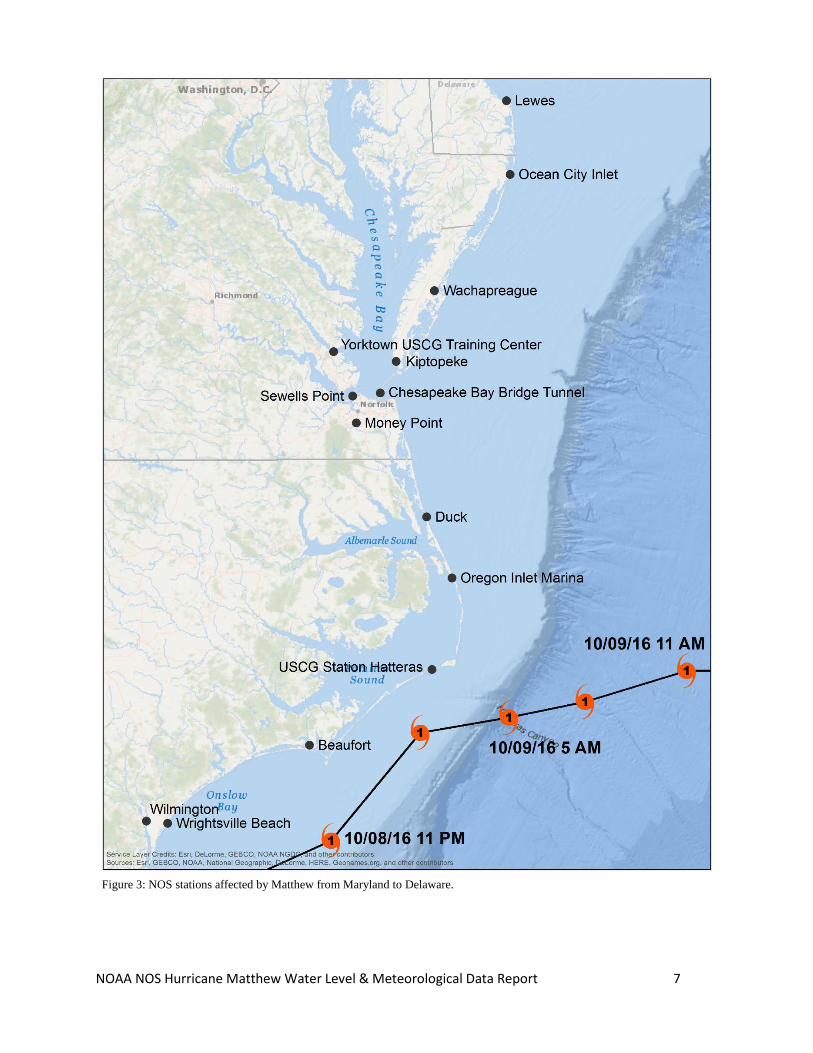
Station information and locations are contained in Figures 2-3 and Appendices 1 & 2. Tidal stations are referenced to Mean Higher High Water (MHHW), based on the National Tidal Datum Epoch 1983-2001 (Appendix 3). In addition, at several locations along the U.S. coast, water levels are provided relative to a geodetic reference datum, the North American Vertical Datum of 1988 (NAVD88), to assist in relating water levels to coastal inundation estimates.
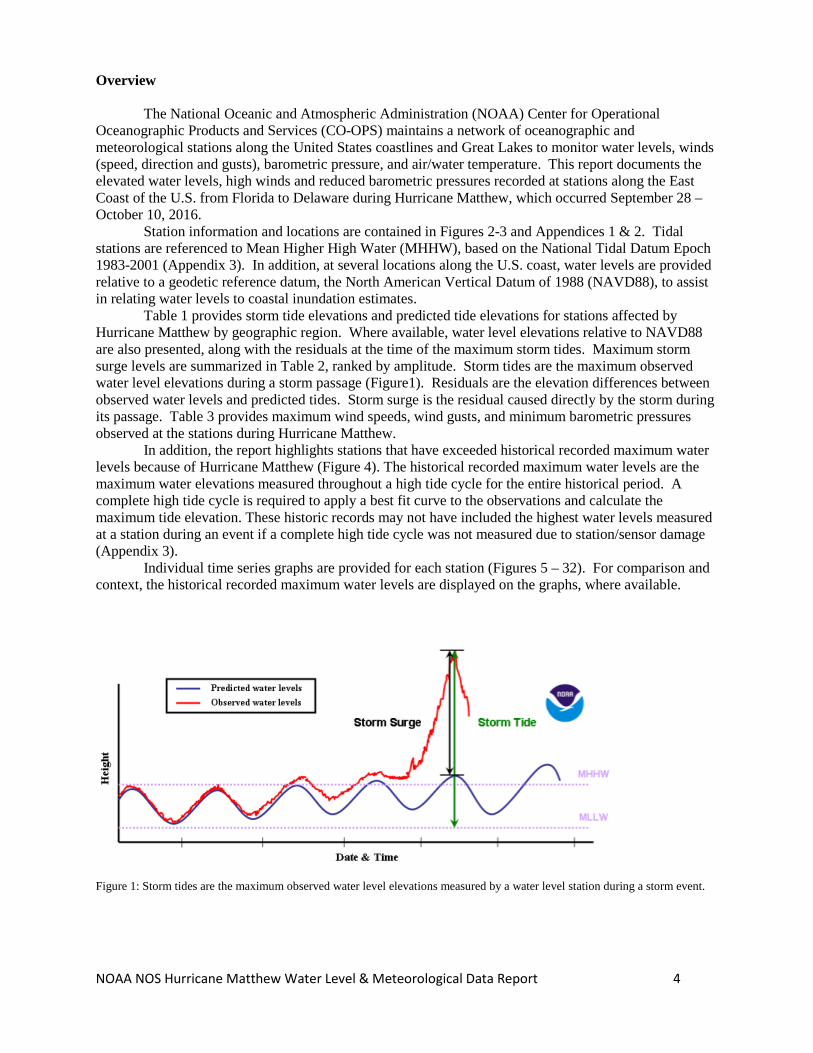
Table 1 provides storm tide elevations and predicted tide elevations for stations affected by Hurricane Matthew by geographic region. Where available, water level elevations relative to NAVD88 are also presented, along with the residuals at the time of the maximum storm tides. Maximum storm surge levels are summarized in Table 2, ranked by amplitude. Storm tides are the maximum observed water level elevations during a storm passage (Figure1). Residuals are the elevation differences between observed water levels and predicted tides. Storm surge is the residual caused directly by the storm during its passage. Table 3 provides maximum wind speeds, wind gusts, and minimum barometric pressures observed at the stations during Hurricane Matthew.
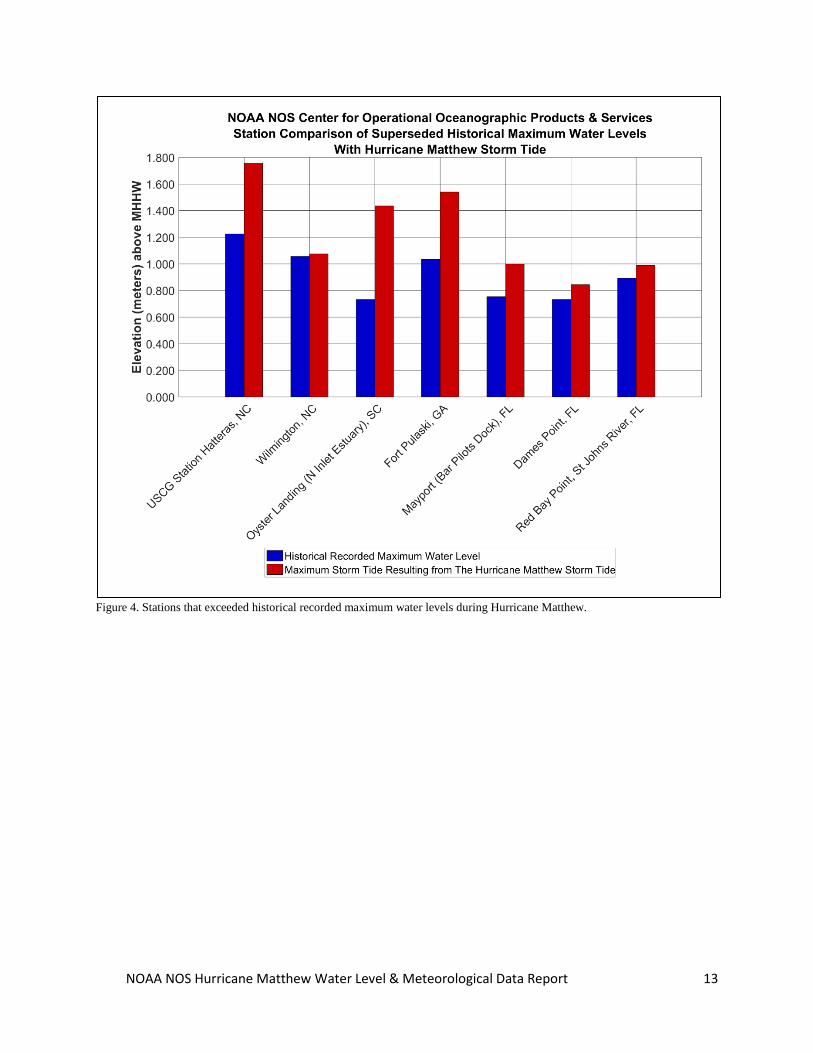
In addition, the report highlights stations that have exceeded historical recorded maximum water levels because of Hurricane Matthew (Figure 4). The historical recorded maximum water levels are the maximum water elevations measured throughout a high tide cycle for the entire historical period. A complete high tide cycle is required to apply a best fit curve to the observations and calculate the maximum tide elevation. These historic records may not have included the highest water levels measured at a station during an event if a complete high tide cycle was not measured due to station/sensor damage (Appendix 3).
Individual time series graphs are provided for each station (Figures 5 – 32). For comparison and context, the historical recorded maximum water levels are displayed on the graphs, where available.
Figure 1: Storm tides are the maximum observed water level elevations measured by a water level station during a storm event.
NOAA NOS Hurricane Matthew Water Level & Meteorological Data Report 5
Hurricane Matthew Summary
On September 28, 2016 Matthew initially formed as a tropical storm southeast of St. Lucia within the Windward Islands and quickly reached hurricane strength the following day as it made its way westward through the Caribbean Sea. Matthew then rapidly intensified to a Category 5 storm with winds of 160 mph late on September 30th, becoming the strongest Atlantic hurricane since Felix in 2007. Hurricane Matthew slowed down, taking a turn to the north over the next 2 days, eventually making landfall in western Haiti and eastern Cuba on October 4th bringing torrential rain and high winds causing widespread damage. By October 6th, Matthew took a turn to the northwest, making landfall again in the Bahamas resulting in hurricane warnings being issued for the eastern Florida and Georgia coast. A slowly weakening Matthew tracked northward, just off the Florida and Georgia coast before making landfall between Charleston and Myrtle Beach, SC on October 8th as a Category 1 hurricane with winds of 75 miles per hour. Matthew again moved off the coast, tracking eastward just off the southeast coast of North Carolina before the remnants of the storm moved out over the open Atlantic on October 9th. As Matthew tracked along the southeastern U.S. coastline, many areas also experienced heavy rain and strong winds, which elevated water levels in several locations to historic levels. By October 10th, water levels returned to normal tide levels at most locations and coastal winds diminished as the storm moved offshore. Although wind and storm surge related damage from Matthew was mostly limited to coastal areas of Florida, Georgia, and South Carolina, heavy rainfall that spread inland in the Carolinas and Virginia caused widespread flooding, keeping water levels elevated several days after the storm moved out.
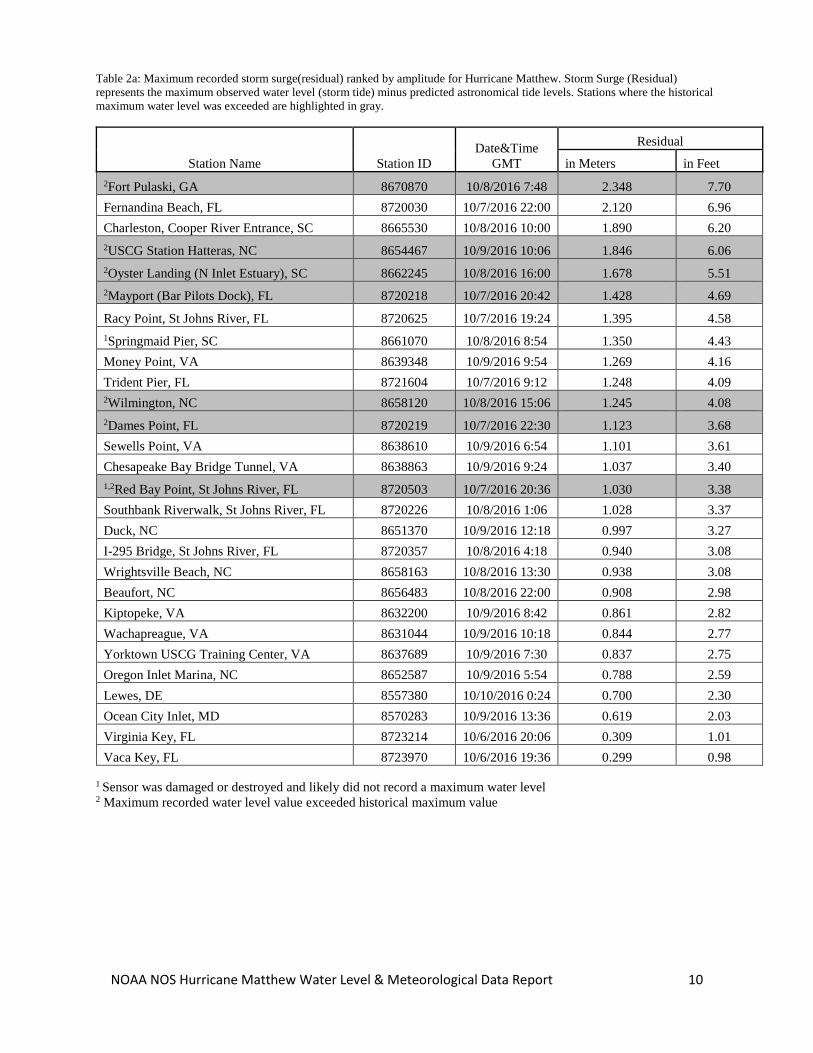
While the storm affected much of the southeast and Mid-Atlantic coast, the most significant water level impacts were observed from northern Florida through South Carolina. The maximum storm surge/residual from Florida to Delaware ranged from 0.299 to 2.348 m (0.98 to 7.70 ft.) above normal tide levels with the highest value of 2.348 m (7.70 ft.) measured at Fort Pulaski, GA on 10/08/2016 07:48 GMT. In addition to Fort Pulaski, GA, the peak storm surge/residual exceeded 6 feet above normal tide levels at Fernandina Beach, FL, Charleston, SC and USCG Hatteras, NC. Within St. Johns River, Florida, the peak residuals ranged from 0.940 to 1.428 m (3.08 to 4.69 feet) above normal tide levels. Farther north, from Duck, NC to Lewes, DE including the entrance to Chesapeake Bay, peak storm surge/residuals ranged from 0.619 to 1.269 m (2.30 to 4.16 feet) above normal tide levels.
While the highest total water level from Matthew was generally observed from northern Florida to South Carolina, including the St. Johns River, the peak water level during the storm was actually measured at USCG Station Hatteras, NC, located on the Pamlico Sound side. This station measured a storm tide of 1.757 m (5.76 ft.) above MHHW on 10/09/2016 10:00 GMT, breaking the historical maximum water level of 1.227 m (4.02 ft.) previously set during Hurricane Sandy on 10/29/2012. In all, seven stations exceeded historical maximum water levels during Matthew, most notably Fort Pulaski, GA, where water levels reached 1.540 m (5.05 ft.) above MHHW on 10/08/2016 07:42 GMT, breaking the historical maximum value of 1.036 m (3.40 ft.) above MHHW previously set on 10/15/1947 during the Cape Sable Hurricane. The peak water level of 1.431 m (4.69 ft.) at Oyster Landing, SC far exceeded the historical maximum value of 0.739 m (2.42 ft.) previously set on 10/26/2011 during Hurricane Irene. Most other stations along the Atlantic Coast from northern Florida to the entrance to Chesapeake Bay experienced a peak water level ranging from 0.580 - 1.271 m (1.90 – 4.17 ft.). The storm was responsible for the destruction of the iconic Springmaid Pier in Myrtle Beach, SC along with the tide gauge equipment installed on the pier.
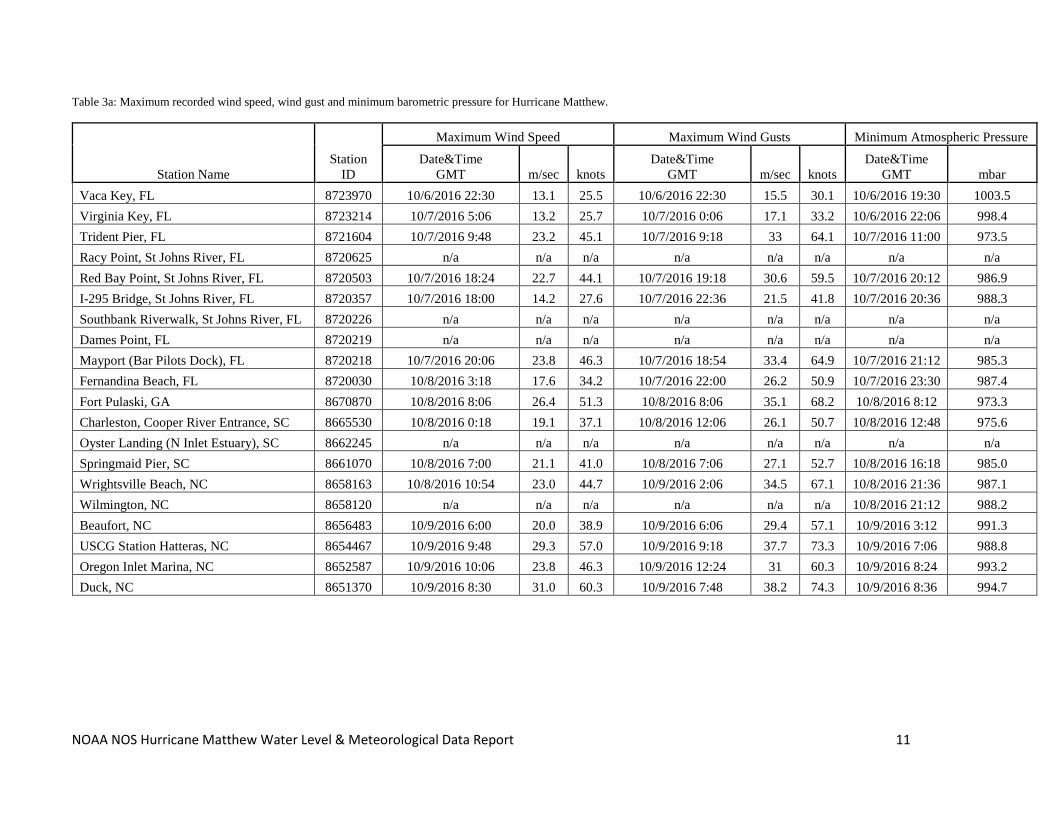
The highest wind speed recorded at NOS water level stations from Vaca Key, Florida to Lewes, Delaware during Hurricane Matthew was 31.0 m/s (60.3 kts) at USCG Station Hatteras, NC on 10/09/2016 10:00 GMT. The highest wind gust also was recorded at USCG Station Hatteras, NC and measured 38.2 m/s (74.3 kts) on 10/09/2016 08:30 GMT. The minimum barometric pressure recorded was 973.3 mb at Fort Pulaski, GA on 10/08/2016, 08:12 GMT.
More information, data and storm reports can be found at the CO-OPS website, https://tidesandcurrents.noaa.gov. Storm reports are located under the Publications section of the webpage.
NOAA NOS Hurricane Matthew Water Level & Meteorological Data Report 6
Figure 2: NOS stations affected by Matthew from southern Florida to South Carolina.
NOAA NOS Hurricane Matthew Water Level & Meteorological Data Report 7
Figure 3: NOS stations affected by Matthew from Maryland to Delaware.
NOAA NOS Hurricane Matthew Water Level & Meteorological Data Report 8
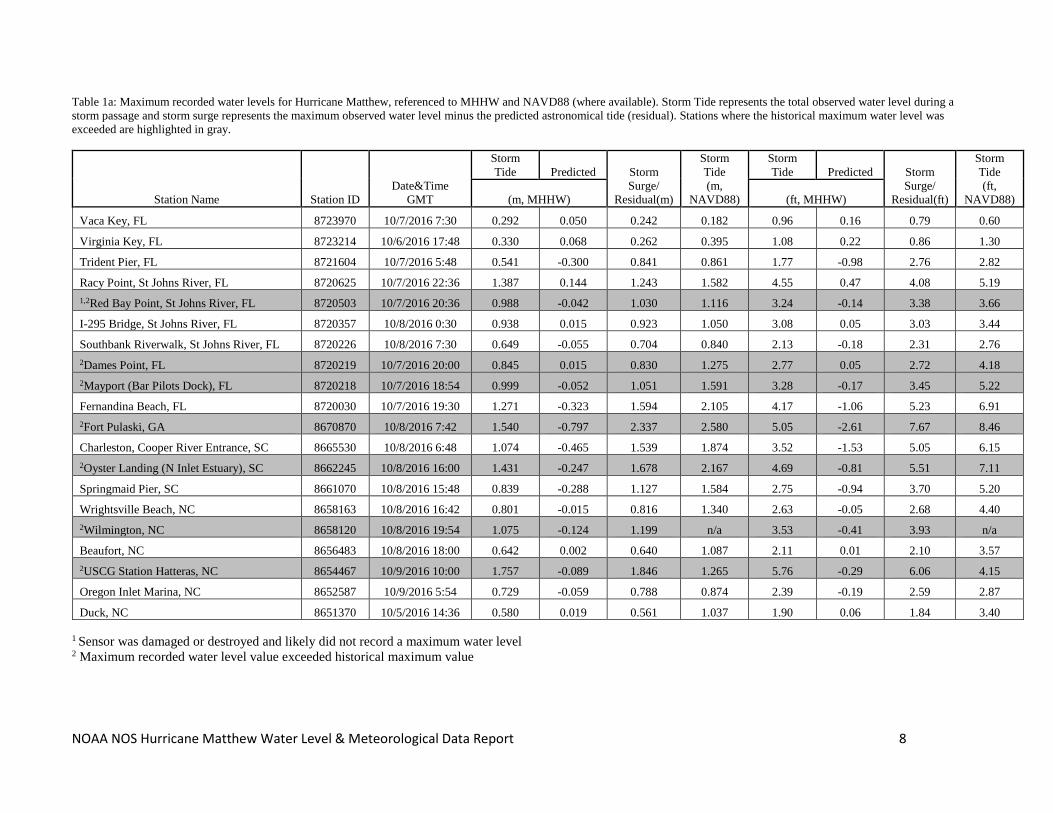
Table 1a: Maximum recorded water levels for Hurricane Matthew, referenced to MHHW and NAVD88 (where available). Storm Tide represents the total observed water level during a storm passage and storm surge represents the maximum observed water level minus the predicted astronomical tide (residual). Stations where the historical maximum water level was exceeded are highlighted in gray.
Station Name Station ID Date&Time
GMT
Storm Tide Predicted Storm
Surge/ Residual(m)
Storm Tide (m,
NAVD88)
Storm Tide Predicted Storm
Surge/ Residual(ft)
Storm Tide (ft,
NAVD88) (m, MHHW) (ft, MHHW)
Vaca Key, FL 8723970 10/7/2016 7:30 0.292 0.050 0.242 0.182 0.96 0.16 0.79 0.60
Virginia Key, FL 8723214 10/6/2016 17:48 0.330 0.068 0.262 0.395 1.08 0.22 0.86 1.30
Trident Pier, FL 8721604 10/7/2016 5:48 0.541 -0.300 0.841 0.861 1.77 -0.98 2.76 2.82
Racy Point, St Johns River, FL 8720625 10/7/2016 22:36 1.387 0.144 1.243 1.582 4.55 0.47 4.08 5.19 1,2Red Bay Point, St Johns River, FL 8720503 10/7/2016 20:36 0.988 -0.042 1.030 1.116 3.24 -0.14 3.38 3.66
I-295 Bridge, St Johns River, FL 8720357 10/8/2016 0:30 0.938 0.015 0.923 1.050 3.08 0.05 3.03 3.44
Southbank Riverwalk, St Johns River, FL 8720226 10/8/2016 7:30 0.649 -0.055 0.704 0.840 2.13 -0.18 2.31 2.76 2Dames Point, FL 8720219 10/7/2016 20:00 0.845 0.015 0.830 1.275 2.77 0.05 2.72 4.18 2Mayport (Bar Pilots Dock), FL 8720218 10/7/2016 18:54 0.999 -0.052 1.051 1.591 3.28 -0.17 3.45 5.22
Fernandina Beach, FL 8720030 10/7/2016 19:30 1.271 -0.323 1.594 2.105 4.17 -1.06 5.23 6.91 2Fort Pulaski, GA 8670870 10/8/2016 7:42 1.540 -0.797 2.337 2.580 5.05 -2.61 7.67 8.46
Charleston, Cooper River Entrance, SC 8665530 10/8/2016 6:48 1.074 -0.465 1.539 1.874 3.52 -1.53 5.05 6.15 2Oyster Landing (N Inlet Estuary), SC 8662245 10/8/2016 16:00 1.431 -0.247 1.678 2.167 4.69 -0.81 5.51 7.11
Springmaid Pier, SC 8661070 10/8/2016 15:48 0.839 -0.288 1.127 1.584 2.75 -0.94 3.70 5.20
Wrightsville Beach, NC 8658163 10/8/2016 16:42 0.801 -0.015 0.816 1.340 2.63 -0.05 2.68 4.40 2Wilmington, NC 8658120 10/8/2016 19:54 1.075 -0.124 1.199 n/a 3.53 -0.41 3.93 n/a
Beaufort, NC 8656483 10/8/2016 18:00 0.642 0.002 0.640 1.087 2.11 0.01 2.10 3.57 2USCG Station Hatteras, NC 8654467 10/9/2016 10:00 1.757 -0.089 1.846 1.265 5.76 -0.29 6.06 4.15
Oregon Inlet Marina, NC 8652587 10/9/2016 5:54 0.729 -0.059 0.788 0.874 2.39 -0.19 2.59 2.87
Duck, NC 8651370 10/5/2016 14:36 0.580 0.019 0.561 1.037 1.90 0.06 1.84 3.40 1 Sensor was damaged or destroyed and likely did not record a maximum water level 2 Maximum recorded water level value exceeded historical maximum value
NOAA NOS Hurricane Matthew Water Level & Meteorological Data Report 9
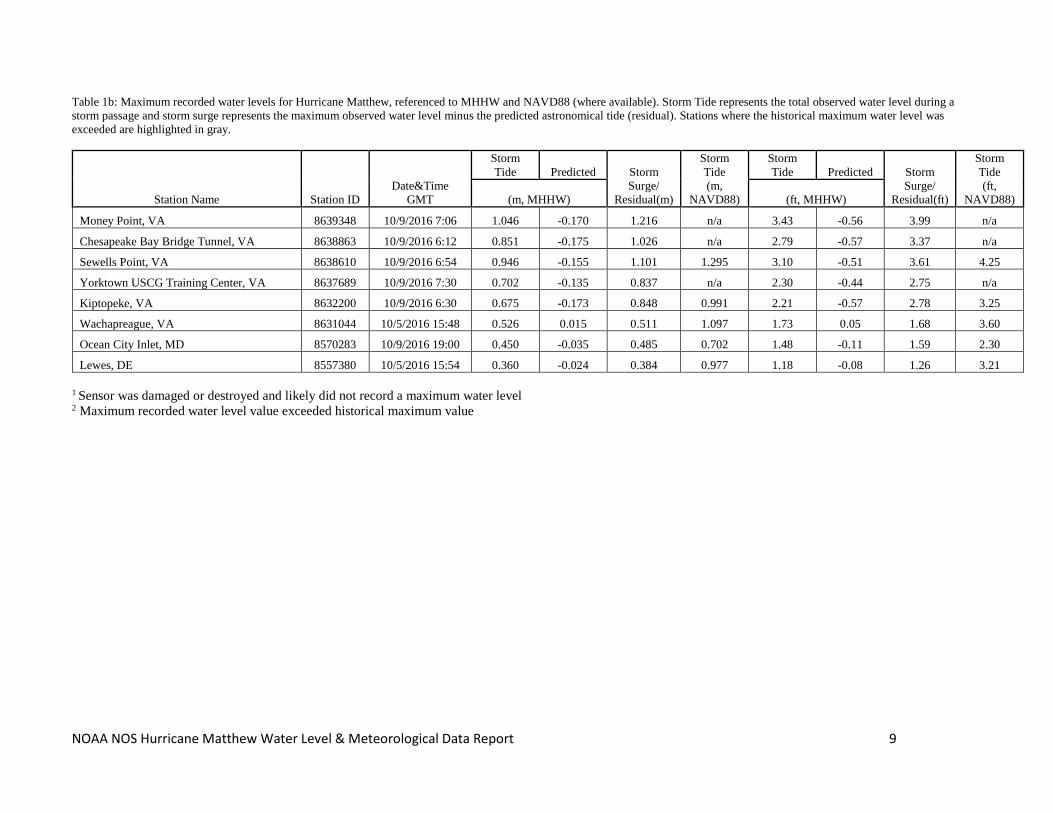
Table 1b: Maximum recorded water levels for Hurricane Matthew, referenced to MHHW and NAVD88 (where available). Storm Tide represents the total observed water level during a storm passage and storm surge represents the maximum observed water level minus the predicted astronomical tide (residual). Stations where the historical maximum water level was exceeded are highlighted in gray.
Station Name Station ID Date&Time
GMT
Storm Tide Predicted Storm
Surge/ Residual(m)
Storm Tide (m,
NAVD88)
Storm Tide Predicted Storm
Surge/ Residual(ft)
Storm Tide (ft,
NAVD88) (m, MHHW) (ft, MHHW)
Money Point, VA 8639348 10/9/2016 7:06 1.046 -0.170 1.216 n/a 3.43 -0.56 3.99 n/a
Chesapeake Bay Bridge Tunnel, VA 8638863 10/9/2016 6:12 0.851 -0.175 1.026 n/a 2.79 -0.57 3.37 n/a
Sewells Point, VA 8638610 10/9/2016 6:54 0.946 -0.155 1.101 1.295 3.10 -0.51 3.61 4.25
Yorktown USCG Training Center, VA 8637689 10/9/2016 7:30 0.702 -0.135 0.837 n/a 2.30 -0.44 2.75 n/a
Kiptopeke, VA 8632200 10/9/2016 6:30 0.675 -0.173 0.848 0.991 2.21 -0.57 2.78 3.25
Wachapreague, VA 8631044 10/5/2016 15:48 0.526 0.015 0.511 1.097 1.73 0.05 1.68 3.60
Ocean City Inlet, MD 8570283 10/9/2016 19:00 0.450 -0.035 0.485 0.702 1.48 -0.11 1.59 2.30
Lewes, DE 8557380 10/5/2016 15:54 0.360 -0.024 0.384 0.977 1.18 -0.08 1.26 3.21
1 Sensor was damaged or destroyed and likely did not record a maximum water level 2 Maximum recorded water level value exceeded historical maximum value
NOAA NOS Hurricane Matthew Water Level & Meteorological Data Report 10
Table 2a: Maximum recorded storm surge(residual) ranked by amplitude for Hurricane Matthew. Storm Surge (Residual) represents the maximum observed water level (storm tide) minus predicted astronomical tide levels. Stations where the historical maximum water level was exceeded are highlighted in gray.
Station Name Station ID Date&Time
GMT
Residual
in Meters in Feet 2Fort Pulaski, GA 8670870 10/8/2016 7:48 2.348 7.70 Fernandina Beach, FL 8720030 10/7/2016 22:00 2.120 6.96 Charleston, Cooper River Entrance, SC 8665530 10/8/2016 10:00 1.890 6.20 2USCG Station Hatteras, NC 8654467 10/9/2016 10:06 1.846 6.06 2Oyster Landing (N Inlet Estuary), SC 8662245 10/8/2016 16:00 1.678 5.51 2Mayport (Bar Pilots Dock), FL 8720218 10/7/2016 20:42 1.428 4.69
Racy Point, St Johns River, FL 8720625 10/7/2016 19:24 1.395 4.58 1Springmaid Pier, SC 8661070 10/8/2016 8:54 1.350 4.43 Money Point, VA 8639348 10/9/2016 9:54 1.269 4.16 Trident Pier, FL 8721604 10/7/2016 9:12 1.248 4.09 2Wilmington, NC 8658120 10/8/2016 15:06 1.245 4.08 2Dames Point, FL 8720219 10/7/2016 22:30 1.123 3.68 Sewells Point, VA 8638610 10/9/2016 6:54 1.101 3.61 Chesapeake Bay Bridge Tunnel, VA 8638863 10/9/2016 9:24 1.037 3.40 1,2Red Bay Point, St Johns River, FL 8720503 10/7/2016 20:36 1.030 3.38 Southbank Riverwalk, St Johns River, FL 8720226 10/8/2016 1:06 1.028 3.37 Duck, NC 8651370 10/9/2016 12:18 0.997 3.27 I-295 Bridge, St Johns River, FL 8720357 10/8/2016 4:18 0.940 3.08 Wrightsville Beach, NC 8658163 10/8/2016 13:30 0.938 3.08 Beaufort, NC 8656483 10/8/2016 22:00 0.908 2.98 Kiptopeke, VA 8632200 10/9/2016 8:42 0.861 2.82 Wachapreague, VA 8631044 10/9/2016 10:18 0.844 2.77 Yorktown USCG Training Center, VA 8637689 10/9/2016 7:30 0.837 2.75 Oregon Inlet Marina, NC 8652587 10/9/2016 5:54 0.788 2.59 Lewes, DE 8557380 10/10/2016 0:24 0.700 2.30 Ocean City Inlet, MD 8570283 10/9/2016 13:36 0.619 2.03 Virginia Key, FL 8723214 10/6/2016 20:06 0.309 1.01 Vaca Key, FL 8723970 10/6/2016 19:36 0.299 0.98
1 Sensor was damaged or destroyed and likely did not record a maximum water level 2 Maximum recorded water level value exceeded historical maximum value
NOAA NOS Hurricane Matthew Water Level & Meteorological Data Report 11
Table 3a: Maximum recorded wind speed, wind gust and minimum barometric pressure for Hurricane Matthew.
Station Name Station
ID
Maximum Wind Speed Maximum Wind Gusts Minimum Atmospheric Pressure
Date&Time GMT m/sec knots
Date&Time GMT m/sec knots
Date&Time GMT mbar
Vaca Key, FL 8723970 10/6/2016 22:30 13.1 25.5 10/6/2016 22:30 15.5 30.1 10/6/2016 19:30 1003.5 Virginia Key, FL 8723214 10/7/2016 5:06 13.2 25.7 10/7/2016 0:06 17.1 33.2 10/6/2016 22:06 998.4 Trident Pier, FL 8721604 10/7/2016 9:48 23.2 45.1 10/7/2016 9:18 33 64.1 10/7/2016 11:00 973.5 Racy Point, St Johns River, FL 8720625 n/a n/a n/a n/a n/a n/a n/a n/a Red Bay Point, St Johns River, FL 8720503 10/7/2016 18:24 22.7 44.1 10/7/2016 19:18 30.6 59.5 10/7/2016 20:12 986.9 I-295 Bridge, St Johns River, FL 8720357 10/7/2016 18:00 14.2 27.6 10/7/2016 22:36 21.5 41.8 10/7/2016 20:36 988.3 Southbank Riverwalk, St Johns River, FL 8720226 n/a n/a n/a n/a n/a n/a n/a n/a Dames Point, FL 8720219 n/a n/a n/a n/a n/a n/a n/a n/a Mayport (Bar Pilots Dock), FL 8720218 10/7/2016 20:06 23.8 46.3 10/7/2016 18:54 33.4 64.9 10/7/2016 21:12 985.3 Fernandina Beach, FL 8720030 10/8/2016 3:18 17.6 34.2 10/7/2016 22:00 26.2 50.9 10/7/2016 23:30 987.4 Fort Pulaski, GA 8670870 10/8/2016 8:06 26.4 51.3 10/8/2016 8:06 35.1 68.2 10/8/2016 8:12 973.3 Charleston, Cooper River Entrance, SC 8665530 10/8/2016 0:18 19.1 37.1 10/8/2016 12:06 26.1 50.7 10/8/2016 12:48 975.6 Oyster Landing (N Inlet Estuary), SC 8662245 n/a n/a n/a n/a n/a n/a n/a n/a Springmaid Pier, SC 8661070 10/8/2016 7:00 21.1 41.0 10/8/2016 7:06 27.1 52.7 10/8/2016 16:18 985.0 Wrightsville Beach, NC 8658163 10/8/2016 10:54 23.0 44.7 10/9/2016 2:06 34.5 67.1 10/8/2016 21:36 987.1 Wilmington, NC 8658120 n/a n/a n/a n/a n/a n/a 10/8/2016 21:12 988.2 Beaufort, NC 8656483 10/9/2016 6:00 20.0 38.9 10/9/2016 6:06 29.4 57.1 10/9/2016 3:12 991.3 USCG Station Hatteras, NC 8654467 10/9/2016 9:48 29.3 57.0 10/9/2016 9:18 37.7 73.3 10/9/2016 7:06 988.8 Oregon Inlet Marina, NC 8652587 10/9/2016 10:06 23.8 46.3 10/9/2016 12:24 31 60.3 10/9/2016 8:24 993.2 Duck, NC 8651370 10/9/2016 8:30 31.0 60.3 10/9/2016 7:48 38.2 74.3 10/9/2016 8:36 994.7
NOAA NOS Hurricane Matthew Water Level & Meteorological Data Report 12
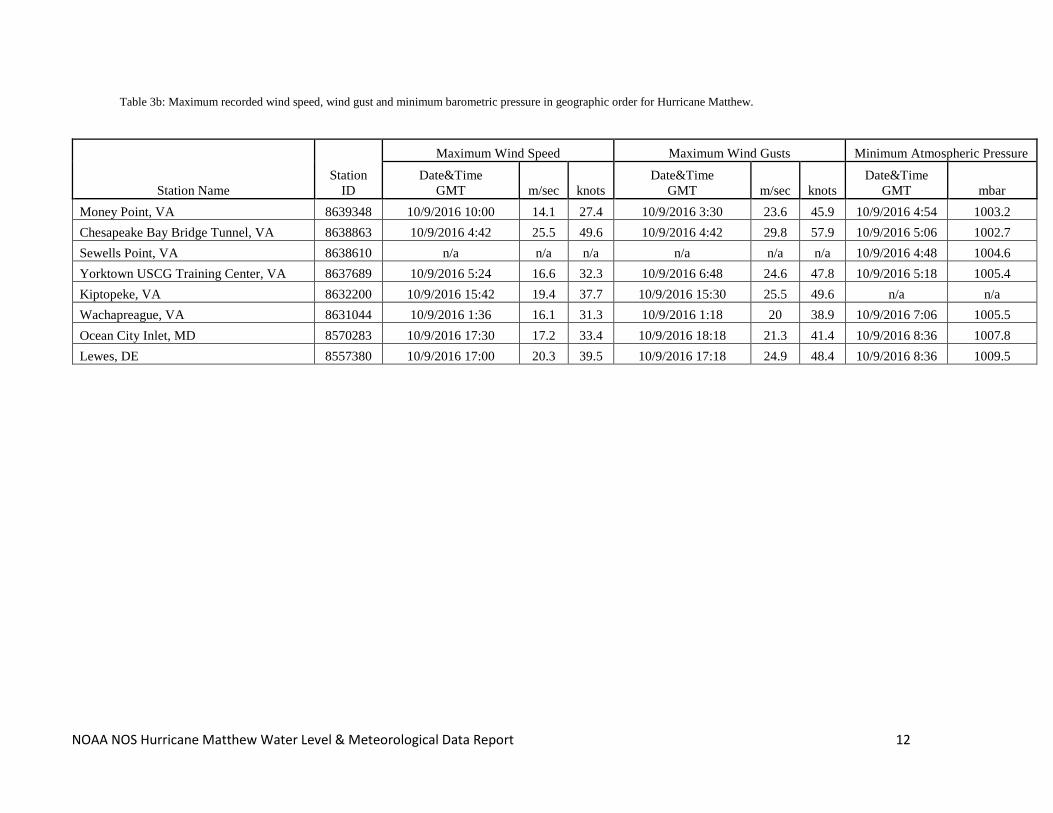
Table 3b: Maximum recorded wind speed, wind gust and minimum barometric pressure in geographic order for Hurricane Matthew.
Station Name Station
ID
Maximum Wind Speed Maximum Wind Gusts Minimum Atmospheric Pressure Date&Time
GMT m/sec knots Date&Time
GMT m/sec knots Date&Time
GMT mbar Money Point, VA 8639348 10/9/2016 10:00 14.1 27.4 10/9/2016 3:30 23.6 45.9 10/9/2016 4:54 1003.2 Chesapeake Bay Bridge Tunnel, VA 8638863 10/9/2016 4:42 25.5 49.6 10/9/2016 4:42 29.8 57.9 10/9/2016 5:06 1002.7 Sewells Point, VA 8638610 n/a n/a n/a n/a n/a n/a 10/9/2016 4:48 1004.6 Yorktown USCG Training Center, VA 8637689 10/9/2016 5:24 16.6 32.3 10/9/2016 6:48 24.6 47.8 10/9/2016 5:18 1005.4 Kiptopeke, VA 8632200 10/9/2016 15:42 19.4 37.7 10/9/2016 15:30 25.5 49.6 n/a n/a Wachapreague, VA 8631044 10/9/2016 1:36 16.1 31.3 10/9/2016 1:18 20 38.9 10/9/2016 7:06 1005.5 Ocean City Inlet, MD 8570283 10/9/2016 17:30 17.2 33.4 10/9/2016 18:18 21.3 41.4 10/9/2016 8:36 1007.8 Lewes, DE 8557380 10/9/2016 17:00 20.3 39.5 10/9/2016 17:18 24.9 48.4 10/9/2016 8:36 1009.5
NOAA NOS Hurricane Matthew Water Level & Meteorological Data Report 13
Figure 4. Stations that exceeded historical recorded maximum water levels during Hurricane Matthew.
NOAA NOS Hurricane Matthew Water Level & Meteorological Data Report 14
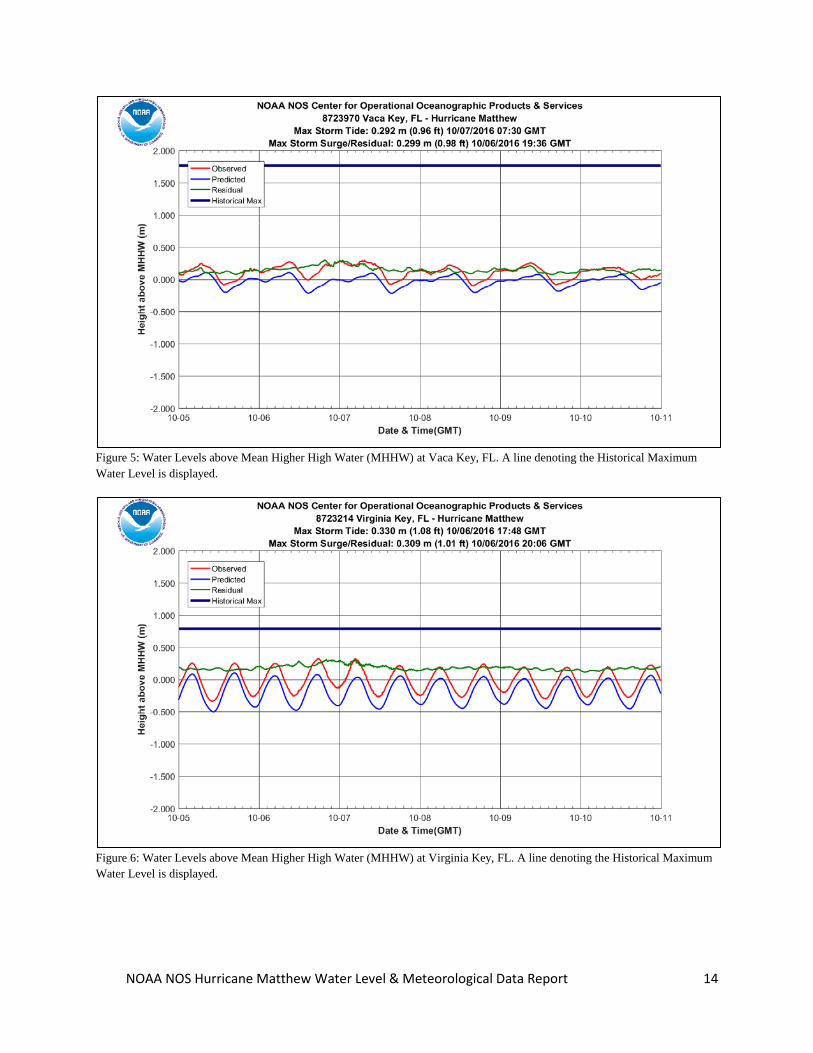
Figure 5: Water Levels above Mean Higher High Water (MHHW) at Vaca Key, FL. A line denoting the Historical Maximum Water Level is displayed.
Figure 6: Water Levels above Mean Higher High Water (MHHW) at Virginia Key, FL. A line denoting the Historical Maximum Water Level is displayed.
NOAA NOS Hurricane Matthew Water Level & Meteorological Data Report 15
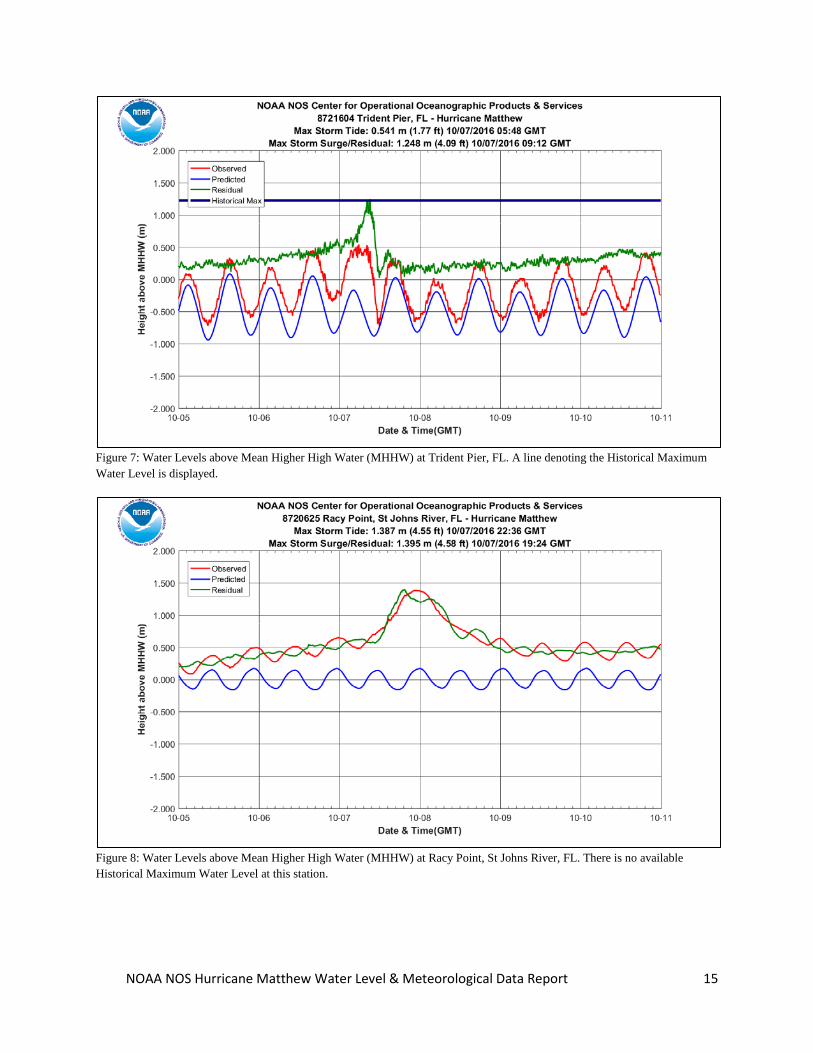
Figure 7: Water Levels above Mean Higher High Water (MHHW) at Trident Pier, FL. A line denoting the Historical Maximum Water Level is displayed.
Figure 8: Water Levels above Mean Higher High Water (MHHW) at Racy Point, St Johns River, FL. There is no available Historical Maximum Water Level at this station.
NOAA NOS Hurricane Matthew Water Level & Meteorological Data Report 16
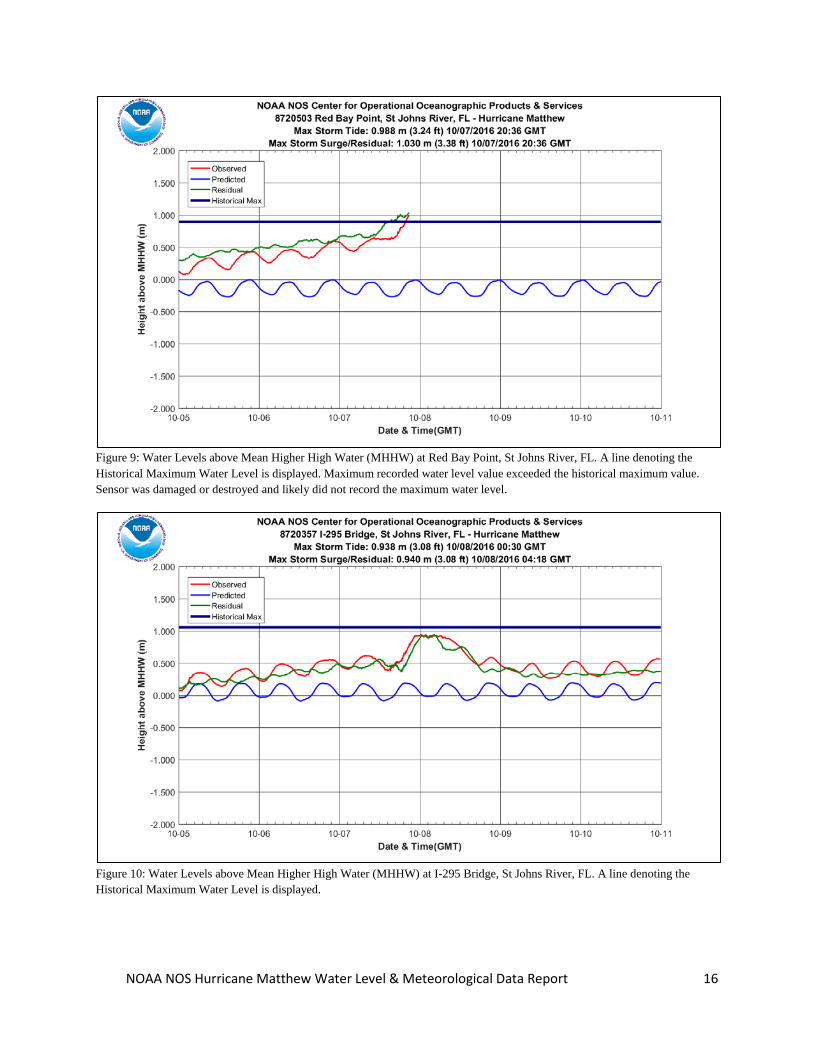
Figure 9: Water Levels above Mean Higher High Water (MHHW) at Red Bay Point, St Johns River, FL. A line denoting the Historical Maximum Water Level is displayed. Maximum recorded water level value exceeded the historical maximum value. Sensor was damaged or destroyed and likely did not record the maximum water level.
Figure 10: Water Levels above Mean Higher High Water (MHHW) at I-295 Bridge, St Johns River, FL. A line denoting the Historical Maximum Water Level is displayed.
NOAA NOS Hurricane Matthew Water Level & Meteorological Data Report 17
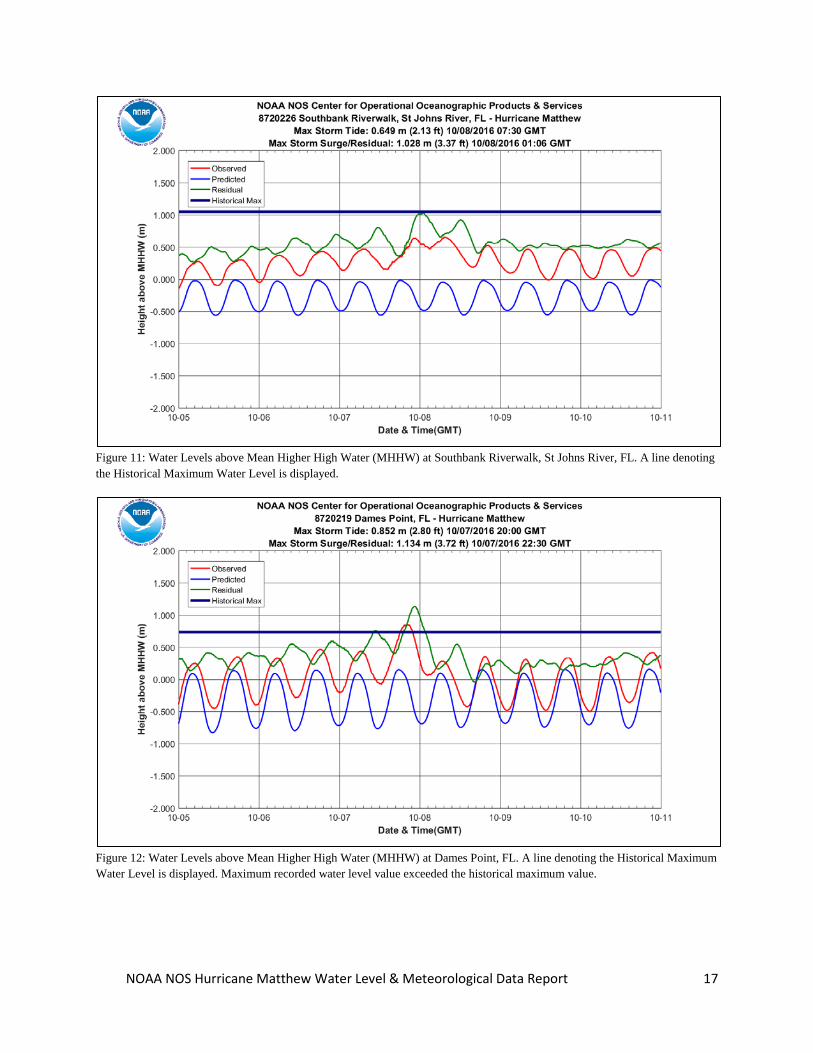
Figure 11: Water Levels above Mean Higher High Water (MHHW) at Southbank Riverwalk, St Johns River, FL. A line denoting the Historical Maximum Water Level is displayed.
Figure 12: Water Levels above Mean Higher High Water (MHHW) at Dames Point, FL. A line denoting the Historical Maximum Water Level is displayed. Maximum recorded water level value exceeded the historical maximum value.
NOAA NOS Hurricane Matthew Water Level & Meteorological Data Report 18
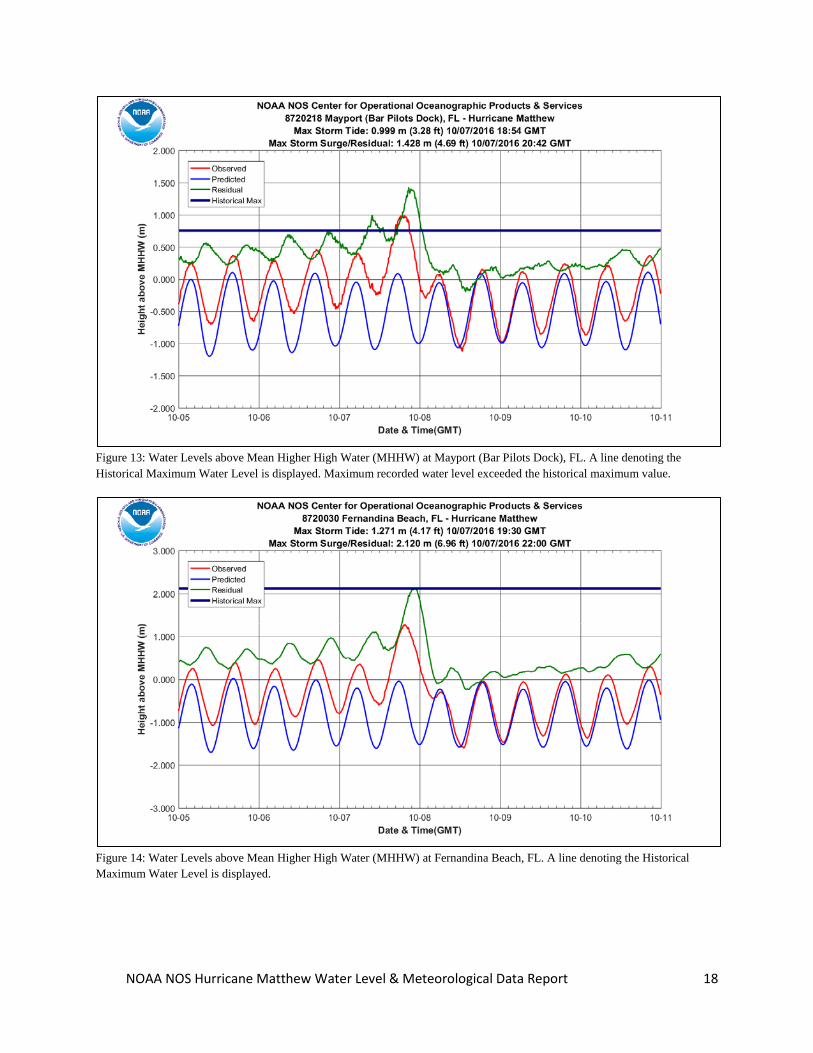
Figure 13: Water Levels above Mean Higher High Water (MHHW) at Mayport (Bar Pilots Dock), FL. A line denoting the Historical Maximum Water Level is displayed. Maximum recorded water level exceeded the historical maximum value.
Figure 14: Water Levels above Mean Higher High Water (MHHW) at Fernandina Beach, FL. A line denoting the Historical Maximum Water Level is displayed.
NOAA NOS Hurricane Matthew Water Level & Meteorological Data Report 19
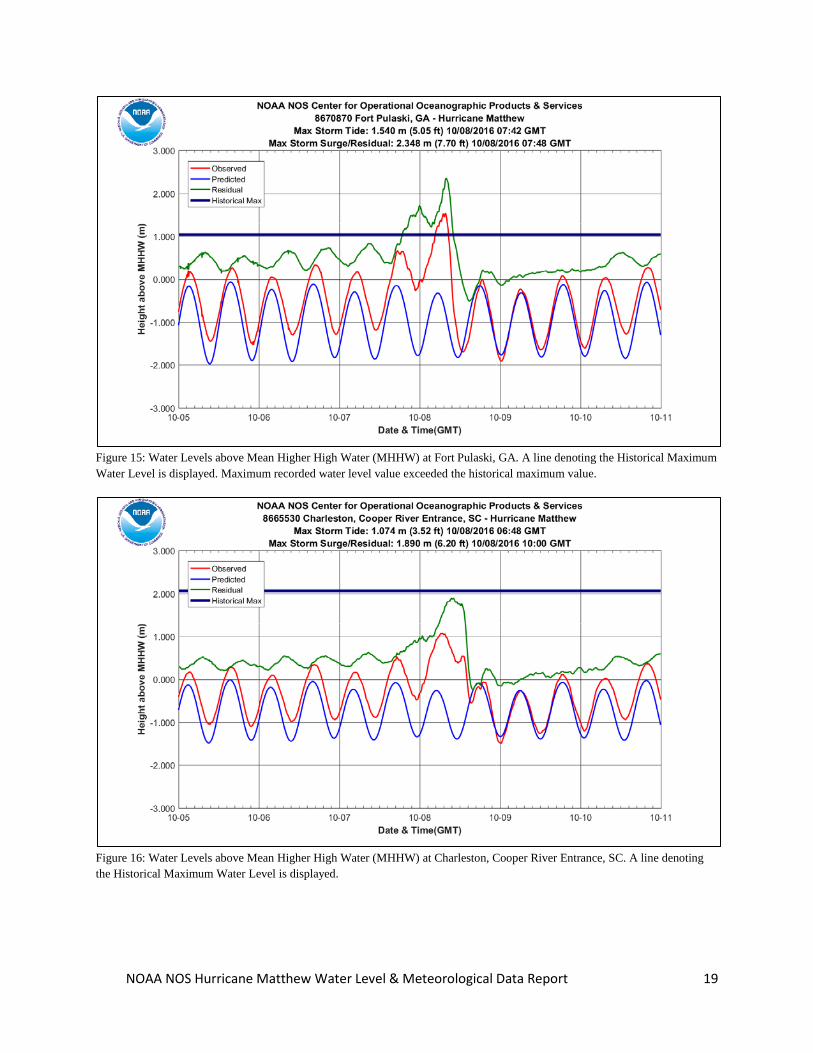
Figure 15: Water Levels above Mean Higher High Water (MHHW) at Fort Pulaski, GA. A line denoting the Historical Maximum Water Level is displayed. Maximum recorded water level value exceeded the historical maximum value.
Figure 16: Water Levels above Mean Higher High Water (MHHW) at Charleston, Cooper River Entrance, SC. A line denoting the Historical Maximum Water Level is displayed.
NOAA NOS Hurricane Matthew Water Level & Meteorological Data Report 20
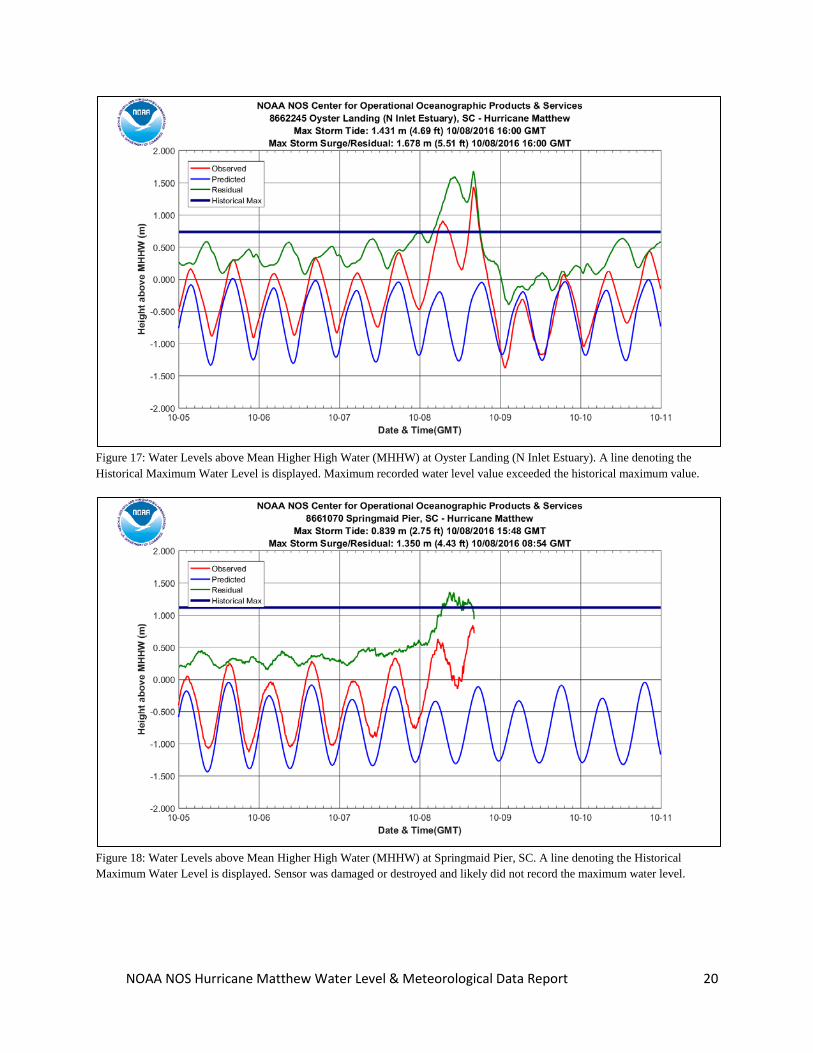
Figure 17: Water Levels above Mean Higher High Water (MHHW) at Oyster Landing (N Inlet Estuary). A line denoting the Historical Maximum Water Level is displayed. Maximum recorded water level value exceeded the historical maximum value.
Figure 18: Water Levels above Mean Higher High Water (MHHW) at Springmaid Pier, SC. A line denoting the Historical Maximum Water Level is displayed. Sensor was damaged or destroyed and likely did not record the maximum water level.
NOAA NOS Hurricane Matthew Water Level & Meteorological Data Report 21
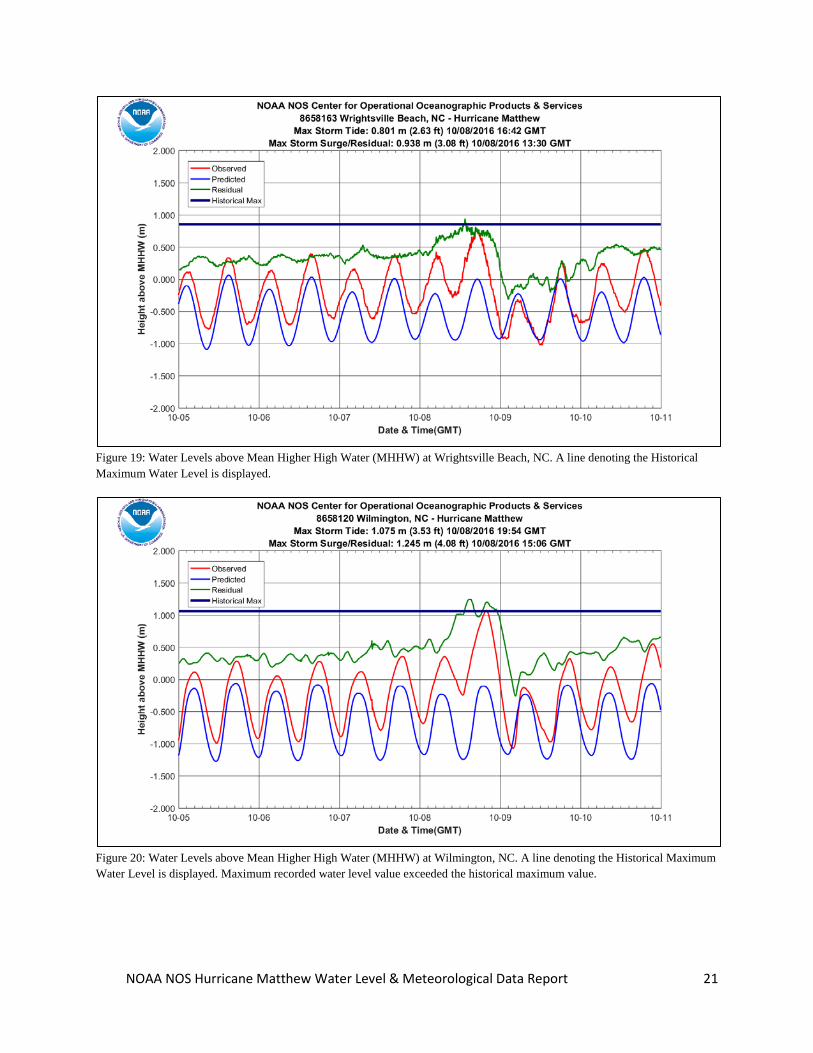
Figure 19: Water Levels above Mean Higher High Water (MHHW) at Wrightsville Beach, NC. A line denoting the Historical Maximum Water Level is displayed.
Figure 20: Water Levels above Mean Higher High Water (MHHW) at Wilmington, NC. A line denoting the Historical Maximum Water Level is displayed. Maximum recorded water level value exceeded the historical maximum value.
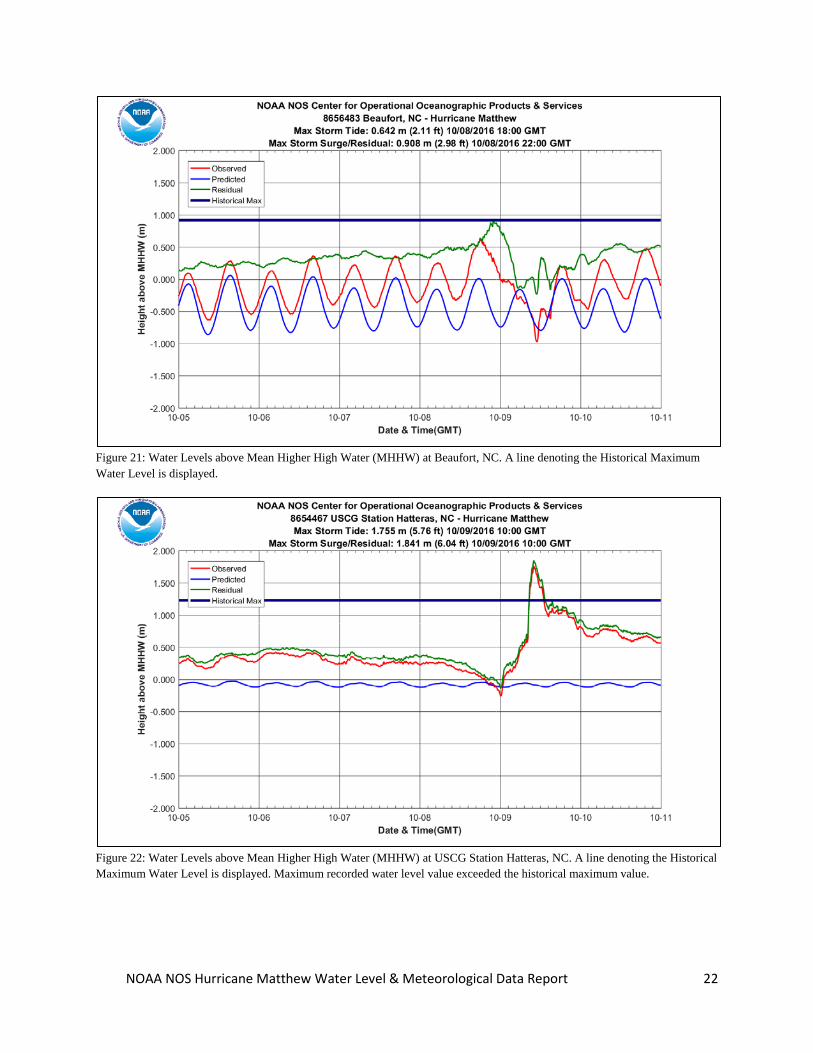
NOAA NOS Hurricane Matthew Water Level & Meteorological Data Report 22
Figure 21: Water Levels above Mean Higher High Water (MHHW) at Beaufort, NC. A line denoting the Historical Maximum Water Level is displayed.
Figure 22: Water Levels above Mean Higher High Water (MHHW) at USCG Station Hatteras, NC. A line denoting the Historical Maximum Water Level is displayed. Maximum recorded water level value exceeded the historical maximum value.
NOAA NOS Hurricane Matthew Water Level & Meteorological Data Report 23
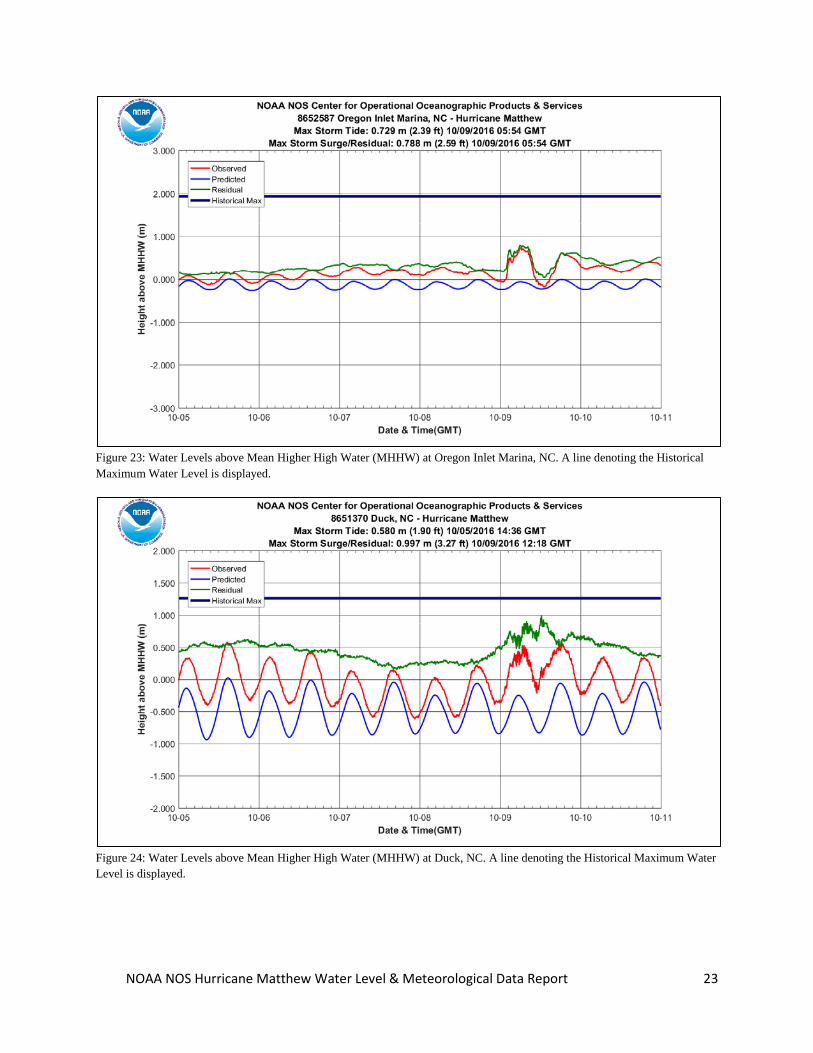
Figure 23: Water Levels above Mean Higher High Water (MHHW) at Oregon Inlet Marina, NC. A line denoting the Historical Maximum Water Level is displayed.
Figure 24: Water Levels above Mean Higher High Water (MHHW) at Duck, NC. A line denoting the Historical Maximum Water Level is displayed.
NOAA NOS Hurricane Matthew Water Level & Meteorological Data Report 24
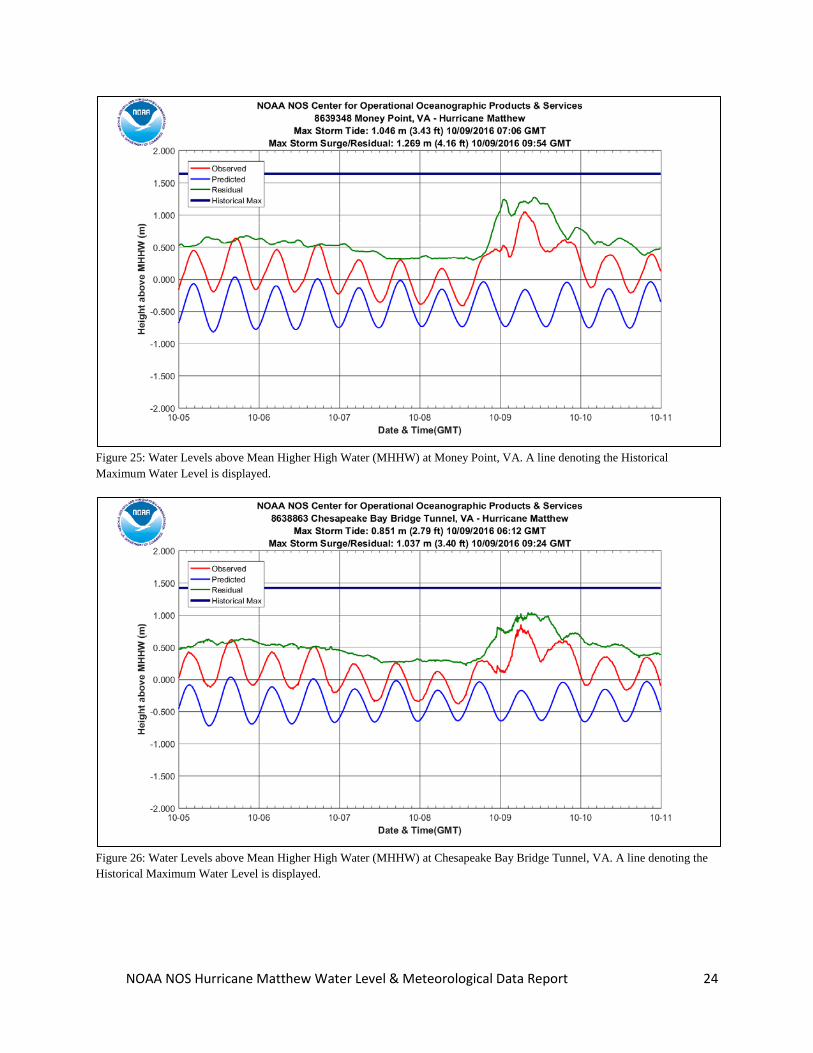
Figure 25: Water Levels above Mean Higher High Water (MHHW) at Money Point, VA. A line denoting the Historical Maximum Water Level is displayed.
Figure 26: Water Levels above Mean Higher High Water (MHHW) at Chesapeake Bay Bridge Tunnel, VA. A line denoting the Historical Maximum Water Level is displayed.
NOAA NOS Hurricane Matthew Water Level & Meteorological Data Report 25
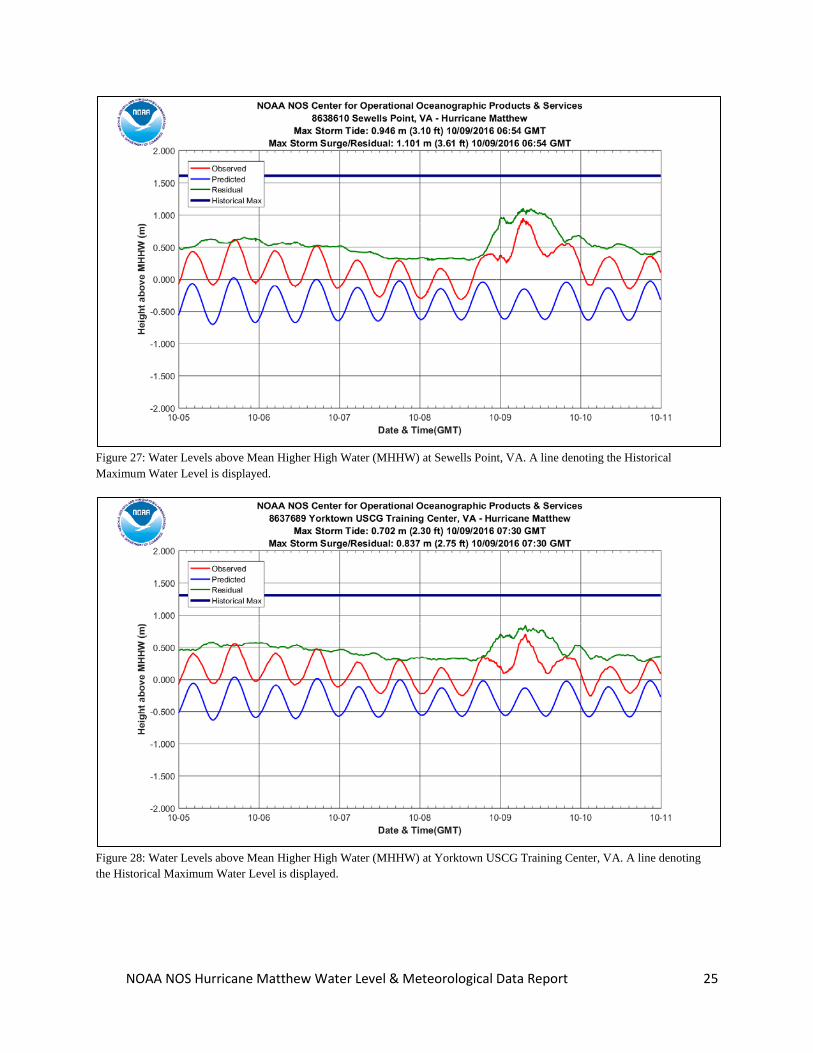
Figure 27: Water Levels above Mean Higher High Water (MHHW) at Sewells Point, VA. A line denoting the Historical Maximum Water Level is displayed.
Figure 28: Water Levels above Mean Higher High Water (MHHW) at Yorktown USCG Training Center, VA. A line denoting the Historical Maximum Water Level is displayed.
NOAA NOS Hurricane Matthew Water Level & Meteorological Data Report 26
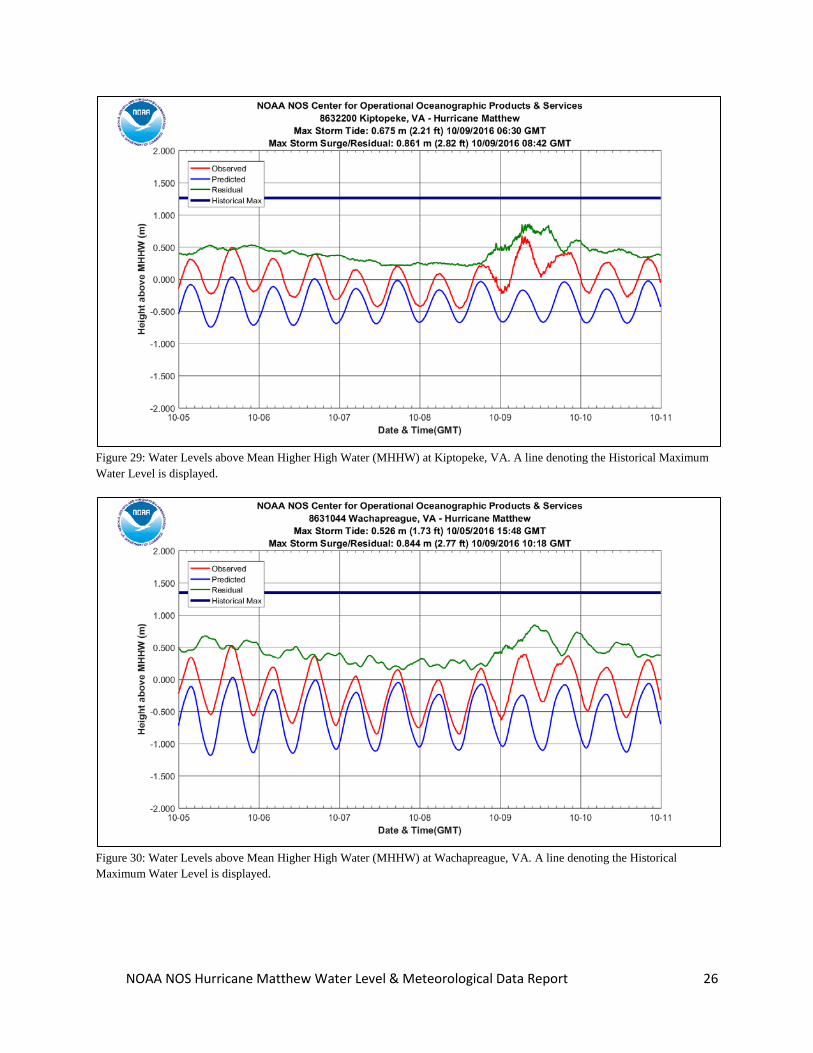
Figure 29: Water Levels above Mean Higher High Water (MHHW) at Kiptopeke, VA. A line denoting the Historical Maximum Water Level is displayed.
Figure 30: Water Levels above Mean Higher High Water (MHHW) at Wachapreague, VA. A line denoting the Historical Maximum Water Level is displayed.
NOAA NOS Hurricane Matthew Water Level & Meteorological Data Report 27
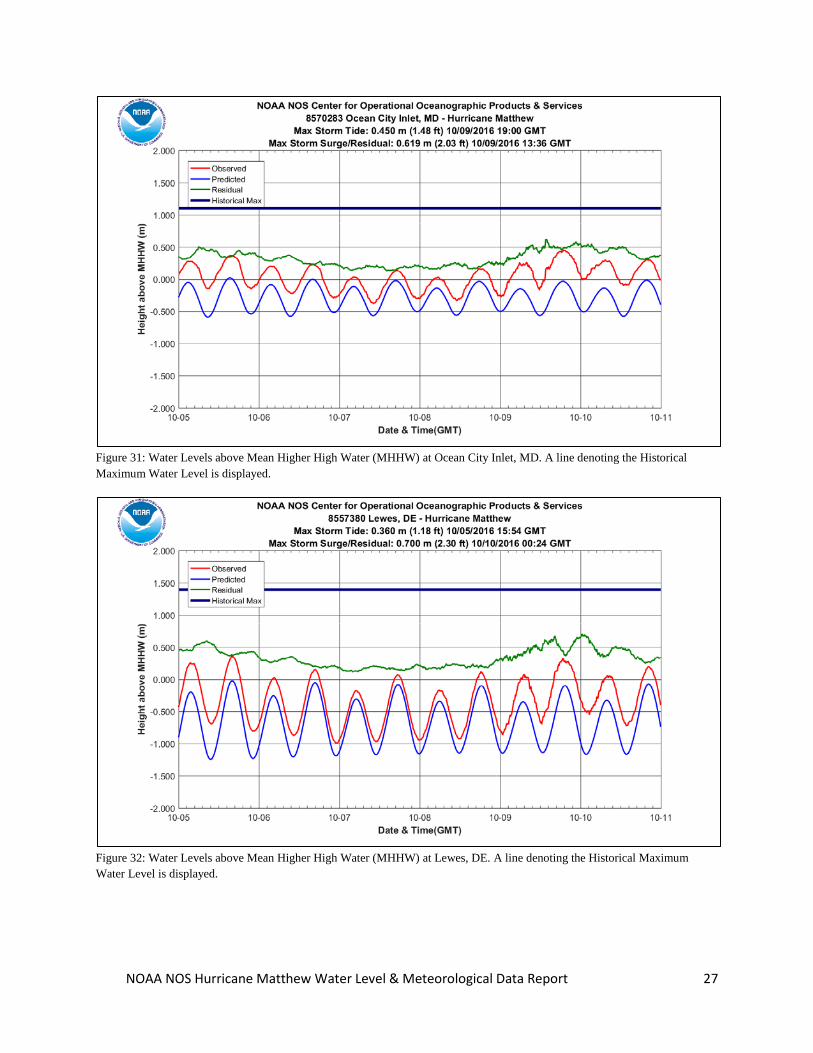
Figure 31: Water Levels above Mean Higher High Water (MHHW) at Ocean City Inlet, MD. A line denoting the Historical Maximum Water Level is displayed.
Figure 32: Water Levels above Mean Higher High Water (MHHW) at Lewes, DE. A line denoting the Historical Maximum Water Level is displayed.
NOAA NOS Hurricane Matthew Water Level & Meteorological Data Report 28
Acknowledgements: This report represents the cumulative efforts of personnel of the Center for Operational
Oceanographic Products and Services (CO-OPS). We would like to thank the Oceanographic Division’s Data Processing Team who were responsible for the processing, analysis and verification of the data incorporated into this report. We would like to thank the Continuous Operational Real-Time Monitoring System (CORMS) team who performed an around the clock thorough QA/QC assessment on all real-time data. We would like to thank the Field Operations Division personnel who operated and maintain all stations to ensure that a reliable and robust source of real-time data was readily available. Finally, we thank Laurita Alomassor who assisted in the organization of this report.
NOAA NOS Hurricane Matthew Water Level & Meteorological Data Report 29
Appendix 1: References and Contact Information NOAA, 2008. Center For Operational Oceanographic Products & Services Specifications and Deliverables for Installation, Operation, and Removal of Water Level Stations, NOAA/NOS, March 2008. NOAA, 1991. Next Generation Water Level Measurement System (NGWLMS) Site Design, Preparation, and Installation Manual, NOAA/NOS, January 1991. Center for Operational Oceanographic Products & Services Environmental Measurement Systems , Sensor Specifications and Measurement Algorithm, NOAA/NOS. For further information or updates on the Storm Technical Reports and Storm QuickLook product, contact: Storm QuickLook Center for Operational Oceanographic Products and Services (CO-OPS) 1305 East-West Highway Silver Spring, MD 20910-3281 Phone: (240) 533-0580 Fax: (301) 713-4437 E-mail: Storm QuickLook ([email protected])
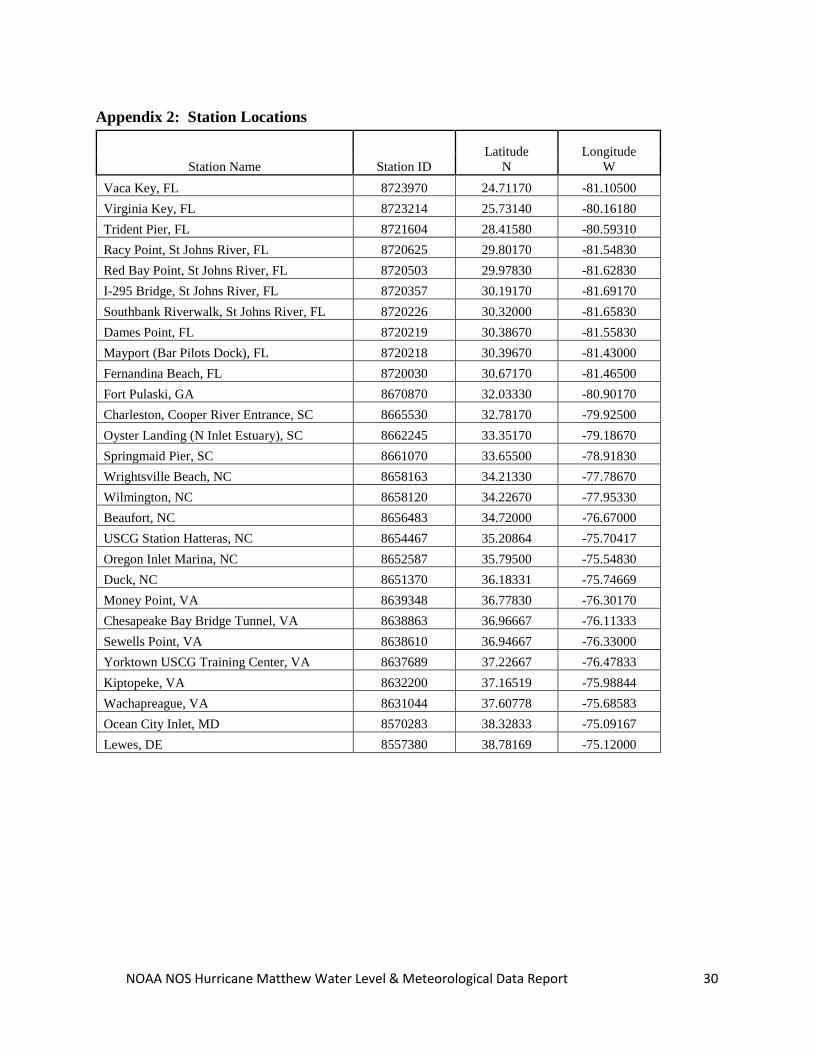
NOAA NOS Hurricane Matthew Water Level & Meteorological Data Report 30
Appendix 2: Station Locations
Station Name Station ID Latitude
N Longitude
W Vaca Key, FL 8723970 24.71170 -81.10500 Virginia Key, FL 8723214 25.73140 -80.16180 Trident Pier, FL 8721604 28.41580 -80.59310 Racy Point, St Johns River, FL 8720625 29.80170 -81.54830 Red Bay Point, St Johns River, FL 8720503 29.97830 -81.62830 I-295 Bridge, St Johns River, FL 8720357 30.19170 -81.69170 Southbank Riverwalk, St Johns River, FL 8720226 30.32000 -81.65830 Dames Point, FL 8720219 30.38670 -81.55830 Mayport (Bar Pilots Dock), FL 8720218 30.39670 -81.43000 Fernandina Beach, FL 8720030 30.67170 -81.46500 Fort Pulaski, GA 8670870 32.03330 -80.90170 Charleston, Cooper River Entrance, SC 8665530 32.78170 -79.92500 Oyster Landing (N Inlet Estuary), SC 8662245 33.35170 -79.18670 Springmaid Pier, SC 8661070 33.65500 -78.91830 Wrightsville Beach, NC 8658163 34.21330 -77.78670 Wilmington, NC 8658120 34.22670 -77.95330 Beaufort, NC 8656483 34.72000 -76.67000 USCG Station Hatteras, NC 8654467 35.20864 -75.70417 Oregon Inlet Marina, NC 8652587 35.79500 -75.54830 Duck, NC 8651370 36.18331 -75.74669 Money Point, VA 8639348 36.77830 -76.30170 Chesapeake Bay Bridge Tunnel, VA 8638863 36.96667 -76.11333 Sewells Point, VA 8638610 36.94667 -76.33000 Yorktown USCG Training Center, VA 8637689 37.22667 -76.47833 Kiptopeke, VA 8632200 37.16519 -75.98844 Wachapreague, VA 8631044 37.60778 -75.68583 Ocean City Inlet, MD 8570283 38.32833 -75.09167 Lewes, DE 8557380 38.78169 -75.12000
NOAA NOS Hurricane Matthew Water Level & Meteorological Data Report 31
Appendix 3: Definitions Excerpts From: Tide and Current Glossary, NOAA National Ocean Service, Silver Spring, MD, 2000 (https://www.tidesandcurrents.noaa.gov/publications/glossary2.pdf), Tidal Datums homepage (https://www.tidesandcurrents.noaa.gov/datum_options.html) and the Storm QuickLook homepage (https://tidesandcurrents.noaa.gov/quicklook.html) Bench mark (BM): A fixed physical object or mark used as reference for a horizontal or vertical datum. A tidal bench mark is one near a tide station to which the tide staff and tidal datums are referred. A primary bench mark is the principal mark of a group of tidal bench marks to which the tide staff and tidal datums are referred. Chart datum: The datum to which soundings on a chart are referred. It is usually taken to correspond to a low-water elevation, and its depression below mean sea level is represented by the symbol Z. Since 1980, chart datum has been implemented to mean lower low water for all marine waters of the United States, its territories, Commonwealth of Puerto Rico, and Trust Territory of the Pacific Islands. Datum (vertical): For marine applications, a base elevation used as a reference from which to reckon heights or depths. It is called a tidal datum when defined in terms of a certain phase of the tide. Tidal datums are local datums and should not be extended into areas which have differing hydrographic char-acteristics without substantiating measurements. In order that they may be recovered when needed, such datums are referenced to fixed points known as bench marks. See chart datum and bench marks. Geodetic datum: The NOAA National Geodetic Survey defines a geodetic datum as: "A set of constants used for calculating the coordinates of points on the Earth." In surveying and geodesy, a datum is a reference point on the earth's surface against which position measurements are made, and an associated model of the shape of the earth for computing positions. Horizontal datums are used for describing a point on the earth's surface, in latitude and longitude. Vertical datums are used to measure elevations or underwater depths. Historical Recorded Maximum Tide Level: The maximum tide elevation measured by a water level station with a continuous time series throughout a high tide cycle. A complete cycle is required to calculate the maximum tide elevation, using a best fit curve of the observations. These historical records may not have included the highest water levels measured at a station during an event if a complete high tide cycle was not measured due to station/sensor damage. See storm tides. Mean Lower Low Water (MLLW): A tidal datum. The average of the lower low water height of each tidal day observed over the National Tidal Datum Epoch. See National Tidal Datum Epoch. For stations with shorter series, comparison of simultaneous observations with a control tide station is made in order to derive the equivalent datum of the National Tidal Datum Epoch. Mean Higher High Water (MHHW): A tidal datum. The average of the higher high water height of each tidal day observed over the National Tidal Datum Epoch. For stations with shorter series, comparison of simultaneous observations with a control tide station is made in order to derive the equivalent datum of the National Tidal Datum Epoch.
NOAA NOS Hurricane Matthew Water Level & Meteorological Data Report 32
Mean Sea Level (MSL): A tidal datum. The arithmetic mean of hourly heights observed over the National Tidal Datum Epoch. Shorter series are specified in the name; e.g. monthly mean sea level and yearly mean sea level. National Tidal Datum Epoch: The specific 19-year period adopted by the National Ocean Service as the official time segment over which tide observations are taken and reduced to obtain mean values (e.g., mean lower low water, etc.) for tidal datums. It is necessary for standardization because of periodic and apparent secular trends in sea level. The present National Tidal Datum Epoch is 1983 through 2001. It is reviewed annually for possible revision and must be actively considered for revision every 25 years. North American Vertical Datum of 1988 (NAVD 1988): A fixed reference for elevations determined by geodetic leveling. The datum was derived from a general adjustment of the first-order terrestrial leveling nets of the United States, Canada, and Mexico. In the adjustment, only the height of the primary tidal bench mark, referenced to the International Great Lakes Datum of 1985 (IGLD 1985) local mean sea level height value, at Father Point, Rimouski, Quebec, Canada was held fixed, thus providing minimum constraint. NAVD 1988 and IGLD 1985 are identical. However, NAVD 1988 bench mark values are given in Helmert orthometric height units while IGLD 1985 values are in dynamic heights. National Tidal Datum Epoch: The specific 19-year period adopted by the National Ocean Service as the official time segment over which tide observations are taken and reduced to obtain mean values (e.g., mean lower low water, etc.) for tidal datums. It is necessary for standardization because of periodic and apparent secular trends in sea level. The present NTDE is 1983 through 2001 and is actively considered for revision every 20-25 years. Tidal datums in certain regions with anomalous sea level changes (Alaska, Gulf of Mexico) are calculated on a Modified 5-Year Epoch. National Water Level Observation Network (NWLON): The network of tide and water level stations operated by the National Ocean Service along the marine and Great Lakes coasts and islands of the United States. Neap tides: Tides of decreased range occurring semimonthly as the result of the Moon being in quadrature (first or last quarters). Non-tidal: Water levels may be classified as tidal or non-tidal. Water bodies with little or no range in tide and where the rise and fall of the water surface can no longer be practically measured in a predictable rhythm due to masking of the tide by hydrologic, wind, or other effects are non-tidal. Range of tide: The difference in height between consecutive high and low waters. The mean range is the difference in height between mean high water and mean low water. The great diurnal range or diurnal range is the difference in height between mean higher high water and mean lower low water. For other ranges see spring, neap, perigean, apogean, and tropic tides; and tropic ranges. Tide: The periodic rise and fall of a body of water resulting from gravitational interactions between Sun, Moon, and Earth. The vertical component of the particulate motion of a tidal wave. Same as astronomic tide. Tide (water level) gauge: An instrument for measuring the rise and fall of the tide (water level). Water levels may be classified as tidal and non-tidal.
NOAA NOS Hurricane Matthew Water Level & Meteorological Data Report 33
Spring tides: Tides of increased range occurring semimonthly as the result of the Moon being new or full.
Storm Surge/Residual: The onshore rush of sea or lake water caused by the high wind and the low pressure centers associated with a landfalling hurricane or other intense storm. The amplitude of the storm surge at any given location is dependent upon the orientation of the coast line with the storm track, the intensity, size and speed of the storm, and the local bathymetry. In practice, storm surge is usually estimated by subtracting the normal or astronomical tide from the observed storm tide at tide stations. This difference between observed storm tides and astronomical tide can have other components such as regional elevated mean sea levels in the Gulf of Mexico due to the Loop Current, elevated sea levels on the West Coast due to El Niño Southern Oscillation (ENSO), or local elevated sea levels due to river runoff in tidal rivers.
Storm Tide: The maximum water level elevation measured by a water level station during storm events. Depending on location, the storm tide is the potential combination of storm surge, local astronomical tide, regional sea level variations and river runoff during storm events. Since wind generated waves ride on top of the storm surge (and are not included in the definition), the total instantaneous elevation may greatly exceed the predicted storm surge plus astronomical tide. It is potentially catastrophic, especially on low lying coasts with gently sloping offshore topography.


![Origin of the Hurricane Ike forerunner surgecoast.nd.edu/reports_papers/forerunner_2011GL047090.pdf2. Hurricane Ike Forerunner Observations [4] Two days prior to Ike’s landfall,](https://img.pdfslide.us/doc/110x75/5f77c490deecde5f0019f526/origin-of-the-hurricane-ike-forerunner-2-hurricane-ike-forerunner-observations.jpg)