Embed Size (px)
Citation preview

Risk Management
1Hurricane Katrina: Landfall August 29, 2005

Fair Bet
• Cost Equals Expected Gain
• Cost = P * (Amount you Win)
• Example: Flipping a Coin– Cost = $10– P = .5– Amount You Win = $20
2

Is This A Fair Bet?
• Flipping A Coin– Cost = $50– Amount You Win = $75
3

Risk Taking Behavior
• Risk-Averse
• Risk-Neutral
• Risk-Taker (Risk-Seeker, Risk-Lover)
4
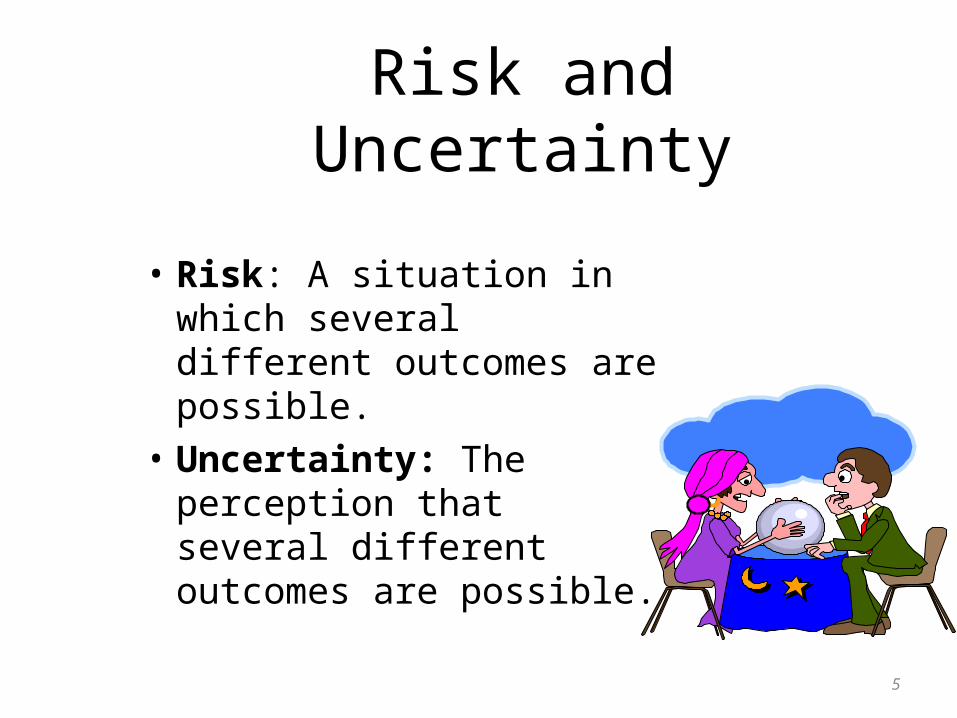
Risk and Uncertainty
• Risk: A situation in which several different outcomes are possible.
• Uncertainty: The perception that several different outcomes are possible.
5

Categorizing Risk
• Pure Risk v. Speculative Risk• Diversifiable Risk v. Nondiversifiable Risk• Fundamental Risks and Particular Risks
6

Pure Risks v. Speculative Risks
• Speculative Risks are Usually Chosen– Stock Appreciation– Manufacturing and Selling a Product– Example: Furby
• Pure Risks are Usually a Byproduct– Automobile Accident– Sports Injury
7

Diversification
• Pooling Similar Risks– INSURANCE
• Pooling Offsetting Risks– A DIVERSIFIED PORTFOLIO
8

Why Reduce Uncertainty
• Individual
• Corporations
• Government
9

Why Manage Risk? Individuals
• Reduce anxiety
• Planning
10

11
Corporation
ownersemployees
suppliers
customers
government
creditors
Why Manage Risks: Corporation
(Nexus of Contracts)

Early Historical Examplesof Risk Management
• Chinese Trading Boats
• Amish Rebuilding
12

Modern Risk Management
• Prior to 1950s: Insurance Purchaser
• Risk Managers– Finance Dept., Freestanding, or
Human Resource Dept.
– Larger Companies
– Companies Facing Greater Risk
13

Risk Manager: Minimize Adverse Consequences of Risk
• Avoidance
• Loss Control
• Self-Insurance
• Purchase Insurance
• Anticipate Risk
14

15
The Decision toManufacture a Product

Product Development: Motorcycle
• Investment: $1,000,000• Profits if there is no Loss:
$150,000• Possible Liability Losses:
– 1% Chance of $2,000,000 Loss
• Required Return on Investment: 10%
16
17
Hiring an Employee
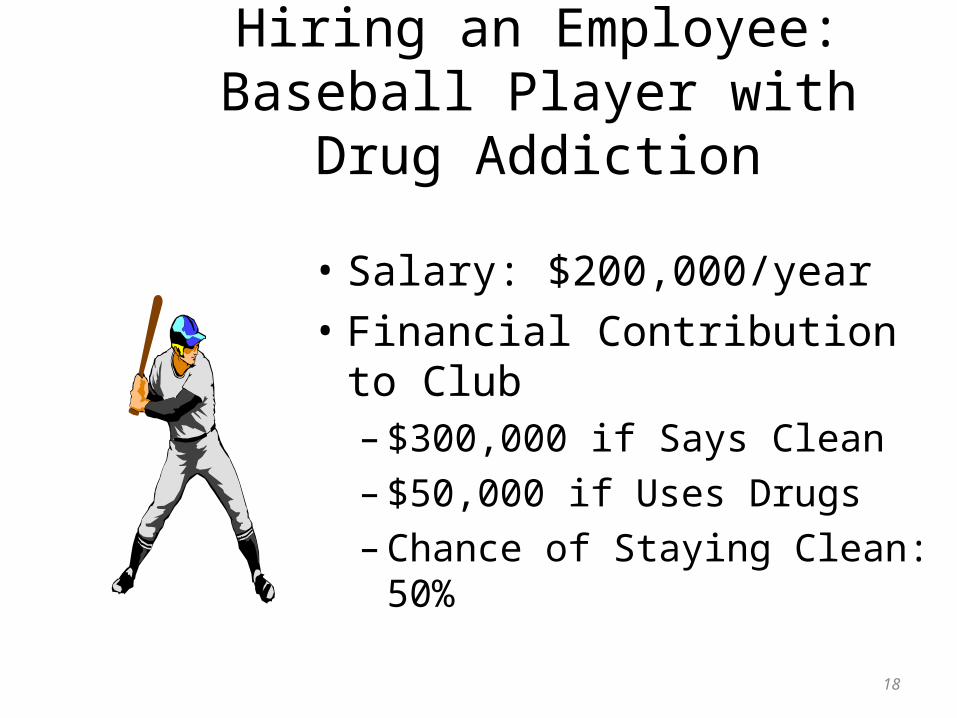
Hiring an Employee: Baseball Player with Drug Addiction
• Salary: $200,000/year• Financial Contribution to Club
– $300,000 if Says Clean
– $50,000 if Uses Drugs
– Chance of Staying Clean: 50%
18

Major Duties of Risk Managers
• Buy Insurance• Identify Risk• Loss Prevention and Loss Control• Contract Review• Safety Training and Education• Govt. Compliance with Safety Issues• Risk Finance• Claims Mgmt. and Litigation Support• Employee Benefits 19

Risk Management Process
• Mission Identification
• Risk Identification
• Risk Analysis
• Consider Alternatives– Risk Control
– Risk Finance
• Implement and Monitor20

Mission Identification
• Goal of Organization
• Goal of Risk Management Department
21

Organization Goals
• Corporation: Maximize Profits
• Non-Profit Organizations
– Religious Organization
– Hospitals
22

Organization Goals
• Charities– Red Cross: The
American Red Cross, a humanitarian organization led by volunteers, . . . will provide relief to victims of disasters and help people prevent, prepare for, and respond to emergencies.
23

Post-Loss Objectives
• Survival of the Organization
• Continuity of Operations
• Earnings Stability
• Continued Growth
• Social Responsibility
24

Pre-Loss Objectives
• Economy• Reduction in Anxiety
– Owners– Suppliers– Lenders– Customers– Govt. Agencies
• Meeting Externally Imposed Obligations• Social Responsibility
25

Risk Management ProcessStep 2
Risk Identification and Analysis
26

Risk Identification: Key Terms
• Hazard
• Risk Factor
• Peril
• Exposure
27

Difficulties withRisk Identification
• New Laws– Examples: Building Codes, Clean Air Act
• New Discoveries– Examples: Black Lung, Second Hand Smoke
• Changing Societal Attitudes– Example: Product Liability Laws, Cigarettes
28

29
New Laws andRisk Identification

Sources of Risk
• Physical Environment
• Social Environment
• Political Environment
• Legal Environment
• Operational Environment
• Economic Environment
• Cognitive Environment30

Social Environmentand Disney Co.
• Euro-Disney
• “Powder”
• Domestic Partner Benefits
• History Theme Park at Manassas
31

Example
• Workplace Injury
32

Categories of Exposures
• Property Exposures– Direct: Immediate Result– Indirect: Secondary Results– Example: Robbery of a Store
• Liability Exposures
• Human Resource Exposures
33

Risk Identification Methods 1
• Insurance Survey
• Risk Analysis Questionnaires
• Financial Statement Analysis
• Flow Chart Method
• Systems Safety Techniques
34

Risk Identification Methods 2
• Interactions with External Resources
• Interactions with other Departments
• Past Losses
• On-Site Inspections
35

Accident Causation
• Human Relations View
• Engineering View
36

Loss Analysis Ratios
• Severity = $Losses / # Losses
• Frequency = # Losses / # Exposures
• Expected Loss = $ Losses/ # Exposures
37

Ratios Example
• Data– 1000 Restaurants– 50 Fires
• Type 1 Fires: 20, $25,000• Type 2 Fires: 30, $50,000
• Severity = [20($25,000) + 30($50,000)]/50 = $40,000• Frequency = 50 / 1000 = .05• Expected Loss = .05($40,000) = $2000
38

Concerns withMeasuring Severity
• Indirect Losses– Ex: Store robbery
• Contagion– Ex: Foot-and-Mouth Disease
• Snowball Effect– Ex: Mad Cow Disease
39

Contagion Example: Bil Mar
40

Contagion Example: Listeria
• Chicago-based Sara Lee recalled hot dogs and deli meats produced at its Bil Mar plant in Zeeland, Michigan, after the CDC found listeria contamination in unopened packages of the products.
• Affected brand names include Ball Park, Bil Mar, Sara Lee Deli Meat and Sara Lee Home Roast.
• The states reporting listeria infections are Arizona, Connecticut, Georgia, Indiana, Iowa, Kentucky, Maryland, Massachusetts, Michigan, Minnesota, New York, Ohio, Oregon, Pennsylvania, Tennessee, Vermont and West Virginia.
41

Contagion Example: Listeria
• Tainted meat – Killed 12 people– Sickened 79 others in 16 states
• 241 workers fired or layed off
42

Loss Severity Measures
• Maximum Possible Loss
• Maximum Probable Loss
43

Example
44
Year Flights Crashes Losses
2003 2004 2005 2006 2007
5,000 5,000 5,000 5,000 5,000
10 0 4 2 0
$2,000,000 0
$1,000,000 $500,000
0

Loss Statistics
45
Mean = Oi pii
n
1freq mean = .2(.002)+.2(0)+.2(.0008)+.2(.0004)+.2(0)
= .00064
sev mean = 1016
200 000 616
250 000( , ) ( , )
= $218,750
E(L) = $140

Loss Statistics
46
S.D. =pi O i E V ii
n( )
2
1
Sev S.D. = ( )( , , )
( )( , , )
1016
200 000 218 750 2
616
250 000 218 750 2
= $26,791

Normal Distn Severity
47
Distance Prob
1 S.D. 68.2%
2 S.D. 95%
$218,750
$191,959 $245,541
$165,168 $272,332
freq = .00064 sev = $272,332 E(L)95% = $174.29

Calculating the Mean and Std. Dev.
Number of Fires Probability
0 .1010 .2030 .4050 .2060 .10
48
mean = .10(0)+.20(10)+.40(30)+.20(50)+.10(60) = 30
S.D. = sq. root [.10(0-30)(0-30) +.20(10-30)(10-30) +.40(30-30)(30-30) +.20(50-30)(50-30) +.10(60-30)(60-30)] = 18.43

Important Distributions
• Loss Frequency Distribution
• Loss Severity Distribution
• Total Loss Distribution
49

Loss Frequency Distn
Taxi Accidents N = 2000
50
Ot Pt
0/2000 .1010/2000 .2030/2000 .4050/2000 .2060/2000 .10 015.
)10(.03.)20(.025.)40(.015.)20(.005.)10(.0
1.)(
n
tAvgFreqtOtptOE
.015(2000) = 30 Accidents

51
Loss Severity Distn
N = 100
Sevt Pi
$1,000 .80$2,000 .05
$10,000 .10$50,000 .05
400,4$
)05(.000,50$)10(.000,10$)05(.000,2$)80(.000,1$
1))(()(
n
i tpiSeviSevE

Drawbacks to Useof Historical Data
• CHANGE in Process
• Insufficient Data
52

Importance of Timingof Losses
• Time Value of Money
• Cash Flow Considerations
53

Loss Triangles
• Predict When Losses Will Occur
• Predict Total Losses
• Highlight Trends
54
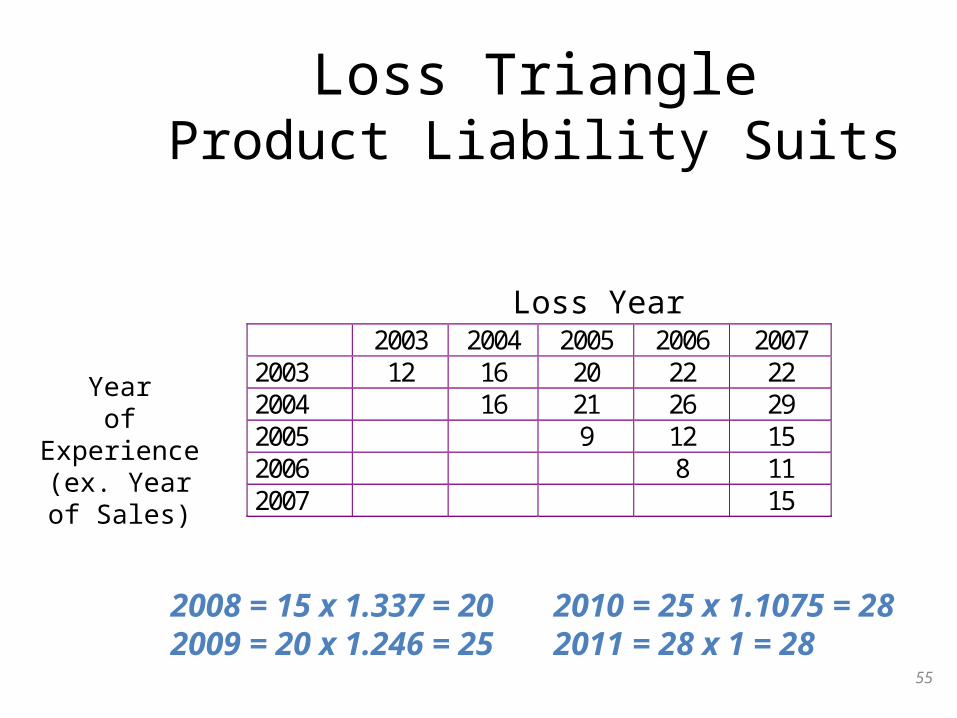
Loss TriangleProduct Liability Suits
2003 2004 2005 2006 2007 2003 12 16 20 22 22 2004 16 21 26 29 2005 9 12 15 2006 8 11 2007 15
55
Loss Year
Yearof
Experience(ex. Year of
Sales)
2008 = 15 x 1.337 = 20 2010 = 25 x 1.1075 = 282009 = 20 x 1.246 = 25 2011 = 28 x 1 = 28

Development Factors
y + 1 y + 2 y + 3 y + 4 2003 1.33 1.25 1.10 1.00 2004 1.3125 1.238 1.115 2005 1.33 1.25 2006 1.375 MEAN 1.337 1.246 1.1075 1.000
56
Development Period
Yearof
Experience
Examples2003, y+1 = 16/12 = 1.332003, y+2 = 20/16 = 1.25

Loss Development: 2007 Sales Year
2007: 15 Losses
2008: 15 x 1.337 = 202009: 20 x 1.246 = 252010: 25 x 1.107 = 282011: 28 x 1.000 = 28
57

Present Value CalculationDetermining Losses from 2003 Sales
Claim Made in Year
i%
Cost/Claim
PV in 2003
# Losses
Total Losses
2003 6% $10,000 $10,000 12 $120,000 2004 6% $12,000 $11,321 4 $45,284 2005 6% $14,000 $12,460 4 $49,840 2006 6% $15,000 $12,594 2 $25,188 2007 6% $18,000 $14,258 0 0 2008 6% $20,000 2009 6% $24,000 Losses 2003 Sales
$240,312
58

Homework Problems
• A) Determine the Number of Fully Developed Losses for 2004, 2005, and 2006.
• B) What is the PV of Losses Arising from 2005 Sales as of 2005?
59

Shapes of Different Distributions
• Medical Expenditures
• Church Fires
• Parking Tickets
60

Normal Distribution
• Bell Shaped
• Two Parameters
• Easy to Use
61

Property Losses
• Property Exposed to Loss
• Peril
• Financial Consequences
62

63
Property Exposed to Loss
Real Property
Personal Property
Non-owned Property

Non-owned Property
• Bailed Property
• Leased Property
• Property on Consignment
• Employee’s Property
• Property under Lien
• Agency Relationships
• Contingent Property64
Perils
• Commonly Insured
• Government Insured
• Uninsurable
65
Commonly Insured Perils 1
• Fire
• Lightning
• Windstorm
• Hail
• Explosion
• Smoke
66

Commonly Insured Perils 2
• Aircraft & Vehicle Damage• Riot• Vandalism (Malicious Mischief)• Falling Objects• Weight of Snow, Ice, or Sleet• Water Damage• Glass Breakage• Sprinkler Leakage• Perils of Transportation• Crime Perils
67

Difficult to Insure Perils
• Earth Movement
• Floods
• Nuclear Reaction
68

Why Are Some Perils Uninsurable?
• Against Public Policy
• Under the Control of the Insured– Ex. Suicide
• Probability of Loss is Too High
• Simultaneous Destruction
69

Generally Uninsurable Perils
• War, Terrorism, Rebellion, and Insurrection
• Intentional Losses
• Fading, Rust, Dry Rot, Settling
• Production, Marketing, and Political Risks
70

Financial Consequences
• Reduction in Value• Debris Removal• Business Interruption• Contingent Business Interruption• Loss of Rental Income• Loss of Rental Value• Loss of Leasehold Interest• Inability to Reconstruct Records• Loss of Use Value in Improvements and Betterments• Demolition Costs and Increased Cost of Reconstruction
71

Valuation of a Loss
• Market Value• Replacement Cost• Actual Cash Value
– (Replacement Cost - Depreciation)• Present Value of the Asset’s Contribution
72

Actual Cash ValueCalculation: Building
• Purchase– Date: January 1, 1987– Price: $1,000,000– Expected Lifetime: 40 years
• Fire– Date: January 1, 2007– Replacement Cost: $2,000,000
73

Actual Cash ValueCalculation: Building
• ACV = Replacement Cost - Depreciation
–As of the Time of Loss
• ACV = $1,000,000 = $2,000,000 - $1,000,000
74

Present Value of the Asset’s Contribution
75
Liability Loss
• Expenditure of TIMEand MONEY
• Investigate, Negotiate, Defense, Payment
76

Property Losses v. Liability Losses
• Parties Involved
• Measurement of Exposure
• Changing Environment
• Tail77

Types of Legal Liability
• Criminal– Agent– Punishments– Insurance
• Civil– Private Duties– Common Law, Statutes, Contracts
78

TORT
• Wrongful Act or Omission
• Independent of Contract
• Legal Remedy: DAMAGES ($$$)
79

Types of TORTS
• Intentional Torts
• Negligence
• Strict Liability
80

Intentional TORTS
• Legally Protected Right
• Intentional Interference– Voluntary– Damages Reasonably Foreseen– No Valid Defense
81

Intentional Torts: Defamation
• Types– Libel– Slander
• Plaintiff Must Show– False, Injurious Statement– Publication– Damages
82

Defenses
• Truth
• Privilege– Absolute– Qualified
• No Malice• Not Known False• No Intent to Injure• Fair, if by news media• Covered Body
83

Intentional Torts:Invasion of the Right of Privacy
• Examples– Release Confidential Information– Hidden Microphones
• Public Figures v. Private Figures
84

Intentional Torts:Assault and Battery
• Assault• Battery• Defenses
– Consent– Self-Defense– Defense of Property– Defense of Others– Allowed Discipline
85

The “Preppy Killer”: Consent??
'Preppie killer' headed back to prison on drug rap
NEW YORK (AP) -- New York's so-called "preppie killer" is headed back to prison.
Robert Chambers already served 15 years behind bars for strangling a woman in Central Park during what he said was rough sex.
He pleaded guilty Monday to selling drugs. The Manhattan district attorney's office says Chambers is promised 19 years and four months in prison when he is sentenced on September 2.
Chambers and his girlfriend were charged with dealing cocaine out of their Manhattan apartment in 2007.
Chambers pleaded guilty in 1988 to manslaughter in the death of 18-year-old Jennifer Levin two years earlier.
Stories portrayed him as a handsome, privileged, prep school youth gone bad.He was released from prison in 2003.
86
Intentional Torts:Assorted Others
• False Arrest and Wrongful Detention
• Malicious Prosecution• Trespass• Conversion• Nuisance
87

Intentional Torts: Assorted Others Continued
• Wrongful Interference with a Business Relationship– Copyright Infringement– Deception
• Bad Faith– Delaying Payment of Claims– Refusing to Pay Claims
88

Negligence
• Acts of Omission
• Acts of Commission
89

90
Elements of a Negligent Act
• Legal Duty
• Breach
• Damages
• Proximate Cause

Damages
• Compensatory Damages– Special Damages– General Damages
• Punitive Damages
91

Defenses to Negligence
• Contributory Negligence
• Comparative Negligence
• Assumption of Risk
• Statute of Limitations
• Immunities– Sovereign– Charitable Institutions– Public Officials
92

Strict Liability Torts
• Abnormally Dangerous Instrumentalities
• Ultrahazardous Activities• Dangerously Defective Products• Workers Compensation Statutes• Disability Benefit Statutes• Aviation Law• Dram Shop Laws• Contractual Assumptions
93
Goals of the Tort System
• Compensate
• Deter
94
Tort Reform Proposals
• Modify Joint and Several Liability
• Caps on Non-Economic Damages
• Caps on Punitive Damages
95

The Work Relationship
• Employer– Sets Hours– Defines and Supervises Work
• Employee– Sacrifices Time for Income– Is Told How to Work– Method of Payment Not Important to
Status• Independent Contractor
– Not an Employee– Controls Methods of Work
96

97
Workplace Injuries
• Common Law: Negligence
• Statutory Law: Workers Compensation

98
Rank Occupation Death rate/100,000 Total deaths
1 Logging workers 92.4 85
2 Aircraft pilots 92.4 109
3 Fishers and fishing workers 86.4 38
4 Structural iron and steel workers 47.0 31
5 Refuse and recyclable material collectors 43.2 35
6 Farmers and ranchers 37.5 307
7 Roofers 34.9 94
8 Electrical power line installers/repairers 30.0 36
9 Driver/sales workers and truck drivers 27.6 905
10 Taxi drivers and chauffeurs 24.2 67
America’s Most Dangerous Jobs in 2004

Some Exceptions toWorkers Compensation
• Small Firms
• Farm Workers
• Domestic Workers
99

Employers’ CommonLaw Duties
• Safe Place to Work
• Adequate Number of Competent Fellow Employees
• Provide Safe Tools and Equipment
• Warn of Inherent Dangers
• Make and Enforce Safety Rules100

Workers Compensation
• Accident
• Arising Out of and In the Course of Employment
• Only Bodily Injury
101

Workers Compensation Benefits
• Lost Wages
• Medical Care
• Body Part Payments
• Death Benefits102

Exceptions to WC as Sole Remedy for Workplace Injury
• Assault by the Employer• Retaliatory Discharge of the Employee• Dual Capacity Doctrine• Suits by 3rd Parties
– Ex. Loss of Consortium– Ex. Consequential Injuries
• Property Damage
103
Human Resource Exposures
• Loss of Personnel
• Cost of Employee Benefits
104

Employee Benefits
• Attract Workers
• Retain Workers
• Retire Workers
• Encourage Productivity105

Loss of Personnel
• Premature Death
• Disability/Poor Health
• Resign
106

Premature DeathLosses that Result
• Loss of Human Life Value
• End of Life Expenses
• Emotional Grief of Survivors
107

Premature DeathRisk Management Strategies
• Loss Prevention:– Medical Care– Good Health
• Life Insurance: Many are Underinsured
• Pension Plan
• Earnings of Surviving Spouse
108

Estimating Human Life ValueExample: Worker 3 years from Retirement
109
Year 2004 2005 2006 TOTAL
Output
50000 49000 48000
Pay
40000 38000 36000
Surplus
10000 11000 12000
PV(8%)
10000 10185 10288
30473

110
Calculating Loss ofHuman Life Value
Age 62 63 64 Total
Earnings
$40,000 $40,000 $40,000
Taxes
$16,000 $16,000 $16,000
Self
$10,000 $10,000 $10,000
Family
$14,000 $14,000 $14,000
PV(8%)
$14,000 $12,963 $12,003
$38,966
Worker dies at age 61 after being paid.At the time of death 3 working years remained.

Disability Problem
• Disability is comparatively frequent• Disability can be extremely costly• Most lost income due to disability is not
replaced• Disability insurance is confusing
– Multiple definitions of disability
• Disability insurance is subject to moral hazard– Malingering
111

Risk of a 90+ Day Disability v. DeathDuring Working Years
112
Age 22 62
P(Disability)/P(Death)
7.5 2

Risk Control
• Avoidance
• Prevention
• Reduction
• Information Management
• Some Risk Transfers
113
Risk Avoidance
• Proactive Avoidance
• Abandonment
114

Drawbacks to Avoidance
• Lost Benefits of Risk
• Perhaps not Possible$Government Imposed Risks$Nature of the Risk
• May Result in Worse Risks
115

116
Important Formsof Loss Reduction
Salvage Subrogation Litigation Management Catastrophe (or Contingency)
Plans Duplication Separation

Information Managementas Loss Control
• Customers: Enhanced Sales
• Creditors: Lower Debt Cost
• Suppliers: Better Relationships
• Owners: Greater Market Value
117

Risk Transfer
• Property or Activity Transferred
• Contractually Pass the Liability“Exculpatory Contracts”
118

Government andRisk Control
• Public Interest
• Efficiency
119

Risk Financing:General Methods
• Retention
• Transfer
120

Risk Financing: Timing
• Contemporaneous
• Prospective
• Retrospective
121

122
Approaches to Retention
Passive or Unplanned
Active or Planned
Retention: Funding Arrangements
• No Advance Funding
• Liability or Earmarked Accounts
• Earmarked Asset Accounts
• Captive Insurer123

Types of Transfers
• Insurance
• Noninsurance Transfers
• Hedging
124

Elements of Insurance
• Contract
• Premium
• Conditional Benefits
• Pooling of Resources
125

Insurance Transaction
• Buyer Side of the Market– Risk Managers– Brokers – Consultants
• Supplier Side of the Market– Insurance Company
• Underwriters, Claims Adjusters, Agent, Actuaries
– Agent
126

Noninsurance Transfers
• Do Not Satisfy Conditions to be Insurance
• Provide External Funding
127
Hedging
• Taking an Offsetting Risk
• Not Possible for Many Types of Risks
128

129

130
131

Hedging Example
132
January 1: Arrange to sell chairs for $5.00Raw materials today cost $2.50/chair
June 1: Build chairs
July 1: Deliver chairs

Hedging Example
Risk: Cost of raw materials
Options: 1. Sell chairs on a cost + basis2. Buy and hold raw materials3. Buy and have seller hold raw
materials4. Use a hedge
133

“Futures” Contract
Owner of contract on Termination Date Receives the lumber
Price of contract depends ona) Cost of lumber todayb) Risk Premium
Origination Date: September 1 Termination Date: August 31.
134

Hedging Contract
January 1: Buy Hedging ContractHedging Contract = $2.50 + xLumber = $2.50Risk Premium = x
June 1: Buy Lumber & Sell Futures ContractLumber = $2.50 + yFutures Contract = $2.50 + (x - z) + yChange in lumber cost = yDepreciation of risk premium = zTotal Cost = ($2.50 + x) + ($2.50 + y)
- ($2.50 + (x - z) + y)= $2.50 + z 135

Hedging ContractNumerical Example
Origination Date: September 1 Termination Date: August 31.Original Risk Loading: 0.60
x = .40x decreases .05 per monthz = .05(5) = .25
Total Cost = $2.50 + .25 = $2.75
136

Hedging Instruments for Financial Risks
137

Hedging Volatility
• Volatility is a measure of risk• Some sources of volatility can be hedged
– Interest Rate– Exchange Rate– Commodity Price
138

Interest Rate Volatility
• Debt is a key component of a firm’s capital structure• Interest rate hedges can stabilize borrowing costs• Some tools: forwards, futures, swaps, options
139
Exchange Rate Volatility
• International businesses are exposed to exchange rate risk• Tools for managing exchange rate risk
– forwards– futures– swaps
140

Commodity Price Volatility
•Costs of materials can be volatile:– Pricing becomes problematic– Sales demand becomes harder to predict
•Hedging allows for:– Better production decisions– Reduced volatility in cash flows
•Available tools (depending on the type of commodity): – Forwards– Futures– Swaps– Options
141

Reducing Risk Exposure
• Hedging will not normally reduce risk completely– Typically, only price risk can be hedged not quantity risk– Reducing risk completely causes loss of potential upside
• Timing– Short-run exposure can be managed in a variety of ways– Long-run exposure almost impossible to hedge
142

Forward Contracts• A contract between parties
– Agreement today on the price of the asset on the delivery date– Delivery and payment is specified for a future date
• Forward contracts are legally binding on both parties
• Positions– Long: Agrees to buy the asset on the future date– Short: Agrees to sell the asset on the future date
• Key points– Negotiated contract– No exchange of cash initially– Usually limited to large, creditworthy corporations
143
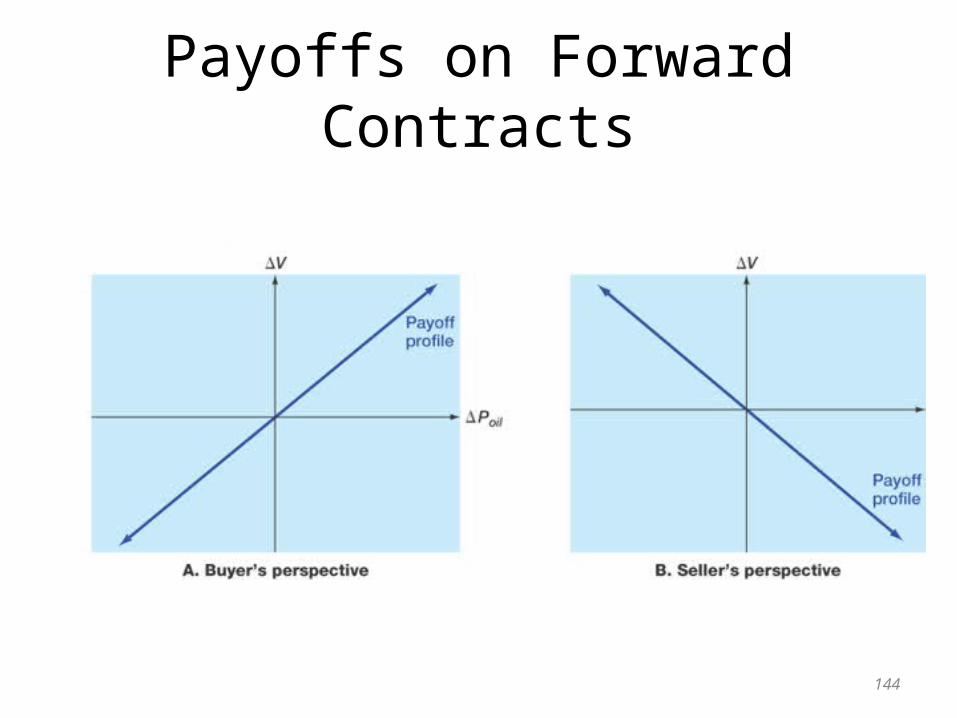
Payoffs on Forward Contracts
144

Hedging with Forwards
• Forward contracts can virtually eliminate price risk
• New risk created: Credit risk of the counterparty
• Forward contracts are primarily used to hedge exchange rate risk
145

Futures Contracts
• Futures traded on organized securities exchanges
• Upfront cash payment: MARGIN– Small relative to the value of the contract– “Marked-to-market” on a daily basis
• Clearinghouse guarantees contract performance
• Clearinghouse and margin requirements virtually eliminate credit risk
146

Hedging with Futures
• Futures contracts are standardized– Allows for trading– Exact hedging may be difficult or impossible
• Credit risk is virtually nonexistent
• Futures contracts are available on– physical assets– debt contracts– Currencies– equities
147

Swaps
• A long-term agreement between two parties • Can be viewed as a series of forward contracts
• Generally limited to large creditworthy institutions or companies
148

Option Contracts
• The right, but not the obligation, to buy (sell) an asset for a set price on or before a specified date
– Call – right to buy the asset– Put – right to sell the asset– Exercise or strike price –specified price– Expiration date – specified date
• Buyer has the right to exercise the option; the seller is obligated– Call – option writer is obligated to sell the asset if the option is exercised– Put – option writer is obligated to buy the asset if the option is exercised
• Options allow a firm to hedge downside risk, but still participate in upside potential
• Pay a premium for this benefit
149

Payoff Profiles: Calls
Buy a call with E = $40
0
10
20
30
40
50
60
70
0 20 40 60 80 100
Stock Price
Pay
off
Sell a Call E = $40
-70
-60
-50
-40
-30
-20
-10
0
0 20 40 60 80 100
Stock Price
Pay
off
150

Payoff Profiles: Puts
Buy a put with E = $40
05
1015202530354045
0 20 40 60 80 100
Stock Price
Pay
off
Sell a Put E = $40
-45
-40
-35
-30
-25
-20
-15
-10
-5
0
0 20 40 60 80 100
Stock Price
Pay
off
151

Retention vs. Transfer
• Ability to Bear the Loss• Cost and Effectiveness of a Transfer• Degree of Control over the Risk• Insurance Loading Fees• Additional Insurer Services• Insurance as a Signal• Opportunity Costs• Taxes
152

Risk Financing Methods
• Guaranteed Cost Insurance
• Experience-Rated Insurance
• Retrospective Rating
153
154
Guaranteed Cost Insurance
Underwriting
Premium Depends on Classification Group
Premium = (A)* (PURE PREMIUM) + B

Pure Premium
155
# cars = 10,000# losses = 250$ losses = $4.5 millionPure Premium = frequency x severityFrequency = 250 / 10,000 = 2.5%Severity = $4.5 million / 250 = $18,000Pure Premium = 2.5% (18,000) = $450A = 1.4 B = $501.4 (450) + 50 = $680

Underwriting Considerations
• Adverse Selection
• Misclassification
• Control
• Civil Rights
• Costs of Classification
• Social Policy
156

What’s Fair and WhyHealth Insurance Underwriting Factors
• Cigarette Smoking• Obesity• Age• Prior history of heart disease• Genetic Predisposition to Stomach Cancer• Gender• Race
157

State Underwriting Restrictions: Health Insurance
• CALIFORNIA: Blindness, Gender, Marital Status, DES
• N. DAKOTA: Blindness, Gender, Race
• WISCONSIN: Blindness, Gender, Physical Impairment
158
How Insurance WorksAn Example
Assume an individual has a 1% probability of getting cancer and incurring medical expenses of $200,000.
How much would you charge to bear this risk?
159

Central Limit TheoremMean = True Mean
Law of Large NumbersIncrease sample size by N New Mean = Old Mean x N New S.D. = Old S.D. x Sq. Root of N
160
How Insurance Works

161
HOW INSURANCE WORKS
AN ILLUSTRATIVE EXAMPLE
Sample Size = 1,000
Mean = 10
S.D. = 2
Loss per claim = $200,000 S.D. Prob.
1 68.27
2 95.45
3 99.73
4 6 8 10 12 14 16

For 99.73% survival prob. insurer will charge: 16 x $200,000 = $3,200
1,000
Increase sample size to 100,000 (100x)Mean # of Losses = 10 x 100 = 1,000S.D. = 2 x sqroot (100) = 20
Now for 99.73% survival prob. insurer will charge: 1060 x $200,000 = $2,120
100,000
HOW INSURANCE WORKSAN ILLUSTRATIVE EXAMPLE
162
Requirements of anInsurable Risk
1. Large Number of Homogenous Exposure Units2. Accidental3. Determinable and Measurable4. No Simultaneous Destruction5. Probability Calculable and Not Too High
suicide, space shuttle, mental illness, war, early flight and computers, terminally ill
163

Social and EconomicValue of Insurance
• Stability
• Indemnification
• Reduction in Reserve Funds
• Insurers’ Ability to Invest
• Satisfies Financial Requirements
• Specialization in Loss Prevention
164

Social Costs of Insurance
• Insurers’ Operating Costs
• Moral Hazard
• Exaggeration of Losses
165

Cheating with Insurance
• Insurer– Failure to Honor the Contract– Misleading Contracts– False Advertising– Inappropriate Sales
• Insured– Fraud
166

Controlling Cheating
• Litigation
• Regulation
167
LitigationRequirements of an Insurable Contract
• Offer and Acceptance
• Consideration
• Competent Parties
• Legal Purpose
168

LitigationLegal Principles: Indemnity
• Valuation– Property: ACV– Liability: Actual Damages
• Apparent Exceptions– Valued Policies– Replacement Cost Insurance– Life Insurance
169

Actual Cash Value Example
ACV = Replacement Cost – Depreciation
1/1/04: Buy Machine for $3,000, 10 year life 1/1/06: Fire Destroys Machine; New Machine
Costs $10,000
ACV = $10,000 - $2,000 = $8,000
170

LitigationPrinciple of Insurable Interest
• Property and Liability: Time of Loss– Ownership– Potential Legal Liability– Secured Creditors
• Life Insurance: Time of Policy Purchase– Close Ties: Love, Blood, Marriage– Pecuniary Interest
171
LitigationPrinciple of Subrogation
• Prevents Double Indemnification
• Holds Down Insurance Costs
172
LitigationPrinciple of Utmost Good Faith
• Representations
• Concealment
• Warranty
173
Is It Material?

Why Is Insurance Regulated?
• Advance Payment of Premiums
• Complexity of Transaction
174
Types of Regulation
• Licensing• Solvency• Rate Approval• Agents’ Activities• Insurance Contracts
175

Insolvency: Major Reasons
• Bad Management• Poor Underwriting• Inadequate Reserves• Bad Investing• Inattentive to Loss Prevention• Competitive Pressures
176

Danger of Insolvency
• Most Insurers are Very Solid• 100+ Years
– 71 Life Insurers– 200 Property and Liability Insurers
• Guaranty Funds• Buyout of Failing Firms
177

Premium Regulation
• Adequate
• Fair
• Reasonable
178

Methods of Rate Regulation
• Prior Approval
• File and Use
• Open Competition
179

Advantages of Open Competition
• Flexibility• Increased Availability of Insurance • Avoid Political Fights• Frees Time of Regulators
180

Disadvantages of Open Competition
• Price Gouging (?)
• Risk of Insolvency (?)
• Fair (?)
181

Regulation of Agents’ Activities
• Licensing
• Prohibited Acts– Twisting– Rebating
182

Causes of InsuranceMarket Failure
• Adverse Selection• Individuals Underestimate
the Loss Potential• Insurance Costs Too Much• Pooling Not Possible• Insurers Can Not Estimate
the Loss Potential
183

THE END
184