Embed Size (px)
Citation preview

______________________________________________________________________________
Huntington Research Farm
Isotope Analysis Prepared for:
Huntington Power Plant P.O. Box 680
Huntington, UT 84528
Prepared by:
Water & Environmental Technologies, PC 480 East Park Street Butte, MT 59701
Phone (406) 782-5220 www.waterenvtech.com
September 13, 2016
Project Reference: PERCM73

Huntington Research Farm
Isotope Analysis Report Water & Environmental Technologies, PC
______________________________________________________________________________
i | P a g e
Executive Summary
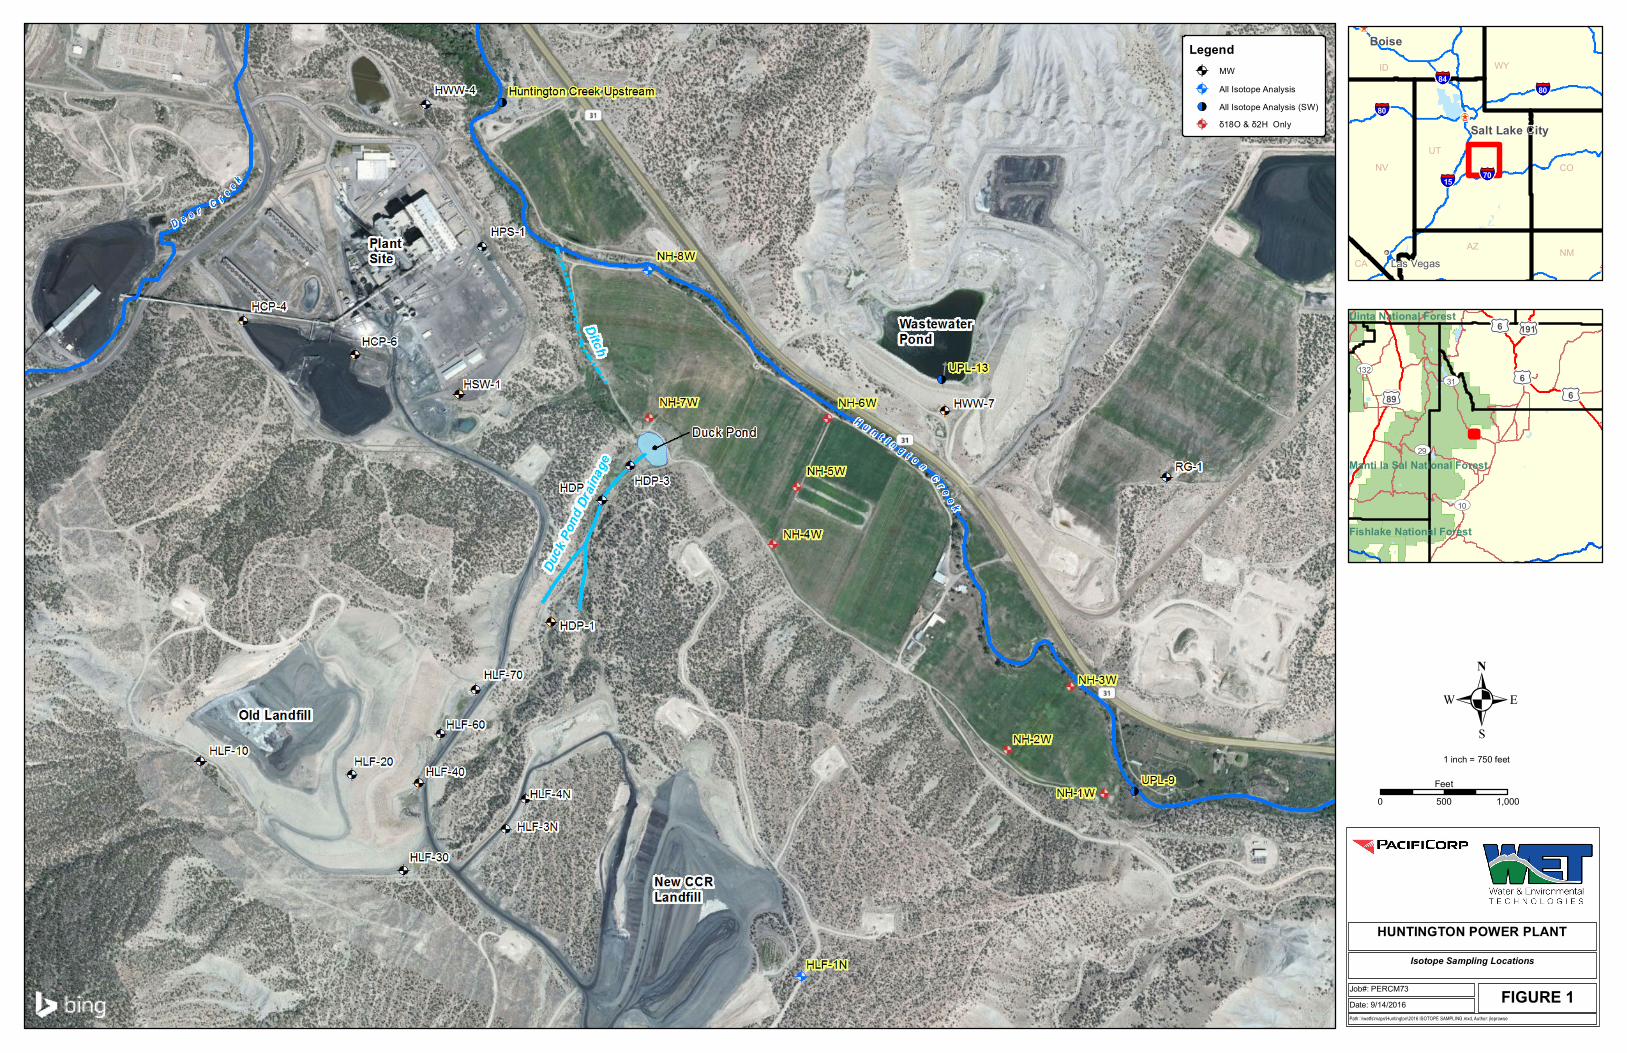
Utah DEQ Division of Water Quality requested stable oxygen and hydrogen isotope sampling of the Research Farm monitoring network wells to evaluate possible water quality changes for the Groundwater Permit Renewal #UGW-150002 at the Huntington Power Plant (HPP or Plant). This report details that sampling effort, provides the analytical results and interprets the isotope analyses along with hydrogeologic and hydrologic data to identify the ground water characteristics in the valley aquifer beneath the Research Farm. 18O and 2H isotope samples were collected in Research Farm monitoring wells (NH-1W through 8W), Huntington Creek upstream and downstream (UPL-9) of the Farm, the Mancos Shale ground water upgradient of the landfills (HLF-1N) and the Irrigation Pond (UPL-13). Installation of one additional Research Farm well was also requested by UDEQ; however, two wells were installed; one in the location UDEQ requested (NH-9W) and one on the north side of Huntington Creek (NH-10W). These wells were also sampled for the 18O and 2H isotopes and each well had static ground water elevation measured for this analysis. The analysis concludes that the operation of the Research Farm at the Huntington Power Plant is having no discernable effect on water quality in monitoring well NH-8W. Both the isotopic and geochemical data indicate the water quality in NH-8W is very similar to the surface water quality in Huntington Creek. In addition, the upstream and downstream Huntington Creek isotope analysis is the same (i.e., analytical results are within the precision and accuracy of the analytical method). The 18O and 2H isotope sampling data results indicate evaporative losses in other Research Farm monitoring network wells (NH-1W through NH-7W). Several different processes are presented that explain the isotopic signature and although the isotope data indicate that ground water is influenced by evaporation, they do not indicate ground water degradation. As stated in the previous ground water reports, any deviations in ground water quality, if present, are within the precision and accuracy of the analytical method.

Huntington Research Farm Isotope Analysis Report
Water & Environmental Technologies, PC _______________________________________________________________________________
ii | P a g e
Table of Contents
1.0 INTRODUCTION ..................................................................................................... 1
2.0 SITE DESCRIPTION ............................................................................................... 2 2.1 Location ............................................................................................................. 2 2.2 Climate .............................................................................................................. 2 2.3 Site History ....................................................................................................... 2 2.4 Geology and Hydrogeology ............................................................................ 3 2.5 Site Soils ............................................................................................................. 4 2.6 Water Resources .............................................................................................. 5
2.6.1 Stream Inflow ...................................................................................... 5 2.6.2 Imported Water................................................................................... 5 2.6.3 Wastewater .......................................................................................... 6 2.6.4 Ground Water ..................................................................................... 7
3.0 DATA ANALYSIS ..................................................................................................... 8 3.1 Hydraulic Flow Measurements ...................................................................... 8 3.2 Analytical Data ............................................................................................... 10 3.3 Geochemical Analysis .................................................................................... 12 3.4 Stable Isotope Analysis .................................................................................. 12
4.0 CONCLUSIONS ...................................................................................................... 15
5.0 REFERENCES ......................................................................................................... 17

Huntington Research Farm Isotope Analysis Report
Water & Environmental Technologies, PC _______________________________________________________________________________
iii | P a g e
List of Figures
Figure 1. Huntington Power Plant Isotope Sampling Location Figure 2. Huntington Power Plant June 2016 Ground Water Elevations Figure 3. Huntington Power Plant Isotope Diagram List of Appendices
Appendix A. Water Quality Graphs Appendix B. Trilinear Diagrams Appendix C. Isotope Analysis Results

Huntington Research Farm
Isotope Analysis Report Water & Environmental Technologies, PC
______________________________________________________________________________
1 | P a g e
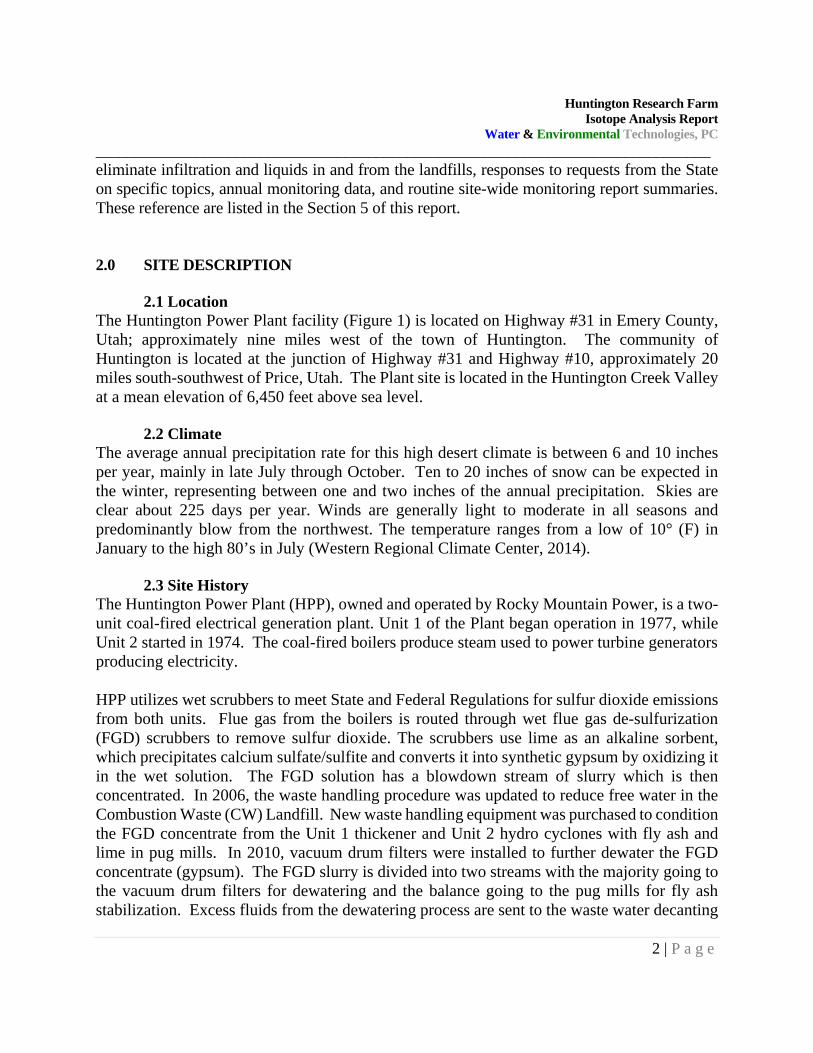
1.0 INTRODUCTION In response to the Utah DEQ Division of Water Quality’s request for oxygen and hydrogen stable isotope sampling to delineate water quality changes, specifically in NH-8W and generally for the Research Farm monitoring wells, for Groundwater Permit Renewal #UGW-150002 for the Huntington Power Plant (HPP or Plant), Water and Environmental Technologies was contracted by PacifiCorp to complete sample collection, data analysis and reporting (Utah DEQ Completeness Review and request for additional information, May 3, 2016). In addition to stable isotope analyses, ground water and surface water monitoring data from the 37 years of monitoring at the site were considered to complete the multiple lines of evidence analysis. Stable 18O and 2H isotope samples were collected (Figure 1) in the Research Farm (Farm) Monitoring Wells (NH-1W through 8W), Huntington Creek upstream and below the Farm (UPL-9), the Mancos Shale ground water upgradient of the landfill (HLF-1N) and the Plant Wastewater Pond (UPL-13). Isotope samples were collected on June 6 through 9, 2016. These samples were submitted to the University of Waterloo in Ontario, Canada on June 10 for analysis. Oxygen and Hydrogen results were received on July 5, 2016 and are included as Attachment C. One additional Research Farm well was also requested by UDEQ; however, two wells were installed; one in the location UDEQ requested and one on the north side of Huntington creek (NH-9W and NH-10W, respectively on Figure 1). These wells provide isotope and additional ground water elevation and chemistry data for the Farm. The methodology and results of this data collection effort are detailed in this report. In order to provide meaningful isotopic results, all influent site waters were sampled, as well as, other Research Farm monitoring wells. The data from ? provide valuable information with which to provide context for the interpretation of the isotopic results. In addition, water levels were measured in the sampled wells and surface water elevation and flow measurements were collected during and after the sampling event. The report will provide a background site description including area climatic conditions, geology/hydrogeology, soil types and a description of site water sources. The data analysis incorporates information on ground water and surface water hydraulics, analytical and geochemical data analysis and the stable isotope analysis. This report uses data from geologic, hydrologic and hydrogeologic studies conducted throughout the history of the HPP. Many of the conclusions stated in this report are based on data and analysis conducted as part of these referenced reports. Studies conducted as part of the referenced report include the installation of the first monitoring wells at the site in 2004, continued routine monitoring of ground water and surface water at the facility, landfill corrective measures to
Huntington Research Farm Isotope Analysis Report
Water & Environmental Technologies, PC _______________________________________________________________________________
2 | P a g e
eliminate infiltration and liquids in and from the landfills, responses to requests from the State on specific topics, annual monitoring data, and routine site-wide monitoring report summaries. These reference are listed in the Section 5 of this report. 2.0 SITE DESCRIPTION 2.1 Location The Huntington Power Plant facility (Figure 1) is located on Highway #31 in Emery County, Utah; approximately nine miles west of the town of Huntington. The community of Huntington is located at the junction of Highway #31 and Highway #10, approximately 20 miles south-southwest of Price, Utah. The Plant site is located in the Huntington Creek Valley at a mean elevation of 6,450 feet above sea level.
2.2 Climate The average annual precipitation rate for this high desert climate is between 6 and 10 inches per year, mainly in late July through October. Ten to 20 inches of snow can be expected in the winter, representing between one and two inches of the annual precipitation. Skies are clear about 225 days per year. Winds are generally light to moderate in all seasons and predominantly blow from the northwest. The temperature ranges from a low of 10° (F) in January to the high 80’s in July (Western Regional Climate Center, 2014).
2.3 Site History The Huntington Power Plant (HPP), owned and operated by Rocky Mountain Power, is a two-unit coal-fired electrical generation plant. Unit 1 of the Plant began operation in 1977, while Unit 2 started in 1974. The coal-fired boilers produce steam used to power turbine generators producing electricity. HPP utilizes wet scrubbers to meet State and Federal Regulations for sulfur dioxide emissions from both units. Flue gas from the boilers is routed through wet flue gas de-sulfurization (FGD) scrubbers to remove sulfur dioxide. The scrubbers use lime as an alkaline sorbent, which precipitates calcium sulfate/sulfite and converts it into synthetic gypsum by oxidizing it in the wet solution. The FGD solution has a blowdown stream of slurry which is then concentrated. In 2006, the waste handling procedure was updated to reduce free water in the Combustion Waste (CW) Landfill. New waste handling equipment was purchased to condition the FGD concentrate from the Unit 1 thickener and Unit 2 hydro cyclones with fly ash and lime in pug mills. In 2010, vacuum drum filters were installed to further dewater the FGD concentrate (gypsum). The FGD slurry is divided into two streams with the majority going to the vacuum drum filters for dewatering and the balance going to the pug mills for fly ash stabilization. Excess fluids from the dewatering process are sent to the waste water decanting

Huntington Research Farm Isotope Analysis Report
Water & Environmental Technologies, PC _______________________________________________________________________________
3 | P a g e
basins, where it is either reused in the Plant or sent to the Irrigation Storage Pond. The dewatered waste material is trucked to the Combustion Waste Landfill for disposal. Water handling procedures at HPP are complex. In general, water from multiple sources is used for Plant operations and multiple wastewater sources are collected for re-use in Plant processes or irrigation of the Research Farm. Wastewater includes normal blowdown water such as cooling tower circulation water, FGD wastewater, ash handling system water, boiler blowdown, etc. In addition to water treatment wastes and sewage treatment effluents, water from storm drains, building roofs and floor drains is also collected. These combine as mixed wastewater in the waste water decanting basins, where it is either reused in the Plant or sent to the Irrigation Storage Pond for use on the Research Farm.
2.4 Geology and Hydrogeology
The HPP is located in the northwestern portion of the Colorado Plateau physiographic province and within the Mancos Shale Lowlands (Stokes 1986). The Mancos Shale Lowlands are characterized by sloping, gravel-covered pediments, rugged badlands and narrow, flat-bottomed alluvial valleys. HPP is located in the Huntington Creek valley, which is incised into the Wasatch Plateau, draining east into the Castle Valley. Because of its geochemical composition and erodibility, the Mancos Shale, a dark gray to black ridge forming marine shale deposit, provides a natural source of soluble salts. It was deposited in a transgressive/regressive coastal-marine environment and is a known source of halite (NaCl) and calcium and sodium-sulfate minerals, such as gypsum (CaSO4*10H2O), mirabilite (Na2SO4*10H2O) and thenardite (Na2SO4) (Waddell et al.1979). These minerals are highly soluble and dissolve readily when in contact with ground water. The Plant is principally built upon alluvial fan deposits at the confluence of Deer and Huntington Creeks. The uplands on both sides of Huntington Creek are composed of the Masuk Member of the Mancos Shale with scattered remnants of Quaternary pediments. Based on previous site work and a review of monitoring well lithology logs, the site ground water monitoring wells can be broken into two broad classifications: alluvial/colluvial monitoring wells and Mancos Shale monitoring wells. A majority of the site monitoring wells are screened across the alluvial/shale contact. Exceptions include some wells along Deer Creek, which are completed in alluvium and some within the CW Landfill areas, which are completed in competent Mancos Shale. Lithologic logs from the shale wells note a light gray to dark gray or gray-black shale in various stages of weathering from very weathered to consolidated and unweathered. Alluvial well descriptions describe a tan, orange-brown, and red mixture of fine to medium grained sand and

Huntington Research Farm Isotope Analysis Report
Water & Environmental Technologies, PC _______________________________________________________________________________
4 | P a g e
sandstone boulders. Well drilling, development and monitoring procedures, in general, indicate higher permeability in the alluvial wells, as compared to the shale wells. While some shale wells recharge very slowly and take more than 24 hours to recover from sample purging, others completed in fractured shale recover very quickly. The wells completed in competent shale indicate low permeability, while the wells in the fractured Mancos recover more quickly and provide a greater volume of water. Gypsum is noted in both shale and alluvial well lithologic logs, indicating minerals and salts are abundant and readily available for dissolution. Ground water in the shale shows increased concentrations of minerals along flow paths because of the contact with soluble minerals in the aquifer matrix and the longer residence time of ground water due to the low permeability of the shale as compared to the higher permeability of the valley bottom alluvium. Ground water in the alluvium may show similar increased minerals, but with much lower concentrations due to lower mineral content in the aquifer matrix and shorter relative residence times in the more permeable alluvium. Ground water at the site is present in three separate aquifers: the competent shale aquifer, colluvial/shale contact aquifer, and valley bottom alluvial aquifer. Infiltration of precipitation in the uplands moves down through the colluvium and accumulates in a water table aquifer at the colluvium/Mancos shale contact. Ground water flows along the contact following the topography of the shale and, in some areas, infiltrates into the fractured Mancos shale. Given the generally dry desert climate, infiltration is relatively minimal and ground water flow from the uplands to the Research Farm is a small component of the total flow into the alluvial valley aquifer. In some areas, such as at the top of the upland ridges, ground water is not encountered along the Colluvium/Mancos contact and the wells are completed deeper in the competent Mancos Shale aquifer. These wells are typically deeper and have very limited production. Once the well is purged, it can take days to weeks to fully recharge. The Huntington alluvial valley aquifer is typically composed of gravel to boulder sized material mixed with varying amounts of sand, silt and clay. It was deposited by Huntington Creek on an erosional contact with the Mancos Shale. In this environment, the alluvium is generally deposited during high energy storm events that wash eroded sediments from the uplands into the valley. These sediments are reworked by meandering stream channels and exhibit a fining upward depositional sequence.
2.5 Site Soils The surface soils in the valley bottom in vicinity of the Huntington Power Plant are generally alluvial fans of well drained calcareous soils that are loamy textured mixed clay, silt, sand, and cobbles; mostly derived locally from the upgradient Mancos Shale. The Smithpond, Shupert-Dancehall and Kitipes soils generally occur along alluvial fan remnants or structural benches
Huntington Research Farm Isotope Analysis Report
Water & Environmental Technologies, PC _______________________________________________________________________________
5 | P a g e
or mesas. At HPP, these soils occur along Huntington Creek and generally are coarser grained with a lower clay content than the upgradient Gerst-Strych-Badland Complex and Porser series soils that occur along the valley slopes. 2.6 Water Sources Water sources to the HPP facility can be categorized as water used in the Plant (imported water), water pumped from the Plant to the Irrigation Pond (wastewater) and natural sources of water flowing through the site (stream and groundwater). Each of these sources is discussed below.
2.6.1 Stream Inflow
The USGS topographic map indicates Huntington Creek and Deer Creek are perennial streams, although Deer Creek has been dry through the Plant since mine dewatering discharge to the creek ceased in the Spring of 2015. Surface water in Huntington Creek has been monitored for many decades. Monitoring locations include: upgradient to HPP at H-1, cross gradient at H-2 and downgradient from HPP at UPL-9 (Huntington Power Plant Water Quality Analysis, January 11, 2016). Trends indicate similar water quality and typical seasonal fluctuations between 1979 and present. Geochemically, the Huntington Creek monitoring points plot near each other in the calcium bicarbonate water type area of the trilinear diagram. Monitoring data shows slightly lower concentrations in H-1 and H-2 as compared to UPL-9, as is expected with natural increases in soluble minerals as stream water has additional contact time with sediments.. Historic monitoring data indicate that this trend was evident even in 1979, thus suggesting naturally increasing concentrations in the creek in the downgradient direction. Springs seeping into the creek along the stream reach from H-1 to UPL-9 show evident salt mobilization from the uplands ground water entering the valley. Ground water quality data from monitoring wells (NH-1W, NH-2W and NH-4W) along the ridge bottom adjacent to the creek indicate ground water saline seeps from the Mancos Shale into the alluvial valley aquifer and are, most likely, the reason for the water quality concentration increases both in the alluvial aquifer and in the downgradient stream water.
2.6.2 Imported Water
Water is imported to HPP from Huntington Creek. The imported water is used in Plant operations and stored onsite in the raw water storage pond (Settling Basin). The raw water quality has significantly lower mineral concentrations as compared to other site waters (with the exception of Huntington Creek stream inflow). Previous geochemical work indicates that the raw water type is predominantly calcium/bicarbonate, while other site waters, ground water and spring water, are calcium to sodium-sulfate type waters.

Huntington Research Farm Isotope Analysis Report
Water & Environmental Technologies, PC _______________________________________________________________________________
6 | P a g e
2.6.3 Wastewater
Wastewater is generated by normal blowdown from Plant processes such as cooling tower circulation water, liquid ash handling systems and boiler blowdown. Water treatment wastes and sewage treatment effluent also contribute to wastewater flow, as do storm drains, building roof and floor drains. These combine as mixed wastewater and are collected in the Irrigation Storage Pond (UPL-13 on Figure 1). This wastewater is used beneficially to irrigate the Research Farm. Because waste material from this facility is derived from coal combustion, the liquid and slurry wastes are composed of naturally occurring elements (sodium, calcium, potassium, magnesium, carbonate, sulfate, chloride, boron, nitrate, and selenium). The water bearing formation beneath the facility (Mancos Shale) has background concentrations of these same elements, thus discerning impacts from facility operations can be challenging. Due to contact with the Mancos Shale, ground water also shows natural degradation of water quality along ground water flow paths. Prior to 2006, FGD concentrate was disposed of in evaporation basins within the Coal ash waste landfills. In 2006, the waste handling procedure at HPP was updated. New waste handling equipment was purchased to condition the FGD concentrate from the Unit 1 thickener and Unit 2 hydro cyclones with fly ash and lime in pug mills, significantly reducing the moisture entering the landfill. In 2010, new vacuum drum filters were installed to further dewater the FGD concentrate (gypsum). Excess fluids from the dewatering process are sent to the waste water decanting basins for reuse at the Plant or sent to the Irrigation Storage Pond. The dewatered waste material is trucked to the Combustion Waste Landfill for disposal. This updated process eliminated free liquid in waste material deposited in the new Landfill and subsequently reduced water levels and constituent concentrations in the shallow Landfill monitoring network wells (Huntington Power Plant Water Quality Analysis, January 11, 2016). In addition to reducing water in the FGD waste handling process, infiltration of precipitation has been reduced at the old CW Landfill by designing and covering the Landfill with an evapotranspiration cap (Huntington Old Ash Landfill Modification and Maintenance Plans, May 29, 2015). The corrective measures described above were completed to reduce liquids in the landfill and eliminate seepage into the subsurface. The Duck Pond drainage between the two Landfills, as shown in Figure 1 is fed primarily by upgradient ground water underflow, infiltration of precipitation and Landfill seepage. Seepage from the landfills was detected by the monitoring system and corrective measures were implemented at both landfill locations to resolve this issue. Infiltration of precipitation on the Old Landfill has been reduced significantly by the construction of an evapotranspiration cap and landfill seepage has been reduced by updating FGD handling procedures. Decreased ground water elevations in the landfill monitoring wells are indicative of increased efforts to
Huntington Research Farm Isotope Analysis Report
Water & Environmental Technologies, PC _______________________________________________________________________________
7 | P a g e
minimize water content in waste material and infiltration of precipitation. In addition, a capture drain system was installed in this drainage in 2008/2009 to intercept shallow ground water with high constituent concentrations from impacting site ground water/surface water resources (Huntington Power Plant, Corrective Action Plan, October 2007). The captured water was re-routed for beneficial use within the Plant processes. Once the interception system was installed and optimized and the landfill disposal issues were addressed, seepage immediately reduced decreasing asymptotically to present conditions, where no seepage is evident. The seepage was discovered in 2004, and while the seepage has been eliminated, residual contamination is still moving through the flow system. As is common in ground water systems, especially ones with fine grained aquifer matrix, introduced total dissolved solids (TDS) reduce asymptotically with the majority of concentration decrease early and concentrations decreases slower over time, eventually approaching natural background conditions.
2.6.4 Ground Water
Ground water at the Research Farm originates from three sources, listed in order of highest contribution:
Seepage from surface water (both streams and ponds), Inflow of ground water along upgradient facility boundaries, and Infiltration (precipitation, dust and combustion suppression, liquid disposal and
irrigation). Based on the available monitoring data for the facility, infiltration in the uplands results in a water table aquifer at the colluvial/shale contact. This is typically a thin zone of saturation in the colluvium perched on top of the less permeable shale. Flow in this aquifer generally follows the topography of the weathered surface of the shale bedrock. During monitoring well drilling activities, several locations were drilled where ground water was not encountered at the Colluvial/Mancos contact. In these situations, the perched aquifer is not present and the first ground water encountered may be deeper in the competent shale. Regardless of where ground water is encountered in the uplands, it is a minor flow volume, with low permeability as compared to the alluvium, unless secondary permeability, such as fractures in the shale are present. The Huntington Creek valley bottom alluvium, under the Research Farm is much more permeable than the surrounding shale aquifer. During drilling, development and purging of the wells, the alluvium produces sufficient water for sampling and drawdown during sampling is much less than in the shale or colluvial wells.
Huntington Research Farm Isotope Analysis Report
Water & Environmental Technologies, PC _______________________________________________________________________________
8 | P a g e
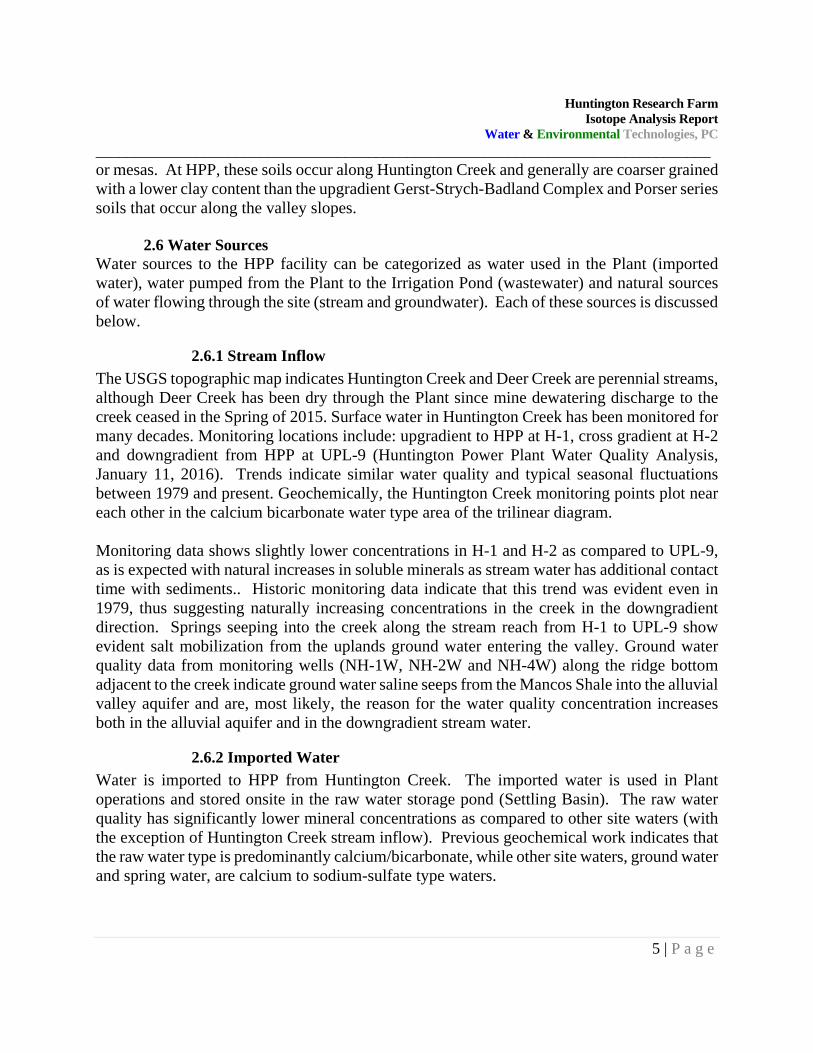
In general, ground water in the valley alluvium, flows in the same direction as surface water, exiting along the southeastern boundary of the Plant site. Ground water from the uplands enter along the valley margins, contributing ground water to the valley aquifer. From boring log descriptions and well development procedures, aquifer permeability is lower in the shale and colluvium and moderate in the alluvium. Coarse-grained material at the alluvium-shale contact accounts for a majority of the subsurface flow both in the uplands and in the Research Farm area. However, data from drilling indicates the shale/colluvial contact is composed of sandstones boulders to gravel sized material in a weathered shale matrix, whereas the valley alluvium has the same coarse grained component but much less clay in the aquifer matrix. For this study, 18O and 2H isotopic results from each water source were collected and used to interpret the flow system in conjunction with previously collected data on ground water elevation, geochemical trends and streamflow elevation and flow data (Huntington Power Plant Site Wide Monitoring Program, 2004 Annual Monitoring Report, 9/20/05). 3.0 DATA ANALYSIS Although isotope data can be very valuable in characterizing ground water flow paths and identifying source waters and contaminants, it should be used carefully and in conjunction with other hydrologic, geologic, and geochemical information (Clark, 2015). Because those data are available for this site, 18O and 2H isotope results will be presented as one part of multi-level analysis that also includes hydraulic flow measurements, analytical data, and geochemical analyses. 3.1 Hydraulic Flow Measurements In general, ground water flows from the uplands into the incised creek valleys and then along the valley bottoms (arrows on Figure 2). Thus, higher elevation areas along Deer Creek, the Rock Garden (near RG-1) and the Duck Pond Drainage (between the landfills) flow to the alluvium in the Duck Pond drainage valley bottom which then discharge into the Huntington Creek Valley alluvium under the Research Farm.. Huntington Creek and the valley alluvium drain the site from the northwest to the southeast. Figure 2 shows ground water elevation data that were collected June 7-8, 2016. The data includes two additional monitoring points from the newly drilled wells, NH-9W and NH-10W (elevation data from these wells as measured on June 9, 2016). The dataset also includes surface water elevations for Huntington Creek measured on June 7, 2016. Surface water elevations in the creek in June were higher than ground water elevations in the near stream ground water monitoring wells (NH-8W, NH-6W, NH-3W and NH-1W). This indicates that this reach of the stream may be losing water (recharging ground water). This would be

Huntington Research Farm Isotope Analysis Report
Water & Environmental Technologies, PC _______________________________________________________________________________
9 | P a g e
expected in the spring. Surface water elevations are much higher than ground water near NH-8W (approximately 14 ft. higher), while the differential is much smaller downstream at NH-1W and UPL-9 (stream is 0.46 ft. higher). The latter half of this stream reach (below the NH-6W) may reverse and become a gaining reach (i.e. ground water recharging the stream) in the latter part of the year as surface water flows decrease. It is likely, because of the large differential between stream water elevation and ground water elevation, that the upper portion of the reach is losing year-round. In order to further define Huntington Creek characteristics, such as total flow, gaining or losing conditions and elevation of the stream water, additional data was collected at several locations. WET completed flow gauging at two locations, upgradient and downgradient of the Farm. PacifiCorp collected survey information on water levels in the creek, as compared to ground water at several locations along the Creek. Stream gauging was completed upgradient (H-2) and downgradient of the Research Farm (UPL-9). These data indicate that the flow upgradient of the Farm was 114.36 cubic feet per second (cfs) and 122.49 cfs below the Farm. While these data indicate the stream is gaining, the accompanying surface water elevation data indicate the stream is losing above the Farm House and gaining below the House, with a transitional zone near the Farm House, that, most likely, varies throughout the year depending on the creek flow, elevation and precipitation. Most alluvial systems in the intermountain west have high spring flows that recharge the aquifer while low fall stream water flows are sustained by discharge from the aquifer. The ground water elevation fluctuations shown on the near creek hydrographs in Appendix A indicate that this is occurring in Huntington Creek in this area. The majority of the increase in volume of 8 cfs or 6.5% of flow in Huntington Creek is most likely from inflow from springs and seeps from the uplands along the valley margin and discharge from Huntington Creek in the losing reach. Additional, although minor imputs are expected from irrigation and precipitation infiltration on the Research Farm. While additional studies would be needed to determine the exact contributions from these sources, the additional water represents a small portion (6.5%) of the total streamflow. Ground water flow direction in the Huntington valley alluvium is predominantly from northwest to southeast at an average gradient of 0.014. The gradient is steeper at the northwest end of the valley (0.196) and shallower to the southeast (0.008). Evidence of ground water under the influence of surface water is illustrated by the seasonal elevation and temperature fluctuations shown in Figures A-1 through A-4, Appendix A.

Huntington Research Farm Isotope Analysis Report
Water & Environmental Technologies, PC _______________________________________________________________________________
10 | P a g e
Notice that monitoring wells near the creek (NH-1W, NH-2W, NH-3W, NH-6W and NH-8W) show much more seasonal variation, as compared to wells further from the creek (NH-4W and NH-5W) which show a damped response to seasonal fluctuations of ground water temperature and elevation. The exception to this analysis is NH-2W which is completed along the base of the ridge, but the narrowing of the alluvial valley in this area forces the surface water influence throughout the valley alluvium also affecting NH-2W in this area. As shown in Figures A-1 through A-6, most Farm wells exhibit a decreasing ground water elevation beginning in the fall of 2011 (NH-1W, NH-2W, NH-4W, NH-5W, NH-7W). Monitoring wells NH-3W, NH-6W and NH-8W are closer to the creek and although they show decreased water levels over the same period, they do not exhibit the prolonged decreased trend that other Farm wells do. Because of the widespread nature of the decrease and the larger magnitude of decrease in wells farther from the creek, it can be deduced that the decrease was in recharge to the valley alluvium from the uplands and not related to creek water. In 2009, a capture drain system was installed in the drainage between the landfills (Duck Pond Drainage) to prevent shallow ground water with high constituent concentrations from impacting site ground water/surface water resources. The system was optimized over the next year to collect baseflow but allow storm events to discharge down the drainages. The captured water is re-routed for beneficial use within the Plant processes. This effectively reduces the recharge to the valley alluvium. The largest magnitude effect on ground water from this capture system would be expected in monitoring wells nearest the system. In fact, the largest magnitude effect is in NH-7W, which is located near the mouth of the drainage in which the capture system is located. 3.2 Analytical Data Trend Analysis Intra-well (comparison of data constituent trends within the same well) and inter-well (comparison to other wells) trend analyses were performed on the analytical data results for the Research Farm wells. Significant trends identified in the Farm monitoring well sub-group are described below. Research Farm water chemistry for key constituents is plotted on Figures A-4 through A-6. These graphs generally indicate seasonality in the TDS trends especially in NH-1W, NH-2W, and NH-3W with the highest TDS values in the fall. This correlates with the wells that are highly influenced by surface water and indicates that the lower reach of the stream may seasonally gain water from ground water inflow. Thus these monitoring wells are receiving proportionally more recharge from Mancos derived ground water in the fall as compared to the spring. Since the Creek only gains approximately 6.5% in flow volume across this reach and a majority of that gain is probably infiltration from the creek in the upper reach, the inflow

Huntington Research Farm Isotope Analysis Report
Water & Environmental Technologies, PC _______________________________________________________________________________
11 | P a g e
from the Mancos is most likely a small increase in volume, but the water quality constituents are concentrated enough to show a discernable influence on the water chemistry in the valley alluvium, hence the higher TDS values. TDS trends are relatively stable in most Farm monitoring wells; with the exception of NH-4W, NH-6W, NH-7W and NH-8W. NH-4W and NH-7W, which are located near the outlet of the Duck Pond drainage and were likely impacted by leachate from the upgradient landfill, as indicated by their elevated water quality concentrations and geochemical signature. The leachate issue has been addressed through changes in disposal practices and interception of seepage using infiltration trenches and a collection system. Both wells have sharply decreasing water levels and contaminant concentrations (TDS, sulfate, nitrate) from 2009 to present. The timing of the trends correlates with corrective actions at the landfall. The corrective actions included dewatering of waste before deposition in the landfill, an ET cap on the old landfill to prevent infiltration of precipitation and installation of a ground water capture system in the Duck Pond Drainage and at the toe of the New Landfill to intercept higher concentration landfill leakage and to reduce impacts to downgradient surface and ground water. These corrective actions are described in more detail in Section 2.6.3. The geochemical, analytic and ground water trends, in conjunction with the timing, indicate that the corrective actions are the most likely cause for the trend changes in these wells, indicating that the interception system has been effective in removing the seepage from the ground water system. (Huntington Power Plant Water Quality Analysis, January 11, 2016) NH-6W, however, has increased TDS values, but only for the fall measurements. As with NH-1W, NH-2W and NH-3W, this may indicate that the stream is gaining water from ground water in this reach in the fall, thus there is more influence from Mancos ground water in this well in the fall. (The elevated values in this well were most likely exacerbated by a leak that was discovered in the valve to the lateral line that fed the field area around NH-6W. The monitoring well network detected the leak, as designed, and the leak was reported to the State of Utah and remedied by PacifiCorp personnel. It was repaired before the 2014 irrigation season and the 2015 constituent levels are much lower with fall levels lower than spring.) NH-8W is the outlier. It does not show the clear seasonality of NH-6W or the sharply decreasing trend as in NH-4W and NH-7W. It has an increasing trend for TDS, sulfate and chloride and a decreasing water level trend, but its overall constituent concentrations are the lowest of the Farm monitoring well network. Decreasing water level trends, combined with increasing TDS, sulfate and chloride indicate a reduction in recharge water with lower constituent concentrations to the area surrounding this well. Capture of springs, along the base of the ridgeline which formerly flowed in a ditch along the northern edge of the Farm (shown on Figure 1) that discharged into Huntington Creek near NH-8W, most likely resulted in the water level and geochemical trends seen in NH-8W.

Huntington Research Farm Isotope Analysis Report
Water & Environmental Technologies, PC _______________________________________________________________________________
12 | P a g e
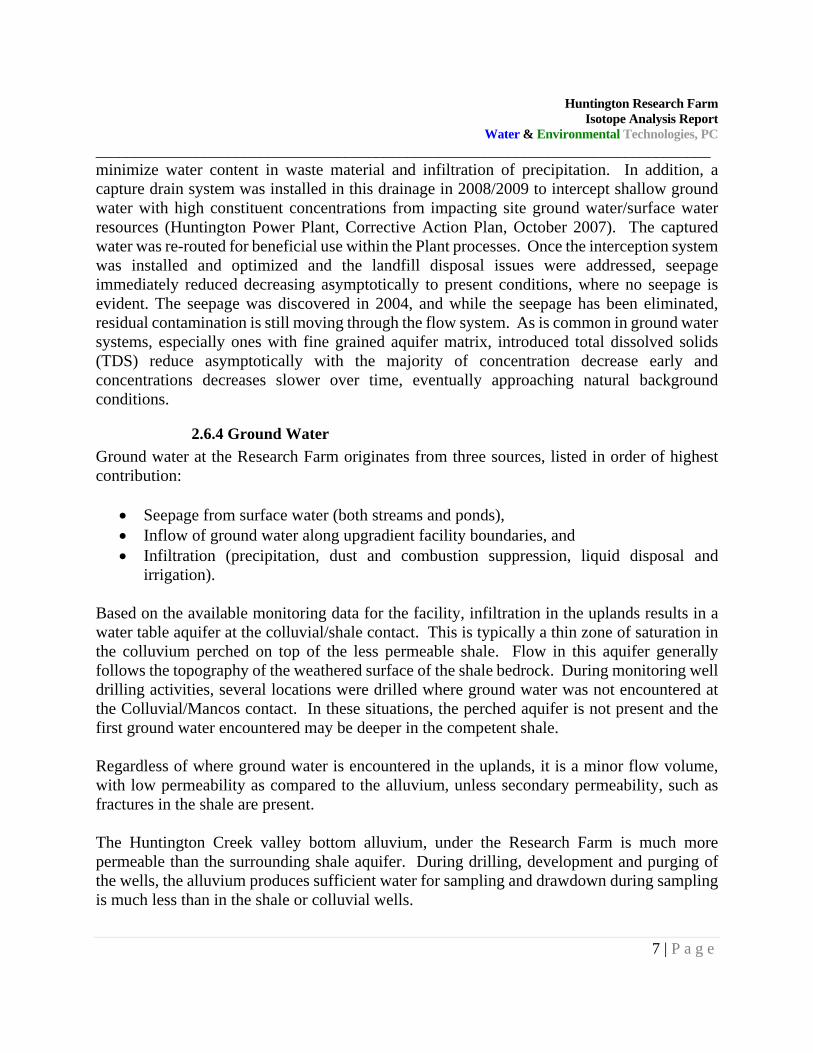
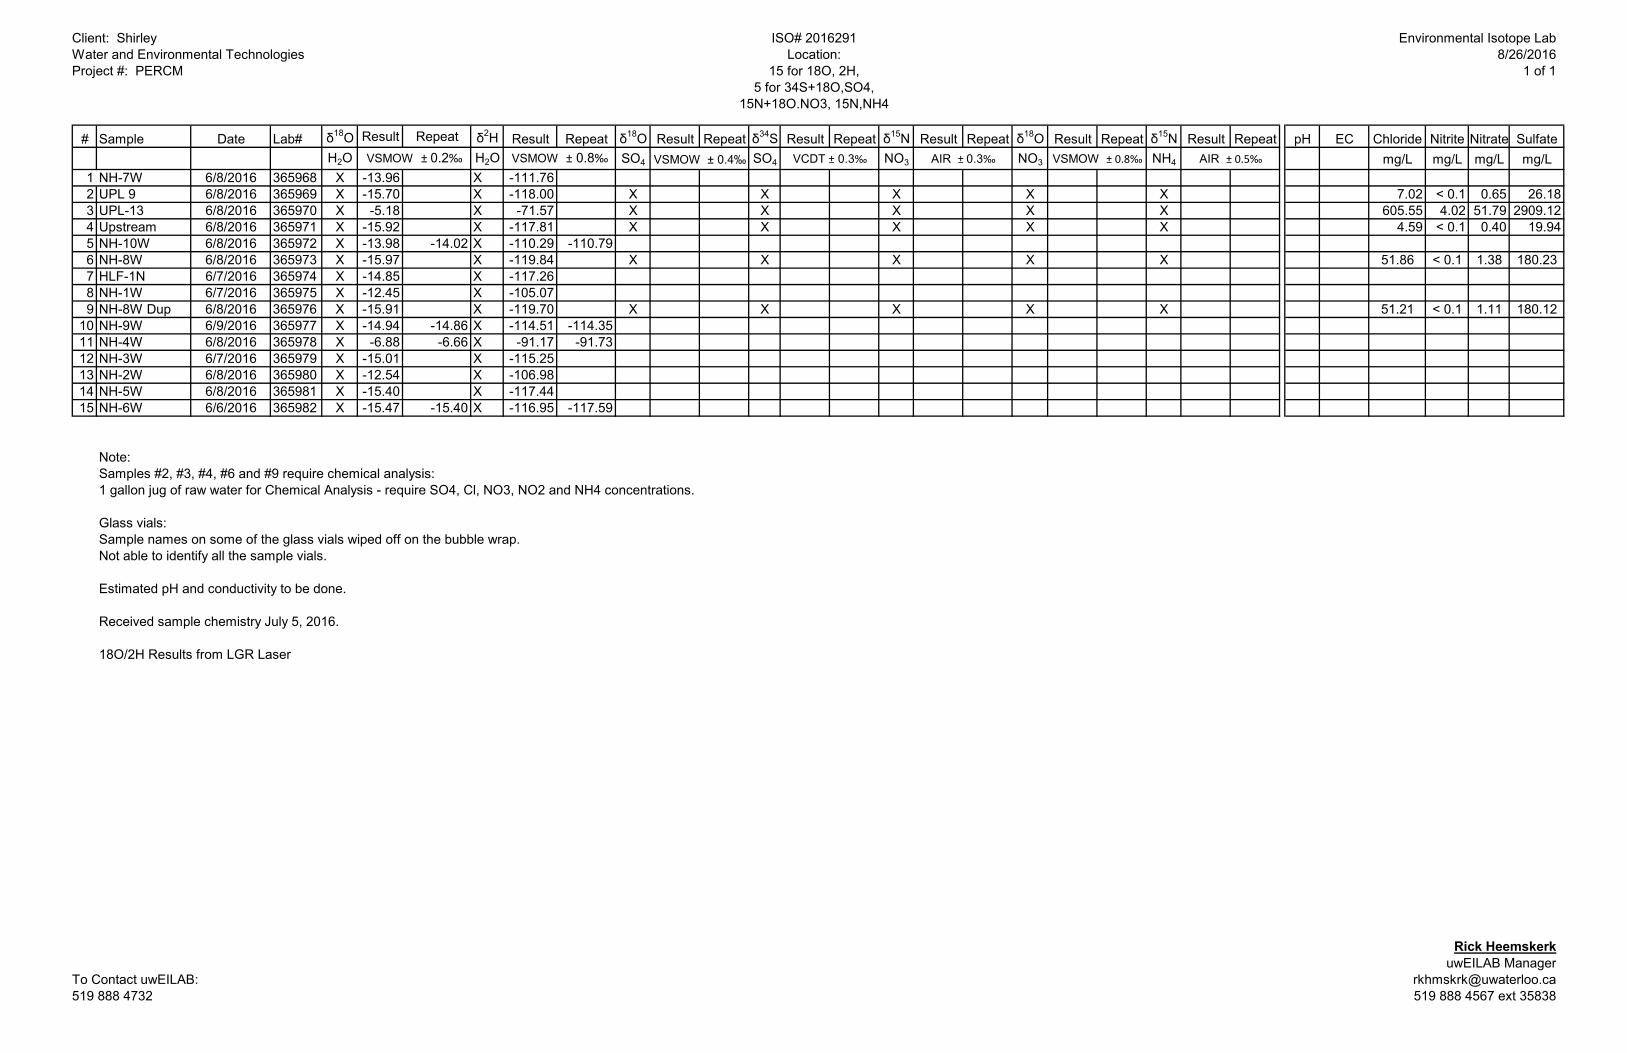
3.3 Geochemical Analysis Geochemical analyses consisted of using trilinear diagrams to evaluate water types and changes in water chemistry over the monitoring period. As ground water moves through an aquifer matrix, it acquires a diagnostic chemical composition, as a result of the interaction between the ground water and the lithologic aquifer framework. At the HPP, water quality analyses have delineated a range of water quality types in monitoring wells across the site, as described in section 2.6.1 and 2.6.2. This suggests that aquifer water quality at the site is highly dependent upon the aquifer composition and water levels. It also suggests that the aquifer matrix is reactive with ground water, because of the low permeability of the shale aquifer material and the resulting relatively longer ground water residence times in the uplands aquifers as compared to the Valley alluvial aquifer. Details on ground water geochemistry for the Research Farm monitoring wells are provided using Trilinear diagrams. Figure B-1 (Appendix B) is a Trilinear diagram which exhibits the overall geochemical signature of the Research Farm monitoring points, along with Huntington Creek and spring sample points, for the Spring 2015 monitoring event. Notice that monitoring wells NH-6W and NH-8W plot near the three monitoring points from Huntington Creek (UPL-9, H-2 and H-1), indicating the similarity in water chemistry. Generally, the trilinear diagram indicates that the Huntington Creek sample points have much lower percent chloride and sulfate relative to the calcium and bicarbonate than the other monitoring points. The Research Farm wells, NH-4W and NH-2W, plot closer to Landfill wells when considering the sulfate component, which may indicate the effect of seepage from the Mancos Shale ground water at the toe of this slope. NH-6W and NH-8W plot very near the Huntington Creek points indicating less mixing with the ground water on the northern portion of the Farm and significant direct interaction between surface water and ground water in these wells. A Trilinear Diagram (Figure B-2) showing NH-8W monitoring data over time indicates the difference in water quality in this well between seasons. The regularity of the seasonal differences in not, however, as consistent as that found in NH-6W (Figure B-3). 3.4 Stable Isotope Analysis The stable 18O and 2H isotope sampling results are included as Appendix C and shown graphically in Figure 3. Several trends are apparent in the isotopic results. The depletion evident in the 18O and 2H isotope results indicates that the continental, elevation and latitude effect on precipitation is significant in the area of HPP. Meteoric water becomes more depleted as it moves farther from the ocean. As the air mass moves inland, it fractionates, whereby the

Huntington Research Farm Isotope Analysis Report
Water & Environmental Technologies, PC _______________________________________________________________________________
13 | P a g e
heavier isotopes are rained out and the resulting air mass becomes more depleted in comparison. A similar effect occurs with increasing elevation, where cooling of the air mass causes increased precipitation at higher elevations, again depleting the resulting air mass. The depletion of the air mass at higher elevations is also effected by the increased fractionation between the liquid and vapor phases that occurs at lower temperatures. The degree of depletion of the air mass due to the continental effect versus the elevation effect cannot be accurately differentiated. In addition, higher latitudes also tend to have depleted air masses again due to the fact that temperatures are generally lower at higher latitudes. Although Local Meteoric Water Lines (LMWL) can be developed for specific sites and can be different than the Global Meteoric Water Line (GMWL), the data results for this analysis are compared to the GMWL because the LMWL calculated for North America by the IAEA (International Atomic Energy Agency) varies only slightly from the GMWL for the 18O and 2H isotope results from our study. The lines actually intersect very near the data values for our site. Also obvious from the graphical representation of the data results, is that the majority of the data fall along a trend line which insects with the GMWL at a shallower slope. The equation for the GMWL is y=8X+10 while the equation for the intersecting trend line is y= 3.9X-57 with an R2 value close to 0.95. The trend line is indicative of an “evaporation line” (EL). Any slope less than 8, the slope of the GMWL, indicates that the waters have been influenced by kinetic fractionation. The change in slope is significant, because practically the only process which modifies the isotopic signatures of waters in this manner is evaporation. The EL slope of approximately 4 is also interesting in that it indicates evaporation that has taken place at very low humidity levels, which is characteristic of this site. The intersection of the evaporation line and the GMWL indicates the isotopic composition of the precipitation from which the waters originated. This intersection is very near the location of the upstream sample on the GMWL. The NH-8W DUP sample is a duplicate sample collected from the NH-8W monitoring well shortly after the NH-8W sample for QA/QC purposes and plots almost on top of the NH-8W sample. Several outliers to the best fit line are evident in the data set. These include HLF-1N, UPL-13 and NH-4W. UPL-13 is the sample collected from the Irrigation Storage Pond and HLF-1N is an upgradient landfill well and that water represents deeper Mancos Shale ground water with a relatively longer residence time. The proximity of HLF-1N to the rest of the Research Farm samples indicates the influence of Mancos water in ground water samples for this site. HLF-1N is also offset from the GMWL indicating this water has been influenced by a kinetic process(es) that make it isotopically distinct. It is not surprising that UPL-13 would be distinct, as it is partially composed of Plant water which has undergone mechanical evaporation processes within the Facility. Both HLF-1N (Mancos water) and NH-4W also plot below the

Huntington Research Farm Isotope Analysis Report
Water & Environmental Technologies, PC _______________________________________________________________________________
14 | P a g e
EL, indicating that NH-4W has a similar isotopic signature to HLF-1N (Mancos water) with an additional evaporative influence. NH-8W plots isotopically very near both the upstream and downstream (UPL-9) sample points, indicating strong similarity to surface water. NH-8W and the stream samples also plot very near the Global Meteoric Water Line (GMWL), indicating that these samples are isotopically very similar to local precipitation and the average isotopic signature from meteoric water worldwide with little of the evaporative signature evident in some of the other Research Farm monitoring wells. Several other interesting trends can be noted in the trend line shown on Figure 3. NH-8W, the most upgradient Research Farm monitoring well, plots nearest the GMWL, while NH-1W and NH-2W, the furthest downgradient Farm monitoring wells, plot at the furthest end of the best fit evaporation line. NH-5W and NH-6W, mid-Farm flow regime wells, plot closer to NH-8W than NH-7W or NH-10W. Both NH-7W and NH-10W are completed along the valley margin, although on different sides of the valley. Monitoring well NH-9W is physically located near NH-10W, but plots near NH-3W on Figure 3. Both of these wells are completed near Huntington Creek but plot farther down the evaporation line than NH-5W or NH-6W which are upgradient in the flow regime. In summary, the wells further down the ground water flow path show greater influence from evaporative effects. The best fit line represents an evaporation line with the majority of the Research Farm wells falling near that line with a correlation coefficient of 95%, thus these wells have been affected by evaporative processes. Several different interpretations can be made about exactly what evaporative processes resulted in the isotopic signature of the site waters. It can be any or a combination of the those listed below.
1. The irrigation system at the Research Farm has been managed to maximize evapotranspiration. As a result there is more evaporated water flowing through the aquifer at the lower end of the Farm, which results in greater evaporative effects than those at the upper end of the Farm.
2. The Research Farm is being irrigated with water that has been effected by evaporative processes at HPP, thus infiltration of this water would also result in ground water with an evaporative signature that increases in a downgradient direction.
3. In 2004, site investigation data documented process water from the landfill causing impacts to several wells downgradient of the landfill, down the Duck Pond Drainage and discharging into the Alluvial Aquifer beneath the Farm. These impacts were evident beneath the farm, but especially along the northern edge of the pond downgradient from the Duck Pond. The HPP monitoring network worked as designed, impacts were detected, reported to the appropriate State Agency and addressed through
Huntington Research Farm Isotope Analysis Report
Water & Environmental Technologies, PC _______________________________________________________________________________
15 | P a g e
corrective measures. The Landfill water was also Plant process water, with significant evaporative effects similar to the current Irrigation pond. Corrective actions have been taken to eliminate these impacts, but this contaminated water did move into the valley alluvium affecting downgradient Farm monitoring wells. With the Landfill seepage addressed, ground water monitoring shows the residual effects of the landfill seepage in the wells downgradient of the landfill.
Irrigation of the Research Farm with another water source would most likely also show an evaporative isotopic signature. Because of the arid nature of this site, evaporation would take place regardless of the source of water for irrigation, although the magnitude of the evaporative signature may not be as large because the current irrigation system is operated to maximize evapotranspiration losses and minimize infiltration.
4.0 CONCLUSIONS
The purpose of this isotope study was to determine if the Research Farm at the HPP was having an adverse effect on water quality in NH-8W or the other Research Farm monitoring network wells. Analyzing previous site data in conjunction with the new 18O and 2H isotope results, the conclusion can be made that HPP is having very little to no effect on water quality in well NH-8W. Both the isotopic and geochemical data indicate the water quality in this well is very similar to the surface water quality in Huntington Creek. The analytical data and hydrologic data indicate increases in TDS, sulfate and chloride in this well that correlate with a decrease in water level. These data, when evaluated in conjunction with the geochemical and new isotopic analyses, indicate that the changes in NH-8W are most likely a result of changes in the sources of recharge to this well. The changes are coincident to the construction of the capture system in the Duck Pond Drainage and subsequent capture of springs that previously flowed along the base of the ridge and into a ditch which discharged to Huntington Creek near NH-8W. The loss of this recharge component most likely resulted in the reduction in water level and the increase in water quality concentrations, as the springs generally had lower major mineral concentrations. The 18O and 2H isotope sampling data results indicate evaporative losses in the other Research Farm monitoring network wells. As stated above, several different processes could be responsible for the isotopic signature and although the isotope data indicate evaporation, they do not indicate ground water quality degradation. As stated in the previous ground water reports, any deviations in ground water quality, if present, are too small to be accurately quantified. In addition, based on the isotopic data, the site is not impacting Huntington Creek. The data
Huntington Research Farm Isotope Analysis Report
Water & Environmental Technologies, PC _______________________________________________________________________________
16 | P a g e
indicates that the Upgradient Creek water and the Downgradient creek water are the same quality within the accuracy and precision of the analytical method. As shown on Figure 3, the upstream sample and UPL-9 plot in the same location on the figure, indicating no significant isotopic difference between the two samples, thus no degradation of the stream water. In summary, the isotope analysis supports the conclusions that:
1. Irrigation and Farm practices do not adversely affect water quality in NH-8W, 2. Irrigation and Farm practices do not appreciable affect Huntington Creek between the
upper sample location (H-2) and the lower sample location (UPL-9), and 3. Evaporative effects along ground water flowpaths under the Research Farm are
detectable using stable isotope analysis, but would most likely be present and detectable regardless of the water source, given the current high ET irrigation strategy.

Huntington Research Farm Isotope Analysis Report
Water & Environmental Technologies, PC _______________________________________________________________________________
17 | P a g e
5.0 REFERENCES
Freeze R.A. and Cherry, J.A. 1979. Groundwater. Prentice Hall. Englewood Cliffs, New
Jersey. 604p. Hettinger, R.D. and Kirschbaum, M.A.2002. Stratigraphy of the Upper Cretaceous Mancos
Shale (upper part) and Mesaverde Group in the southern part of the Uinta and Piceance Basins, Utah and Colorado. USGS. Geologic Investigations Series I-2764.
Hounslow, A. W. 1995. Water Quality Data Analysis and Interpretation. Lewis Publishers.
397p. MFG, Inc. 2003. Preliminary Draft Price River, San Rafael River, and Muddy Creek TMDLs
for Total Dissolved Solids West Colorado Watershed Management Unit, Utah. NRCS. 2004. Natural Resources Conservation Service, USDA.
(http:/ortho.ftw.ncrs.usda.gov). Stokes, W.L. 1986. Geology of Utah. Utah Museum of Natural History and Utah Geological
and Minerals Survey. URS. 2003. PacifiCorp Huntington Plant Groundwater Discharge Permit Application. Waddell, K.M. Contratto, P.K. Sumison, C.T. and Butler, J.R. 1979. Hydrologic
Reconnaissance of the Wasatch Plateau-Book Cliffs Coal-Fields Area, Utah. USGS Geological Survey – Water Supply Paper 2068.
Water & Environmental Technologies. 2002. Ground Water Analysis Huntington Farms. Water & Environmental Technologies. 2016. Ground Water Analysis Huntington Farms. Water & Environmental Technologies. 2002. Huntington Power Plant, Water Quality Analysis Water & Environmental Technologies. 2005, Huntington Power Plant, Site Wide Monitoring
Program (2004 Annual Report).

Huntington Research Farm Isotope Analysis Report
Water & Environmental Technologies, PC _______________________________________________________________________________
18 | P a g e
Water & Environmental Technologies. 2007, Huntington Power Plant, Corrective Action Plan
and Best Management Practices: Old Landfill Area and New Landfill Area. Water & Environmental Technologies. 2014. Huntington Power Plant, Water Quality Analysis Water & Environmental Technologies. 2014. Huntington Power Plant, Water Quality Analysis
(2016 Addendum) . Western Regional Climate Center. 2014. Historical Climate Information.
(http:/www.wrcc.dri.edu/summary/climsmut/html).

Huntington Research Farm Isotope Analysis Report
Water & Environmental Technologies, PC _______________________________________________________________________________
Figures
0 1,000500Fe e t
1 inch = 750 fe e t
.
Legend@A MW
@A All Isotope Ana lysis!< All Isotope Ana lysis (SW )@A δ18O & δ2H Only
Boise
Salt Lake City
La s Ve ga s
§̈¦80
§̈¦15
§̈¦84
§̈¦70
§̈¦80
UTNV
ID WY
CO
AZ NMCA
£¤89 £¤6
£¤191
£¤6
£¤6
UV29
UV31
UV10
UV132
Manti la Sal National Forest
Fishlake National Forest
Uinta National Forest
Job#: P ERCM73Da te : 9/14/2016 FIGURE 1
HUNTINGTON POWER PLANTIsotope Sampling Locations
Path: \\wetfs\maps\Huntington\2016 ISOTOPE SAMPLING.mxd, Author: jleprowse

@A
@A
@A
@A
@A
@A
@A
@A
@A
@A
@A
@A
@A
@A
@A
@A
@A
@A
@A
@A
@A
@A
@A
@A
@A
@A
@A
@A@A
!<
!<
!<
!<
!?
!<
6360
6300
Huntington Creek By NH-8WCreek Elevation: 6270.98
UPL-9Creek Elevation: 6177.78Discharge: 122.49 CFS
Huntington Creek Survey PointCreek Elevation 6222.91
NH-9W6194.32
NH-10W6194.65
RG-1
HCP-6
HCP-4
N H-1W6177.30
N H-3W6185.45
N H-2W6186.39
N H-6W6224.88
N H-5W6212.55
N H-8W6256.88
N H-4W6205.57
N H-7W6272.22
HDP-3DRY
(6286.14)HDP-26304.33
HDP-16369.11
HPS-1
HSW -1HW W -7
HW W -4
UPL-13
HLF-20 HLF-40HLF-10
HLF-70
HLF-30
HLF-1N6539.99
HLF-60
HLF-3N
HLF-4N
Huntington Creek UpstreamCreek Elevation: 6300.46Discharge: 114.36 CFS
62106200
6220
6250
6240
6190
6230
6180
6260
62806270
6290
6310
6350
6320
6340
6330
H-2
Deer
Cree
k
H u n t i n g t o n C r e e k
0 1,000500Fe e t
1 inc h = 750 fe e t
.
Legend@A Monitoring W e ll@A All Is otope Ana lys is!< All Is otope Ana lys is (Surfa c e W a te r)@A δ18O & δ2H Only
@A N e w Is otope W e ll (δ18O & δ2H Only)
!< Surfa c e W a te r Sa m pling Site!? Surve y Point (N o Is otope Sa m ple )
Ground wa te r Contour Line s (10 ft. Inte rva l)
PERCM73FIGURE 2
June 2016 Groundwater ElevationsHuntington Power Plant
Da te : 8/26/2016 M:\Huntington\June 2016 Ele va tions .m xd
Boise
Salt Lake City
La s Ve ga s
§̈¦80
§̈¦15
§̈¦84
§̈¦70
§̈¦80
UTN V
ID W Y
CO
AZ N MCA
Provo
§̈¦15
§̈¦70
§̈¦15
§̈¦70
£¤89
£¤6£¤191
£¤89
£¤6
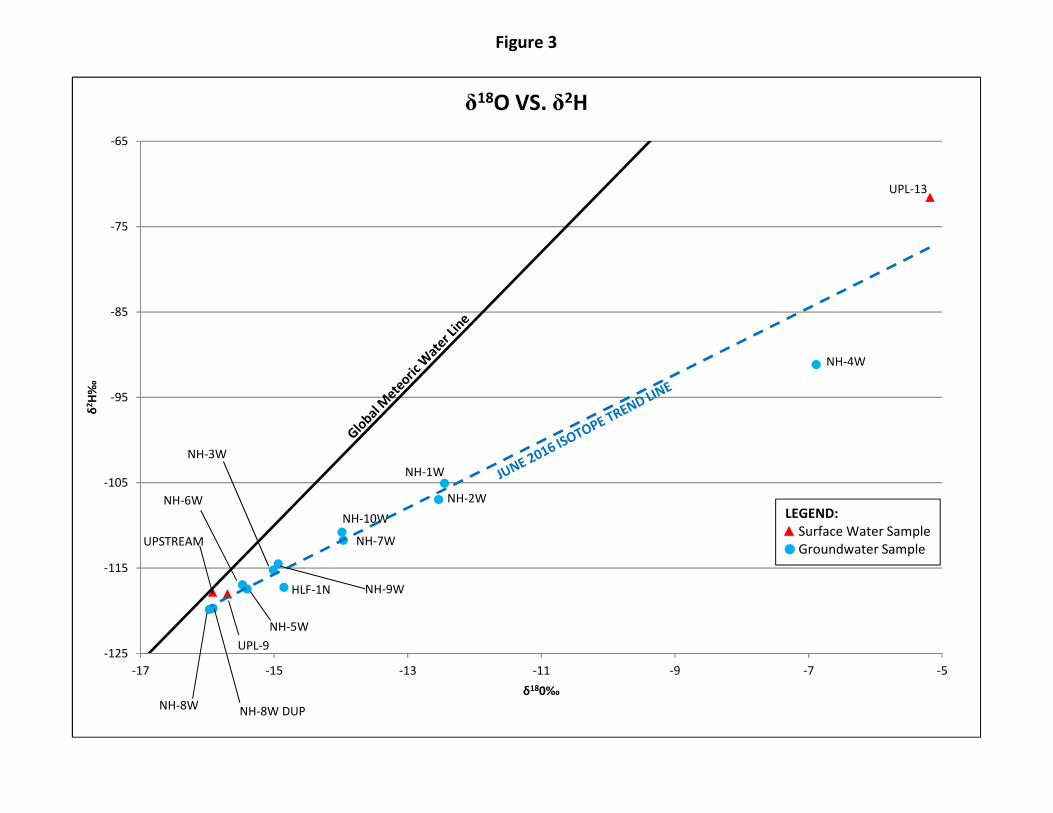
Figure 3
NH‐7W
UPL‐9
UPL‐13
UPSTREAM
NH‐10W
NH‐8W
HLF‐1N
NH‐8W DUP
NH‐9W
NH‐4W
NH‐3W
NH‐2W
NH‐5W
NH‐6W
NH‐1W
‐125
‐115
‐105
‐95
‐85
‐75
‐65
‐17 ‐15 ‐13 ‐11 ‐9 ‐7 ‐5
δ2H‰
δ180‰
δ18O VS. δ2H
LEGEND:Surface Water SampleGroundwater Sample
Huntington Research Farm
Isotope Analysis Report Water & Environmental Technologies, PC
______________________________________________________________________________
Appendix A. Water Quality Graphs

Figure A‐1
0
2
4
6
8
10
12
14
16
6,174
6,175
6,176
6,177
6,178
6,179
12/30/2001 12/31/2003 12/30/2005 12/31/2007 12/30/2009 12/31/2011 12/30/2013 12/31/2015 12/30/2017
Deg
rees Celsius
Groun
d water eleva
tion (fee
t)
Dates
NH ‐ 1W (Farm Well)
GW Elevation Temperature
0
2
4
6
8
10
12
14
16
6,182
6,183
6,184
6,185
6,186
6,187
12/30/2001 12/31/2003 12/30/2005 12/31/2007 12/30/2009 12/31/2011 12/30/2013 12/31/2015 12/30/2017
Deg
rees Celsius
Groun
d Water Eleva
tion (fee
t)
Dates
NH ‐ 3W (Farm Well)
GW Elevation Temperature
0
2
4
6
8
10
12
14
16
6,185
6,186
6,187
6,188
6,189
6,190
12/30/2001 12/31/2003 12/30/2005 12/31/2007 12/30/2009 12/31/2011 12/30/2013 12/31/2015 12/30/2017
Deg
rees Celsius
Groun
d Water Eleva
tion (fee
t)
Dates
NH ‐ 2W (Farm Well)
GW Elevation Temperature
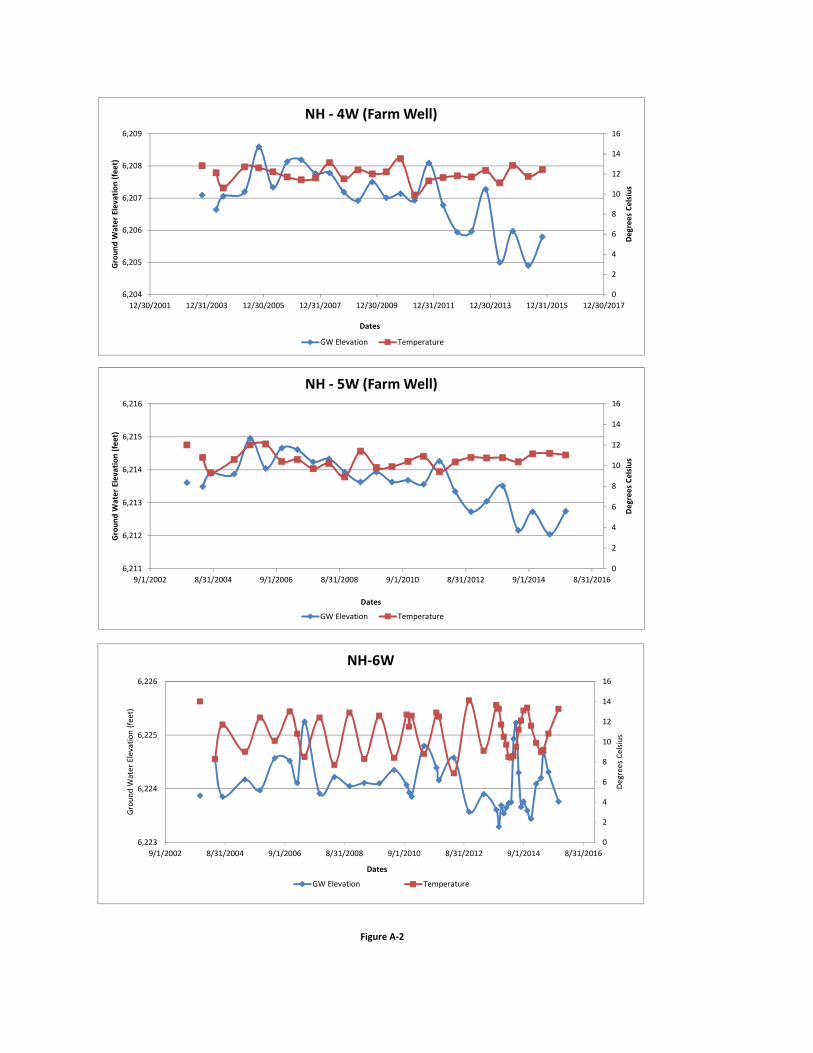
Figure A‐2
0
2
4
6
8
10
12
14
16
6,211
6,212
6,213
6,214
6,215
6,216
9/1/2002 8/31/2004 9/1/2006 8/31/2008 9/1/2010 8/31/2012 9/1/2014 8/31/2016
Deg
rees Celsius
Groun
d Water Eleva
tion (fee
t)
Dates
NH ‐ 5W (Farm Well)
GW Elevation Temperature
0
2
4
6
8
10
12
14
16
6,204
6,205
6,206
6,207
6,208
6,209
12/30/2001 12/31/2003 12/30/2005 12/31/2007 12/30/2009 12/31/2011 12/30/2013 12/31/2015 12/30/2017
Deg
rees Celsius
Groun
d Water Eleva
tion (fee
t)
Dates
NH ‐ 4W (Farm Well)
GW Elevation Temperature
0
2
4
6
8
10
12
14
16
6,223
6,224
6,225
6,226
9/1/2002 8/31/2004 9/1/2006 8/31/2008 9/1/2010 8/31/2012 9/1/2014 8/31/2016
Degree
s Ce
lsius
Groun
d Water Elevatio
n (fe
et)
Dates
NH‐6W
GW Elevation Temperature

Figure A‐3
0
2
4
6
8
10
12
14
16
6,269
6,270
6,271
6,272
6,273
6,274
6,275
6,276
6,277
6,278
6,279
12/30/2001 12/31/2003 12/30/2005 12/31/2007 12/30/2009 12/31/2011 12/30/2013 12/31/2015 12/30/2017
Deg
rees Celsius
Groun
d Water Eleva
tion (fee
t)
Dates
NH ‐ 7W (Farm Well)
GW Elevation Temperature
0
2
4
6
8
10
12
14
16
6,258
6,259
6,260
6,261
6,262
12/30/2001 12/31/2003 12/30/2005 12/31/2007 12/30/2009 12/31/2011 12/30/2013 12/31/2015 12/30/2017
Degree
s Ce
lsius
Groun
d Water Elevatio
n (fe
et)
Dates
NH‐8W
GW Elevation Temperature

Huntington Research Farm Isotope Analysis Report
Water & Environmental Technologies, PC _______________________________________________________________________________
Appendix B. Trilinear Diagrams

DATE: FIGURE B-108/26/2016PERCM43
LEGEND:
HUNTINGTONA DIVISION OF PACIFICORP
SPRING 2015
FARM MONITORING WELLS
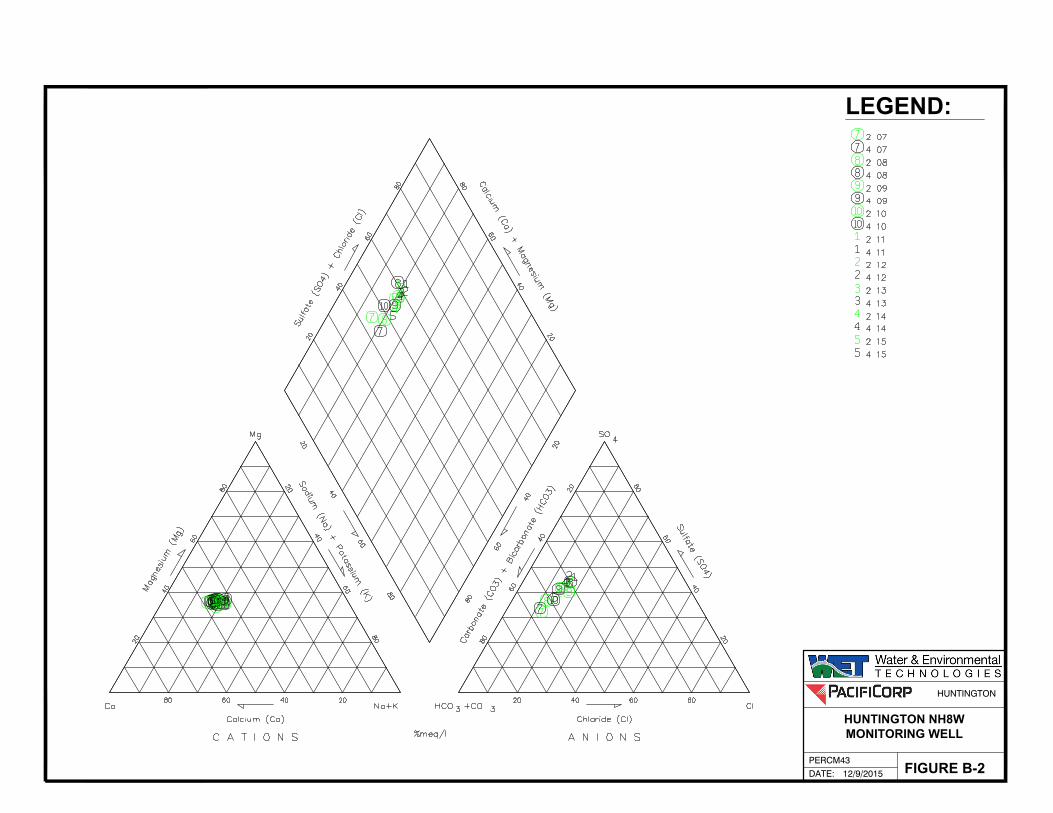
DATE: FIGURE B-212/9/2015PERCM43
LEGEND:
HUNTINGTONA DIVISION OF PACIFICORP
HUNTINGTON NH8W
MONITORING WELL

DATE: FIGURE B-312/9/2015PERCM43
LEGEND:
HUNTINGTONA DIVISION OF PACIFICORP
HUNTINGTON NH6W
MONITORING WELL

Huntington Research Farm Isotope Analysis Report
Water & Environmental Technologies, PC _______________________________________________________________________________
Appendix C. Isotope Analysis Results
Client: ShirleyWater and Environmental TechnologiesProject #: PERCM
ISO# 2016291Location:
15 for 18O, 2H,5 for 34S+18O,SO4,
15N+18O.NO3, 15N,NH4
Environmental Isotope Lab8/26/2016
1 of 1
# Sample Date Lab# δ18O Result Repeat δ2H Result Repeat δ18O Result Repeat δ34S Result Repeat δ15N Result Repeat δ18O Result Repeat δ15N Result Repeat pH EC Chloride Nitrite Nitrate SulfateH2O H2O SO4 SO4 NO3 NO3 NH4 mg/L mg/L mg/L mg/L
1 NH-7W 6/8/2016 365968 X -13.96 X -111.762 UPL 9 6/8/2016 365969 X -15.70 X -118.00 X X X X X 7.02 < 0.1 0.65 26.183 UPL-13 6/8/2016 365970 X -5.18 X -71.57 X X X X X 605.55 4.02 51.79 2909.124 Upstream 6/8/2016 365971 X -15.92 X -117.81 X X X X X 4.59 < 0.1 0.40 19.945 NH-10W 6/8/2016 365972 X -13.98 -14.02 X -110.29 -110.796 NH-8W 6/8/2016 365973 X -15.97 X -119.84 X X X X X 51.86 < 0.1 1.38 180.237 HLF-1N 6/7/2016 365974 X -14.85 X -117.268 NH-1W 6/7/2016 365975 X -12.45 X -105.079 NH-8W Dup 6/8/2016 365976 X -15.91 X -119.70 X X X X X 51.21 < 0.1 1.11 180.12
10 NH-9W 6/9/2016 365977 X -14.94 -14.86 X -114.51 -114.3511 NH-4W 6/8/2016 365978 X -6.88 -6.66 X -91.17 -91.7312 NH-3W 6/7/2016 365979 X -15.01 X -115.2513 NH-2W 6/8/2016 365980 X -12.54 X -106.9814 NH-5W 6/8/2016 365981 X -15.40 X -117.4415 NH-6W 6/6/2016 365982 X -15.47 -15.40 X -116.95 -117.59
Note:Samples #2, #3, #4, #6 and #9 require chemical analysis:1 gallon jug of raw water for Chemical Analysis - require SO4, Cl, NO3, NO2 and NH4 concentrations.
Glass vials:Sample names on some of the glass vials wiped off on the bubble wrap.Not able to identify all the sample vials.
Estimated pH and conductivity to be done.
Received sample chemistry July 5, 2016.
18O/2H Results from LGR Laser
VSMOW ± 0.2‰ VSMOW ± 0.8‰ AIR ± 0.3‰ VSMOW ± 0.8‰ VSMOW ± 0.4‰ VCDT ± 0.3‰ AIR ± 0.5‰
To Contact uwEILAB:519 888 4732
Rick HeemskerkuwEILAB Manager
[email protected] 888 4567 ext 35838