Embed Size (px)
DESCRIPTION
Humboldt State University budget & facilities overview. February 11, 2014. CURRENT ECONOMIC ENVIRONMENT. FEDERAL Survived sequestration Uptick in housing market Slight economic improvement STATE - A new budget horizon? CA has the 9 th largest economy in the world with GDP of $2 trillion - PowerPoint PPT Presentation
Citation preview

HUMBOLDT
STATE
UNIVERSIT
Y
BUDGET & FA
CILITI
ES
OVERVIEW
F EB
RU
AR
Y 1
1,
20
14
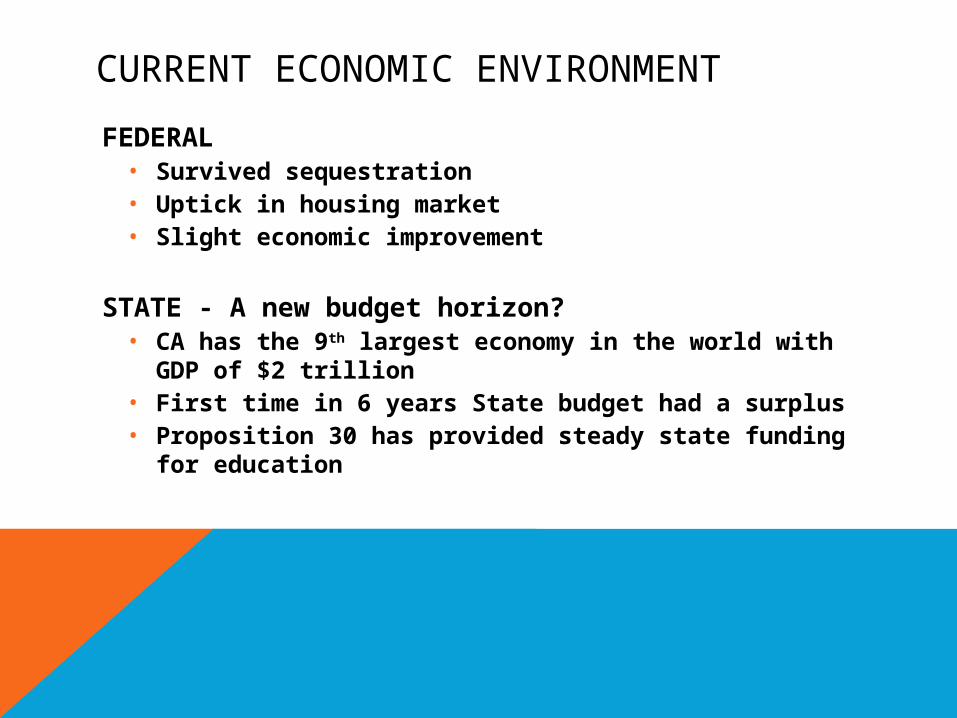
CURRENT ECONOMIC ENVIRONMENT
FEDERAL• Survived sequestration• Uptick in housing market• Slight economic improvement
STATE - A new budget horizon?• CA has the 9th largest economy in the world with
GDP of $2 trillion• First time in 6 years State budget had a surplus• Proposition 30 has provided steady state funding
for education

GOVERNOR’S 2014-15 BUDGET PROPOSAL
Governor promised four years steady funding 5%, 5%, 4%, 4%
• CSU General Fund increase of 5%: $142.2 million
• Assumes no tuition increases through 2016-17
• Requires CSU to meet performance standards
• Proposes to fold debt service into the General Fund

06/07 07/08 08/09 09/10 10/11 11/12 12/13 13/146000
6500
7000
7500
8000
8500
Headcount and FTE Trends
Fall HCFall FTESpring HCSpring FTE
Academic Year
# o
f stu
dents

ENROLLMENT UPDATE
• Early indications are Spring will not make up for Fall shortfall
• Spring Enrollment Assumptions• Budget: FTES drop off from Fall to Spring: -5.04% (3 year
average)• Actual: Spring will not be final until census (Feb. 17)
Enrollment Fall 2013 Spring 2014Update
BudgetActual
sDiff.
Budget
Actual as of 2/10
Diff.
Resident FTES 7,181 7,173 -8 6,819 6,845 +26WUE FTES 462 409 -53 439 365 -74Non-Resident FTES
202 189-13
192 181 -11
Total FTES 7,845 7,772 -73 7,450 7,391 -59Headcount 8,363 8,293 -70 7,777 7,820 +43

2013-14: REVENUE HIGHLIGHTS (JULY-DECEMBER)
• % of revenue collected: 72% (Down from 75% in 2012-13)
• Excluding state appropriation: 93% (Slightly down from 2012-13: 94%)
• Fall tuition revenue low by ~$360,000 (Over $100k in refunds/waivers since Q1 update)
• Spring tuition projected shortfall: $50,000-$100,000
• Shortfall due to decrease in WUE and Non-Resident students

MULTI-YEAR ACTUALS COMPARISON(JULY-DECEMBER)
2010-11 2011-12 2012-13 2013-140
10,000,000
20,000,000
30,000,000
40,000,000
50,000,000
60,000,000
70,000,000
80,000,000
90,000,000
$66,325,707.7$73,854,118.1
$80,659,187.6 $83,183,186.0
Total Revenue

MULTI-YEAR ACTUALS COMPARISON(JULY-DECEMBER)
2010-11 2011-12 2012-13 2013-140
5,000,000
10,000,000
15,000,000
20,000,000
25,000,000
30,000,000
35,000,000
40,000,000
45,000,000
50,000,000
$32,258,705.7
$41,713,224.0$42,511,467.7$42,885,866.1
$2,173,417.6$1,996,368.8$2,017,935.7$1,779,206.6
Tuition Revenue
State Tuition Fee Non-Resident
2010-11 2011-12 2012-13 2013-140
5,000,000
10,000,000
15,000,000
20,000,000
25,000,000
30,000,000
35,000,000
40,000,000
45,000,000
50,000,000
$26,908,000.0$25,482,000.0
$31,200,000.0$32,703,474.0
State Appropriation

MULTI-YEAR ACTUALS COMPARISON(JULY-DECEMBER)
2010-11 2011-12 2012-13 2013-1448,000,000
50,000,000
52,000,000
54,000,000
56,000,000
58,000,000
60,000,000
62,000,000
$53,113,109.7
$58,073,427.8
$59,212,055.7
$60,424,612.3
Total Expenditures

MULTI-YEAR ACTUALS COMPARISON(JULY-DECEMBER)
• Salaries and Benefits = 82% of Original Budget (excluding financial aid)
Salaries(49.5% of budget spent)
Benefits(49.4% of budget spent)
2010-11
2011-12
2012-13
2013-14
0.0
5,000,000.0
10,000,000.0
15,000,000.0
20,000,000.0
25,000,000.0
30,000,000.0
35,000,000.0
$27,387,453.8$28,272,881.1$28,706,055.0$29,054,109.5
2010-11 2011-12 2012-13 2013-140.0
5,000,000.0
10,000,000.0
15,000,000.0
20,000,000.0
25,000,000.0
30,000,000.0
35,000,000.0
$11,423,641.9$11,677,642.4$12,571,415.9$13,547,121.5

MULTI-YEAR ACTUALS COMPARISON(JULY-DECEMBER)
Financial Aid (51% of budget
spent)
Operating Expenses(41% of budget spent)
2010-11 2011-12 2012-13 2013-140.0
2,000,000.0
4,000,000.0
6,000,000.0
8,000,000.0
10,000,000.0
12,000,000.0
$5,945,178.0
$7,686,773.0$7,571,932.7$7,023,881.0
2010-11 2011-12 2012-13 2013-140.0
2,000,000.0
4,000,000.0
6,000,000.0
8,000,000.0
10,000,000.0
12,000,000.0
$8,356,836.0
$10,436,131.2$10,362,652.1$10,799,500.4

2014-15 BUDGET PLANNINGBudget Planning Summary - DRAFT 2014-15 2015-16 2016-17
Beginning Fund Balance 7,628,699 7,379,903 8,226,521
Revenue Budget Estimate 118,725,642 122,790,642 126,990,642
Base Expenditure Estimate* 118,569,838 121,643,464 123,542,994
Base Budget Surplus/(Deficit)
155,804 1,147,178 3,447,648
One-Time Initiatives* 404,600 300,560 300,560
Net Budget Surplus -248,796 846,618 3,147,088
Ending Fund Balance 7,379,903 8,226,521 11,373,609
Funding Pool @ 5% Fund Bal.* 1,451,411 2,144,348 5,196,459
Funding Pool @ 4% Fund Bal.* 2,637,109 3,360,782 6,431,889
*Base expenditure budget and one-time initiatives only include enrollment growth funding. Additional budget allocations to be decided upon during URPC budget request evaluation process in February/March.

Introduced a Resource Request Process for 2014-15 Aligns resource allocations with campus priorities Provides transparency and accountability Leads to continuous improvements
Used the PREP Planning Tool for collecting all URPC requests Becomes a data repository for resource requests Can align university/division/college/department
planning Requests include measurable outcomes and follow up
reporting
UNIVERSITY RESOURCES & PLANNING COMMITTEE

2014-15 PROCESS
University Level Review and Approval
Division Level Review and Approval
MBU Level Review and Approval
Department Level Resource Requests
MBU: Major Budget Unit

20 proposals received$3.9M in requests
$2.1M in base budget requests $1.8M in one-time requests
Proposals reviewed in FebruaryURPC is evaluating budget requests using agreed
criteria Supports HSU’s priorities Benefits of the request Opportunity costs Implementation/Funding Considerations
URPC will determine funding available for 14-15 and beyond
URPC PROPOSALS

URPC INTERACTIVE SCENARIO PLANNING
HSU Budget Planning Sheet - DRAFT
Revised February 7, 2014
2014-15Projection
2015-16Projection
2016-17Projection
2017-18Projection
Beginning Fund Balance 7,628,699 7,379,903 8,226,521 11,373,609
TOTAL Operating Fund Revenue Estimate 118,725,642 122,790,642 126,990,642 131,349,642
Enrollment Growth Model Base Funding 358,496 356,626 511,530 382,443
Enrollment Growth Funding from CSU 768,000 500,000 500,000 500,000
Base Initiatives
TOTAL Base Operating Fund Expense Estimate 118,569,838 121,643,464 123,542,994 126,181,437
Net Base Budget Surplus / (Deficit) 155,804 1,147,178 3,447,648 5,168,205
One-Time Adjustments
Enrollment Growth Model One Time Funding 404,600 300,560 300,560 300,560
One-Time Initiatives
TOTAL Operating Fund Expense Estimate 118,974,438 121,944,024 123,843,554 126,481,997
Net Budget Surplus / (Deficit) (248,796) 846,618 3,147,088 4,867,645
Ending Fund Balance 7,379,903 8,226,521 11,373,609 16,241,254
(as a % of expenditures) 6.2% 6.8% 9.2% 12.9%
Ending Fund Balance less 5% Level 1,451,411 2,144,348 5,196,459 9,932,182
Ending Fund Balance less 4% Level 2,637,109 3,360,782 6,431,889 11,193,997

Entire program is in the process of being re-designedCSU seeking legislative approval to manage capital
Allows system to re-finance existing debt Gives authority to issue new debt up to 24% of operating fund
Encouraged by this progress but: Will likely take much longer to finalize than anticipated – don’t
anticipate funding in 2014-15 Will require rethinking how we prioritize projects
Priority focus will be on: Seismic Deferred maintenance Infrastructure Accessibility
When funded, HSU will likely receive between $7M-$10M
CSU FACILITIES FUNDING

In Fall 2012, Facilities Working Group developed a process to collect, review and recommend campus-based projects.
Defined Campus-Based Projects Repair, improve or change existing physical campus
with minimum cost of $5K and maximum cost of $610K. Does not apply to major capital projects Does not apply to Chancellor’s Offi ce grant funded
projects Does not apply to non-state or emergency repair/safety
projects.After initial ranking, projects were reviewed as a
whole for long-term strategic planning
FACILITIES WORKING GROUP
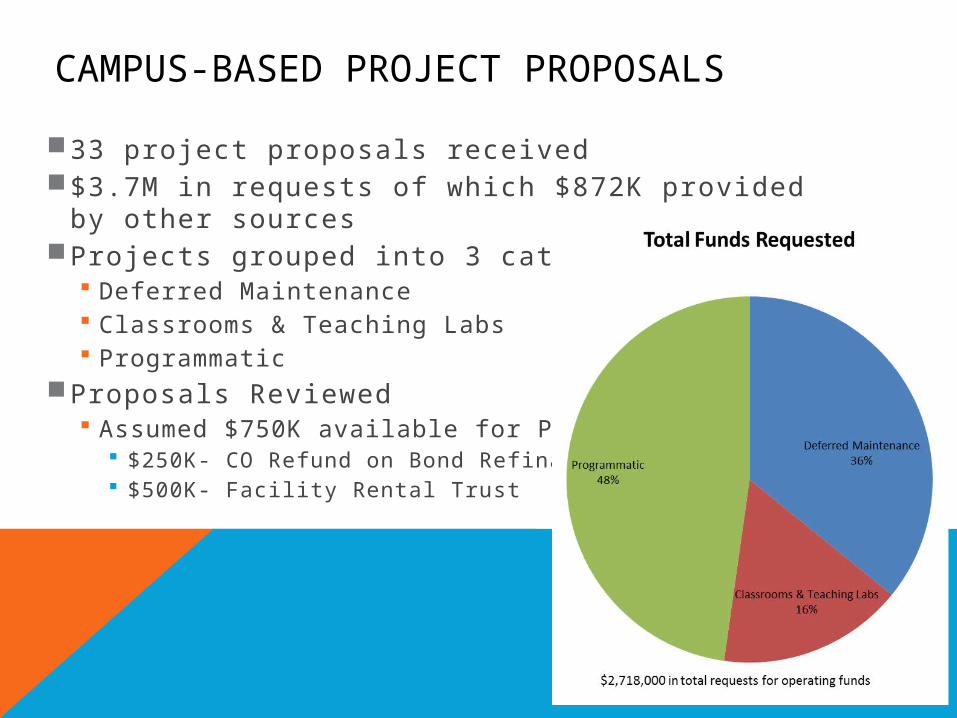
33 project proposals received$3.7M in requests of which $872K provided by
other sourcesProjects grouped into 3 categories
Deferred Maintenance Classrooms & Teaching Labs Programmatic
Proposals Reviewed Assumed $750K available for Projects
$250K- CO Refund on Bond Refinance $500K- Facility Rental Trust
CAMPUS-BASED PROJECT PROPOSALS

SPRING 2014 PROCESS AND NEXT STEPS
URPC evaluates budget requests and develops 2014-15 budget recommendation (February/March)
URPC provides final recommendation to President (March)
President reviews and approves 2014-15 budget (April)

COMMENTS
QUESTIONS?
TH
AN
K Y
OU
!


![[Alexander Von Humboldt] Letters of Alexander Von Humboldt](https://img.pdfslide.us/doc/110x75/577c79791a28abe05492c6ea/alexander-von-humboldt-letters-of-alexander-von-humboldt.jpg)