Embed Size (px)
Citation preview

Human Resource Capital and Relational Capital Dimensions and
the Perceptions of Mum and Dad Shareholders
Submitted by
Alma Sleiman Kairouz
A thesis presented in fulfilment of the requirements for the degree of
Doctor of Philosophy
School of Business, Melbourne Campus (St Patrick's)
Faculty of Art & Sciences
Australian Catholic University Limited
Research Services
115 Victoria Parade Fitzroy VIC 3065
Locked Bag 4115 Fitzroy MDC VIC3065
Telephone 613 9953 3000
Facsimile 613 9953 3005
Submitted 1st March 2011
ii
Statement of Sources
This thesis contains no material published elsewhere or extracted in whole or in part from a
thesis by which I have been qualified for or been awarded another degree or diploma.
No other person’s work has been used without due acknowledgement in the main text of this
thesis.
This thesis has not been submitted for the award of any degree or diploma in any other
tertiary institution.
All research procedures reported in this thesis received the approval of the relevant
Ethics/Safety Committees (where required)
I consulted with a statistician, Dr. Sriram Ramachandran, to ensure I conducted the correct
statistical tests for this research and to ensure the statistical tests were conducted correctly.
Alma Sleiman Kairouz 1st March 2011

iii
Acknowledgements
There are a number of people I wish to acknowledge and thank at this time. I wish to
thank my academic supervisor, Dr. Sugumar Mariappanadar, who provided the guidance and
support I needed to complete both my research study and my thesis. I acknowledge his
commitment and I am grateful for his encouragement along the way. I also acknowledge the
contribution made by my co-supervisor Dr. Ken Smith. He has provided guidance and
insight and has made writing this thesis an easier endeavour.
I acknowledge the contribution of Dr. Sriram Ramachandran. He provided valuable,
expert assistance in consultations regarding the testing, verification, and analysis of the
statistical data for both the pilot study and the main study components of this research study.
I am also grateful for the contribution made by the respondents to the questionnaires and by
the members of the focus groups used in my research study.
On a personal note, I am forever grateful to my friend Dr. Katherine O’Callaghan. I
thank you Katherine, for your time, your friendship, and your support.
I also wish to acknowledge the encouragement of my family, both nuclear and
extended. Your faith in me has made it all worth it. I am especially grateful to my children,
Milhiam, Samira, Justine, and Joseph, and to their loved ones and families, I love you all
unconditionally and whole-heartedly.
Finally, and most importantly, I wish to thank my husband George. I cannot express
deeply enough the love and gratitude I extend to you. Your support and encouragement have
sustained me throughout this entire process. I thank you for your words of motivation, for
your optimism, for your belief in my abilities, and for your patience, ultimately. Borrowing
from Deborah Harry, you are the “king of all my dreams”.
iv
Abstract
Intellectual capital (IC), including its components of human resource capital (HRC)
and relational capital (RC), is important to leverage tangible corporate assets. This research
is conducted from a human resource perspective and refers to behavioural economic theories
to explain its findings. There are four research aims which include: (1) to investigate
perceptions of “mum and dad” shareholders about information on HRC and RC dimensions;
(2) to understand the sources of advice individual investors turn to in their stock transaction
decisions; (3) to determine if, in the corporate annual reports of Australian banking sector
corporations (ABSC), HRC and RC information is provided to investors; and (4) to assess the
relationship between the HRC and RC disclosure and share value.
Dimensions of HRC include employee recruitment, retention, values, development of
management and leadership qualities, and developing employee problem solving skills.
Dimensions of RC include customer capital, supplier chain relations, and competitors. The
ABSC investigated include the eight ASX 200 listed corporations at the end of the 2006/2007
financial year. These include the Commonwealth Bank of Australia (CBA), Westpac
Banking Corporation (WBC), National Australia Bank (NAB) and ANZ Banking Group Ltd
(ANZ).
The research involved an initial pilot study and a two-part main study. The pilot study
involved both quantitative and qualitative analysis. It was designed to validate a tool to
measure perceptions of individual ABSC shareholders, regarding relevance of HRC and RC
policy information to ABSC stock purchase decisions. The pilot study was conducted to
develop operational definitions of HRC and RC and of their dimensions, and, to establish
statistical validity and reliability of items for use in the main study.
Confirmatory factor analysis (CFA) was applied to validate policy statement items
within the final questionnaire, to properly measure the five dimensions of HRC and three
dimensions of RC, for measuring perceptions of ABSC shareholders. Perceptions relate to
relevance of HRC and RC policy information to ABSC stock purchase decisions.
Questionnaire items were determined to be reliable and valid and retained for use in the main
study.
The main study is an empirical study investigating perceptions of importance of “mum
and dad” ABSC shareholders of HRC and RC dimensions and the impact of perceptions,
sources of advice, and demographic variables on ABSC stock decisions. The ABSC

v
investigated are those identified in the pilot study. Various statistical tests (One-way
ANOVA, Bonferroni test, T-test, logistic regression, discriminatory analysis) were conducted
on data from the main study questionnaire. The main study also investigates, empirically, the
frequency and quality of HRC and RC disclosure by ABSC, and whether disclosure leads to
appreciation of share price for the relevant ABSC. A focus group was conducted for thematic
content analysis of ABSC corporate annual reports, comparative analysis was conducted on
the output of that content analysis, and a cumulative abnormal return (CAR) analysis was
conducted, based on content analysis results and on share price information for relevant
ABSC in their reporting periods.
The research finds “mum and dad” shareholders of NAB stocks value all HRC and RC
dimensions information more than shareholders of the others of the big four ABSC do. They
believe customer capital and supplier chain relations dimensions to be more important than
shareholders of ANZ stocks believe them to be in ABSC stock purchase decisions. The
research finds “mum and dad” shareholders of solely NAB stock value HRC and RC
information because it is not perceived to be adequately available in the NAB corporate
annual report, and shareholders of multiple ABSC, including the NAB, place less value on
the information. Employee recruitment is found to be important to “mum and dad”
shareholders in their decisions to “buy” rather than to “hold” or “sell” ABSC stocks. “Family
and friends” is found to moderate the relationship between perceptions and use of HRC and
RC dimensions when deciding whether or not to hold ABSC stocks. Finally, HRC and RC
dimensions disclosure is significantly varied between ABSC. The CBA, recognised as
Money Magazine’s “Bank of the year 2008”, has the best quality of HRC and RC disclosure.
This research is significant because it provides stakeholders, within academic and
commercial environments: (1) a list of HRC and RC dimensions and their operational
definitions as influenced by “lay persons” understandings; (2) a tool to measure ABSC
shareholder perceptions (questionnaire); and (3) research focused specifically on gaining
insight into perceptions of “mum and dad” shareholders of ABSC stocks regarding HRC and
RC elements of IC. This research builds previous work and encourages future research to
investigate HRC and RC disclosure practices of other knowledge-intensive corporations, not
just the ABSC.

vi
Table of Contents
Statement of Sources………………………………………………………………….... ii
Acknowledgements…………………………………………………………………...… iii
Abstract………………………………………………………………………………..... iv
Table of Contents……………………………………………………………………..… vi
List of Tables...………………………………………………………………………….. xii
List of Figures ….………………………………………………………………………. xvi
Chapter One: Introduction …………………………………………………................. 1
1.1 Background to the Research………………………………………………........ 1
1.1.1 Understanding market speculation on the future value of a corporation from
a human resource perspective…….................................................................
1
1.1.2 Understanding the functions of HRM from a SHRM perspective…….....…. 2
1.1.3 The global economic downturn and the volatility of the Australian share
market – Understanding the impact on investors…………………………....
5
1.1.4 Human capital information and its impact on share market
speculation……………………………………………………………….….
6
1.1.5 Communicating the value of intangibles in the market value of a
corporation…………………………………………………………………..
9
1.1.6 Intellectual capital and its components of human resource capital and
relational capital – Understanding the concepts……………………………..
12
1.1.7 Australian stock ownership – Shareholders and sources of stock investment
advice………………………………………………………….......................
17
1.2 Need for the Research……………………………………………..…………… 20
1.3 Aims and Research Questions of the Research Study…………………..……... 24
1.4 Significance of the Research Study……………………………………..……... 26
1.5 Thesis Structure………………………………………………………………… 28
Chapter Two: Literature Review...………………………………………..................... 30
2.1 Introduction…………………………………………………………………….. 30
2.2 Literature Review……………………………………………………………… 30
2.2.1 IC and its components of HRC and RC…………………………………….. 30
2.2.2 The importance of the functions of HRM to organizational strategy………. 38
2.2.3 Understanding SHRM – Getting companies to develop the necessary link
between HRM and corporate strategy……………………………………….
41

vii
2.2.4 Recognizing the need for IC management, measurement and reporting…… 46
2.2.5 Reporting in the context of corporate annual reports and the relationship
between IC and the market value of a corporation……………………….….
52
2.2.6 Stakeholders’ perceptions about the disclosure of IC information in the
corporate annual reports……………………………………………………..
61
2.2.7 How to assess the impact of IC information on share prices –
Methodology………………………………………………………………...
70
2.2.8 The reporting of HRC and RC information by Australian corporations….… 74
Chapter Three: Pilot Study………………………………………………...................... 87
3.1 An Initial Exploratory Study………………………………………………….... 87
3.2 Key Constructs and Dimensions - Definitions and Explanations……………… 89
3.2.1 Human resource capital (HRC)…………………………………………………….. 89
3.2.1.1 Innate human capabilities……………………………………………………………... 90
3.2.1.2 Learned abilities……………………………………………………………………….... 90
3.2.1.3 Management and leadership qualities……………………………………………….. 92
3.2.1.4 Employee Values………………………………………………………………………... 94
3.2.1.5 Problem solving capabilities………………………………………………………….. 96
3.2.1.6 Summary of HRC dimensions………………………………………………………..... 97
3.2.2 Relational capital (RC)……………………………………………………………... 98
3.2.2.1 Customer capital…………….………………………………………………….……..... 98
3.2.2.2 Supplier chain relations…………….………………………………………………..... 98
3.2.2.3 Competitors…………………..………………………………………………………..... 99
3.2.2.4 Summary of RC dimensions…………………………………………………….…....... 99
3.2.3 Summary…………….……………………………………………………………... 99
3.3 Pilot Study – Method…………………………………………..…….………… 102
3.3.1 Development of operational definitions of HRC and RC and of their dimensions –
Focus Group A….………………………………………………………………….
103
3.3.1.1 Participants…………………….……………………………………..……………....... 106
3.3.1.2 Procedure...…………………….……………………………………………………...... 106
3.3.1.3 Results and analysis………….……………………………………………………........ 107
3.3.1.4 Discussion…………………….……………………………………..………………....... 110
3.3.1.5 Summary….…………………….……………………………………………................. 112
3.3.2 Pilot Questionnaire – Determination of perceived relevance of HRC and RC

viii
policy information……..….………………………………………………………... 112
3.3.2.1 Participants…………………….……………………………………………………....... 115
3.3.2.2 Procedure...…………………….……………………………………………………...... 117
3.3.2.3 Results and analysis………….…………………………………………….................. 119
3.3.2.4 Discussion…………………….……………………………………………..………....... 134
3.3.2.5 Summary….…………………….……………………………………………………....... 136
3.3.3 Final questionnaire – CFA of items in HRC and RC perception scale……... 136
3.3.3.1 Participants…………………….……………………………………………................. 137
3.3.3.2 Procedure...…………………….……………………………………………………...... 137
3.3.3.3 Validation and reliability testing……….…………………………………………….. 140
3.3.3.4 Results and analysis – Demographic variables….………………………………….. 141
3.3.3.5 Results and analysis – Validation and reliability testing….………………………. 144
3.3.3.6 Discussion…………………….……………………………………..………………....... 148
3.3.3.7 Summary….…………………….……………………………………………………....... 151
3.4 Overview of the Pilot Study…………………………………………...……..… 151
Chapter Four: Main Study Research Method………………………………............... 153
4.1 Research Methods – Supporting the Purpose of the Main Study……………… 153
4.2 Main Study Part One – Importance and use of HRC and RC Dimensions
………………………………………………………………….. ……………...
157
4.2.1 Research questions, hypotheses, and sub-hypotheses………………………. 158
4.2.2 Research sample…………………………………….………………………. 174
4.2.2.1 Demographic profile of the research sample……….……………………………….. 175
4.2.3 Tools…………………………………………………………………………...…… 177
4.2.4 Procedure…………………………………………………………………………… 185
4.2.5 Data analysis...……………………………………………………………………… 186
4.2.5.1 Shareholders of ABSC and their perceptions about HRC and RC
dimensions………………………………………………………………………..
187
4.2.5.2 Differences between perceptions of shareholders of either single or
multiple ABSC……………………………………………………………………
189
4.2.5.3 Shareholder perceptions and the use of HRC and RC dimensions to
purchase ABSC stocks…………………………………………………………..
191
4.2.5.4 Investment transaction decisions of shareholders and the influence of
HRC and RC dimensions……………………………………………………….
193

ix
4.2.5.5 Moderating the relationship between investment transaction decisions of
shareholders and the influence of HRC and RC dimensions………………
195
4.3 Main Study Part Two – Disclosure on HRC and RC Dimensions in Corporate
Annual Reports and the Importance to Share Prices of ABSC…………………
198
4.3.1 Research questions, hypotheses, and sub-hypotheses…………………………..…. 201
4.3.2 Research sample…………………………………….…………………………..…. 207
4.3.3 Tools………………………………………………...…………………………...…. 209
4.3.3.1 HRC and RC dimensions disclosure by CBA, “Bank of the Year 2008”, in
comparison to disclosure by other ABSC…………………………………………….
209
4.3.3.2 HRC and RC dimensions and the share prices of ABSC…………………... 209
4.3.4 Procedure………………………………………...………………….…………….. 210
4.3.4.1 HRC and RC dimensions and the CBA “Bank of the Year 2008” - Comparative
analysis of the corporate annual report information……………………………….
210
4.3.4.2 HRC and RC dimensions and the share prices of ABSC - CAR analysis of share
prices………………………………………………………………………………………
214
4.3.5 Data analysis…..………………………………...………………………………….. 215
4.3.5.1 HRC and RC dimensions and the CBA “Bank of the Year 2008”………... 215
4.3.5.2 HRC and RC dimensions and the share prices of ABSC…………………... 216
4.4 Summary……………………………………………………………………….. 220
Chapter Five: Main Study Results…………...………………………………............... 222
5.1 Aims of Main Study…………………………..……………………………….. 222
5.2 Demographic Results………………………….……………………………….. 223
5.3 Results of Testing Hypotheses………………………………………………..... 223
5.3.1 Part One – Importance and use of HRC and RC dimensions.…………………..…. 224
5.3.1.1 Relationship between shareholders of ABSC and their perceptions about HRC
and RC dimensions.………………………………………………......................…….
224
5.3.1.2 Differences between perceptions of shareholders of either single or multiple
ABSC…………...………………………………………………...……………………….
234
5.3.1.3 Relationship between shareholder perceptions and the use of HRC and RC
dimensions to purchase ABSC stocks…………………………………..……...…….
247
5.3.1.4 Relationship between importance of HRC and RC dimensions and investment
transaction decisions of shareholders……………..…………………………...…….
252
5.3.1.5 Testing for moderators on the relationship between investment transaction

x
decisions of shareholders and the influence of HRC and RC dimensions…..…… 258
5.3.2 Part Two – Disclosure on HRC and RC dimensions in corporate annual reports
and its relationship to share prices of ABSC..………………………………….…...
266
5.3.2.1 Comparing CBA to other ABSC in the provision of HRC and RC dimensions
information in their corporate annual reports….……………………………….…..
266
5.3.2.2 Relationship between HRC and RC dimensions and the share prices of
ABSC…………………………………………………………….….……………….…....
282
5.4 Summary…………………….………………………………………………..... 288
Chapter Six: Discussion and Conclusions………………………………...................... 296
6.1 Discussion……………….…………………………………..………………..... 297
6.1.1 Importance and use of HRC and RC dimensions.…………………………..…….... 301
6.1.1.1 The perceptions of HRC and RC dimensions in investment transactions among
shareholders of either single or multiple ABSC……………………………………..
302
6.1.1.2 The use of HRC and RC dimensions in investment transactions among
shareholders of either single or multiple ABSC……………………………………..
307
6.1.1.3 The impact of sources of advice and demographic variables on the relationship
between shareholder perceptions and stock transaction decisions……………….
314
6.1.2 Disclosure on HRC and RC dimensions and its relationship to corporate
recognition and to share prices of ABSC………………………………………..
318
6.1.2.1 HRC and RC dimensions disclosure by CBA, “Bank of the Year 2008”, in
comparison to disclosure by other ABSC…………………………………………….
320
6.1.2.2 HRC and RC dimensions and the share prices of ABSC………………..………… 324
6.2 Limitations…….…………….………………………………………………..... 330
6.3 Practical Implications……….………………………………………………..... 331
6.4 Recommendations for Future Research..……………………………………..... 334
6.5 Conclusions………………….………………………………………………..... 339
Appendix A - Components of IC ………..………………………………...................... 349
Appendix B - Academic Definitions of HRC and RC and Respondent Feedback
from Focus Group……………………………………………………………………….
351
Appendix C - HREC Approval ...………..………………………………...................... 358
Appendix D - Policy Statement Questionnaire to Determine Relevance..................... 359
Appendix E - Expression of Interest Letter to Participants......................................... 364
Appendix F - Participant Consent Form........................................................................ 366

xi
Appendix G – Final Pilot Questionnaire for Validity and Reliability Tests............... 367
Appendix H – Main Study Questionnaire...................................................................... 370
References......................................................................................................................... 375

xii
List of Tables
Table 3.1 Academic definitions of key construct of HRC and of its dimensions………..… 100
Table 3.2 Academic definitions of key construct of RC and of its dimensions……....……. 101
Table 3.3 Operational definitions of key constructs of HRC and its dimensions as
proposed for this research project.…………….………………………………….….
108
Table 3.4 Operational definitions of key constructs of RC and its dimensions as
proposed for this research project……………..…………………………….……….
109
Table 3.5 Dimensions of HRC and RC…………………………………………………………. 111
Table 3.6 Age-range of respondents for the pilot questionnaire……………..…...….…….. 115
Table 3.7 Education level attained by respondents for the pilot questionnaire…………... 116
Table 3.8 Occupation of respondents to the pilot questionnaire………..……….……….... 116
Table 3.9 Income range of respondents to the pilot questionnaire……………………….... 117
Table 3.10 Example of policy statement items to determine relevance…………………..... 118
Table 3.11 Banking shares held by respondents to the pilot questionnaire……………..... 119
Table 3.12 Employee recruitment policy statement items to determine relevance……….. 122
Table 3.13 Employee retention policy statement items to determine relevance………….. 123
Table 3.14 Development of management and leadership qualities policy statement
items to determine relevance…………..…………………………….………………..
125
Table 3.15 Employee values policy statement items to determine relevance……………... 127
Table 3.16 Developing employee problem solving skills policy statement items to
determine relevance………………………………………..……………..……………
128
Table 3.17 Customer capital policy statement items to determine relevance…………..… 130
Table 3.18 Supplier chain relations policy statement items to determine relevance……. 131
Table 3.19 Competitors’ policy statement items to determine relevance………………….. 133
Table 3.20 Items in the final questionnaire relating to specific dimensions of HRC and
RC………………………………………………………………………….…………..…
139
Table 3.21 Distribution of the demographic data categorized in a dichotomous manner
among gender……...…………………………………………………….……………...
141
Table 3.22 Distribution of the demographic data categorized among age……………..… 142
Table 3.23 Distribution of the demographic data categorized among educational
qualification……………...……………………………………………………………...
142
Table 3.24 Distribution of the current and previous bank shares held by respondents… 143
Table 3.25 Distribution of the current and previous single or multiple bank

xiii
shareholdings held by respondents………………………..……………………...…. 143
Table 3.26 Reliability coefficients of the HRC and RC dimensions…………………..……. 144
Table 3.27 Factor Loadings and Fit indices for CFA of HRC and RC Perception
Scale…………………………………………..………………………………………….
146
Table 4.1 Distribution of demographic data categorized in a dichotomous manner
among gender…………………..……………………………………….………………
175
Table 4.2 Distribution of the demographic data categorized among age……………..….. 176
Table 4.3 Demographic data categorized among educational qualification…………..…. 176
Table 4.4 Items in questionnaire relating to dimensions of HRC and RC……………..…. 184
Table 4.5 Statistical Analysis of Hypothesis 1 to Hypothesis 10……………………......…. 186
Table 4.6 ABSC and their stock codes as per the ASX 200 as at the end of the financial
year 2006/2007…………………………..…………...…………………………….…..
208
Table 5.1 Stock ownership of respondents relating to the eight ABSC……………...…….. 226
Table 5.2 Results for One-way ANOVA testing of differences in perceptions of
importance of HRC dimensions in ABSC stock purchase decision……….....…..
227
Table 5.3 Results for One-way ANOVA testing of differences in perceptions of the
importance of RC dimensions in ABSC stock purchase decision…………..…....
229
Table 5.4 Results of post hoc comparisons (Bonferroni test)……………………………….. 231
Table 5.5 Results for difference in perceptions of HRC in ABSC stock purchase
decisions of CBA shareholders and of shareholders of multiple banks
including CBA………………………………………….………………………………..
235
Table 5.6 Results for difference in perceptions of HRC in ABSC stock purchase
decisions of WBC shareholders and of shareholders of multiple ABSC
including WBC………………………………………………………………………..…
237
Table 5.7 Results for difference in perceptions of HRC in ABSC stock purchase
decisions of NAB shareholders and of shareholders of multiple ABSC
including NAB………………………………………………………………………..….
238
Table 5.8 Results for difference in perceptions of HRC in ABSC stock purchase
decisions of ANZ shareholders and of shareholders of multiple ABSC
including ANZ………….....................................................................................…
240
Table 5.9 Results for difference in perceptions of RC in ABSC stock purchase decisions
of CBA shareholders and of shareholders of multiple ABSC including CBA….
242
Table 5.10 Results for difference in perceptions of RC in ABSC stock purchase

xiv
decisions of WBC shareholders and of shareholders of multiple ABSC
including WBC…………………………………………………………………………..
243
Table 5.11 Results for difference in perceptions of RC in ABSC stock purchase
decisions of NAB shareholders and of shareholders of multiple ABSC
including NAB………………………………………….………………………………..
245
Table 5.12 Results for difference in perceptions of RC in ABSC stock purchase
decisions of ANZ shareholders and of shareholders of multiple ABSC
including ANZ…………….……………………………………………………………..
246
Table 5.13 Use of HRC and RC dimensions in “Buy” decisions for ABSC……………..... 248
Table 5.14 Results of testing the relationship between perception and use of HRC
dimensions in ABSC stock purchase decision….……………………………….…..
249
Table 5.15 Results of testing the relationship between perception and use of RC
dimensions in ABSC stock purchase decisions………………..………………….…
250
Table 5.16 Importance of HRC and RC policy information and share investment
transaction decisions.………………………………………..………….………….….
252
Table 5.17 Results of analysis of variance for testing differences given to HRC in
transaction decisions involving ABSC stocks…………………………….…………
254
Table 5.18 Results of analysis of variance for testing differences given to HRC in
transaction decisions involving ABSC stocks………………………………..…..….
256
Table 5.19 Responses of respondents ranking sources of share investment advice…...… 259
Table 5.20 Results for moderator variables on relationship between perceptions and
use of HRC dimensions information in ABSC stock transactions………….….…
260
Table 5.21 Results for moderator variables on relationship between perceptions and
use of RC dimensions information in ABSC stock transactions ………………….
263
Table 5.22 Summary of the percent of perceived frequency of reporting HRC
dimensions information in the corporate annual reports of the eight ABSC…...
267
Table 5.23 Summary of the percent of perceived frequency of reporting RC dimensions
information in the corporate annual reports of the eight ABSC……………….…
270
Table 5.24 Summary of the ranking of perceived quality of reporting HRC dimensions
information in the corporate annual reports of the eight ABSC…………….….
271
Table 5.25 Summary of perceived ranking of quality of reporting RC dimensions
information in the corporate annual reports of the eight ABSC……...………..…
273
Table 5.26 Banks perceived to have highest and lowest percentage and quality of HRC

xv
and RC dimensions reporting in their 2006/2007 financial year corporate
annual reports……………………………….………………………………..…………
274
Table 5.27 Perceived frequency of HRC dimensions information disclosure in the
financial year 2006/2007 corporate annual reports of ABSC………….…….…..
275
Table 5.28 Perceived quality of HRC information disclosure in the financial year
2006/2007 corporate annual reports………………………………………………….….
277
Table 5.29Perceived frequency of RC dimensions information disclosure in the
financial year 2006/2007 corporate annual reports of ABSC……………………..…
278
Table 5.30 Perceived quality of RC dimensions information disclosure in the financial
year 2006/2007 corporate annual reports…………………………..……………….…
280
Table 5.31 CAR of ABSC stocks for event window +5 to -3 days of release of
2006/2007corporate annual reports…………………………………..…………………
283
Table 5.32 Rank correlation between frequency and quality of reporting HRC
dimensions and CAR………………………………………………………….….…………….…
283
Table 5.33 For ABSC, rank correlation between frequency and quality of reporting
HRC dimensions and CAR and p-value………………………………………………………
286
Table 6.1 The HRC and RC dimensions of IC…………………………………………..…………. 297

xvi
List of Figures Figure 1.1. Intellectual Capital………………………………………………….………………… 17
Figure 3.1. Design of the pilot study…………………………………………….……………… 88
Figure 4.1. Design of the main study………………………………………….………… 156
Figure 4.2. First part of the questionnaire…………………………………….…...………….…. 178
Figure 4.3. The second part of the questionnaire……………………………….…………….…. 181
Figure 4.4. The third part of the questionnaire……………………………………………….….. 183
Figure 4.5. Variables for Hypothesis 1………………………………………………….. 188
Figure 4.6. Variables for Hypothesis 2………………………………………………….. 188
Figure 4.7. Variables for Hypothesis 3………………………………………………….. 190
Figure 4.8. Variables for Hypothesis 4………………………………………………….. 190
Figure 4.9. Variables for Hypothesis 5…………………………………………………. 191
Figure 4.10. Variables for Hypothesis 6………………………………………………… 192
Figure 4.11. Variables for Hypothesis 7………………………………………………… 194
Figure 4.12. Variables for Hypothesis 8………………………………………………… 194
Figure 4.13. Variables for Hypothesis 9………………………………………………… 197
Figure 4.14. Variables for Hypothesis 10……………………………………………….. 197
Figure 4.15. Design of part two of the main study……………………………………… 201
Figure 4.16. Variables for Hypothesis 11……………………………………………….. 215
Figure 4.17. Variables for Hypothesis 12……………………………………………….. 216
Figure 4.18. Share prices for banks listed on the ASX 200, as at end financial year
2006/2007, for disclosure periods of +5 to -3 days (relating to release of
annual reports)……………………………………………………………...…...
217
Figure 4.19. Variables for Hypothesis 13……………………………………………….. 218
Figure 4.20. Variables for Hypothesis 14……………………………………………….. 218
Figure 4.21. Process to determine cumulative return (stock) and cumulative return
(banking sector stock on ASX 200 as at 30 June 2007)…………………...……
219
Figure 4.22. Process to determine CAR of each bank stock………………….…………. 219
Figure 5.1. Comparison of ABSC based on frequency of disclosure on HRC
dimensions in corporate annual report 2006/2007………………...…………....
276
Figure 5.2. Comparison of ABSC based on quality of information disclosure on HRC
dimensions in corporate annual report 2006/2007………………………….......
278
Figure 5.3. Comparison of ABSC based on frequency of reporting information about
xvii
RC dimensions in corporate annual report 2006/2007…………………….…… 279
Figure 5.4. Comparison of ABSC based on quality of RC information disclosure in
corporate annual report 2006/2007………………….………………………….
281
Figure 5.5. Scatter plot demonstrating the relationship between rank based on
frequency of reporting HRC dimensions and rank based on CAR……………....
284
Figure 5.6. Scatter plot demonstrating the relationship between rank based on quality
of reporting HRC dimensions and rank based on CAR………………………...
285
Figure 5.7. Scatter plot demonstrating the relationship between rank based on
frequency of reporting RC dimensions and rank based on CAR comparison.....
287
Figure 5.8. Scatter plot demonstrating the relationship between rank based on quality
of reporting RC dimensions and rank based on CAR………………………….….
288
Figure 6.1. Relationship between hypotheses, research aims, and research focus………. 300

1
Chapter One
Introduction
1.1 Background to the Research
1.1.1 Understanding market speculation on the future value of a
corporation from a human resource perspective.
Corporations calculate and project their future value from the difference between
their market value and what their current financial performance would deserve (Ballow,
Burgman, & Molnar, 2004). By bidding on stocks in the market, shareholders make that
judgment. That is one of the reasons why share prices are so volatile. Investors speculate
on the future worth of a company. However, the provision of information on corporate
Human Resource (HR) policies may help to reduce investor speculation and share price
volatility.
In line with this, Desai (2000) researched whether strategic planning was rewarded
by the stock market. An event-study methodology was used to examine the market
values of companies during the time period when information was provided about the
companies’ strategic planning focus, function and/or orientation. Desai found that
announcements highlighting the institutionalized strategic planning by companies were
related to increases in the corporate stock prices. Additionally, he determined that the
market reacted efficiently to such announcements and the reward was instantaneous.
Strategic management itself is concerned with the performance of the entire
corporation; it is concerned with long term corporate objectives and it delivers planning
and policies to achieve such objectives. Institutionalizing a strategic plan for the
management of a company’s human resources provides the support for the company’s

2
overall competitive strategy. That is the role of Strategic Human Resource Management
(SHRM). Kaye (1999) defines SHRM as a system-wide intervention that ties human
resource management (HRM) to strategic planning and cultural change. The main focus
of SHRM is the integration of a combination of HRM practices to facilitate corporate
competitive advantage (Huselid, Jackson, & Schuler, 1997). In an attempt to achieve
sustained competitive advantage, a company must develop and use key organizational
competencies which are facilitated and enhanced by a range of HRM activities, functions
and processes (Lado & Wilson, 1994). That is why managing human resource capital
(HRC) and relational capital (RC) is increasing viewed as a strategic HRM function of
the organization, and also regarded as part of and facilitating corporate strategy (Huselid
et al., 1997).
1.1.2 Understanding the functions of HRM from a SHRM perspective.
The strategic management of corporations has to do with policy decisions
concerning the whole organization, with the general objective being to position the
organization to transact successfully within its environment; it is regarded as an important
part of realizing and maintaining effective performance in a dynamic environment
(Gunnigle & Moore, 1994). However, research has found that, strategically, corporate
competitiveness is best developed around the competencies and behaviour of people
within firms, the firm’s human resources (Luoma, 2000) or, more specifically, its
combination of HRC and RC. While HRC is the collective attitudes, skills and abilities
of employees contributing to organizational performance and productivity (Stockley,
2005), and RC includes productive contacts needed to acquire inputs and to sell outputs
(Bezemer, Dulleck, & Frijters, 2003), both are supported by a number of functional

3
attributes. The functional attributes of human resources are those functions that facilitate
acquired abilities and the personal attributes of employees and those linked to developing
and maintaining appropriate employee values, problem solving competencies and
management and leadership effectiveness (Bollen, Vergauwen, & Schnieders, 2005). It
has been argued that the effective management of HRC has the potential to add
significant economic value to a firm as excellence in HRM practices significantly
increases the potential for organizational success (Verreault & Hyland, 2005). Yet, for
HRC and RC to do this, the HRM functions, practices and policies must be developed
and aligned with the strategic objectives of the firm (Hyland, 2005; Lado & Wilson,
1994, Luoma, 2000; Verreault & Horwitz, 1999; Wei, 2006). In facilitating the strategic
goals of the firm, HRM goes from being regarded as a fairly separate and technically
specific aspect of firm performance to one that is regarded as a potent value-driver
existing within a firm and steering the achievement of corporate success. This is,
effectively, a shift in focus from the operational view to the strategic view (Wei, 2006).
As research has established that company performance is directly related to the set
of HRM practices a company has in place (Huselid et al., 1997), organizations move from
HRM to SHRM. An example of a company that successfully implemented an SHRM
framework to improve firm performance is Sears (Kirn, Rucci, Huselid, & Becker, 1999).
In 1992, Sears was losing $US 3.4 billion a year and acted to cut costs, cut jobs, divest of
assets and restructure its organization (Kirn et al., 1999). Further, the company embarked
on a campaign to focus on a target customer and undertook a complementary marketing
campaign that highlighted the “softer side” of Sears (Kirn et al., 1999). The company
required “best-practice” management of human resources to develop and communicate

4
the company mission, vision, and goals. It was able to create a conceptualized model of
firm performance that linked employees, customers and shareholders in a causal chain.
Referred to as the “Three Cs”, it initiated of a variety of high impact HR policies that
created a Compelling place to work, a Compelling place to shop, and a Compelling place
to invest (Kirn, 1999). The HR policies were designed to encourage employee
behaviours conducive to the corporate competitive strategy. Policies relating to
employee education, performance management and reward systems, employee selection
and retention and the delivery of basic HR were used to reenergize the company. The
“Three Cs” concept was communicated, accepted and developed to impact favourably on
the culture of the company. Corporate SHRM, which is aligned to and enabling
competitive strategy, has been credited, to some extent, for the subsequent four-year
recovery in the results of the company (Kirn et al., 1999).
Both traditional HRM and SHRM are concerned with being able to attract and
maintain, through development and retention, the HRC and RC of a firm (Lado &
Wilson, 1994). However, it is SHRM that results in the employment of HRC and RC
practices and the design of a human resource system that has the proper “fit”, and is
compatible with the firm strategy (Wei, 2006). As noted, Sears was successful in
demonstrating the link between a commitment to a SHRM system, comprised of a
combination of HRM policies that had a proper “fit” for the company, and an
improvement in the company’s performance. It is even more critical in times of economic
crisis and market volatility, for corporations such as Sears, to design tailor-made work
practices to their unique corporate strategies. In tough economic times, they become
5
better placed than their competitors to realize improvements in their performance and in
their future financial value (Kaye, 1999).
1.1.3 The global economic downturn and the volatility of the Australian share
market – Understanding the impact on investors.
Heralded by the onset of the global financial crisis, the Australian share market
experienced marked levels of volatility during 2008 and 2009. The Australian Stock
Exchange (ASX) 200 is Australia’s leading large capitalization index, comprised of the
top 200 Australian stocks based on market capitalization (ASX, 2005). In 2008, the ASX
200 declined by nearly 40 percent, the largest decline on record, especially for financial
sector stocks that experienced falls of nearly 50 percent (RBA, 2009). In February 2009,
the Reserve Bank of Australia (RBA) reported that average daily share price movements
were nearly 1½ percent, down from nearly three percent in October 2008 (RBA, 2009).
The RBA reported that the Australian share market was nearly 50 percent below its
November 2007 peak and at the same level as in May 2004 (RBA, 2009). The RBA also
reported that financial stocks had declined by nearly four percent, weighed down by the
even bigger falls in the share prices of many overseas banks (RBA, 2009). Resource
stocks rose by 22 percent from mid-November 2008 and the share prices of other
companies in the index were broadly unchanged in the first part of 2009 (RBA, 2009).
Based on historical evidence, the RBA made the assertion that it may take between three
and six years for the Australian share market to recoup its losses (RBA, 2009), and, at
any time within that time frame, there exists the potential for individual investors to make
money or to incur losses based on their investment decisions.

6
Many investors have experienced a dramatic decrease in the value of their share
portfolios and in their superannuation investments (RBA, 2009). Billions of dollars have
been wiped off share markets, globally, and for individual investors, especially, it is
increasingly difficult to assess share value. Both in times of certainty and in times of
extreme volatility, individual shareholders will use an array of information in deciding
what shares to buy, when to buy them, at what price, and for the duration of time they
should be held before selling them. With increased market volatility, globally, and the
decline of investor confidence, the challenge to all investors is to correctly assess the
value of a particular share, invest appropriately for sufficient returns on capital. Investors
may consider information about company earnings, company assets or the potential, they
believe, the company has for earnings and growth, when they make investment choices.
How the perceptions of shareholders influence their investment making decisions is a
matter of great importance in this research, as it is to the corporations that appeal to
investors for investment capital. This is especially true in times when the financial
liquidity of many companies is adversely impacted by the global credit crunch.
1.1.4 Human capital information and its impact on share market speculation.
Corporate reporting by Australia’s public companies not only serves to disclose
information about the financial state of their companies to their stakeholders, but it also
serves to provide information on the range and combination of strategies and resources
companies have to leverage their competitive position, facilitating the necessary growth
for their future. From a SHRM perspective, reporting on the human capital policies
needed to facilitate corporate strategy and effectiveness may be one way for a company
to attract greater investment dollars. However, both institutional investors and individual

7
“mum and dad” investors face challenges in deciding how much they should pay for
shares based on the information made available to the shareholders by the companies.
Shareholder perceptions about the information provided to them, along with their need to
act quickly, leaves investors open to the potential of making uneducated and speculative
investment decisions. This may be especially true for the purchase of shares in
companies that rely heavily on intangible assets and knowledge management to create a
winning combination, and in times of increased market volatility and low investor
confidence. Investors are currently facing these challenges both globally and within
Australia.
For corporate shareholders, it is both important and difficult to assess accurately
and to understand the true value of a corporation. This contributes to the criticality of
decision-making by far-less-equipped individual investors to have access to information
about the assets of a company to help them assess and understand the true value of a
corporation. Companies have a range of both tangible and intangible assets on which to
report. Not reporting on intangible assets may have the effect of making those companies
rich in intangible assets appear less valuable than they really are (Guthrie & Petty, 1999;
Guthrie, Petty, & Ricceri, 2006). Today’s organizations must pay greater attention to
intangible assets and, in doing so, must use new management reporting instruments that
correctly identify and report on the value that intangible assets add to an organization
(Daum, 2002). Although tangible assets are regarded as a result of past performance,
intangible assets are regarded as indicators of the organization’s future performance
(Chen, Cheng, & Hwang, 2005; Royal & O’Donnell, 2008). These assets combine to
make the company profitable or to give the company the potential for profit in the future.

8
The tangible assets of an organization include the physical assets traditionally reported on
in financial statements and annual reports. These tangible assets are material and
incorporate premises and capital investments, including investments in plant and
equipment. It is the corporation’s “Statement of Financial Position”, published in the
annual report that represents the value of tangible assets. However, it is harder to
quantify the value of intangible assets, including goodwill, knowledge, and human capital
(Flamholtz, Bullen, & Hua, 2002). This is because the intangible assets of a corporation
are tacit rather than concrete; they include assets that are difficult to measure. Yet,
corporations are required to measure these assets effectively to identify the true value of
the organization and to communicate its value to both current and potential investors
(Deloitte & Touche, 2002). This requirement is, in part, due to the less apparent
existence to various stakeholders of a company. The intangible assets of knowledge and
systems, supported by the benefits to be gained through effective human capital
management, provide a level of power to corporations in knowledge-based industries
(Brookings Institution, 2004). Also, the value of intangible assets, including HRC and
RC are difficult to measure and report, yet are necessary in leveraging tangible assets in
the value creation process (Lev, 2001).
A balance sheet is a financial report that set out in dollar terms the value of an
organization’s assets, liabilities and shareholder’s/owner’s equity as at a specific point in
time. Corporations provide this information in their annual reports as part of their
corporate reporting requirements. Daum (2002) states that while intangible assets may
not appear on the balance sheets, they are considered by potential investors when they are
evaluating a company. In making this assertion, Daum refers to the proportion of the
9
company’s book value compared with the total market value which has changed from 60
percent in the early 1980s to 20 percent at the end of the 20th
century. Daum
convincingly argues the fact that neither the tangible assets nor the intangible assets work
effectively on their own. The reliance of organizations on the interplay between tangible
assets and intangible assets is apparent throughout the literature in the area of corporate
reporting. Each underpins the other in the value creation of the organization. As
researchers highlight the need for information disclosure on intellectual capital, there is a
strong argument for using supplementary information to the annual financial reports.
Further to this, Daum refers specifically to stakeholder relationship management,
referring to it as a daily task for top management that must be integrated throughout the
internal management process. In identifying the need for illustrated annual reports and
continuous reporting to engage the corporate stakeholders, Daum recognizes the efforts
of Skandia Group, with their Human Capital Accounts, in the disclosure of the
supplementary information required to stakeholders in the decision-making process.
Daum’s contentions are further supported by research identifying that various
stakeholders want companies to be more transparent about their IC information and to
disclose the information in their corporate annual reports (Alwert, Bornemann, & Will,
2009; Royal & O’Donnell, 2004, 2008; Petty, Ricceri, & Guthrie, 2008).
1.1.5 Communicating the value of intangibles in the market value of a
corporation
It has been argued that in the assessment of an organization’s value drivers,
accountants and CFOs need to communicate more effectively, to the stakeholders, the
hidden or intangible value drivers that are considered in investment decisions (Daum,

10
2001; Lev, 2001). Knowledge-based industries and large corporations, including Deloitte
and Touche, recognize the value of intangible assets to corporate strategy. They assert
that human capital practices help grow profits and corporate value.
“The bottom line is, those companies that tailor their human capital strategy to
their unique business strategy and market orientation substantially outperform
companies that do not," and "human resources professionals need to become more
strategic when adopting human capital practices and think more in terms of how
they link to the critical employee behaviours that drive value and profits in their
business.” (Deloitte & Touche, 2002, p. 1)
Knowledge-based industries include organizations involved in “information
technology”, “life sciences and health care” and those in “media and entertainment”
(RBC Royal Bank, 2004). The knowledge that exists in any organization is referred to as
its intellectual capital, and is the sum of its human and structural capital (Edvinsson &
Malone, 1997). While financial disclosure laws cannot ensure individual investors have
access to more than the financial information from listed companies, it is fairly difficult
for investors to access information about the companies’ intangibles, including their
intellectual capital. Yet, it is an organization’s overall intellectual capital that gives it its
competitive advantage, as intellectual capital, linked to the management of knowledge
within an organization, advances an organization’s capacity to obtain, share and employ
knowledge in a manner that improves its survival and success (Edvinsson & Malone,
1997). The critical questions are “What information do individual shareholders use when
they make investment decisions?” and “Does this information communicate the value of
intangible assets, including human resource capital and relational capital, especially

11
within the knowledge-based industries that are reliant on intangible assets?” Rightfully,
the resultant questions and hypotheses, that this research proposes to test and seeks to
answer, shed light on the perceptions and actions of individual shareholders.
A company’s market value, its book value, comprised of its tangible assets and
working capital, and its future value, is upon which prospective investors speculate and
that speculation is facilitated by reported intangible assets. Organizations with a high
degree of intangible assets are also those that are more often speculated on and, as a
result, often have highly volatile share prices. To control the speculation and resultant
volatility of share prices, information on intangibles is provided by a number of
corporations. In Europe, Skandia Group and its Intellectual Capital Accounts, has
become the benchmark example for corporations such as Allianz (Rimmel, 2003). There
is, however, a risk in over-disclosure in this area that may increase volatility and perhaps
compromise the competitive edge of a corporation. This is where risk management is
important in the game play of any corporation. It is vital to ensure that disclosure on
intangibles is on the value-creating activities of a corporation and that the process of
reporting must be holistic, comparable, and supportive of value-creation for all corporate
stakeholders. It is crucial for management to understand how the capabilities of a
corporation can be used to leverage its intangible resources. It is also important to
understand how best to communicate such information to its corporate stakeholders in an
effort to influence their perceptions of the company in a clear, precise, and positive
manner, alleviating the potential anxiety of investors relying on little to no information,
or even worse yet, on unjustified rumours or suppositions.

12
1.1.6 Intellectual capital and its components of human resource capital and
relational capital – Understanding the concepts.
Intellectual capital (IC) refers to the knowledge that exists in any organization
(Edvinsson & Malone, 1997). It is an intangible asset (Lev, 2001), you cannot grab it or
lock it up, and it is extremely difficult to measure, yet its contribution to the success of a
corporation cannot be denied. Not only is IC equal to knowledge, it is also about how to
allow the knowledge of an organization work for it and have it create value (Chaminade
& Roberts, 2003; Johanson, 2005). It is made up of both human resource capital (HRC)
and structural capital and within structural capital is a company’s relational or process
capital (RC) (Bontis, 1998; Chen et al., 2005; Edvinsson & Malone, 1997). A
corporation’s IC, especially the capital relating to its human resources, cannot be copied.
It is a company’s thumb print, influenced by the stresses of its work, both unique to the
company and dynamic in its evolution with time. Corporations will work tirelessly to
ensure that they use the components of their unique IC to leverage their corporate
productivity and growth.
The relationship between IC and the market value of a corporation has been
investigated to various extents by researchers throughout the world (Abdolmohammadi,
2005; Bukh, 2002; Chen et al., 2005; Daum, 2002; Deloitte & Touche, 2002; Guthrie &
Petty, 2000; Lev, 2001; Rimmel, 2003; Royal & O’Donnell, 2004; Sveiby, 1998). Bontis
and Fitz-enz (2002) have been successful in identifying a positive relationship between
IC and firm performance and Bollen, Vergauwen, and Schnieders (2005) have included
intellectual property in models linking IC to firm performance, enhancing the validity of
the model and its relevance for strategic management. Value is created when the various

13
human resources, structural and relational components of IC have the correct degree of
connectivity to complement each other, productivity in one resulting from an investment
in another (Johanson, 2005). Deloitte and Touche (2003) also concluded that there are
specific human capital practices that commonly propel the market value of companies.
They assert that such practices relate to the management of talent, to the rewarding of
performance and to communication. They further contend that there are also other
practices that give companies with specific market orientations a competitive edge. They
stressed that “for top quartile companies, effective human capital practices led to 66
percent higher returns and a 300 percent greater return to shareholders over the five-year
period studied.” (Deloitte & Touche, 2003, p.1)
The human resources of any organization are its people. It is the people who
provide companies with their skills and talents, their abilities to create and maintain
stakeholder and customer relationships and their potential for developing ideas and
innovative practices. Investing in people is investing in a company’s future, in its
potential for growth. The concept of HRC is a consequence of identifying people as
valuable assets to their organizations. Yet, traditionally, human resources are regarded,
by a company, as an expense rather than an investment (Becker, 2005). In
acknowledgement of the significant contribution of people to organizations, the idea has
evolved to the consideration of HRC, an investment rather than an expense. For example,
in the late 1960s and early 1970s, the Nobel Prize-winning economic theorists, Schultz
and Becker, employed the term “human capital” (Becker, 2005). Becker contends that
economists consider spending money on education, training, medical care, and so on as
investments in human capital. They are referred to as human capital because people

14
cannot be separated from their knowledge, skills, health, or values in the same way as
they can be separated from their financial and tangible assets. Human capital consists of
human sources of values including “knowledge, skills, and practices” and activities
including “employee training, recruitment, staff turnover and diversity” (Manville, 2002).
It also includes creating a workplace culture that considers the importance of training and
development initiatives, compensation benefits, recognition programs, and other HR
programs (Gary, 2003). Human capital theorists agree that human capital is linked to the
competence of a firm’s employees, which includes their knowledge, skills, experiences
and abilities (Johanson, 2005). Expenditure in the training, development, health and
support of staff is regarded as an investment, not just as an expense to an organization
(Stockley, 2005).
Consistent with this concept of human capital, the term “human capital” has been
further explicated as “the collective attitudes, skills and abilities of people contributing to
organizational performance and productivity” (Stockley, 2005). Stockley’s definition
also identifies people within the organization as assets, integrally involved in the
development of the organization in much the same way as tangible assets and money do.
Within an organization, its human resources are simply its people, those who represent
the human capital. Therefore, human capital is HRC.
Many believe that HRC is the most important part of a firm’s intangible resources,
the generative and central element of IC (Johanson, 2005). It is deemed to be the single
most important determinant of organizational success, as the market-to-book value ratios
of listed organizations change (Lev, 2001). Recently, 60 to 70 percent of the wealth of
listed companies has been attributed to HRC (Gary, 2003). Prior to 2005, it was also
15
suggested that the market-to-book value ratios of US Standard and Poor’s (S&P) 500
corporations grew from slightly above one to over five, inferring that approximately 80
percent of corporate market value is not reflected in financial reporting (Chen et al.,
2005). There is a widening discrepancy between the reported book values of
organizations and the value that investors put on organizations. It becomes evident that
investors are looking at more than just the financial indicators when they are making
investment decisions.
As for the dimensions of HRC, they may be those which are unique to individuals
or those which are generic (Johanson, 2005). Johanson asserts that HRC dimensions
include innovation, capacity, creativity, know-how and previous experience, teamwork
capacity, employee flexibility, tolerance for ambiguity, motivation, satisfaction, learning
capacity, loyalty and formal training and education. Sveiby (1997), as included in his
Intangible Asset Monitor, suggests that the components of HRC are knowledge, skills,
innovativeness, talent, values, culture, philosophy and ability. Bontis (1998) asserts that
HRC dimensions include intelligence, skills, expertise, learning capability, changing
capability, innovativeness and creativity. The dimensions of HRC are, as a result highly
people-oriented and inherently unique in value to each organization.
With regard to the structural capital of an organization, fundamentally, structural
capital is “the supportive infrastructure of human resource capital”. It is the knowledge
secured and preserved in an organization’s systems and structures, it is the residual
knowledge after all the human capital has gone home (Edvinsson & Malone, 1997). In
the measurement of structural capital, dimensions such as the quality and scope of
information technology systems, corporate images, proprietary databases, organizational

16
concepts and documentation are assessed. Structural capital also takes account of
intellectual properties such as patents, trademarks and copyrights. Finally, it includes
customer capital, organizational capital, process or RC and innovation capital.
Stakeholder relationships are incorporated within this construct.
To understand RC is to recognize that it is part of the social capital of a corporation.
Social capital theory assumes a direct relationship between the investment in social
relations and the expected returns on that investment (Lin, Cook, & Burt, 2001). Social
capital, and therefore RC, includes the norms and networks that enable people to act
collectively; it is the aggregate of the real or potential resources, related to the possession
of a durable network of more or less institutionalized relationships of mutual
acquaintance and recognition (Bordieu, 1986). RC itself is made up of contacts between
economic mechanisms needed to acquire inputs and to sell outputs; a directly productive
aspect of social capital (Bezemer et al., 2003). RC refers to the productive contacts that
individuals use in achieving sold output. In some essential features, RC will not differ
from other forms of capital, such as money and machinery (Robison, Schmid, & Siles,
2002). Put simply, if we can borrow from a commonly used phrase, “it’s not what you
know but rather who you know”, RC is the “who you know” while HRC is the “what you
know”. These contacts form the individual aspect of social capital that is directly
productive (Woolcock & Narayan, 2000).
As for the dimensions of RC, Bollen, Vergauwen, and Schnieders (2005) assert that
these include items related to customer capital such as knowledge of marketing channel,
knowledge of customer relationships, customer orientation (accessibility of customer
feedback), customer orientation (image of the company), customers (amount of

17
customers), customers (strong relationships) and customers (satisfaction of products and
services); items related to supplier relations such as employees knowledge of customer
relations and number of customers; items related to competitors such as relationships
with other organizations and competitor orientation; general aspects to be accounted for
when engaging in relationships such as long term focus related to customer and supplier
relations and profit objective related to customer and supplier relations. Within the
company’s IC thumb print (refer Figure 1.1), HRC lies at the centre while RC lies around
it, supporting it and facilitating its use.
Figure 1.1. Intellectual Capital
1.1.7 Australian stock ownership – Shareholders and sources of stock
investment advice.
Both institutional investors and “mum and dad” investors buy and sell shares in
stocks in the Australian share market. Institutional investors are those entities that have

18
large amounts of money to invest with
(http://www.investorwords.com/2504/institutional_investor.html, retrieved 19, May,
2009). They include investment banks, managed funds, pension funds, investment
companies, etc. These investors specialize in investing, and are therefore more
knowledgeable and equipped, representing the majority of trading volume every day.
“Mum and dad” shareholders include small business owners and middle class
investors, usually married, who seek to build their wealth through share ownership
(Keane, 2008). Among them are the many individual investors who acquired shares
through some of Australia’s major company floats, demutualizations, and privatitizations
of the 1990s (Roth, 2008). These shareholders are usually quite conservative in their
investment decisions, opting for investments in household names (Naidu, 2008).
Commonwealth Securities even came up with an index based on these investors, calling it
the “Mum and Dad Index” (Naidu, 2008). Currently included in the index are nine
companies, including AIG, the Commonwealth Bank (CBA), and Telstra (TLS).
“Mum and dad” investors like to invest in what they know (Naidu, 2008), that is
why a company such as Telstra can boast about having 1.6 million “mum and dad”
shareholders (Koutsoukis, 2007). Before the global economic crisis, and on the heels of a
share ownership explosion in the 1990s (Roth, 2008), Australia had the greatest
proportion of exposure to direct shares in the Western world (Keane, 2008). This helps
us to appreciate why the current share market volatility has especially hurt “mum and
dad” shareholders (Roth, 2008). “Mum and dad” shareholders cannot be blamed for
becoming increasingly cautious, lacking investor confidence to take up strategies of
“dollar-cost averaging” and “share diversification” to benefit their portfolios.

19
Understanding the importance they place on considering human resource policy
information in their share investment decisions has not been studied to any extent. Their
perceptions have been largely ignored because they are not well known. While other
researchers have studied the perceptions and needs of institutional investors and advisors,
“mum and dad” investors have been disregarded. Also, disclosure on IC may be an
effective way to prompt renewed investment demand from “mum and dad” shareholders
and an increase in share price and the resultant market value of a company. Knowledge-
based corporations especially, may do more to close the gap between the demand and the
supply of HR policy information, information regarded as supplementary to the financial
reports. This is one of the reasons why research in this area is so vital.
Australian shareholders themselves are more active, sophisticated and
knowledgeable than they were in the past and there exists a prevalence of overseas shares
ownership by Australian investors and an increase in the average number of shares held
(ASX, 2007). Recently, there has been a marked improvement in shareholder knowledge
and in the overall attitudes to investment as the ASX Share Ownership Study (2007)
revealed that typical direct shareholders are just as likely to be male as female, aged at
least 35, with tertiary qualifications, making at least $100 000, from any area (less so
from Queensland) and from capital cities. There was however, a drop in share ownership
which was attributed to several factors including departure of passive investors, a need to
repay debt, disappointment with shares or funds, disinterest and ignorance (among other
reasons). For Australian investors, the primary reason cited for holding shares is to
accumulate wealth (ASX, 2007).

20
The ASX Share Ownership Study (2007) has also identified 11 sources of
investment advice the individual investors have access to. These include newspapers,
friends/family, financial planner or advisor, stock broker, internet, investment
newsletters, accountant, work colleague, magazines, radio and some other source of
advice. For the purpose of this research study, the sources of advice can be segmented
into 3 groups, “media”, “friends, family and work colleagues” and “professional
investment advisors”. “Media” includes newspapers, internet, magazines, radio and other
sources such as TV. “Friends, family and work colleagues” includes just that,
friends/family and work colleagues. “Professional investment advisors” includes the
categories of financial planner or advisor, stock broker, investment newsletters and
accountant.
1.2 Need for the Research
Traditionally, rational economic theorists argue the theory of Efficient Market
Hypothesis (EMH) which suggests that shares of listed stocks are traded on their fair
values on stock markets and that it is impossible to purchase undervalued shares or to sell
shares for more than what they are worth (Malkiel, 2003; Van Bergen, 2004). In making
bigger returns on investment, EMH attributes no value to the effect of shareholder
expectations derived from information that is only available to some stakeholders. The
theory also assumes investors think and act rationally in their stock investment decisions
and assumes corporate information is available to users, equally. This current research
study, however, is driven by previous research such as that conducted by Lev (2001) that
contends that information asymmetry produces uncharacteristic gains to informed
investors and chips away at investor confidence in the integrity of capital markets. The

21
volatility caused in markets through widening bid-ask spreads of securities, inflated
transaction costs to investors, and an increase in the cost of capital is attributed to the
resultant deterioration in investor confidence (Lev, 2001).
Contrary to EMH and rational economic theories, behavioural economic theories
and the field of behavioural finance infer that investors are not always rational in their
stock transaction decisions (Daniel, Hirshleifer, & Subrahmanyam, 1998, 2004).
Behavioural finance is used to explain market bubbles and market crashes and infers that
market reactions may be attributed to several cognitive biases including limited investor
self-attribution, overconfidence, overoptimism, herding, and noise trading, to name a few
(Daniel, Hirshleifer, & Subrahmanyam, 1998, 2004). Daniel, Hirshleifer, and
Subrahmanyam (1998, 2004) contend that the turbulence and volatility of stock markets
may be better understood when the various cognitive biases are considered. They
propose a theory that infers stock investors overreact to private information and under-
react to public information signals due to their biased self-attribution and over-
confidence. They contend that behavioural economics is a complement to rational
economic theories by providing insight into instances of irrational consumer decision-
making and behaviour. In part, this current research study will refer to both EMH and
behavioural economic theory in an attempt to understand the findings in relation to the
perceptions and actions of “mum and dad” shareholders regarding HRC and RC
dimensions information and its impact on their ABSC stock transaction decisions and on
the ABSC share prices.
The need for this research is most certainly driven by the idea of the principle of
HC representing a lead indicator of future financial performance, and the notion that HC
22
analysis is quite necessary in knowledge-based industries which include banking sector
industries (Chen, Cheng, & Hwang, 2005; Royal & O’Donnell, 2008). It is driven by
underlying theoretical principles about tacit assets that suggest that a lack of reporting on
intangible assets may make intangible-rich companies appear less valuable than they
really are (Guthrie & Petty, 1999; Guthrie, Petty, & Ricceri, 2006). It is also driven by
research that has established that company performance is directly related to corporate
SHRM practices (Huselid et al., 1997) and is driven by research that identifies that
stakeholders prefer companies to provide greater transparency regarding IC information
disclosure in their annual reports (Alwert, Bornemann, & Will, 2009; Royal &
O’Donnell, 2004, 2008; Petty, Ricceri, & Guthrie, 2008).
By this stage, it is fairly easy to recognize that even at the best of times, individual
shareholders such as “mum and dad” investors have been disadvantaged by the IC
information disparity which is characteristic of the global equity markets. That is, while
professional investors, analysts and brokers may have more timely access to essential
corporate information, much of the information an individual investor can access is either
in the annual reports of companies or delivered to them through the media and word of
mouth. Simply by asking around, one gets the sense that individual investors are
nervous, they lack the confidence to effectively profit from the equity markets and they
are ever more sceptical about the ability of companies to provide sufficient returns on
their investments. It seems that investors require access to a range of information that is
not provided by many companies. While companies are required by law to comply with
disclosure rules on their financial positions, there is much more they don’t say about their
organizations, information that investors may need to know. The challenge is to

23
understand the information needs of investors and to meet those information needs in a
timely and efficient manner. Give the investors adequate information and they may be
more likely to invest in a company. Greater corporate transparency may induce improved
market performance for those willing to voluntarily disclose information concerning
much more than just the financial data. Understanding the perceptions “mum and dad”
shareholders have about the importance of HRC and RC information in their stock
purchase decisions is necessary before one can argue for the information to be provided
in the corporations’ annual reports.
The focus of this research study is on the perceptions of individual “mum and dad"
shareholders of the importance of HRC and RC information in making decisions relating
to investing equity into companies within the knowledge-based banking industry. “Mum
and dad” shareholders are important to the Australian banking sector; they commonly
have shares in Australian banking sector corporations (ABSC). This is because the banks
are household names and represent a fairly conservative investment for this shareholder
group. This research seeks to provide insight into the perceptions and the actions of
individual shareholders within the Australian environment. Initially, this research study
proposes to provide clear, operational definitions for the constructs related to IC and its
components of HRC and RC. Then, quite specifically, this study seeks to provide an
assessment of the perceived importance of HRC and RC information disclosure by
corporations within Australia’s banking sector and the impact of those perceptions on the
purchase of shares within that sector. If this research study is successful in demonstrating
a positive relationship between shareholder perceptions and stock purchase decisions, the
ABSC may have the motivation to voluntarily report on HRC and RC within their annual

24
reports. Additionally, the research proposes to provide information on the type of HRC
and RC information investors regard to be more or less important in their investment
decision-making process. This may prompt companies to provide the specific type of
information conducive to investor share purchase. It is with enthusiasm that this research
is proposed as the findings may prove to be a powerful tool with which Australia’s
banking sector firms may develop their communication strategies to better improve their
overall status with the bulk of “mum and dad” investors.
1.3 Aims and Research Questions of the Research Study
One of the aims of this study is to investigate the perceptions of individual investors
about information concerning the IC components of HRC and RC. Another aim of this
research study is to provide an assessment of the relationship between the disclosure of
HRC and RC and its impact on share value, as share market volatility and share price
fluctuation are issues that impact all investors. The study also aims to determine if HRC
and RC information is provided to investors and to determine if they perceive HRC and
RC information to be important in their investment decision- making. A further aim of
this research study is to understand the sources of share investment advice individual
investors turn to in their investment decision-making.
The proposed study investigates seven research questions to study the aims of the
study. These research questions include the following:
What are the differences in the perceptions of individual shareholders of the
importance of HRC and RC dimensions between ownership of stocks in the
different ABSC?

25
What are the differences in the perceptions of individual shareholders of the
importance of HRC and RC dimensions between ownership of stocks in
only a single Australian bank and ownership of stocks in multiple ABSC?
Do individual shareholders’ perceptions of the importance of HRC and RC
dimensions relate to their decisions to purchase ABSC stocks?
Do individual shareholders perceive HRC and RC dimensions to differ in
importance for use in the purchase, holding on to, or selling of ABSC
stocks?
In the ABSC stock transaction decisions of individual shareholders, is the
individual shareholder’s perception of the importance of HRC and RC
dimensions moderated by information provided by differing sources of
advice (as identified by the ASX shareholder survey 2006) and demographic
variables?
How does the CBA, Money Magazine’s “Bank of the Year 2008”, compare
to the other banks in the provision of HRC and RC information in the
corporate annual reports?
For ABSC, is there a positive relationship between the provision of
information on HRC and RC dimensions in the corporate annual reports and
the corporation’s share price?
Information gained through this research study may have the potential impact of
providing organizations with ways to meet the information needs of the individual
investors, to close the gap between what HRC and RC information “mum and dad”
shareholders have and what HRC and RC information is required in their investment

26
decision-making. The research may also provide answers to ways organizations can use
HRC and RC information to prompt improvements in investor confidence and a potential
reduction in share market volatility. Essentially, this research study seeks to provide,
from an HR perspective, valuable information to a number of key stakeholder groups
which include practitioners and academics in the field of SHRM, individual “mum and
dad” investors, ABSC and government legislators.
1.4 Significance of the Research Study
Practitioners and academics in the field of SHRM, individual “mum and dad”
investors, ABSC and government legislators all stand to benefit from the results of this
research study. In the field of Finance, there has been research provided that suggests
that information on intellectual capital is provided to investors and has a positive effect
on company performance (Brookings Institution, 2004; Chen et al., 2005; Daum, 2002;
Lev, 2001). However, even though there is a generally accepted link between company
performance and the provision of information on intellectual assets, such as information
on the strategic management of HR, there has been little research from an HRM
perspective to state this. First of all, this research has the potential to contribute valuable
insight into the perceptions of investors regarding the disclosure of SHRM policy
information. In doing so, it will benefit the field of SHRM by building on current
knowledge, having an impact in the area both academically and commercially.
Secondly, with regard for the importance of HRC and RC information to share
investment decisions, this research proposes to identify the key information disclosure
requirements of investors by providing insight into their perceptions and behaviours.
This is of benefit to individual “mum and dad” investors because it results in the onus

27
being on companies to make the information known to meet the specific needs of the
current and potential investors. In doing this, the research study proposes to provide
insight into whether shareholders of Australia’s four biggest banks, including the CBA,
Westpac Banking Corporation (WBC), National Australia Bank (NAB) and ANZ
Banking Group Ltd (ANZ), have significant difference in perception of the importance of
the HRC and RC information in deciding to purchase ABSC stocks. The study will also
help to identify whether there is a significant difference in perception in the importance
of the HRC and RC information in the decision to purchase ABSC stocks of shareholders
who have ownership in only a single bank and of shareholders who have ownership in
multiple banks. At this point in time, there is no research available that provides this
advice and there is a definite gap in research when it comes to understanding specifically
the perceptions of individual “mum and dad” investors in Australia.
Thirdly, of benefit to ABSC is the potential identification of a significant positive
relationship between an individual’s perception of the importance of HRC and RC
information and the decision to purchase ABSC stocks. Research is lacking in this area.
Knowing what HRC and RC information “mum and dad” shareholders find more or less
important in their investment decisions, with specific regard to Australian banking shares,
is research that has not been conducted in the past. The study also proposes to discover
whether individual shareholders perceive HRC and RC information to differ in
importance for the use in the purchase, holding on to, or selling ABSC stocks. ABSC
will also be assessed in regard to the provision of HRC and RC information in the
corporate annual reports by reporting on the frequency and quality of the information
provided. The relationship between HRC and RC information disclosure and share price

28
will also be assessed. The data has the potential to help banking sector firms better
understand any potential gap in the HRC and RC information and the information needs
of investors, and, to improve their ability to use the information on HRC and RC to both
manage and communicate the value of a company.
Finally, support and research provided by both the academic and commercial
environments has the potential to benefit government legislators by helping to set
guidelines for the disclosure of HRC and RC information necessary to the share
investment decisions of “mum and dad” shareholders. This may facilitate a levelling of
the playing field between institutional and individual investors. This study proposes to do
this by further providing insight into whether differing sources of advice such as the
“media”, “friends, family and work colleagues” and “professional investment advisors”,
as well as gender, age or education of individual shareholders, have a significant
moderating effect on the relationship between the individual shareholder’s perceptions of
the importance of HRC and RC information and the individual shareholder’s use of HRC
and RC information in ABSC stock purchase. The research seeks to improve the potential
for corporate awareness and to make evident who or what are the influencers and to what
degree in Australia.
1.5 Thesis Structure
This dissertation is divided into six chapters with associated appendices and
references. This chapter, Chapter One, provides a background to the research. In doing
so, it highlights the state of the current economic environment and provides an overview
of the link between IC, specifically HRC and RC, and the impact IC has on share prices
of knowledge-based companies. It also introduces the academic constructs and the

29
context in which the study is conducted. It establishes that the research is conducted
from an SHRM perspective, rather than from a finance perspective, as much previous
research has presented. Chapter Two provides a detailed review of the literature in the
key areas of IC, HRC and RC identification, measurement, and reporting. Other previous
studies conducted in the field are discussed. Chapter Three presents a discussion on the
pilot study which utilises a range of pretesting strategies to develop a questionnaire for
use in the hypotheses-testing phase of the research. Chapter Four provides detailed
information on the research problems for the main study and hypotheses to be tested.
Information concerning is further provided about the research methodology employed
and the implications and limitations of the research findings. Chapter Five sets out the
results of the thematic content analysis of the annual reports of Australia’s eight banks as
at the end of the 2006/2007 financial year and it also provides the results of the
hypotheses-testing study. Chapter Six provides the discussion of the results; conclusions
are drawn from the research. Limitations and the contribution of the research to the
commercial environment and to the various stakeholder groups are discussed. Chapter
Six is followed by appropriate appendices and references.

30
Chapter Two
Literature Review
2.1 Introduction
The purpose of this chapter is to provide the foundational understanding necessary
for the hypotheses this research is planning to test. While this chapter includes references
to recent studies in the fields of IC and SHRM, some references are made to less recent
studies that provide the theoretical underpinning for this research study.
2.2 Literature Review
2.2.1 IC and its components of HRC and RC.
This research study is not a finance based study but rather a HR based study.
Primarily, the study seeks to test the relationship between the perceptions of the
importance of HR information, information on HRC and RC dimensions in stock
purchase decisions, and use of such information in the actual purchase of shares in
ABSC. Yet, a necessary prerequisite to understanding and applying constructs of HRC
and RC within this study is a review of literature in the area of IC itself. While the
separate dimensions of HRC and RC have not been studied to the same extent as IC, they
are part and parcel of the construct of IC and delving into the research in that area
provides the significant information necessary for the building blocks in this research
study.
Brooking (1996) made a significant contribution to the academic literature on IC.
In her book “Intellectual capital: Core assets for the third millennium enterprise”,
Brooking utilized an audit based perspective to discuss what IC was by talking about
what it included. Brooking broadly referred to the construct of IC as being the collection

31
of intangible assets which enable an organization to function. This implied that, if an
organization’s asset is not tangible, it is automatically considered to be part of IC. In her
ground breaking work, Brooking provided a clearer definition of IC and the classification
of IC assets by clustering them into the four categories of market assets, intellectual
property assets, human-centred assets and infrastructure assets. Specifically, she
regarded brands, customers, distribution channels and business collaboration as market
assets. Patents, copyright and trade secrets were included under intellectual property.
Education and work related competencies were included as human centred assets while
management processes, information technology systems, networks and financial systems
were included under infrastructure assets. Within this construct, Brooking further
proposed the categorization of such IC assets into human capital and structural capital
and proposed the use of a Technology Broker model (a questionnaire) to audit the IC of
organizations to enable organizations to put a dollar value on their IC assets. In relation
to the human capital of an organization, Brooking also defined it by referring to what it
included. She proposed that human capital includes a range of items to consider
including competence, skills and know-how of employees; attitudes, motivation and
leadership skills of managers; intellectual agility, innovation, entrepreneurship and the
ability to adapt. In relation to the structural capital of an organization, Brooking referred
to the relationships with customers and suppliers and the structure, culture, practices and
policies of an organization. Brooking argued that her Technology Broker model provided
a practical tool with which organizations can bring together and manage their IC, an
exercise she deemed vitally important in achieving organizational success.

32
Karl-Erik Sveiby, a pioneer of knowledge management since the late 1980s, is
responsible for a number of books and articles on knowledge management and IC.
Sveiby was first and foremost in identifying the need for organizations to measure human
capital, and, in his book “The invisible balance sheet”, compiled the results of a working
group set up to come up with a theory to be used in measuring the knowledge
management of an organization (Sveiby, 1989). Sveiby was able to tackle the human
capital components of knowledge capital. In focus were the competencies and
knowledge of employees. He successfully put forth a theory for the measurement of
knowledge capital by separating it into three categories including customer capital,
individual capital and structural capital. A number of Swedish companies responded by
using Sveiby’s framework and by altering the format of their annual reports to include his
framework of knowledge capital reporting. In 1995, Edvinsson, at the Swedish company
Skandia, was one of those who applied Sveiby’s framework in its organization. In doing
so, he also initiated the use of the term IC in the supplement to the annual report of
Skandia. Sveiby (1997) continued his work in the field of knowledge management and
more specifically in IC by publishing his work on “The new organizational wealth:
Managing and measuring knowledge based assets”. He asserted that, for companies, the
value of their intangible asset is representative of the difference between their market and
book values. In making this contention, he used case studies and referred to the market
and book values of knowledge companies such as Microsoft. Sveiby referred to three
categories of intangible assets which include employee competence, internal structure and
external structure. He used a number of examples of knowledge based companies that
have leveraged their success through knowledge strategies focusing on getting the most

33
out of their HR communication. Sveiby’s framework of knowledge capital reporting, the
Intangible Assets Monitor, is holistic. Internal structure refers to the organization’s
management while external structure refers to suppliers and customers. The flow of
information between all categories of intangible assets is regarded as the catalyst for well-
managed and effectively used competencies. The book is presented from a non-financial
perspective and the measures presented in an effort to help companies manage their
intangibles, are on knowledge-based assets. The measures are those which relate
specifically to the internal and external structures and the competencies of people to help
achieve the strategic objectives of a firm.
Influenced by the work of Sveiby (1997), Edvinsson and Malone (1997) studied IC
in an attempt to highlight the importance of IC to organizations. In “Intellectual capital –
Realising your company’s true value by finding its hidden brainpower”, the nature,
measures and management of IC was their central focus. Also, similar to Brooking
(1996), Edvinsson and Malone, with their Skandia Value Scheme, served to define the
construct of IC and to identify its components within a framework based on clusters. It
was an endeavour to help companies understand that IC enhances their potential for
wealth and value creation. The researchers considered IC to include human capital,
structural capital, and customer capital. They defined human capital as an organization’s
combined human capability with regard to solving business problems. They considered it
owned and inherent within the people themselves, not within the organization, a capital
that went home when the people went home. Edvinsson and Malone regarded structural
capital as all that exists within an organization to support the employees in their work
roles. They argued that structural capital is owned by the organization regardless of
34
whether the employees leave. They identified it as the supportive infrastructure that
enables human capital to function. However, due to its varied range of components,
structural capital was further categorized into organizational, process, and innovation
capital. Within organizational capital, they included organizational systems and
philosophy that worked to leverage the organization’s capability. Within process capital,
they included techniques, procedures and programmes that implemented and improved
the organization’s delivery of goods and services. Within innovation capital, Edvinsson
and Malone further classified intellectual properties as those which are copyrighted or
trademarked, and intangible assets as any other capacity or hypothesis used to carry out
the business of the organization. As for customer capital, they argued that it includes the
strength and the loyalty of an organization’s customer relations. They made reference to
customer satisfaction, repeat business from customers, financial well-being and price
sensitivity as measures of an organization’s customer capital.
Also very importantly, Canadian researcher Nick Bontis has spent many years
researching IC classification and disclosure (Bontis, 1998, 2002; Bontis & Fitz-enz,
2002). Bontis (1998) explored the development of several conceptual measures and
models relating to IC and its impact on business performance and used empirical analysis
to develop and support his research. In an exploratory pilot study, Bontis set out to
survey a number of entry-level MBA students and required each of the respondents to
answer the eight page questionnaire booklet as representatives of firms they worked for
before entering the MBA program.
The questionnaire was designed to utilize “IC constructs as well as business
performance within the context of the conceptual model” (Bontis, 1998, p. 67). He had

35
64 respondents fill out the questionnaire, an eight page document comprising questions to
be answered on a 7-point Likert scale, with 63 items designed to delve into four
constructs, three of which related to IC and one relating to business performance. Bontis
(1998) used SPSS in Windows to factor analyse the information relating to the constructs
of IC including human capital, customer capital, structural capital, and performance in an
effort to identify which items captured the constructs most effectively. He identified a
“valid, reliable, significant, and substantive causal link” between the components of IC
and business performance (Bontis, 1998, p. 63). While Bontis asserted that
understanding a company’s IC is extremely important to performance, he also asserted
that the implicit nature of IC may hinder analysts from being able to measure it using
economic variables, and that a formula may never be constructed to explain the specific
monetary value of intellectual capital. The research helps other researchers and
practitioners to understand and develop the components of IC with the academic and
commercial environments as Bontis’ research suggests a shift in the future from short-
term strategies focused on products, to strategies that are longer-term, those that focus on
the specific human, structural and customer capital of an organization.
The concepts of HRC and RC are linked to identifying an organization’s people as
its valuable assets. Researchers infer that the dissection of the construct of IC leads to the
understanding of the concepts of HRC and RC (Bollen et al., 2005). Definitions of the
HR components of IC proposed by Brooking (1996), Edvinsson and Malone (1997),
Roos and Roos (1997), Sveiby (1997), Bontis (1998), Lynn (1998) and Johanson (2005)
created the foundation for the research carried out by Bollen, Vergauwen, and Schnieders
(2005). Bollen, Vergauwen, and Schnieders, in reviewing and bringing together the

36
literature, used a comparative analysis of the theories provided by leading researchers in
the field to provide an integrated framework of IC and its components of HRC and RC
(refer to Appendix A).
Bollen, Vergauwen, and Schnieders (2005) identified that Johanson (2005)
proposed HRC components which included innovation, capacity, creativity, know-how
and previous experience, teamwork capacity, employee flexibility, tolerance for
ambiguity, motivation, satisfaction, learning capacity, loyalty and formal training and
education. They identified that Sveiby (1997) suggested that the components of HRC
are knowledge, skills, innovativeness, talent, values, culture, philosophy and ability.
They also were able to assert that Bontis (1998) proposed HRC components to include
intelligence, skills, expertise, learning capability, changing capability, innovativeness,
and creativity.
In referring to the work of Edvinsson and Malone (1997), and in regard to the
concept of the structural capital of an organization, Bollen, Vergauwen, and Schnieders
(2005) were able to identify that the RC concept was included within this construct
because structural capital is the knowledge secured within an organization’s systems and
structures. They regarded structural capital as what is left when all have gone home.
Structural capital was found to include a range of components such as the quality and
scope of information technology (IT) systems, corporate images, proprietary databases,
organizational concepts, and documentation. It is also recognized as including
intellectual properties such as patents, trademarks, and copyrights. Finally, Bollen,
Vergauwen, and Schnieders also assert that it includes customer capital, organizational
capital, process or relational capital and innovation capital. RC is regarded as part of

37
structural capital. As for the components of RC, Bollen, Vergauwen, and Schnieders
(2005) proposed that these are items related to customer capital, supplier relations, and
competitors. Items related to customer capital include knowledge of marketing channel,
knowledge of customer relationships, customer orientation (accessibility of customer
feedback), customer orientation (image of the company), customers (amount of
customers), customers (strong relationships) and customers (satisfaction of products and
services). Items related to supplier relations include employees’ knowledge of customer
relations and number of customers. Items related to competitors include relationships
with other organizations and competitor orientation. Also, general aspects to be
accounted for when engaging in relationships and in profit objective, such as long term
focus, relate to both customer and supplier relations. As Bollen, Vergauwen, and
Schnieders bring together, literally and in table format, for comparison, the work of
leaders in the field of IC, they provide a good foundation for the development of
definitions relating to each of the constructs of IC, the HRC and RC being assessed in this
research study.
In summary, much research has focused on the definition of the construct of IC.
This is because understanding the IC of an organization is critical to organizational
performance. Also, a focus on the separate components of IC, HRC and RC, is a result of
identifying that the people within an organization are its most valuable assets. However,
as researchers have argued (Bontis, 1998), the implicit nature of IC makes it difficult for
analysts to measure its value in monetary terms. Researchers infer that it is only through
the dissection of the construct of IC that an understanding of the concepts of HRC and
RC can be gained.
38
2.2.2 The importance of the functions of HRM to organizational strategy.
As a component of an organization’s IC, human resources are the most important
and unique assets of an organization. Employees must be managed effectively in order to
set in motion the other organizational resources in the development of innovation to
achieve competitive advantage. HRM is widely regarded as the act of planning,
organizing, directing and controlling of the procurement, development, compensation,
integration, maintenance, and separation of human resources to the end that employee,
organizational and social objectives are realized (Flippo, 2007). The functions of HRM
within organizations relate to attracting and maintaining a company’s human resources.
Traditionally, this process includes recruiting and hiring the right staff, helping
individuals and the organization to develop, manage and influence the performance of
individuals and teams within the organization, and working to develop the careers and
leadership skills of staff. HRM systems include policies on the compensation, integration
and maintenance of human resources to facilitate employee and organizational
performance.
Lado and Wilson (1994, p. 700) contended that HRM systems were “sets of distinct
but interrelated activities, functions and processes that are directed at attracting,
developing, and maintaining (or disposing of) a firm’s HR”. HRM systems may either
contribute to or wipe out organizational capabilities that assist competitive advantage.
Lado and Wilson argued that within HRM systems, the strongest drivers of sustained
competitive advantage were recognized as being organizational culture, learning,
routines, and entrepreneurship. They went on to assert that organizational capabilities
develop further into organizational competencies, those firm-specific resources and

39
capabilities that enable the organization to develop, choose and implement value-
enhancing strategies. For example, in our dynamic global environment, it is the learning
organization, that which encourages innovation and learning and development at
individual and organizational levels, which will be best placed for achieving competitive
advantage. Lado and Wilson assert that in relation to this, and in relation to other
determinants of an organization’s competitive advantage, firm-specific, hard-to-replicate,
and immobile organizational competencies will result in economic gains to an
organization. They went on to refer to a range of managerial competencies, input-based
competencies, transformational competencies, and output-based competencies
organizations need to develop to achieve competitive advantage.
Similar to Flippo (2007), Lado and Wilson (1994) contended that the functions of
HRM included implementing cognitive processes in the recruitment and selection of
employees, carrying out job analysis, having in place suitable training and development
initiatives, performance appraisal systems, and having effective compensation programs.
The first two functions, of embracing cognitive processes in recruitment and selection
and job analysis, relate to attracting employees, and the remaining three functions, of
training and development, performance appraisal, and compensation, relate to the
maintenance (development, retention, and maintenance) of employees. Compensation is
used for both attracting employees to a company and for maintaining them. These
functions are regarded by researchers as important to affect the organizational culture,
learning, routines and entrepreneurship. This, in turn, leads to organizational
competencies that help an organization achieve competitive advantage through
innovation, cost reduction and/or improved productivity.

40
However, within a SHRM framework, the HRM functions presented above may
also be classified into procurement and performance management. This is because
procurement is about attracting and selecting employees while performance management
is about everything else that follows their recruitment (McNamara, 2006). McNamara
asserts that performance management of employees is an on-going process which
includes the requirements to establish goals, to monitor employee achievement of goals,
to share feedback with employees, to evaluate the employee performance, to reward
performance, and even to let an employee go. It is an ongoing process of communication
and feedback used in the appraisal of employees, procedures, and processes to measure
progress toward the preset goals. Performance management involves the relationship
between HR practitioners and the employees in an attempt to facilitate a company’s
strategic objectives. Professional organizations and corporations alike must recognize
that, by its dynamic nature, successful performance management creates the groundwork
for rewarding excellence. It enables managers to clarify expectations, to decide on
objectives, to identify goals, to give feedback, and to assess results. Performance
management, within a SHRM framework includes, quite necessarily, the development
and management of induction programs, training, formal performance appraisals, high
pay and various financial incentives, non-monetary benefits, job enrichment, and career
progression.
In summary, it has been argued that human resources are the most vital and unique
assets of an organization and that they must be managed effectively in order to engage all
organizational resources in innovation to gain sustained competitive advantage. Firm-
specific resources and capabilities enable organizations to develop, choose, and

41
implement value-enhancing strategies. The functions of HRM within organizations relate
to attracting and maintaining a company’s, firm-specific human resources. In carrying
out the functions of HRM, HRM systems are used. HRM systems may either contribute
to or wipe out organizational capabilities that assist competitive advantage (Lado &
Wilson, 1994). Organizations with HRM systems that are aligned with organizational
strategy, for the encouragement of innovation and learning and development at individual
and organizational levels, are best placed for achieving competitive advantage and
economic gains.
2.2.3 Understanding SHRM – Getting companies to develop the necessary link
between HRM and corporate strategy.
Researchers such as Kaye (1999) and Wei (2006) seem to be of the same opinion
about the role of HRM in the utilization of an organization’s IC to support organizational
strategy. They contend that corporations that achieve competitive advantage are those
that take a strategic focus, those who have a SHRM perspective, whose leaders actively
work to enable a strategic orientation. Essentially, they are those who realize the value of
the appropriately fitting IC components of human resources to the overall business
strategy. With regard to the notion of SHRM and its value to an organization, this paper
refers to the work of Kaye (1999) and Wei (2006).
“If HR policy is to contribute to the organization’s bottom line, areas such as
recruitment, selection, training, development and performance appraisal should be
consistent, integrated and strategically focused.” (Kaye, 1999, p. 581)
Kaye (1999, p. 577) referred to SHRM as a “system-wide intervention that links
HRM to strategic planning and cultural change”. Kaye argued that if the purpose of
42
SHRM is to strategize in combination with an organization’s business direction, then it
has to be reconceptualised to acknowledge the human endeavour. Kaye argued that
SHRM, including “soft” and “hard” strategies, needs to consider the needs of employees
and needs to be integrated with business strategy as organizational culture that provides
direction and a sense of purpose and involvement will create long-term competitive
benefit. Kaye also contended that by failing to reframe the language and the intent of
SHRM, organizations will be unable to realize the much sought after sustainable
competitive advantage.
In her theoretical paper, Kaye (1999) used a literature review to provide a critical
analysis of SHRM from an Australian perspective. She argued that while SHRM was
being utilized to specify a system-wide intervention that ties HRM to strategic planning
and cultural change, the Australian experience suggested that SHRM was not quite
people focused and had led to increased job insecurity and decreased job satisfaction.
Even as Kaye recognized that employers were rewarding employees in an effort to link
strategy to performance, she also encouraged organizations to let go of the economic
level of a single vision strategy which was embraced by many Australian companies.
Kaye was concerned that the traditional approach to HRM that was evidenced in the
Australian context was not adaptive and not open-ended enough to deal with the
unpredictable and unknowable, which is essentially what corporate strategy is all about.
Essentially, HR strategies deal with people issues and opportunities to achieve and
maintain competitiveness through people. Kaye (1999) argued for a more wide-ranging
definition of the concept of SHRM; one that produces a framework that includes both the
outward focus of strategic planning and the inward focus which allows for the human

43
contribution leading to organizational reality. Kaye found that to enable strategic
orientation, research suggested that strategy needed to be initiated and controlled from the
top management level, needed to be deliberate and deductive, and needed to be holistic,
integrating the goals and actions of an organization into a combined whole. By
implementing a strategic framework, organizations work with their present situation with
the intention of predicting future requirements to achieve advantage. Kaye argued that
SHRM backs up the belief that organizational effectiveness is enhanced if HR is well
thought-out when deciding on business strategy. She referred to both “soft” and “hard”
HR strategies and explained that SHRM requires a balance of emphasis on the
developmental (soft) and on the structural, task-forced (hard) HR strategies.
According to Wei (2006), SHRM involves designing and putting into action a set of
internally consistent policies and practices that make certain that the human capital of a
firm adds to the accomplishment of its business objectives. It is about merging the HRC
practice into the strategy of the firm. In his theoretical paper, Wei (2006) proposed to
establish a conceptual framework that accounted for the “fit” of HR practices to
organizational strategy. Like Kaye (1999), Wei undertook a review of literature in the
field and found that the widespread indication from previous research was that SHRM
enabled corporations to achieve sustained competitive advantage.
Initially, in setting out to establish his conceptual framework, Wei (2006) suggested
that defining SHRM was hard, but, what was known was its function. Similar to Kaye
(1999), he believed combining the traditional HRM function with corporate strategy
resulted in SHRM. He argued that SHRM gave organizations greater flexibility and use

44
of their human resources, therefore enabling organizations to improve their competitive
positions.
Wei’s main focus was on the “fit” between HR practices and policies and business
strategy. Fit was identified as being “the pattern of planned human resource deployments
and activities intended to enable the firm to achieve its goal” (Wei, 2006, p. 49; Wright &
McMahan, 1992, p. 298). There were two kinds of fit that Wei referred to, “horizontal
fit” and “vertical fit”. Horizontal fit was identified as the congruence among the various
HRM practices within the organization (Wei, 2006; Baird & Meshoulam, 1988), and
vertical fit was identified as the alignment of HRM practice with the strategic
management process of the organization (Wei, 2006; Schuler & Jackson, 1987). Wei
considered vertical fit a critical step on the way to achieving organizational goals through
the initiation of HR activities that are aligned with the organization’s objectives. He also
stated that horizontal fit was necessary whilst making good quality use of such resources.
Wei (2006) also asserted that, fundamentally, SHRM focuses on developing the
organization’s ability to respond to the external environment by making better use of its
human resources. Given that an organization’s strategy is a reflection of its response to
competitive external changes, a reserve of human capital, possessing a wide range of
skills that are attuned with the organizational strategy, is a mechanism for ensuring the
achievement of strategic goals by promoting behavioural efficacy amongst the
employees.
Further to suggesting definitions for the constructs, Wei (2006) was successful at
creating a conceptual framework on the antecedents of “fit” and at providing a conceptual
model that illustrated the determinants of both kinds of “fit”. Wei provided a detailed

45
discussion on the model in which he argued that horizontal and vertical fit were impacted
to various extents by three types of factors. Wei was able to conclude that, as human
resources are becoming more and more important to competitive organizations, their
management must be viewed from a strategic perspective. Similar to Kaye, he identified
the need for the deliberate, systematic, long-term perspective in relation to the
management of HRC. With regard to both horizontal and vertical fits, Wei warned about
managers relying too heavily on one factor or the other and disturbing the balance of both
fits which is needed in the overall strategic framework of organizations. He admitted to
the difficulties linked to setting strategies that are both compatible and internally
consistent with an organization’s HR system and suggested that management and culture
play pivotal roles in the success of such strategies. Finally, Wei referred to the interactive
process in which SHRM and organizational development set out to encourage and
advance each other. Wei concluded that organizations that actively participate in HR
development behaviours are those which are expected to benefit through financial
performance and human capital improvements, strengthening those antecedents for
attaining better fits, and subsequently improving organizational effectiveness.
In summary, research has found that SHRM is a system-wide intervention linking
HRM to an organization’s strategic planning and cultural transformation (Kaye, 1999). It
includes “soft” and “hard” strategies that consider the integration of employee needs and
organizational culture with organizational strategy in an effort to create long-term,
sustained competitive benefit. Corporations that attain sustained competitive advantage
are those who have leaders who adopt a strategic focus, who actively work to support
organizational strategy and encourage a SHRM perspective.

46
Assisting organizational strategy by fitting the human resource components of IC to
the overall business strategy is a critical role of HRM. The expectation is that
organizations benefit, attaining human capital improvements and organizational
effectiveness. It will be interesting to see if this research can shed some light as to
whether the dimensions of HRC and RC perceived to be important to shareholders will be
those that are linked to a company’s strategic orientation.
2.2.4 Recognizing the need for IC management, measurement and reporting.
With regard to the activities of IC measurement and reporting, as researchers have
asserted in past studies, IC rich companies who do not report on their IC sell themselves
short by appearing to be less valuable than they truly are (Guthrie & Petty, 1999; Guthrie,
Petty, & Ricceri, 2006). Yet, before companies can report on IC, they must have some
way of measuring it, whether in a qualitative or quantitative manner. The consistent
application and evolution of IC measurement is, in itself, recognition of the great value
this tool represents for assessing the true economic worth of an organization. A number
of research papers have revealed significant information on the topic of IC Management,
Measurement and Reporting. Flamholtz (1988), Kaplan (1993), Lev (2001), Sveiby
(1989, 1997, 1998) and Guthrie and Petty (2000) are among those who have researched
and expanded the knowledge in the field of measuring and reporting on an organization’s
intangible resources.
In the United States, Flamholtz has researched the measurement of intangible assets
and has devised a probabilistic formula to determine the value of an organization’s
human capital. He applied the formula using an organizational-specific scorecard method
of aligning organizational strategy with human capital capabilities (Flamholtz, Searfoss,

47
& Coff, 1998). He based his theory on the assumption that movement between
organizations is in itself a probabilistic process where an integrated Human Resource
Accounting (HRA) system measures both the probable replacement cost of human assets
and the economic value of individuals in each position. Flamholtz’ HRA paradigm is
considered a “psycho-technical systems approach (PTS)” to organizational management
(Flamholtz et al., 1998; Flamholtz, Bullen, & Hua, 2002). Fundamentally, Flamholtz
regards HRA and disclosure on human capital as an effective tool in HR decision-
making.
Flamholtz, Bullen, and Hua (2002) provide a definition of HRA and the authors
again suggest that measurement of human capital is useful for financial reporting and
managerial decision making. The authors also argue that the mere academic research in
the area of HRA can create the tool for further development and improvement of
accounting for IC, which includes people as human assets. They too suggest that the
organization’s human resources are its prime intangible assets and that human capital is
to be viewed as such an asset rather than a cost to the organization, as is the dominant
view. The authors agree with other scholars in the field that human capital must be
accounted for when information is presented to stakeholders both internally and
externally if they are to make more accurate strategic decisions. Although HRA is
difficult, due to a level of subjectivity rather than the objectivity that is part of the
assessment of tangible assets, it is beneficial as a management tool. The authors refer to
three functions of HRA which include: the provision of numerical information about the
cost and value of human capital, serving as an analytical framework in the decision-
making process and providing the motivation for decision-makers to take on a human

48
resource perspective. The article makes reference to Flamholtz’ HRA paradigm in terms
of the PTS approach to organizational measurement. This system highlights the two
functions of measurement, the process function and the numerical or informational
function. Finally, the historical development of HRA, over the last three decades is
discussed and the current developments in the area are also discussed (Skandia
Navigator). The authors paint a clear link between research and practice and are
compelled by the knowledge that HRA information can aid decisions within an
organization and in the capital markets.
Kaplan and Norton (1993) promote the use of the balanced scorecard (BSC) as an
HRM tool. With the BSC, measures are chosen from a number of perspectives such as
financial indicators, performance for customers, internal processes and innovation and
improvement activities. Kaplan and Norton assert that the BSC is being used by
successful firms to measure performance and set strategy. They discuss the need for
managers to design and use new measures that are effective in monitoring new goals and
processes as they question the relevance of old measures in the implementation of new
organizational initiatives. They too regard effective measurement as an integral part of
the management process and refer to the BSC as a management system that can induce
breakthrough developments in the important areas of product, process, customer, and
market development. However, measurement in all areas is reliant on the key indicators
that are specifically applicable to individual firms and their individual strategies. The
design of the BSC is not the same for all organizations. The job of management is to
understand which measurements will facilitate strategy. The BSC continues to be used
successfully by firms to both measure performance and set strategy.

49
In 1996, Lev founded Intellectual Research at New York University. Similar to
Kaplan and Norton (1993), Lev (2001) refers to a value chain scoreboard used to provide
information to both managers and investors, at different levels of detail and frequency,
about the innovations within the organization. Within his approach, he uses a mix of both
quantitative and qualitative data to quantify the value of intangible assets. Lev asserts
that there is a need for primarily quantitative measurement and disclosure and for a
degree of qualitative measurement and disclosure as an annex, providing the context in
which the quantitative performance data is analysed. Lev’s research also highlights the
importance of disclosure on intangible assets. He speaks about the discrepancies between
values of company shares and values of tangible capital. He goes on to demonstrate that
the value of intangibles is significant in knowledge-intensive industries. This is in line
with the current research on human capital disclosure. Lev argues that the consequences
of information asymmetry include: abnormal gains to the informed investors, a
deterioration of investor confidence in the integrity of the capital markets based on
intangibles and information asymmetry, a widening of bid-ask spreads of securities and,
as a result, high transaction costs to investors and an increase in the cost of capital. Lev
believes that if a clear, well-defined, and information relevant system can be developed to
reflect the value of the intangible assets of a firm, most managers would indeed provide
disclosure on such information for the good of the business itself.
Researchers in Europe have also contributed quite valuably to the wealth of
knowledge in this area. In Scandinavia especially, human capital measurement and
reporting is encouraged throughout both public and private sector firms. Research such
as that by Sveiby (1989, 1997, 1998) and the Swedish group Skandia identifies the

50
generation of financial results through the human focus as the motive behind the
development of customer, process and developmental capital (Daum, 2001). Studies
indicate that the stimulating forces for Human Resource Costing and Accounting
(HRCA) in Scandinavian countries are based on OECD initiatives that are values-based,
concerned with social order and organizational improvement (Grojer & Johanson, 1998).
In their literature review, Grojer and Johanson (1998) discuss the development of HRA
theory and practice. They refer to HRCA as a multifaceted and inadequately understood
process of accounting. The researchers make reference to the development of the
accounting process which was influenced by both external and diverging internal forces
for change. In initiating their review, they focused on the example of Sweden and the
forces organizations faced that effected the stimulation or inhibition of the development
of HRCA.
Grojer and Johanson (1998) take on a historical perspective to highlight periods of
growth in the field in the 1960s, characterized by the development and assessment of
models for the measurement of human resource costs and values. Their article discusses
the diminished interest in the area at the end of the 1970s and the renewed interest in the
concepts of HRCA since the 1980s as organizations struggled in the practical application
of what was referred to as an “interesting concept” (Grojer & Johanson, 1998, p. 496)
that of measuring and accounting for human capital. While intangibles are readily
recognized as an important component of an organization’s assets, only few countries
have been interested in the further development of HRCA, those seeing it not only as a
management tool but also as a tool for capital markets to gauge the true value of
organizations. The Swedish Government and many Swedish organizations have put

51
much faith into the new paradigm. The authors were able to conclude that HRCA, while
not really popular in every country, “based on a management control perspective, seems
to be used to a substantial degree by many Swedish organizations” (Grojer & Johanson,
1998, p. 496). Grojer and Johanson go on to highlight the possible reasons for its
attractiveness to the Swedish organizations, all having much to do with the needs of
stakeholder groups. Finally the article discusses the link between the interest in the
measurement of intangibles and the degree to which the political and organizational
stakeholders push for the developments. Grojer and Johanson were able to conclude that
as time has gone by, there has been an increase in opportunities for research in the area,
they did, however, question where the researchers were. The study calls out for more
research and hence researchers in the area to further legitimize its potential for improving
organizational effectiveness.
In summary, there has been an expansion of the knowledge in the field of
measuring and reporting on an organization’s intangible resources. Researchers have
argued that the measurement and reporting of intangible resources, such as IC, is critical
to corporations in order to adopt a strategic orientation (Flamholtz, Searfoss, & Coff,
1998). Knowledge-based, IC rich companies, who fail to report on their IC, suffer an
injustice by appearing to be less valuable than they are. The measurement of IC must be
utilized in both managing an organization and in communicating its value to both internal
and external stakeholders. Measurement tools for IC, including organizational-specific
scorecards aligning organizational strategy with human capital capabilities, help in
assessing the true economic worth of an organization. The utilization and evolution of IC

52
management, measurement and reporting is, in itself, recognition of the immense value
attached to the disclosure of IC information.
2.2.5 Reporting in the context of corporate annual reports and the relationship
between IC and the market value of a corporation.
Researchers have found that the IC of an organization has been able to impact
positively on the market value of an organization and on its financial performance (Chen
et al., 2005). Past research has also demonstrated a positive relationship between the
HRC indicators and the market-to-book value ratios of Spanish banking firms (Saenz,
2005). However, public legislation in Australia, as in most countries, does not mandate
the disclosure of IC information, including information relating to HRC and RC, in the
annual reports of corporations. This results in a deficiency of disclosure on strategically
important organizational resources and activities (Guthrie, Boedker, & Cuganesan, 2005).
Holland (2003) and Guthrie, Boedker, and Cuganesan (2005) concluded that private
information not included in the annual reports represented 25 to 50 percent of the relevant
information used by fund managers in corporate valuations. Mouritsen, Bukh, and Marr
(2004) also assert that the lack of disclosure on non-financial indicators, important for
organizations within a knowledge economy, is leading to a decline in the relevant value
of the information in annual reports. They argue that the “traditional financial statements
do not provide the relevant information for managers or investors to understand how their
resources – many of which are intangible – create value in the future” and “for external
communication purposes, additional kinds of reporting may be necessary” (Mouritsen et
al., 2004, pp. 46 & 47).

53
Saenz (2005) asserts that many people believe a firm’s IC represents the difference
in value between a company’s market value and its book value. Saenz conducted his
research study to test this assertion. Saenz’ research provided a methodology to explore
and assess the relationship between IC indicators and the market-to-book ratios (MBR) of
4 Spanish banking sector companies. The Spanish banking sector was chosen based on
the fact that Spanish banks had traditionally tended to create and disclose IC reports. The
four banks referred to in the research were those that did just that, they either published
IC reports or a human capital report.
The research study was focused on exploring the relationships between human
capital, MBR, and various business performance indicators (Saenz, 2005). In doing so,
each of the three main IC components of human, structural, and relational capital scored.
The scores were an attempt to measure the relative positioning of companies within the
same industries in each of the IC blocks. A global score was also set, which involved
combining the scores of the previous blocks. A common set of indicators in the
corporations studied was required. However, the empirical application of the study’s
proposed methodology to external IC reports was limited by the imbalance between firms
showing strategy uniqueness and delivering comparable information across their
companies.
In comparing the average human capital rate calculated for the period 2001-2003
with the MBR, Saenz (2005) obtained the average of this ratio for the period 2002 to
2004 given that the information relating to human capital was only regarded to influence
the market value of shares once the information was published. That was the reason
Saenz considered a one year delay for the MBR. Saenz employed the use of various

54
correlation tests in his analyses. The findings of the study successfully demonstrated an
obvious positive relationship between human capital indicators and MBR, and almost no
relationship between human capital indicators and banks’ efficiency and financial return.
Based on the analyses conducted, Saenz concluded that the human capital of the
companies studied seemed to have an impact on MBR but the incidence on the level of
efficiency and financial return is very weak. Finally, the aspects which seem to have the
most influence on the MBR are the levels of efficiency and financial return of the Spanish
banking sector firms. Overall, Saenz’ study was of value to the field in its provision of
the methodology for external IC benchmarking.
Bukh (2003), in his theoretical paper, has presented the argument that for IC
disclosure to be seen as pertinent from a capital market viewpoint, the information should
be made known as a vital part of the framework revealing the value creation methods of
the firm. Bukh asserts that there is a demand for the disclosure of IC information based
on the fact that many organizations derive their success from intangibles including know-
how, patents and skilled employees. Bukh refers to the IC reports of Danish firms and
argues that for IC reports to be effective, they must convey the management’s knowledge
of strategy and value formation, and not only display indicators of general concern.
Rimmel (2003), in his dissertation, provided an in depth analysis of the level of
voluntary human capital disclosure in Sweden by two organizations in particular, Skandia
and Allianz. In conducting his research, Rimmel has stated that while organizations
indicate that their employees as their most valuable resources, only a few organizations
have been successful at measuring and reporting on the value of human resources in their
annual reports. The purpose of Rimmel’s study was to illustrate the practice of providing

55
voluntary information on human resources in company annual reports by comparing the
findings on justification, disclosure, and utilization. Rimmel used a tripartite model of
human resource disclosure practice to study information, providers, and users. He
studied the extent of voluntary information in annual corporate reports, why the
information was provided, and how the users of the information used it. As for the
methodology employed, Rimmel used a disclosure scoreboard to gain the empirical data
needed for his research, he also interviewed the users and providers and he utilized a
comparative case study analysis of two organizations, one more experienced at voluntary
disclosure than the other. The study found that both organizations provided a large
amount of voluntary disclosure in their corporate annual reports yet over a five year
period the more experienced organization lost its lead in voluntary disclosure. Both
organizations provided human resource disclosures as both deemed them to be important
in their overall picture of the worth of the organization yet, the inexperienced
organization provided a greater amount of human resource disclosure. Notably, the
comparative analysis indicated that the human resource disclosure provided did not fully
meet the expectations of the users and that the users found the information hard to
analyse, especially for comparative purposes over a number of years.
Following on from his work (Bontis, 1998) on identifying a causal link between a
company’s IC and its business performance, Bontis (2002) went on to study the IC
disclosures of Canadian companies. He used content analysis to study the extent of IC
disclosures in the annual reports of ten thousand Canadian companies and found that
most IC terms were disclosed only once in the annual reports. Bontis (2002) found that
IC disclosure was very much still in academic discussions and was generally ignored in

56
corporate reporting. It was concluded that the companies that voluntarily disclosed more
information were those from the “new economy” and that there was no statistically
significant difference between the companies that disclosed IC information and the rest of
the population with regard to employee size or shareholder equity. Bontis referred to IC
language as being a necessary antecedent to the development of IC statements in Canada,
as that country seemed to be behind its Scandinavian counterparts and argued that there is
not much in Canada bringing together the ideas of management and disclosure. A
recommendation of the study was made to the corporations concerned about their
relationship with the capital markets. Those companies were encouraged to develop
strategic and tactical plans that make way for the voluntary disclosure of IC.
Furthermore, Bontis and Fitz-enz (2002), in their paper, detail the results of their
“ground-breaking” research study measuring the antecedents and consequents of
“effective” HC management. They stated that the purpose of their research was to
integrate constructs from the fields of intellectual capital, knowledge management,
human resources, organizational behaviour, information technology, and accounting in an
effort to expose a more holistic perspective of organizational performance. The study
provided definitions of key constructs and had five identified objectives including the
desire to reconcile the use of economic and perceptual measures of HC and its
antecedents into triangulated indices yet to be measured; to determine path coefficient
relationships between constructs that are developed from an overall conceptual model
based on academic and practitioner literature; to benchmark the relative standing of the
participating organizations, so client human resource may be reallocated more
effectively; to establish a research trajectory, more advance and innovative than anything
57
currently considered in the fields of IC or knowledge management; and, to set a base line
for trending, norming, and forecasting the human and financial capital links.
The first phase consisted of the collection of quantitative data on revenue, profit,
number of employees, turnover, and training information. This was to tap into the four
constructs of human capital effectiveness, human capital valuation, human capital
investment, and human capital depletion (Bontis & Fitz-enz, 2002). The second phase
involved the distribution and completion of a qualitative survey consisting of perceptual
items and questions based on Likert-type scales. This survey instrument was used to
describe fifteen latent constructs including employee satisfaction, employee motivation,
human capital, and management leadership, just to name a few. Seventy six senior
executives from twenty five companies took part in the research study.
The quantitative and qualitative measures were integrated in the study to realize a
more holistic and comprehensive understanding of human capital management (Bontis &
Fitz-enz, 2002). The result of the study was a complex structural equation model. They
succeeded in creating a holistic causal map integrating constructs from the fields of
intellectual capital, knowledge management, human resources, organizational behaviour,
information technology, and accounting. Referring to the causal map created, Bontis and
Fitz-enz afford participating researchers and academics a better ability to assess a
company’s human capital capabilities and ensure they are better equipped to carry out the
efficient allocation of resources relating to human capital management. They have been
successful in identifying a positive relationship between IC and firm performance.
However, with regard to the market value of a corporation, Ballow, Burgman, and
Molnar (2004) assert that at any point in time, the share price of a corporation

58
incorporates the current market value of the corporation and its future growth prospects.
They assert that corporations “infer the sum of their future value from the excess of the
market’s valuation of their company over what its current performance would warrant”
(Ballow et al., 2004, p. 27). In demonstrating that future value is considered in the share
price of a stock, Ballow, Burgman, and Molnar refer to the EBay Corporation as an
example. In their demonstration, they propose that the market value of EBay at $US31
billion dollars is made up of its current value at $US2.7 billion (9 percent of total value)
and its future value at $US28.3 billion (91 percent of total value).
In their research, Guthrie and Petty (2000) discuss public disclosure with respect to
the intangible assets of Australian firms. They focus on how Australian firms respond to
the challenge of reporting intellectual capital. Using content analysis methods and
empirical data from the annual reports of the top twenty Australian listed companies as at
the end of 1998, Guthrie and Petty report on the scope of IC disclosed in the annual
reports in comparison to those of European companies. In carrying out the empirical
research, they utilize the framework for understanding IC developed by Sveiby (1997).
They report that the primary areas of IC reporting “focus on human resources; technology
and intellectual property rights; and organizational and workplace structure” (Guthrie &
Petty, 2000, p. 241). Through their research, Guthrie and Petty found that the formation
of a model for reporting intangibles is not broadly spread and that information on
intangible assets is not reported within a standardized framework. They suggest that
while companies may want to manage and develop their IC, they are unaware of the tools
available for measuring the change in their intellectual capital accounts. Guthrie and
Petty also conclude that companies don’t report IC externally as they may regard the

59
development of IC as an internal management issue, external to the extent of annual
reporting.
Abdolmohammadi (2005) also studied the prevalence of reporting on the
components of IC by a number of US Fortune 500 companies over a time frame of five
years, from 1993 to 1997. He used content analysis of 284 corporate annual reports to
investigate the type and frequency of IC disclosure by 58 companies from both old and
new economy sectors within the USA. The purpose of his study was firstly to create a
descriptive framework of the components of IC in the annual reports of those firms and
secondly to understand the effects of such IC disclosure on market capitalization. In
doing so, he firstly carried out a literature review to categorize the components of IC. He
used the work of researchers such as Sveiby (1997) and Guthrie, Johanson, Bukh, and
Sanchez (2003) to create the ten broadly defined categories of IC. This was needed as the
components of IC represented his unit of analysis. Abdolmohammadi surmised that the
components of IC included brand, competence, corporate culture, customer base,
information technology, intellectual property, partnership, personnel, propriety process
and R&D. He found that there was high variance in disclosure between companies and
sectors and that the incidence of information disclosure on brand and proprietary
processes had improved over the period in question. He also found important differences
between the economy sectors with regard to the IC components. IC components of brand
and partnerships differed where there was more disclosure by old economy sector and,
information technology and intellectual property differed where there was more
disclosure by the new economy sector, such as with software companies. He also used
regression modelling with IC disclosure, return on assets (ROA) compared to industry

60
averages, and company book value information to assess the relationship between IC
disclosure and market capitalization. He found that the effect of IC disclosure on market
capitalization was positive and highly significant and represented an incentive for
companies to provide voluntary disclosure. However, he did indicate that the cost to
companies of voluntary IC measurement and reporting was not taken into consideration
and could not be assessed for its detraction from disclosure.
In summary, the IC of an organization is understood to have the potential to impact
positively on the market value of a company and on its financial performance (Chen et
al., 2005). However, public legislation in Australia, as in most countries, does not
mandate IC information disclosure, including information relating to HRC and RC, in
corporate annual reports. This causes a deficiency of disclosure on strategically
important organizational resources and actions (Guthrie, Boedker, & Cuganesan, 2005).
The expectations and needs of the information users are often not met by companies and,
as a result, investors experience difficulty in analysing and comparing the information
that is provided to them. As a causal link has been identified between IC and business
performance, researchers have argued for the inclusion of IC information in corporate
annual reports, either directly or as subsidiary reports. Companies that create strategic
and tactical plans to voluntarily disclose IC information, through their corporate annual
reports, have the potential to be rewarded in their relationships with investors and with
the capital markets.

61
2.2.6 Stakeholders’ perceptions about the disclosure of IC information in the
corporate annual reports.
Ax and Marton (2008), in their research paper, documented the results of their
exploratory study into the relationship between human capital disclosures in corporate
annual reports and human capital management practices. Their research was the first to
link human capital disclosure in the corporate annual report and ‘internal’ human capital
management practices. They found that, regardless of whether IC information was
actually disclosed or not, there existed a significant relationship between internal
management practices and companies’ perceptions of importance of such disclosure.
Their research study included the use of two sets of data, including data on the
comparative content analysis study on the quantity of human capital disclosure, collected
from annual reports from a single year, and data on management practices, collected
through an emailed questionnaire. Ax and Marton investigated the top 16 traded
companies listed on the Stockholm Stock Exchange (SSE). The results of the study
showed that there was a limited relationship between the two data sets. While they
demonstrated that there was a significant association overall, further testing demonstrated
no systematic associations.
It has been argued that IC reports contribute to the improved transparency of
organizations by allowing them to illustrate their unseen value and long term
development options (Alwert, Bornemann, & Will, 2009; Edvinsson & Malone, 1997), as
small to medium sized enterprises (SMEs) increasingly create and use IC reports to
improve their management abilities and disclosure practices. Alwert, Bornemann and
Will (2009) conducted a study into the behaviour of analysts with regard to whether they

62
were impacted by information in the corporate IC reports of small to medium sized
companies. Focusing only on German companies, the researchers were attempting to
assess whether their IC reports had any influence on how analysts rated the future
earnings potential of the companies studied. Their data was collected from the
experience of SMEs in Germany and the banks they deal with, their capital market
partners. In conducting their research study, the researchers carried out a review of the
existing literature in the field, focus groups on corporate evaluation with nine financial
experts, a quantitative survey completed by 68 respondents from banks and chartered
accountants for validation and refinement of their research and two case study based
experiments involving seventeen bankers, auditors and financial analysts from leading
German financial institutions and chartered accountants.
The aim of the research was to determine the importance of the IC of the companies
to the analysts in their assessments of corporate values (Alwert et al., 2009). In doing so,
the researchers had to investigate whether IC reports had a significant influence on the
evaluation process; they investigated whether the way the IC reports are set out, how long
they were and what they included were viewed favourably by the capital markets; they
investigated whether IC reports resulted in a more precise evaluation of a company’s
credit rating and future earnings potential. The research study resulted in a number of
key findings. Firstly, the initial questionnaire survey yielded results regarding the basic
requirements for IC reports. Financial analysts from banks and other financial
institutions and auditors share the same requirements to an IC report. Yet, financial
experts have other expectations for IC reporting than corporate management. This is
particularly important for the relative importance related to the various factors of

63
influence. Additionally, investigating the specific requirements of financial analysts
regarding the content and set up of IC reports resulted in the finding that qualitative
descriptions are considered important as is information on indicators which enable
analysts to quantify the information. Indicators of high relevance for most analysts were
identified as was the need for timely information on indicators to ensure the value of the
information. The study found that the basic elements of an IC report need to cover the
business environment, business strategy, and a multi-faceted analysis of IC as well as
planned measures to improve IC to achieve the strategic objectives of a corporation.
They also concluded, in reference to the desired length of IC reports, that they should not
be more than ten pages. Through their case study experiment used to understand how IC
reports influence how financial analysts value a company, they found that by adding
subsidiary IC reports to traditional annual reports enables more homogenous results in the
credit ratings of companies and more homogenous results in the expert assessment of the
future development of companies. They also found that additional data does not always
result in a better rating because it increases transparency regarding both the strengths and
weaknesses of a company.
Generally, the findings indicated that IC reports reduce risks for banks and financial
institutions because they result in a more homogenous assessment of the company.
Alwert, Bornemann, and Will (2009) were able to conclude that IC reports could improve
accuracy and fairness in the process of capital-raising for both SMEs and banks. Also,
they did suggest that an IC report on its own is perceived to be of little benefit to users
which puts the focus on the need for the integration of the information within the annual
reports. They suggested that combining the annual report with IC report fulfils the

64
requirement for efficient communication with the capital markets and this reduces risks
for investors, banks and SMEs. They assert that the findings of the study may be used to
further expand and adjust IC reports to balance the annual reporting in line with analysts’
requirements. However, they fall short of suggesting whether the IC report should be
integrated into the annual report or if it should be part of the explanatory section of the
annual report.
Both internal and external stakeholders represent groups that legitimately require
information on the IC of corporations. Management and employees, investors, customers
and suppliers may have different perceptions about the importance of IC information
disclosure. With specific focus on investors, the 2004 Australian Share Ownership Study
conducted by the Australian Stock Exchange (ASX) (ASX, 2005) has shed some light
into the investment choices and actions of Australian investors. The information
published in April 2005 provides an overview of trends in investment. The study was
undertaken to benefit the share market as a whole and to provide the ASX and the brokers
with an improved understanding of the investment landscape and how it changes over
time. In conducting the survey, the study measured three categories of shareowner, direct
share ownership only, indirect share ownership only, and both direct and indirect share
ownership.
The ASX used a sample of 2,402 randomly selected adult Australians who owned
shares, from across Australia and resulted in a number of findings relevant to this
research study (ASX, 2005). The study achieved two outcomes. The first outcome was
that the study was able to track the incidence of share ownership in Australia, providing
the range of the demographic, behavioural, and attitudinal profiles of investors. They
65
were able to conclude that Australian investors were trading more often, on average
seven times per year, and that the average value of trades had increased by roughly five
percent since 2003. The study found that 55 percent of adult Australians had shares as
part of their investment portfolios (23 percent with direct share ownership only, 11
percent with indirect share ownership only, and 21 percent with both direct and indirect
share ownership). At that time, 44 percent of the adult Australian population reported to
own some direct shares, this representing the highest level of retail share ownership in the
world. The second outcome was that the study was successful at measuring how
investors interacted with their brokers, what type of brokers they used, and whether they
used their brokers as a source of advice.
When surveyed, investors cited the main source of advice on shares as coming from
newspapers (44 percent), family and friends (33 percent), financial planners (30 percent),
and magazines (25 percent), and finally brokers (20 percent) (ASX, 2005). It was also
concluded that while most Australians were happy with their choice of brokers, 28
percent preferred using a discount/non-advice or internet brokers as their main brokers.
However, in referring to sources of advice most influential in decision-making,
newspapers, family and friends and financial planners were each nominated by 17 percent
of respondents, while only 10 percent of respondents nominated their brokers. In
addition to the empirical evidence, the study included a qualitative component. The
results of the quantitative component indicated that the attitudes of investors toward share
investment and ownership was positive and that it would be likely to continue to be so for
the short term as a result of a strong economy and good company profits.

66
Again in May 2007, the ASX released the results of its 2006 ASX Share Ownership
Study (ASX, 2007). In that study, the tenth in the series, they used a sample of 2,405
randomly selected adult Australians from across Australia to take part in a telephone
survey. They were able to conclude that while fewer adult Australians (46 percent) had
shares as part of their investment portfolios (either directly or indirectly) than in 2004,
they were more active, sophisticated and knowledgeable. The drop in share ownership
was attributed to several factors which included the departure of passive investors, a need
to repay debt, disappointment with shares or funds, disinterest and ignorance (among
other reasons). The main reason cited for holding shares was to accumulate wealth. The
study also referred to a growing prevalence of overseas shares and a rise in the average
number of companies held by investors. They also found marked improvements in
shareholder knowledge and the overall attitudes of shareholders to investment remained
positive.
Again, investors cited the main source of advice on shares as coming from
newspapers, friends and family and financial planners/advisors, followed by stock
brokers, the internet, investment newsletters, accountants, work colleagues, magazines,
radio, and some other sources (ASX, 2007). The study found that typical direct
shareholders were just as likely to be male as female, aged at least 35, with tertiary
qualifications, who made at least $AUD100 000, from any area (less so from
Queensland) and from capital cities.
Finally, while the ASX (2005) study found that investors were increasingly savvy
with their investment decisions and that their primary motivation for investment was the
67
accumulation of wealth, the study uncovered no information was about the perceptions of
importance of HRC and RC information specifically by individual shareholders.
With regard to corporate investments, it is evident that if corporate wealth is being
attributed to intangible assets, investors are not assessing just the company profits in their
investment decision making. Both ASX (2005, 2007) studies were important to shed
light on the investment choices of Australian shareholders. The studies helped to
highlight investment trends. It is reasonable to assume that there are many factors which
will determine the actions of investors. In talking to individual investors, one recognizes
they speculate on the value of shares based on a range of both financial and non-financial
factors. While the market-to-book value (MBR) ratios of corporations rise and fall, share
ownership in Australia also continues to rise and fall, and it is important for stakeholders
to understand the trends in the market to improve their potential for success.
Furthermore, this research recognises that investors make a range of decisions
regarding investing in publicly listed stocks. Such decisions, however, may be regarded
as rational or irrational in nature, and as unique as the people who make them.
Traditionally, rational economic theorists have argued in support of the theory of
Efficient Market Hypothesis (EMH) which suggests that shares of publicly listed stocks
are traded on their fair values on stock markets and that it is virtually impossible to
purchase undervalued shares or to sell shares for more than what they are worth (Malkiel,
2003; Van Bergen, 2004). In attempting to increase returns on investment, EMH
attributes no value to the effect of shareholder expectations which may be derived from
information that is only available to some stakeholders. That is, the theory makes the
contention that investors think and act rationally in their stock investment decisions and

68
assumes that corporate information is equally available to users. Information asymmetry
goes unrecognised when EMH is applied. This current research study, however, is driven
by previous research such as that conducted by Lev (2001) that contends that information
asymmetry does exist, that it produces uncharacteristic gains to informed investors, and
that it chips away at investor confidence in the integrity of capital markets.
Contrary to EMH, and aligned to what has been presented thus far, behavioural
economic theories infer that information asymmetry does exists and that investors are not
always rational in their stock transaction decisions (Daniel, Hirshleifer, &
Subrahmanyam, 1998, 2004). Behavioural finance has been used to explain market
bubbles and market crashes and infers that market reactions may be attributed to several
cognitive biases including self-attribution, overconfidence, overoptimism, herding, and
noise trading, to list a few (Daniel, Hirshleifer, & Subrahmanyam, 1998, 2004).
Daniel, Hirshleifer, and Subrahmanyam (1998, 2004) analysed evidence from a
variety of cognitive psychological experiments and from surveys that demonstrated ways
in which people overestimate their abilities in a variety of contexts. This was requisite to
their goal of developing a theory to explain investors’ decisions related to security
markets. They were concerned with accounting for both instances of rational and
irrational decision-making and for the potential for decisions to be influenced by
cognitive biases of investors. The researchers focused specifically on cognitive biases
including investor overconfidence and biased self-attribution. They contended that
investors, while tending to be “quasi-rational” made errors based on their biases, and that
the turbulence and volatility of stock markets may be better understood when the various
cognitive biases were considered.

69
Daniel, Hirshleifer, and Subrahmanyam (1998, 2004) proposed a theory that
inferred that stock investors overreact to private information and under-react to public
information signals due to their biased self-attribution and over-confidence. They
contend that behavioural economics is a complement to rational economic theories by
providing insight into instances of irrational consumer decision-making and behaviour.
In part, this current research study will refer to both EMH and behavioural economic
theory in an attempt to understand the findings in relation to the perceptions and actions
of “mum and dad” shareholders regarding HRC and RC dimensions information and its
impact on their ABSC stock transaction decisions and on the ABSC share prices.
In summary, researchers contend that IC reports enhance the transparency of
organizations by permitting them to illustrate their hidden value and long term
development options (Alwert, Bornemann, & Will, 2009). In light of this, researchers
have studied the behaviours of various groups, including analysts and bankers, the
perceptions of management and the perceptions of accountants in relation to the
importance they place on the disclosure of IC information in corporate annual reports, to
their assessments of corporate values. Research by the ASX (2005, 2007) has provided
an insight into the demographic information and investment actions of Australian
investors in the ASX listed companies, and behavioural economic theories and the field
of behavioural finance provide a lens through which the research results may be
explained. What is generally lacking, however, is information into the perceptions of
“mum and dad” investors, specifically, what they believe their HRC and RC information
expectations and needs are, and how valuable they perceive the IC information provided
in corporate annual reports to be to their stock transactions. Therefore, this represents a
70
gap in the research and the potential for the further expansion of knowledge in the field of
IC management and reporting.
2.2.7 How to assess the impact of IC information on share prices –
Methodology.
Many researchers have studied the impact of events and announcements on share
markets and individual share prices. Event windows have been used successfully by past
researchers when assessing the impact of specific events on share prices (Barnes & Ma,
2001; Desai, 2000; Dumay & Tull, 2007; Lonie, Abeyratna, Power, & Sinclair, 1996).
In the UK, Lonie, Abeyratna, Power, and Sinclair (1996) used a conventional event study
methodology in examining the stock market reaction to the firm-specific event of a
dividend announcement. The actual share return was compared with the expected share
return surrounding the annual dividend per share announcement period to see if any stock
market reaction occurred. Lonie et al. (1996) followed De Angelo and De Angelo (1990)
by focusing on the annual and not the interim dividend information as they concluded
that statistical analysis and questionnaire survey evidence from managers suggests
dividend policy is determined on a yearly basis. In their study, they used the daily share
return information to assess the presence or lack of abnormal share performance in the
event window surrounding the dividend announcement day (Lonie et al., 1996). They
used “day t – 1 to the day t” as the designated announcement period, where t is the day
the dividend was published. These days were jointly defined as the announcement period
because the disclosure of the dividend information to the market may have happened on
the day before the formal reporting of the news in the press. Their study looked into the
dividend announcements of 620 companies. While Lonie et al. used the event window to

71
assess the impact of the release of dividend information on corporate share holdings,
other studies assessed the impact of other financial and non-financial information on the
share prices of listed corporations.
In their discussion paper, Barnes and Ma (2001) assert that the event study is the
usual methodology employed to evaluate the reaction of share prices to public
announcements, used as early as 1933. They contend that the improved sophistication of
event studies enables researchers to understand the impact of the information released to
stakeholders by first determining an “event window” or “estimation window”. The
“event” is what has occurred to potentially influence the share prices. For the study by
Barnes and Ma, the focus was on the Chinese stock market the event was the
announcement of bonus proposals or approvals. The event window is when the
happening of the event is announced. The event window in their study was combined
with the day of the announcement and the days before and after the announcement day,
expressed as –1, 0 and +1. The abnormal returns occurring during the event window and
the abnormal returns occurring in the periods around the event window were investigated
to evaluate whether the market anticipated the information (or implied inside
information) contained in the event, while the abnormal returns in the interval after the
event window served to demonstrate whether the market over- or under-reacted to the
event. Barnes and Ma were able to conclude that the direction and magnitude of the
stock price reaction to the announcement of bonus issues does depend upon the specified
bonus schemes.
Their study presents evidence of the stock prices reacting properly to the
announcements for the middle-bonus proposals of A-shares, for the large-bonus proposals
72
of A-shares, for the small-bonus approvals of A-shares, and for the small-bonus and
middle-large-bonus approvals of B-shares. Under-reaction is evident for the small-bonus
proposals of A-shares, and the overall bonus approval of B-shares, and, overreaction is
uncovered in the overall bonus proposals of A-shares and in the overall bonus approvals
of B-shares. They suggest that it is not right to refer to the entire market as semi-strong
form efficient, and, as for previous studies on the other markets, the assessment here is
unable to take account of trading with insider information as “insider trading can manifest
itself in the form of significant cumulative abnormal returns (CARs) in the intervals
before an announcement date” (Barnes & Ma, 2001, p. 25). This is an understandable
limitation of this study and any similar studies as one cannot know for sure about the
impact of insider trading on data relating to CARs.
Preceding and similar to Barnes and Ma (2001), and Desai (2000) also utilizes an
event study methodology to examine the market values of companies during the time
period that the companies revealed information about their strategic planning focus,
function and/or orientation. In wanting to assess the value of strategic, long-term
planning to corporations, Desai conducted an empirical investigation into the impact on
share prices of share investment decisions and announcements relating to changes in the
overall policies of companies. Fundamentally, the study combines the strategic planning
perspective with the concepts derived from literature relating to corporate finance. Of
interest to the researcher were the perceptions of the stock market in relation to the
existence of established strategic planning practices. The research by Desai was
specifically set out to test whether strategic planning was rewarded by the stock market.
The research results demonstrate that the stock market favoured the long range-planning

73
horizon adopted by companies. Desai found that on average, the announcements
indicating an emphasis on the institutionalized strategic planning by companies were
linked with increases in the corporate stock prices. He concluded that the indicative
reaction on the day of the announcement demonstrates that the market reacts efficiently to
these announcements, and the reward is instantaneous.
Most recently, Dumay and Tull (2007) examined whether the disclosure of IC
elements through “price sensitive” disclosures to the Australian Stock Exchange (ASX)
has an effect on the short-term share price of a firm. They too used empirical “event
studies” for the 2004 to 2005 financial year, as components of intellectual capital were
used to classify price-sensitive company announcements to the ASX, and to examine any
relationship between the disclosure of human, internal, and external IC and the
cumulative abnormal returns (CAR) of a firm’s share price. Disclosure of IC elements in
price sensitive company announcements can have a significant effect on the CAR of a
company’s share price as the market was found to be most responsive to the disclosures
of internal capital elements. Their research was limited to an analysis of the Australian
stock market for a period of one year and did not look at the timing of announcements as
a variable and it did not consider disparities in regulation or operations involving other
stock markets.
In summary, researchers have used event windows to study the impact of events
and announcements on share markets and individual share prices. Event study windows
represent a conventional methodology in examining stock market reaction to the firm-
specific events. Research conducted by Barnes and Ma (200), Desai (2000), Dumay and
Tull (2007), and Lonie et al. (1996) provided precedent for methodology for part of this

74
research study. An event study window was used in assessing if IC disclosure by the
ABSC, within the context of their annual reports, has a positive relationship with the
share prices of the banks for the period in which they were studied.
2.2.8 The reporting of HRC and RC information by Australian corporations.
Most researchers are in agreement about the importance of IC and its capacity to
facilitate corporate effectiveness and improve corporate value. The critical intangibles
such as the company’s ability to maintain and attract key employees, its innovative
capacity and its customer approach are the indicators to be measured in relation to the
leveraging of corporate growth (Bukowitz, Chaminade, Jensen, Roberts, & Williams,
2003). For Australian organizations, as for the rest of the world, it is evident that “there
is pressure on fund managers and equity analysts from stakeholders to understand more
complex “soft” variables such as management quality, leadership, remuneration and
corporate governance” (Royal & O’Donnell, 2004, p. 14). Royal and O’Donnell assert
that the need for hard analysis of soft variables generates further questions such as:
“How can qualitative data on corporate behaviour and other soft variables be made
available to analysts, given the continuous disclosure rules?”, “How can corporate
behaviour be analysed systematically?”, and “Do analysts have to be devious or simply
creative when gathering soft variable data?”. Royal and O’Donnell recognize that the
analysis of human capital is tremendously important for general managed funds and
securities analysts as this enables them to anticipate future events within corporations.
They suggest a structured form of human capital analysis or what they refer to as
sustainable human capital classification (SHCC) as an indicator of future corporate
performance rather than an analysis of purely financial data which provides only

75
historical performance measurement. However, what Royal and O’Donnell propose may
be valid for both analysts and individual shareholders depending on the perceptions held
by individual shareholders.
The theorizing on the concept of human capital analysis has served as the precursor
to the contemporary research by Royal and O’Donnell. Most notably, research by Royal
and O’Donnell (2008) involved the conducting of a case study analysis in an attempt to
understand how organizations, and their main stakeholders, may take advantage of an
enhanced understanding of the role of intangible assets. Their case study involved the
development and testing of four tools to be used in human capital analysis. The four
tools included a macro analysis of drivers of the value of human capital conducted
through observation of trading floor actions in Australia and Hong Kong and interviews;
a human capital systems wheel used to isolate human capital systems that support
strategy; a human capital rating relative to industry best practice; and, a human capital
SWOT analysis pertaining to human capital in companies within the Australian
biotechnology industry, for example, plotting of leadership styles. The tools were
designed for all investors to use, both the professional and non-professional investors.
The focus of the research was on how intangible assets, human capital in particular, have
the power to create corporate value for organizations. With reference to key stakeholder
groups, financial institutions were regarded by the researchers as key stakeholders of the
biotechnology firms. They were involved in the study to the extent that Royal and
O’Donnell suggest they face the challenge to create innovative investment products
established on analysis of intangible assets which include human capital.

76
“Human capital analysis provides opportunities for financial analysts, traders and
fund managers to potentially recognize the resilience of a listed stock, ahead of
time. The secret to investors’ performance, irrespective of their role in the market,
lies within each individual’s ability to read all the information, quantitative and
qualitative, based on tangible and intangible value creation processes and act upon
this information in a timely way. These tools assume that information on
intangibles is available in the public arena. This is increasingly the case, as
technology expands in depth and breadth and intangible information on listed firms
increases exponentially”. (Royal & O’Donnell, 2008, p. 680)
Royal and O’Donnell (2008) regard human capital as a lead indicator of a
corporation’s future financial performance and suggest that a requirement for qualitative
research specialist expertise in finance houses may exist. They use qualitative data from
the trading floor of Merrill Lynch in Sydney and Hong Kong, focusing on participatory
action research. Their study also relies on field research interview data with executives
from the Australian biotechnology sector, utilizing a case study approach. Their research
also involves the description of an evolution of a set of analysis models relating to
corporate human capital and the application of the analysis models to the biotechnology
sector. As a result, Royal and O’Donnell assert that the results demonstrate that it is
possible to analyse and interpret qualitative information about public corporations to
enable the investment process to be increasingly transparent to all stakeholders, including
securities analysts. They suggest that this may sway other researchers in the field to
extend these approaches in an attempt to enhance the quality of intangible asset analysis,
to make the tacit assets more explicit. Their research supports their contention that

77
information on human capital is valuable and that it is being used unsystematically by
equity markets and hedge fund managers in their investment decision processes. Their
research findings also suggest that a human capital lens proposes a systematic approach
to examining the future potential performance of listed stocks and can be utilized as a
type of risk management which is critically important to knowledge-intensive
corporations. The research findings indicate that the financial sector may be required to
push past the use of indices and ethical investment screens to provide a better
understanding of the role of intangible assets, such as human capital, in corporate value
creation and improvement. The results indicate that more qualitative information on
listed companies can be analysed and interpreted to make the investment process more
transparent to all stakeholders, including securities analysts. This may influence other
researchers to extend these approaches to improve the quality of intangibles analysis.
Royal and O’Donnell (2008) deemed their research as valuable in adding to the
literature by producing theoretical links between the independent disciplines of SHRM,
the analysis of intangible assets, and innovation in investment. They apply their HC tools
as a link between a resource-based analysis of the firm and an investment perspective.
Their HC tools take on the idea of having HC as a lead indicator of future financial
performance. They provide a fundamental analysis approach to the assessment of
intangible assets in listed companies. Royal and O’Donnell used qualitative, systemic
information, analysed in a systematic way. Their HC analysis tools correspond to
elements of intangible asset analysis framework. Royal and O’Donnell were successful
in ensuring their approach to HC analysis was relevant to any regulatory environment by

78
focusing on management systems as their unit of analysis, and by focusing on practical
analytical methods; by using information that was publicly available.
Also, as mentioned previously in this chapter, Guthrie and Petty (2000) were
successful in building on the research in the field of IC reporting by using content
analysis in the inquiry into the level of intellectual capital disclosure by Australian firms.
Guthrie and Petty found that Australian firms lagged behind Scandinavian firms in the
reporting of IC information in annual reports. It is valuable to understand how Australian
corporations compare with others both in terms of the measurement and reporting of IC
and in terms of our perceptions about the importance of IC information disclosure. By
using content analysis methods to assess the level of corporate disclosure on IC from the
annual reports of the top twenty Australian listed companies, as at the end of 1998,
Guthrie and Petty reported on the scope of IC disclosed in the annual reports to carry out
a comparison with those of European companies. In carrying out the empirical research,
they utilized Sveiby’s framework for understanding IC, in which the IC is recognized as
being a focus on human resources, or technology and intellectual property rights, or
organizational and workplace structure (1997; Guthrie & Petty, 2000). As mentioned
previously, Guthrie and Petty criticized the lack of a standardized model for corporations
to report on their intangibles and concluded that corporate managers tend to link the
development of IC with internal management practices, not necessarily an external
concern worthy of inclusion in corporate annual reports.
As the substance of the disclosures made by companies in their annual reports
continues to be a topic of interest to many researchers, Guthrie, Petty, and Ricceri (2006)
conducted an empirical, two-stage study to investigate the voluntary reporting of IC by

79
listed companies in Australia and Hong Kong and to evaluate size, industry and time
effects on IC disclosure levels. Stage one was an exploratory study of voluntary IC
disclosure for the 20 largest listed Australian companies in 1998, and Stage Two, using
2002 data, examined voluntary disclosure of IC attributes for 50 listed companies in
Australia and 100 listed companies in Hong Kong. The researchers used content analysis
to collect the data and wanted to build on previous research linking the reluctance to
report on IC items to making IC rich companies appear less valuable than they actually
are (Guthrie & Petty, 2000; Guthrie et al., 2006). Guthrie, Petty, and Ricceri assert that
seldom is it the case that the value shown in the books of a company even closely
resembles actual market value. The aim of their study was to gain a better understanding
of this problem, and in the hope of improving disclosure and reporting practices, they
used content analysis to study the voluntary disclosure of IC by large listed companies in
both Australia and Hong Kong. The content classifications and material used for the
content analysis were categorised as per Sveiby’s (1997) IC Framework, which is made
up of three components: internal structures (organisational capital); external structures
(customer/relational capital); and employee competence (human capital). Guthrie, Petty,
and Ricceri assert that as an earlier study into IC disclosure used content analysis to
obtain IC data from annual reports (Guthrie & Petty, 2000), many later studies have also
used this research method to collect a range of empirical data. Guthrie, Petty, and Ricceri
refer to the research conducted in Australia (Guthrie & Petty, 2000), Hong Kong (Petty,
2003a), Italy (Bozzolan, Favotto, & Ricceri, 2003), Sri Lanka (Abeysekera & Guthrie,
2004), Ireland (Brennan, 2001), and Sweden (Olsson, 2001).

80
The researchers chose to focus on the reporting practices of the companies
following on from the results of the 1998 Australian study in which the literature review
and early investigations revealed annual reports to be a key communication tool used to
legitimize corporate activity (Guthrie et al., 2006; Lang & Lundholm, 1993). This is why
they chose the annual report was as the primary source for examining voluntary
disclosure. Their published results of the exploratory 1998 Australian study (Guthrie &
Petty, 2000) established a methodology and developed a recording instrument that has
been used in its pure or derivative form in several other studies since (Bozzolan et al.,
2003; Brennan, 2001; Guthrie et al., 2006). The second stage of the study uses a larger
sample size than the previous studies, uses data taken from companies listed in Asia, and
is the first study to compare data from two countries in the broader Australasian region.
As a result of the study, researchers found that levels of IC disclosure were low in
qualitative rather than quantitative form in both Australia and Hong Kong and that
disclosure level was positively related to company size, which is consistent with the
previous research on voluntary reporting. However, the study does indicate that as a
limitation or implication of the research, external validity may be somewhat
compromised by the relatively small sample size and by the inference of management
intent as managers were not observed in the process of making decisions.
With reference to some of their findings, Guthrie, Petty, and Ricceri (2006)
concluded that Australian companies in 2002 disclosed greater IC information than
Australian companies in 1998 and Hong Kong companies in 2002. Yet, in the three
studies, every instance of IC reporting involved expression in discursive rather than in
numerical terms. There is no clear attempt to translate the rhetoric of IC reporting into

81
benchmark measures that help the performance of a company in managing IC to be
assessed in a systematic fashion. This is quite difficult to put a numerical value on what
is, in many cases, fundamentally a qualitative item. This finding was not unexpected.
The low incidence of quantitative expressions of IC items seems to support the widely
held belief that companies are not motivated to assign dollar values to IC. Also, it was
concluded that the most voluntary IC disclosure was in the “business/operational” section
of the annual report. In all the studies, the external capital category is the category with
the greatest level of disclosure. Theoretically, the research study provided an overview of
the evolution of IC reporting over a period of four years, suggesting that there is a
growing awareness of the need to report IC. Also, it provided useful comparative
insights into IC reporting, by comparing the findings using Australian and Hong Kong
data. From a practical point of view, the study may help regulators to evaluate and
establish mandatory disclosure. The study confirmed that a common accepted framework
for IC reporting is needed and that market forces, on their own, are not enough to ensure
company stakeholders get all the information they need.
Also recently, Petty, Ricceri, and Guthrie (2008) were able to offer an empirical
assessment of how a group of financial professionals in Hong Kong used IC information,
and how valuable they perceived IC reporting to be. The researchers wanted to
understand the group’s ability to privately obtain information that had the potential to
help them determine the value of a company’s IC in support of their decision-making.
The researchers used a questionnaire that was designed using Kelly’s Repertory Grid
procedure for extracting the respondents’ vocabulary (Kelly, 1955). Kelly’s procedure
ensures that the vocabulary used in a survey instrument is consistent with vocabulary the

82
respondents are familiar with and would ordinarily use to describe a particular concept.
Eighteen respondents pre-tested the questionnaire, which contained 20 questions, as a
check on wording, clarity and construct validity. Three of the questions were open-ended
and the rest of the questions were closed but several permitted the respondents to expand
on their answer. The survey was administered randomly to 238 members of CPA
Australia, during professional development sessions and office visits in 2004.
The surveys were administered face-to-face as a control on the identity of the
respondent and on the integrity of the data (Petty et al., 2008). Random data collection
procedures were followed as much as possible by randomly choosing and attending
compulsory professional development events attended by the members of CPA Australia
in Hong Kong, as the researchers aimed to collect information that would describe
practice as well as enable suggestions to be made regarding the regulation of financial
reporting. Petty, Ricceri, and Guthrie found that the results of the survey clearly indicated
that respondents did not find information provided by the traditional financial accounting
model all that useful and that this set of results agrees with the literature that suggests the
lost relevance of accounting data. Yet, despite this finding, the researchers were able to
conclude that those members of CPA Australia, who work in Hong Kong, were still using
the annual report to learn about a company. They were also able to conclude that the
respondents would prefer companies to be more transparent and provide more
information about their IC. Respondents think that increased IC disclosure would be
rewarded with an increase in the company’s share price – even though few respondents
thought that they would pay more themselves for enhanced disclosure. The researchers
also found that most respondents seem to be addressing their IC information needs
83
through private information channels, and regard the publicly provided information as not
well suited to their needs. Petty, Ricceri, and Guthrie also concluded that an implication
of their research is the need for greater regulatory control to ensure that the information
that is being communicated privately also enters the public domain in a timely fashion,
and that making market participants more aware of the positive effects of voluntary
disclosure on stock prices may lead to an increase in voluntary disclosure.
Further to the recognition of the corporate annual report as a tool in the
communication of critical IC information is a fairly recent study by Dumay and Tull
(2007) which highlights the impact of IC announcements on the relevant share prices of
Australian corporations. Dumay and Tull examined how companies can disclose their IC
to external stakeholders who have an influence on their share price. The researchers
applied empirical “event studies” methodology for the 2004 to 2005 financial year and
the components of intellectual capital, including internal, external, and human capital,
were used to classify price-sensitive company announcements to the ASX, and to
examine any relationship between the disclosure of IC and the CAR of a company’s share
price. Two event windows were utilized in the study. A two-day event window of the
disclosure date and +1 day was used to assess the immediate reaction of the stock market
to the disclosure and a longer event window of +5 to -3 days from disclosure was utilized
to take into consideration the “anticipation and expectation effects” of the disclosures,
allowing users of the information to absorb it (Dumay & Tull, 2007, p. 242).
Changes in stock prices were measured relative to all or part of the underlying
market to derive the CARs associated with the event; thus event effects were normalized
for movements in the broader market or specific sectors (Dumay & Tull, 2007). The

84
CAR for each stock and each announcement was then analysed by its comparison to the
different market indices. In this study the ASX20 and the ASX200 indices were chosen
for such comparison, as these represent the most widely quoted indices of Australian
stocks (Dumay & Tull, 2007, p. 241). The company shares chosen for analysis are based
on the ASX20 and ASX200, which represent the top 20 and top 200 stocks respectively
with regard to market capitalization in Australia. Dumay and Tull maintain that, on its
own, the ASX20 is made up of over 56 percent of the total value of the ASX, as at 30
June 2005.
Dumay and Tull (2007) refer to Abdolmohammadi’s (2005) empirical study of
Fortune 500 company annual reports which supports the argument that IC disclosure has
an effect on market valuations. Carrying on from that idea, the findings of this study
partially support the argument that, in the context of price-sensitive disclosures to the
ASX, the disclosure of IC is perceived differentially by the market and has a different
valuation effect depending on whether the disclosure relates to human, internal, or
external capital. Dumay and Tull found that the disclosure of IC elements in price
sensitive company announcements can have an effect on the CAR of a company’s share
price as the market was found to be most responsive to the disclosures of internal capital
elements. Their research was limited to an analysis of the Australian stock market for a
one-year period and did not account for the timing of announcements as a variable and it
did not consider differences in regulation or operations relating to other stock market.
The communication of IC measures to external stakeholders, especially those
stakeholders that influence the share price of a company, was of particular interest to
these researchers because the measures of IC value are regarded to be the difference

85
between a company’s balance sheet value and its market capitalization (Burgman &
Roos, 2004; Dumay & Tull, 2007; Fernandez, 2003). Dumay and Tull were able to
conclude that price-sensitive disclosures to the market containing intellectual capital
elements have a marginal effect on the subsequent market valuation of a firm beyond
conventional financial reports and external intellectual capital reports.
Their research supports the argument that companies should examine how they
manage and report on their IC, as, in doing so, both performance and competitive benefits
may be realized (Dumay & Tull, 2007). With this knowledge, more companies may be
encouraged to disclose more information to the market about their internal dealings,
rather than keep them hidden from the view of their stakeholders, as the evidence
supports the view their stakeholders respond favourably to such disclosures. Regular and
timely disclosures also present a method by which firms can share IC information,
without making stakeholders wait until the publication of formal company annual reports
or external IC reports. The limitations of the research by Dumay and Tull also open up
the prospect of further research in the area of IC disclosure in which research is based on
other forms of disclosure such as through company web sites, blogs or promotional
activities. They argue that continued research in areas such as these may add
considerably to the discussion of IC disclosure.
In summary, Australian researchers have used various methods, including content
analysis methods, questionnaires, and event study windows to assess the IC disclosure
practices of Australian companies, the perceptions of accountants as users of IC
information, and share market reactions to IC information disclosure. As a result, they
called for greater transparency in the corporate annual reports of Australian companies to

86
enable all stakeholders to analyse and interpret data to make informed investment choices
(Royal & O’Donnell, 2008). They argued that Australia continued to lag behind other
countries with regard to the IC disclosure practices of listed companies (Guthrie & Petty,
2000). They suggested that the inclusion of qualitative information on tacit IC assets is
valuable and necessary to ensure its systematic use by stakeholders in their investment
choices (Royal & O’Donnell, 2008). They suggested that disclosure on price-sensitive IC
information, in the corporate annual reports did influence share prices of relevant stocks
(Dumay & Tull, 2007). Furthermore, they were also able to conclude that members of
CPA Australia would prefer companies to be more transparent and provide more
information about their IC (Petty et al., 2008). Notably, what was missing from the
research was information about what individual investors were looking for with regard to
HRC and RC disclosure within the annual reports; what “mum and dad” investors are
calling for.

87
Chapter Three
Pilot Study
3.1 An Initial Exploratory Study
There were two elements to this research study, an initial pilot study and a main,
two-part, hypotheses-testing study. For the pilot study, both quantitative and qualitative
data collection and analyses were used. While quantitative research has long been
considered easier to understand and explain, and, as a result, easier to argue (Marschan-
Piekkari & Welch, 2004), qualitative data has the ability to enrich research and to convey
messages and context, especially in the assessment of organizational communication
(Goldenberg, 1996). This is especially true for the fields of Management and
Organizational Development. Qualitative research is undertaken with regard for the
context in which the research is being conducted (Marschan-Piekkari & Welch, 2004)
and has the potential to make an effective contribution to the development of quantitative
diagnostic tools, including of surveys and questionnaires.
The objective of the pilot study was quite specific. The pilot study was designed to
validate a tool to measure the perceptions of individuals, ABSC shareholders, about how
relevant HRC and RC policy information is to their decisions regarding purchasing
ABSC stocks. In order to do this, it was necessary to determine and validate the applied
definitions of the terms to ensure the common HRM functions and activities investigated
were understood from the ‘lay person’ perspective of individual shareholders of ABSC.
The operational definitions were needed to help determine the perceived relevance of
HRC and RC policy information to the corresponding dimensions of HRC and RC. This
was necessary to develop items for the final questionnaire, which would be used to test

88
the statistical reliability and statistical validity of the items for use in the hypothesis-
testing questionnaire. This would ensure the questionnaire was able to measure the
dimensions of HRC and RC properly and consistently.
The objective of the pilot study was achieved in a succession of testing activities.
Figure 3.1 sets out the design of the pilot study.
Figure 3.1. Design of the pilot study
The pilot study followed the literature review which was conducted, in part, to
identify and define the IC dimensions of HRC and RC. Prior to conducting the pilot
study, the researcher documented the academic definitions and explanations of the
constructs and dimensions investigated in this research. This was necessary because,
while academic definitions of the constructs and dimensions exist, individual “mum and
dad” shareholders may not understand the meanings of those definitions. This study
requires “mum and dad” investors to know and understand the constructs under
investigation in this research and to know and understand the definitions of their
dimensions. Hence, to do that, individual investors in ABSC stocks were given academic
Focus Group A Development of
Operational Definitions of Key
Constructs of HRC and RC and of their
Dimensions
Pilot Questionnaire Determination of
Perceived Relevance of HRC and RC Policy
Information to the Corresponding HRC and RC Dimensions
Final Questionnaire Used to Test Statistical Validity and Reliability of Items for use in the
Main Study Questionnaire for Hypothesis-testing

89
definitions to work with and to reword into operational definitions. The results of this
activity are presented in Section 3.3.1.
3.2 Key Constructs and Dimensions - Definitions and Explanations
Prior to presenting a summary of the pilot study activities, it was important for the
reader to obtain a full understanding of key constructs and dimensions used in this
research. Both are elements used in the pilot study, each of which is described in detail in
subsequent sections of this chapter.
In part, this research elicited, through a review of literature in the field of IC, a list
of the HRC and RC dimensions of the construct of IC. The list of HRC and RC
dimensions was used in the pilot study and identified what HRC and RC information
individual investors regarded as relevant to making investment decisions about ABSC.
3.2.1 Human resource capital (HRC).
HRC is defined by Stockley (2005) as the collective attitudes, skills and abilities of
human resources contributing to organizational performance and productivity. The
combined list of HRC dimensions used in this research was extracted from research
performed by Brooking (1996), Edvinsson and Malone (1997), Roos and Roos (1997),
Sveiby (1997), Bontis (1998), Lynn (1998), Becker (2005), Bollen, Vergauwen, and
Schnieders (2005), Chen et al. (2005), and Johanson (2005). The works of these
researchers resulted in a list of HRC dimensions that includes innate human capabilities
including intelligence; learning capability and talent; learned abilities including
knowledge, skills, education from learning from others, education from learning from
training, experience, ability and expertise; management and leadership qualities including
motivation by monetary and non-monetary rewards, creativity and innovativeness;

90
employee values; and problem solving capability including the ability to adapt and the
ability to change.
3.2.1.1 Innate human capabilities.
The word innate is defined as that which is natural to an organism or existing in a
person from birth, inborn, native, or natural, as opposed to that which is acquired (ITS,
2010; Oxford University Press, 1989). The word human, as an adjective, refers to
anything that relates to or focuses on human beings and their experiences (Oxford
University Press, 1998). The word capabilities is defined as undeveloped faculty or
property; a condition, physical or otherwise, capable of being converted or turned to use
(Oxford University Press, 1989). By combining the three definitions, innate human
capabilities are, for the purpose of this research, those undeveloped faculties people have
to use that exist from birth. They are faculties that are inherent, rather than learned.
Researchers found that innate human capabilities include intelligence, learning capability
and talent (Bollen et al., 2005).
3.2.1.2 Learned abilities.
The word learned is defined as things pertaining to, manifesting in, or characterized
by the profound knowledge gained by study (Oxford University Press, 1998). It is
knowledge that is gained through theory, instruction and practice. The word ability is
defined as a faculty or a mental power or capacity (Oxford University Press, 1998). By
combining the two definitions, learned abilities are those faculties or capacities resulting
from the knowledge gained by theoretical and/or practical study. Researchers concluded
that learned abilities include knowledge, skills, and education from learning from each
other, from learning from training, experience, ability and expertise (Bollen et al., 2005).

91
Making a distinction between abilities that are either purely innate or purely learned
is not possible (Howe, Davidson, & Sloboda, 1998). Though it is widely accepted that
certain individuals have extra capacity for learning or reasoning, the ability to understand
or measure those capacities is limited. Innate abilities differ in individuals and account
for the differing levels of achievement by individuals in the workplace; however, it is
impossible to measure, purely, these abilities. It is not possible to separate, completely,
these abilities from those which are learned, as nature and nurture work together in the
development of the potential of an individual (Howe, Davidson, & Sloboda, 1998).
The presence of innate abilities is often inferred (Howe, Davidson, & Sloboda,
1998). This is due to the fact that, even when using various psychometric measurement
tools, it is considerably difficult to assess which are the innate human capabilities and
which are the learned abilities of employees, the result of causal influences (Howe,
Davidson, & Sloboda, 1998). While this research presents definitions of both of these
dimensions of HRC, their existence within corporations must be inferred through a focus
on the employee recruitment and employee retention practices and policies of those
corporations. This is because, in order for organizations to succeed, they need to
facilitate the acquisition of a workforce that demonstrates desired innate and learned
capabilities and skills. This relates to companies in particular because, due to the
requirement to succeed in business, companies must hire and retain a workforce of
appropriately talented and skilled employees. The HR functions of employee recruitment
and employee retention become the dimensions used to assess the activities related to the
innate and learned abilities of employees.

92
3.2.1.3 Management and leadership qualities.
Management is defined as a set of processes that ensures that complicated systems
of people and technology flow smoothly (Kotter, 1996). Leadership is defined as a set of
processes that produces organizations in the first place or adjusts them to changing
situations (Kotter, 1996). Finally, the word quality is defined as the nature, kind, or
character of something; it is an attribute or a manner (Oxford University Press, 1998).
Therefore, by combining the three definitions, management and leadership qualities may
be defined as the nature, kind, character, or manner of those individuals and groups who
use a set of processes that ensure that complicated systems of people and technology flow
smoothly to produce organizations in the first place or to adjust them to changing
situations. Researchers found that this includes the use of motivation by monetary and
non-monetary rewards, creativity and innovativeness (Bollen et al., 2005).
Management and leadership qualities are those traits and qualities that refer to the
character of a person in terms of how they control and guide the overall resources and the
performance of an organization. Specifically, it refers to the will and ability of people or
groups to influence the output of an organization.
Transformational leadership and the successful management of change is a critical
requirement for the success of the overall strategic focus of an organization (Kaplan &
Norton, 2004). Kotter (1996) asserts that leadership is about bringing change and that
effective change requires vision, inspiration and effective communication. It is the
leader who is positioned to energize and support the transformation program of an
organization (Kaplan & Norton, 2004). Aligned with the definition presented, Kaplan
and Norton (2004) have identified leadership competencies that are considered valuable

93
to an organization. These competencies deal with what a leader is and what traits are
necessary for the superior performance of a leader.
As proposed by Kaplan and Norton (2004), desired leadership competencies can be
classified into three categories. These three categories include the ability to create value,
the ability to execute strategy and the ability to develop human capital. The ability to
create value allows the leader to provide the bottom-line results necessary to the company.
The attributes associated with creating value are being customer-focused, understanding
the customers and solving their problems; being innovative and taking risks, challenging
assumptions and proposing novel ways of doing things; and delivering results, for both
customers and shareholders.
The ability to execute strategy effectively, allows the leader to activate and steer the
process of change. The attributes linked to the execution of strategy include
understanding the strategy, clearly defining the mission, vision, values and strategy;
accountability, setting direction and targets and establishing accountability;
communications, communicating openly and providing feedback; and teamwork, the
ability to work across boundaries and to share knowledge.
The ability to develop the human capital of an organization occurs when the leader
builds the capabilities of the employees and sets high standards for the company. The
attributes linked to developing human capital include learning, the ability to learn from
others and from self; coaching and developing, investing time in the development of
others; and personal contribution, leading by example and setting high personal standards
(Kaplan & Norton, 2004).

94
While all leadership competencies are important, creating value and executing
strategy result in organizational readiness. Developing the human capital creates the
human capital readiness (Kaplan & Norton, 2004). This is necessary for all corporations,
especially those in the knowledge-based industries that are inherently reliant on human
capital. Therefore, information on the management and leadership qualities will consist
of information about a range of the specific competencies previously discussed.
3.2.1.4 Employee values.
An employee is defined as a worker who trades services for remuneration in a
relationship of subordination towards a contracting party (Blanpain & Baker, 2007).
Employee values are all of the beliefs held by an employee, in terms of principles, values
and judgments, about what is important, true and relevant to the role at work of that,
individual employee (Kaplan & Norton, 2004). Employee values decide the attitudes and
behaviours employees make use of in their commitment to achieving organizational
success.
Employee values are important because they enable the development and evolution
of corporate culture. Corporate culture refers to a set of values, beliefs and patterns of
behaviour that shape the central identity of an organization and help in forming the work
behaviour of its employees (Abdul Rashid, Sambasivan, & Johari, 2003). Culture is a
dynamic, living phenomenon, by which people jointly create, and recreate, the worlds in
which they live (Morgan, 1997). It identifies the symbolism, myths, stories and rituals
implanted in the organization and endeavours to encapsulate its systems of shared
meanings, assumptions and values (Kaplan & Norton, 2004). It relates to the set of
shared meanings among employees about corporate goals, problems and practices

95
(Kaplan & Norton, 2004) and, though unseen, it is the fusing force that assigns corporate
meaning and direction (Abdul Rashid et al., 2003). Corporate culture has also been
identified as the total of the values, customs, traditions and meanings that make a
corporation one of a kind, the character of a corporation, embodying the vision of the
creators of the corporation (Montana & Charnov, 2008). Corporate culture refers to the
dominant corporate values advocated by an organization, that offer the selection methods,
or norms and values, against which employees perform and are measured (Abdul Rashid
et al., 2003).
While corporate values are the beliefs advocated by senior executives, including
communication, respect, integrity and excellence (Kaplan & Norton, 2004), corporate
norms refer to how ideas and actions are carried out; corporate norms refer to the manner
in which work is performed and employees interact. Corporate culture and organizational
commitment have an impact on the financial performance of companies (Abdul Rashid et
al., 2003). Developing an understanding of the culture of a company leads to an
understanding of the context of the company and the people who run it, as company
culture influences the potential for both the company and its people for successfully
achieving corporate goals and objectives (Abdul Rashid et al., 2003). Equally important
to the achievement of organizational goals, through appropriate plans and policies, is the
commitment of the employees of the company to achieving set goals (Abdul Rashid et al.,
2003). The values of a corporate culture impact the ethical standards of a company and
the behaviour of the managers within a company (Montana & Charnov, 2008).

96
3.2.1.5 Problem solving capabilities.
Problem solving capabilities are defined as the ability of the employee to identify
problems, the ability of the employee to adapt and the ability of the employee to change
(Bollen et al., 2005). In addition to having insight into a problem, the use of analysis,
logic and reason are key elements of problem solving. Innovation is often the result of
creative problem solving and, therefore, by measuring corporate innovation,
organizations are, as a result, also measuring their problem solving capabilities (Dundon,
2002).
With reference to the value of corporate innovation, the Australian economy earns
most of its income from industries that draw their competitive edge from ideas or
knowledge, and the most successful organizations are those that are able to invent, rather
than to copy from others (Jarrard, 2007). Successful organizations are those that are able
to adapt and those that are willing to think and re-conceptualize their products, services,
processes, procedures and programs in a proactive, rather than a reactive manner (Jarrard,
2007). Companies already considered successful and striving to maintain product
leadership need to set up a culture of creativity and product innovation to have the
opportunity to remain successful (Kaplan & Norton, 2004). They must invest in
innovation to continue to be successful.
Innovation, itself, has been defined as the beneficial implementation of strategic
creativity (Dundon, 2002). Dundon (2002) asserts that innovation necessitates the
amalgamation of creativity, strategy, implementation and profitability. Both problem
solving and its related innovation are performed at an individual or at a group level.
Innovation may be applied to internal processes, including those used to complete cross-

97
functional planning, human resource performance reviews and production planning.
Innovation is also applied in the following of external processes that are necessary to the
interaction with external stakeholders of a company.
Companies must be prepared to take action, to encourage innovation throughout
their organizations. Companies must make their employees aware of what innovation
really is and of what value it is to the company by promoting policies that persuade
employees to develop strong beliefs in a number of truths about innovation (Dundon,
2002). These beliefs include the assertions that innovation is more than just new
technology and that innovation relates to all internal and external processes; innovation is
applicable to companies in all business sectors and industries; innovation occurs at all
stages of corporate planning processes; innovation is not isolated to one department in an
organization, but relates to the day-to-day activities of all company departments;
innovation involves the provision of various tangible and intangible resources and a
culture that is conducive to innovative outcomes; innovation must be regarded as an
ongoing and sustained activity; innovation must include all, equally-valuable, dimensions
of creativity, strategy and implementation to realize corporate profitability; and
innovation can be applied to a variety of corporate areas including new and existing
products, services and programs.
3.2.1.6 Summary of HRC dimensions.
The dimensions of HRC identify their importance and make clear their definitions.
These definitions are the foundation of their use in the pilot study. The academic
definitions are the foundation on which the operational definitions are created in the pilot
study. The definitions of the HRC dimensions are complemented by the definitions and

98
use of the dimensions of RC, also key to the work performed in the pilot study. The
definitions of the dimensions of RC are discussed in the following section.
3.2.2 Relational capital.
Relational Capital (RC) includes contacts between the economic links needed to
acquire inputs and to sell outputs. These are a directly productive aspect of social capital
(Bezemer et al., 2004). The RC of an organization refers to the productive contacts that
individuals use in selling outputs. In some central features, RC does not differ from other
types of capital, including currency and equipment (Robison et al, 2002). RC makes up
the individual feature of social capital that is enduringly productive (Bezemer et al., 2004;
Woolcock & Narayan, 2000). A list of the dimensions of RC includes customer capital,
supplier chain relations and competitors (Bollen et al., 2005; Bontis, 1998; Brooking,
1996; Chen et al., 2005; Edvinsson & Malone, 1997; Johanson, 2005; Lynn, 1998; Roos
& Roos, 1997; Sveiby, 1997). These dimensions of RC are discussed in the following
sections.
3.2.2.1 Customer capital.
Customer capital includes a number of items that serve to define it. These items
include knowledge of marketing channels, knowledge of customer relationships,
customer orientation (accessibility of customer feedback), customer orientation (image of
the company), numbers and types of customers, strong relationships with customers, and
the satisfaction of customers of products and services.
3.2.2.2 Supplier chain relations.
The RC dimension of supplier chain relations includes items that serve to define it.
These items include the knowledge of employees about customer relations and the

99
number of customers, items related to competitors (including relationships with other
organizations and competitor orientation), general aspects to be accounted for when
engaging in relationships (including long term focus related to customer and supplier
relations), and profit objectives related to customer and supplier relations.
3.2.2.3 Competitors.
The RC dimension of competitors includes items that serve to define it. These
items include relationships with other organizations, competitor orientation, and general
aspects to be accounted for when engaging in relationships.
3.2.2.4 Summary of RC dimensions.
The dimensions of RC identify their importance and make clear their definitions by
focusing on what those dimensions include. These definitions are the foundation of their
use in the pilot study. The academic definitions are the foundation on which the
operational definitions were created. The definitions of the RC dimensions are
complemented by the definitions and use of the dimensions of HRC, also key to the work
performed in the pilot study.
3.2.3 Summary.
Both HRC and RC dimensions of IC are the critical dimensions explored in this
research. For ease of reference, refer to Table 3.1 and Table 3.2 for alignment between
the dimensions and the IC components. Table 3.1 provides a concise summary for the
academic definitions provided for the construct of HRC and for each of its dimensions.
The academic definitions are needed as a basis on which the operational definitions of the
variables are developed in the pilot study.

100
Table 3.1
Academic definitions of key construct of HRC and of its dimensions
Variable
Academic Definition
Human
Resource
Capital
(HRC)
The collective attitudes, skills and abilities of human resources contributing to the
organizational performance and productivity.
Innate Human
Capabilities
The undeveloped faculties people have to use that exist from birth; those faculties
inherent rather than learned. They include intelligence, learning capability and
talent.
Learned
Abilities
The faculties or capacities resulting from the knowledge gained by theoretical
and/or practical study. They include knowledge, skills, and education from
learning from each other, education from learning from training, experience,
ability and expertise.
Management
and Leadership
Qualities
The nature, kind, character, or manner of those individuals and groups who use a
set of processes that ensure that complicated systems of people and technology
flow smoothly to produces organizations in the first place or to adjust them to
changing situations.
Employee
Values
The beliefs held by an employee, in terms of principles, values and judgments,
about what is important, true and relevant to the role at work of that, individual
employee. Employee values decide the attitudes and behaviours employees make
use of in their commitment to achieving organizational success.
Problem
Solving
Capabilities
An employee’s ability to identify problems, the ability of the employee to adapt
and the ability of the employee to change.

101
Table 3.2 provides a concise summary for the academic definitions provided for the
construct of RC and for each of its dimensions. The academic definitions are based on
what each of the dimensions includes, talking about the dimension by talking about its
components. As with HRC, the definitions of RC and of its dimensions are needed as a
basis on which the operational definitions of the variables are developed in the pilot
study.
Table 3.2 Academic definitions of key construct of RC and of its dimensions
Academic definitions of key construct of RC and of its dimensions
Variable
Academic Definition
Relational
Capital (RC)
The contacts between economic links needed to acquire inputs and to sell
outputs; a directly productive aspect of social capital. RC refers to the
productive contacts that individuals use in achieving sold output. In some
essential features, RC will not differ from other forms of capital, such as money
and machinery. These contacts form the individual aspect of social capital that
is directly productive.
Customer
Capital
Includes items such as:
Knowledge of marketing channel
Knowledge of customer relationships
Customer orientation (accessibility of customer feedback)
Customer orientation (image of the company)
Customers (amount of customers)
Customers (strong relationships)
Customers (satisfaction of products and services)
Supplier Chain
Relations
Includes items such as:
Employee knowledge of customer relations
Number of customers

102
Variable
Academic Definition
Competitors Includes items such as:
Relationships with other organizations, and
Competitor orientation
General
Aspects to be
accounted for
when engaging
in Relationships
(included in
each of the RC
dimensions)
These include items relating to general aspects to be accounted for when
engaging in relationships including:
Long term focus related to customer and supplier relations, and Profit objective
related to customer and supplier relations.
3.3 Pilot Study - Method
The main research study was performed to undertake research into the importance
of HRC and RC information to owners of shares in ABSC. The pilot study, however,
was performed to determine the practicability of a main study on these topics and to
optimize the design of the main study in a manner that would provide enough information
to obtain statistically valid information. The information sought was from shareholders
of ABSC. The pilot study involved three sets of pretesting activities. These were
completed using Focus Group A, followed by a pilot questionnaire and then followed by
the final questionnaire. Members of Focus Group A and respondents of the pilot
questionnaire and the final questionnaire were shareholders of stocks in ABSC and were
asked for their consideration of each of the dimensions of HRC and RC.
The first pretesting activity was creating the operational definitions of the
constructs of HRC and RC and of their dimensions. This involved the use of Focus

103
Group A, a purposive group of participants, comprised of five individuals who focused
on using the academic definitions of the IC dimensions of HRC and RC and of each of
their dimensions to develop the operational definitions.
As a result of the output from Focus Group A, a questionnaire was created that
included the operational definitions of each of the dimensions of HRC and RC and a
range of policy statements for each. For the second pretesting activity, that questionnaire,
the pilot questionnaire, was used with a sample group of 17 shareholders of ABSC. The
responses to the questionnaire helped determine if a range of items, in the form of
statements relating to the HRC and RC of a company, were perceived to be relevant to
the HRC or RC dimensions indicated in each section, and if HRC and RC information
was relevant to ABSC.
The pilot questionnaire helped to determine the perceived relevance of a range of
statements representing items relating to the HRC and RC of a company. The final
questionnaire, the third pretesting activity, was derived from the output of the pilot
questionnaire. This was required to test the construct reliability and construct validity of
the findings to enable the use of the items in the hypothesis-testing stage of the research
study. The final questionnaire involved the administering of a HRC and RC perception
scale that represented a diagnostic tool which had the potential to enable the testing of the
proposed hypotheses.
3.3.1 Development of operational definitions of HRC and RC and of their
dimensions – Focus Group A.
Qualitative methods, including focus groups, allow researchers to gain meaningful
insight into specific human behaviour and into the reasons behind the behaviours of

104
individuals, what they do and why they do it. Focus groups facilitate meaningful insight
by allowing researchers to focus on the relevant experiences of group participants and on
their perceptions relating to concepts and events (Greenbaum, 1998). Focus Group A
included five individuals to define common business words in terms of their being
understood by shareholders of ABSC.
Because the business terms Human Resource Capital (HRC) and Relational Capital
(RC) are often exchanged between parties, in both everyday business and in academic
discussion, the research study sought to confirm how these terms were understood and
used by representatives of shareholders of ABSC. Much has been written about focus
groups, their purpose, effective ways of hosting them, and the value of the data they
provide (Greenbaum, 1998; Krueger & Casey, 2000). Krueger and Casey (2000) state
that focus group discussions tap into human tendencies. Attitudes and perceptions about
a topic are developed, in part, with other people. IC is comprised of HRC and structural
capital, and that structural capital includes the intangible capital related to human
resources, referred to as RC (Bollen et al., 2005). In investigating the dimensions of IC,
related to corporate human resources, this research study investigates the five dimensions
of HRC and the three dimensions of RC. The Focus Group A was presented with
academic definitions of those dimensions and asked to validate these definitions as terms
used when stock purchases were being considered. The combined list of HRC
dimensions was extracted from the studies of researchers including Becker (2005), Bollen,
Vergauwen, and Schnieders (2005), Bontis (1998), Brooking (1996), Chen, Cheng, and
Hwang (2005), Edvinsson and Malone (1997), Johanson (2005), Lynn (1998), Roos and
Roos (1997), and Sveiby (1997). The HRC dimensions investigated were innate human
105
capabilities, learned abilities, management and leadership qualities, employee values, and
problem solving capability. The RC dimensions investigated were customer capital,
supplier chain relations, and competitors.
Focus Group A was provided, in writing, with the academic definitions of each of
the HRC and RC dimensions (refer to Tables 3.1 and 3.2). Focus Group A was asked to
read, interpret, discuss, and rewrite the terms in their personal everyday language. This
was to develop the operational definitions of the dimensions of HRC and RC (refer to
Appendix B). Appendix B includes both inputs and outputs; it includes the academic
definitions provided to participants, their responses to defining the variables in their own
terms (on the heels of the group discussion), and the operational definitions that were
developed as a result of the exercise. An output of Focus Group A was the development
of a questionnaire concerning the operational definitions of the constructs of HRC and
RC and of their dimensions under investigation. The pilot questionnaire included a list of
items relating to each of the dimensions of HRC and RC and a page detailing the
operational definitions of each of the variables. Respondents to the pilot questionnaire
would be asked to read and understand the definitions prior to indicating if they believed
the statements regarding HRC and RC information was relevant to each of the
dimensions of HRC and RC. As a result, it was necessary to ensure that the questions
posed in the surveys relating to the research were clear, easy to understand and user-
friendly for the sample groups of investors, and to ensure the definitions were clear for
use in the content analysis of the corporate annual reports. The results, from the
information provided by Focus Group A, ensured that this could be achieved.

106
3.3.1.1 Participants.
A focus group needs to have the representation of the types of participants that are
relevant to the study. In this case, judgment sampling was used to select individuals to
participate in the focus group. It allowed the extraction of data that, within the limits of
the research objectives, facilitates the ability of the researcher to make accurate and
relevant generalizations through the perspective of the sample group (Gibbs, Kealy,
Willis, Green, Welch, & Daly, 2007). In this research, the perspectives sought were from
individuals who were either current or past shareholders of ABSC. The participants had
invested directly in those shares. In selecting the candidates to participate in Focus
Group A, participants were chosen with the acknowledgement that the larger population
which the sample represented had its one a priori being shareholders of stocks in at least
one Australian bank. That representation of the larger sample group includes only
individual shareholders of ABSC, purchased as part of individual stock portfolios. It is
acknowledged that none of the participants in Focus Group A were shareholders as
corporate investors or as professional stock traders. Also, the participants held the
following professional functions that ensured a range of individual investors were
represented. These included one housewife, one teacher, one accountant, one lawyer, and
one undergraduate university student.
3.3.1.2 Procedure.
Prior to hosting the event, the researcher outlined a set of definitions to present to
the participants in Focus Group A. The definitions presented were drawn from the
literature review completed. This exploratory part of the research study contributed to the
development of new, operational definitions of the key constructs. Focus Group A, five

107
shareholders of ABSC, engaged in discussion to gain an understanding of the academic
constructs of IC dimensions of HRC and RC and their dimensions.
At this stage, as at each part of the research study, whenever participants were
required to be involved in the focus groups or in completing any of the questionnaires
posed to them, they were required to provide informed written consent as per the Human
Research Ethics Committee requirement (HREC) (refer to Appendix C). The objective of
the focus group approach was to get the participants thinking, to enable them to make
conclusions and create operational definitions that were useful to the rest of the study.
The information gained from Focus Group A was of a qualitative nature; it allowed the
participants to express themselves naturally, to use their own language to explain the
variables with which they were dealing. This enabled the researcher to use the data to
create a subsequent questionnaire to be used for the next step in the pilot study.
3.3.1.3 Results and analysis.
The academic definitions given to participants of Focus Group A and the final
revisions made by Focus Group A (refer to Appendix B) are aligned and contain only
minor variations. Thematic analysis was performed on the revised definitions delivered
by Focus Group A. The revised definitions were analysed manually, in detail, without the
use of a software application, to identify the important distinguishing and common words
applied by the respondents (refer to Appendix B). The analysis revealed how the
respondents understood the academic definitions of HRC and RC and of their dimensions.
Thematic analysis, the output of which is included in Appendix B, revealed that
Focus Group A was able to define, in common language, the variables, of HRC and RC
and their dimensions, to be used in this study. It also revealed that both HRC and RC

108
were distinct concepts; there were identified no overlapping features or constructs that
would contribute to confusion when either concept was applied in the selection of ABSC
stock purchases. Additionally, there were identified no overlapping features or constructs
that would contribute to confusion when either concept was applied in the selection of
ABSC stock purchases that were considered. The definitions of HRC and its dimensions
provided by Focus Group A, as well as those of RC and its dimensions, were combined to
create the operational definitions used in this research (refer to Table 3.3 and Table 3.4).
Table 3.3
Operational definitions of key constructs of HRC and its dimensions as proposed for this
research project
Variable
Operational Definition
Human
Resource
Capital
(HRC)
The collective physical and intellectual skills and abilities of employees that they
bring with them to an organization in order to contribute to its overall performance
and success
Innate Human
Capabilities
The natural abilities and qualities a person is born with that, with time and through
experience, may develop as behaviours, skills and talents (relating to how
investors perceive the HRM functions of employee recruitment and employee
retention).
Learned
Abilities
The knowledge and skills that are taught, through formal and informal education
and practice, rather than inherited (relating to how investors perceive the HRM
functions of employee recruitment and employee retention).
Management
and Leadership
Qualities
Those traits and qualities that refer to a person’s character in terms of how they
would control and guide the overall resources and performance of an organization.
Leaders will use incentives such as rewards and consequences to control the
behaviour of employees. Incentives may or may not include money.
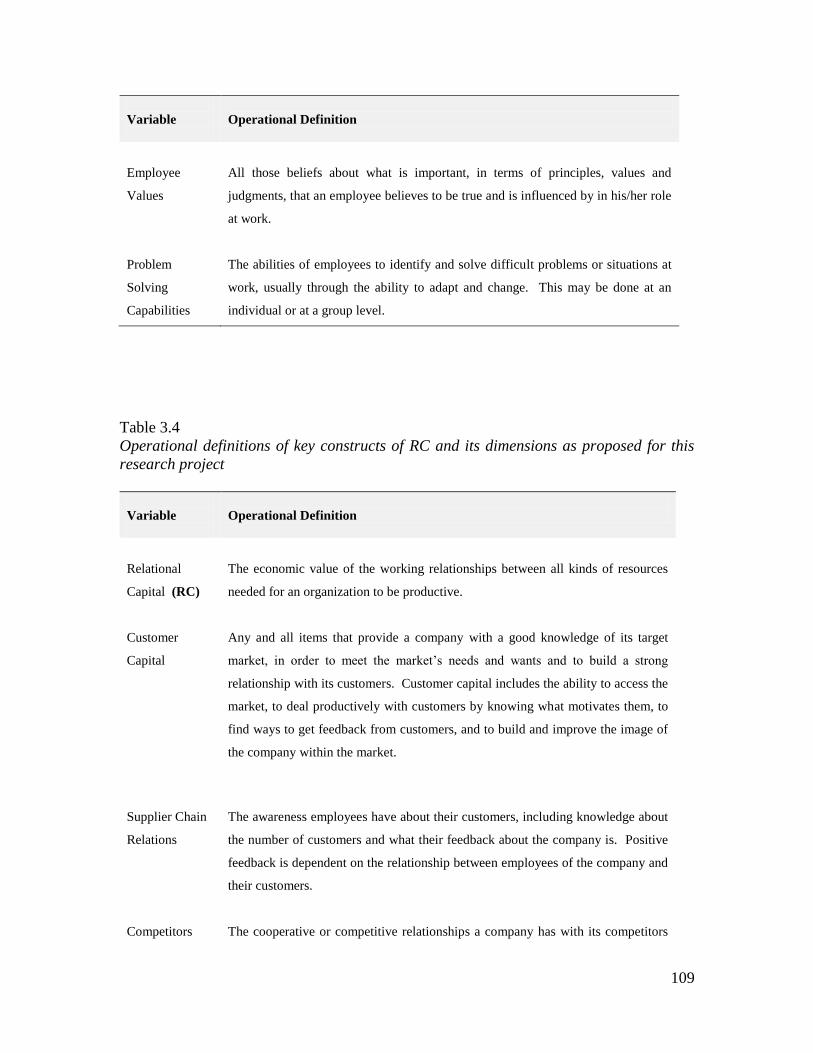
109
Variable
Operational Definition
Employee
Values
All those beliefs about what is important, in terms of principles, values and
judgments, that an employee believes to be true and is influenced by in his/her role
at work.
Problem
Solving
Capabilities
The abilities of employees to identify and solve difficult problems or situations at
work, usually through the ability to adapt and change. This may be done at an
individual or at a group level.
Table 3.4
Operational definitions of key constructs of RC and its dimensions as proposed for this
research project
Variable
Operational Definition
Relational
Capital (RC)
The economic value of the working relationships between all kinds of resources
needed for an organization to be productive.
Customer
Capital
Any and all items that provide a company with a good knowledge of its target
market, in order to meet the market’s needs and wants and to build a strong
relationship with its customers. Customer capital includes the ability to access the
market, to deal productively with customers by knowing what motivates them, to
find ways to get feedback from customers, and to build and improve the image of
the company within the market.
Supplier Chain
Relations
The awareness employees have about their customers, including knowledge about
the number of customers and what their feedback about the company is. Positive
feedback is dependent on the relationship between employees of the company and
their customers.
Competitors The cooperative or competitive relationships a company has with its competitors

110
Variable
Operational Definition
in its relevant market. This takes into account its position in the market relative to
its competition, its networking ability and its competitive strengths and
weaknesses.
General
Aspects to be
accounted for
when engaging
in Relationships
(included in
each of the RC
dimensions)
A company being able to achieve its strategic goals and to make good profits in
the long run based on building strong relationships with both customers and
suppliers. By nurturing productive relationships, customers and suppliers will
provide the company with positive feedback, long term loyalty and flexibility.
The HRC dimensions investigated by Focus Group A were innate human
capabilities, learned abilities, management and leadership qualities, employee values, and
problem solving capability. The RC dimensions investigated by Focus Group A were
customer capital, supplier chain relations, and competitors. However, what the research
study does investigate from here on are the variables representing the dimensions of HRC
and RC, based on the results of both the literature review and Focus Group A.
3.3.1.4 Discussion.
The HRC dimensions of innate human capabilities and of learned abilities are
difficult to isolate and measure. This research, however, has established that both
dimensions relate to the HR functions of employee recruitment and employee retention
(refer to Table 3.3). Recruitment is concerned with sourcing and hiring suitably qualified,
capable and skilled employees to fulfil their work roles and retention involves keeping

111
and maintaining those suitably qualified, capable and skilled employees. As a result, the
researcher was armed with a list of variables relating to the dimensions of HRC and RC.
The five variables representing the dimensions of HRC were determined to include
employee recruitment, employee retention, development of management and leadership
qualities, employee values, and developing employee problem solving skills. The three
variables representing the dimensions of RC include, as discussed in this chapter and in
the literature review, customer capital, supplier chain relations, and competitors. Table
3.5 provides a summary of the dimensions of HRC and RC.
Table 3.5
Dimensions of HRC and RC
HRC Dimension RC Dimension
Employee recruitment Customer capital
Employee retention Supplier chain relations
Employee values Competitors
Development of management and leadership qualities
Developing employee problem solving skills
Similar to previous research, this research study infers that the dissection of the
construct of IC leads to the understanding of its components of HRC and RC (Bollen et
al., 2005; Bontis, 1998; Brooking, 1996; Edvinsson & Malone, 1997; Johanson, 2005;
Lynn, 1998; Roos & Roos, 1997; Sveiby, 1997). This research study supports the
assertion that IC is comprised of the dimensions of human capital and structural capital

112
including relational capital (Bollen et al., 2005). However, dissimilar to past research,
this study focuses specifically on the IC dimensions of HRC and RC and on the related
functions of managing HR within a company. In taking this perspective, the research
study has the potential to shed light on the value of information disclosure, relating to the
two HR components of IC, to a knowledge-based company such as those within the
Australian banking sector.
3.3.1.5 Summary.
Focus Group A resulted in the operational definitions of the IC dimensions of HRC
and RC and in the determination of a list of variables that represent those dimensions.
Armed with the operational definitions, and with knowledge of the list of variables to be
investigated in this research study, the researcher then sought to carry out two tasks. The
first was to determine the perceived relevance of HRC and RC policy information to the
corresponding dimensions of HRC and RC, as this was needed to develop items for the
final questionnaire of the pilot study. The second was to have the operational definitions
utilized in the content analysis of the 2007 annual reports published by each of the
Australian banks investigated.
3.3.2 Pilot Questionnaire – Determination of perceived relevance of HRC
and RC policy information.
From the results of the thematic analysis performed on the data collected from
Focus Group A, a questionnaire was created that incorporated the operational definitions
of the individual dimensions of HRC and RC and a range of policy statements developed
for each. The pilot questionnaire (refer to Appendix D), was distributed to 20 individuals.
The response rate for the pilot questionnaire was 85 percent (N = 17).

113
The objective of using the pilot questionnaire was to determine if a range of items
and statements relating to the HRC and RC of a company was perceived to be relevant to
the HRC or RC definitions provided within the questionnaire. The respondents were
invited to read each statement and indicate the perceived level of relevance by circling
the appropriate responses.
The questionnaire items relating to HRC and RC dimensions were developed from
the operational definitions established by Focus Group A of the pilot study. The
definitions of the constructs and dimensions were used to develop a range of policy
statements for respondents to consider. It was proposed that the responses to the
questionnaire were to be analysed using percentage analysis. The purpose of completing
this part of the research was to lead to the creation of the final questionnaire, to be used to
be further factor analysed and tested for statistical validity and reliability in the pilot
study and, based on the outcome of confirmatory factor analysis, to be used in the main
study.
Questionnaires permit researchers to query respondents with minimal intrusion into
the life or time of the respondents, as respondents can complete the questionnaires at their
convenience. With regard to this questionnaire, as with the entire research study, Human
Research Ethics Committee (HREC) approval was obtained from the university to enable
the researcher to conduct an investigation into the perceptions of respondents through a
series of questionnaires. Both judgment sampling and snowball sampling were used to
engage participants and invite them to respond to the pilot questionnaire. All invited
participants were assured anonymity in their responses.

114
There were two parts to the pilot questionnaire. The first part was designed to
extract demographic information and information on the banking sector shareholdings of
respondents. The second part of the pilot questionnaire was designed to extract
information on how the respondents perceived a range of items, as relating to the
corresponding HRC and RC dimensions.
Participants invited to reply to the pilot questionnaire included a group of
shareholders of ABSC. Paper copies of the questionnaires were given to family, friends
and colleagues of the researcher to distribute to suitably eligible individuals, those who
were either previous or current holders of ABSC shares. Participants were provided with
sealed A3 envelopes containing the pilot questionnaire, definitions of the constructs
investigated, Expression of Interest Letter (refer to Appendix E), two printed copies of
the Participant Consent Form (refer to Appendix F), and postage-paid, researcher-
addressed reply envelopes. In responding to the pilot questionnaire, participants were
invited to read each of the statements provided and to indicate the perceived level of
relevance by identifying appropriate responses, recording how relevant they perceived
each of the items was to the corresponding dimensions of HRC and RC. The participants
were given two weeks to complete and return the questionnaires.
Each participant was requested to return the completed questionnaire and a signed
copy of the Participant Consent Form. Upon receiving the documents, questionnaires and
consent forms were separated immediately before data was extracted and processed for
analysis. The consent forms were placed into a single sealed file and the questionnaires
were placed in a separate sealed file for bulk processing by the researcher. This was to
ensure the anonymity of respondents. Percentage analysis was used for analysis of the

115
data. It was needed to establish if the majority of respondents agreed as to whether each
of the items related to each of the corresponding dimensions of HRC and RC.
3.3.2.1 Participants.
The pilot questionnaire was distributed and on forwarded to a total of 20
individuals, each of whom, at the time of distribution, was a current or previous
shareholder in at least one of the eight banks under investigation. A response rate of 85
percent was attained (N = 17). Of the 17 respondents to the pilot questionnaire, 65
percent were male and 35 percent were female.
The ages of the respondents are shown in Table 3.6. Of the respondents for the
pilot questionnaire, 42 percent were aged between 26 and 35 years and 35 percent were
aged 36 to 45 years. In total, 77 percent of respondents ranged in age from 26 to 45 years.
Table 3.6
Age-range of respondents for the pilot questionnaire
Age Range of Respondents
(Years)
Number of Respondents
Percent of Respondents
25 or under
2
11.76
26 – 35 7 41.18
36 – 45 6 35.29
46 – 55 1 05.88
56 – 65 0 00.00
66 or over 1 05.88
N = 17

116
Table 3.7 identifies the levels of education attained by the respondents. The
majority of respondents, 53 percent, identified themselves as having a university
education.
Table 3.7
Education level attained by respondents for the pilot questionnaire
Education Level Attained
Number of Respondents
Percent of Respondents
Primary
0
00.00
Secondary 4 23.53
TAFE (Technical & Further Education) 2 11.76
University 9 52.94
Undisclosed 2 11.76
N = 17
Respondents reported that their employment was in one of two areas. Of the
respondents, 88.24 percent (15 people) referred to their selves as professionals and 11.76
percent (2 people) referred to their selves as tradespersons (refer to Table 3.8).
Table 3.8
Occupation of respondents to the pilot questionnaire
Occupation of
Respondents
Number of
Respondents
Percent of
Respondents
Professional
15
88.24
Tradesperson 2 11.76
N = 17

117
Annual income was reported by participants and 53 percent (9 people) reported an
income range of $40,001 to $80,000 AUD, while 29.4 percent (5 people) reported an
income range of $80, 001 to $120,000 (refer to Table 3.9).
Table 3.9
Income range of respondents to the pilot questionnaire
Income Range (AUD) Number of Respondents Percent of Respondents
Up to 40 000
0
00.00
40 001 – 80 000 9 52.94
80 001 – 120 000 5 29.41
120 001 or more 1 05.88
Not disclosed 2 11.76
N = 17
3.3.2.2 Procedure.
The participants in this part of the study were provided with the operational
definitions of the constructs of HRC and RC and of their dimensions. The participants
were asked to consider policy statements that they considered relevant to each of the
dimensions under investigation. For example, the critical intangibles such as the ability
of a company to “attract” and “maintain” key employees, its “innovative capacity” and its
“customer” approach were some of the indicators that were to be measured. A copy of
the questionnaire is provided in the appendices (refer to Appendix D). Table 3.10 is an
indicative set of policy statements provided on how one of the HRC dimensions,
employee recruitment, enabling the company to attract people with appropriate abilities,
skills and knowledge needed for the corporate role, was measured.

118
Table 3.10
Example of policy statement items to determine relevance
How do you perceive the relevance of each of the following statements to the HRC dimension
of employee recruitment?
1. The company attracts valuable employees, with industry-specific knowledge, from
competitor firms
2. The company offers higher starting salaries than the industry average
3. The company hires the best trained graduates in the field
4. Graduate recruits are fast-tracked to a management position quickly in the company
compared to competitor firms
5. The company uses targeted marketing campaigns to potential recruits to show it values the
individual achievements of its current star performers
6. The company uses in-house employee recruitment officers, with complete knowledge of
the firm’s business, to match appropriate recruits to available roles
A three-point scale was used to measure the responses to the policy statements in
the pilot questionnaire. The responses were presented in the following range: 1 = Not
Relevant, 2 = Unsure, 3 = Relevant. A percentage analysis was used to identify a list of
relevant policy statements relating to the dimensions of HRC and RC. For each of the
eight dimensions of HRC and RC, five policy statements, of those identified as having
relevance to that dimension, were proposed to be used further in this research study. The
policy statements were proposed to be used for the final questionnaire necessary to the
main study, subject to passing validation and reliability testing in the final questionnaire
of the pilot study.

119
3.3.2.3 Results and analysis.
The primary focus of this research study is the perceptions of shareholders, either
past or present, of ABSC stocks. To ensure a commitment to this focus, all respondents
were asked, within the pilot questionnaire, if they held ABSC stocks at some stage,
whether in the past or present. All 17 respondents indicated that they had owned stocks
in one or more of the ABSC and all disclosed the ABSC stocks they owned. This
information is shown in Table 3.11. Of the respondents, 13 people stated they had shares
in the Commonwealth Bank of Australia (CBA). This represented 76.47 percent of the
respondents. As for the other banks, 35.29 percent (6 people) held shares in Westpac
Banking Corporation (WBC), 29.41 percent (5 people) in Australia and New Zealand
Banking Group Ltd (ANZ) and 17.65 percent (3 people) held shares in the National
Australia Bank (NAB).
Table 3.11
Banking shares held by respondents to the pilot questionnaire
Banking shares held Number of Respondents Percent of Respondents
ADB 0 00.00
ANZ 5 29.41
BEN 0 00.00
BOQ 0 00.00
CBA 13 76.47
NAB 3 17.65
SGB 0 00.00
WBC 6 35.29
Other 0 00.00

120
At this stage, it is important to briefly discuss the notion of SHRM and the value
HRC and RC policy information represents for companies seeking sustained competitive
advantage. This is required because there is a list of items in the second part of the
questionnaire that relates to HRC and RC policy information.
SHRM involves creating and enacting a set of internally consistent HRM policies
and practices that enable the human capital of a firm to augment the accomplishment of
business objectives (Wei, 2006). The practice of SHRM is concerned with combining
HRM policies and practices into corporate strategy in an attempt to achieve competitive
advantage (Wei, 2006). To do this successfully, companies need to develop and use their
key competencies, facilitated and enhanced by a range of HRM activities, functions and
processes (Lado & Wilson, 1994; Wei, 2006). Research has established that SHRM
results in the utilization of HRM practices and the design of an HR system that is
compatible with corporate strategy (Wei, 2006).
Information on the HRC and RC of a corporation is regarded as information on
intangible assets. Researchers argue that companies must be able to measure and report
on their intangible assets in order to adopt a strategic orientation necessary to corporate
success (Flamholtz et al., 1998). They argue that this needs to be carried out for both
managing an organization and for communicating its value to both internal and external
stakeholders. As an example, researchers argue that when organizational-specific
scorecards are used, they can help align organizational strategy with HR capabilities and
can provide greater transparency to users of the information (Flamholtz et al., 1998).
Banking sector corporations, like other publicly listed corporations, report on their
financial performance in their annual reports. However, annual reports contain more
121
information than just the financials. For example, CBA, in its annual report for the end of
the 2007 financial year, refers to the role of the Board in endorsing key HR policies and
supervising strategy development for senior and high performing executives (CBA,
2007). The CBA also refers to “ethical policies” within the annual report. The policies
are those that relate to “values”, “employee behaviours”, “professional practice” and what
CBA refers to as “our people”. HRC and RC policies demonstrate the link between
corporate strategy and the role of SHRM within a company. Understanding corporate
HRC and RC policies helps managers to manage and information-users to make informed
decisions.
With regard to the analysis, provided the majority of respondents agreed the
information was relevant to the specific dimension, the five most-relevant statements for
each dimension would be used to develop the main study questionnaire, subject to
passing reliability and validation testing in the final questionnaire of the pilot study. A
percentage analysis was used to identify which statements were relevant to each of the
dimensions of HRC and RC.
Employee Recruitment
Six statements in the pilot questionnaire were presented for employee recruitment, a
dimension of HRC. Greater than 82 percent of respondents (14 people) perceived all six
statements to be relevant to the dimension of employee recruitment, as presented in Table
3.12. Also, 17.65 percent of respondents (3 people) perceived statement 4 to be not
relevant to the dimension. The analysis of the data from the pilot questionnaire resulted
in five of the six items being incorporated into the final questionnaire.
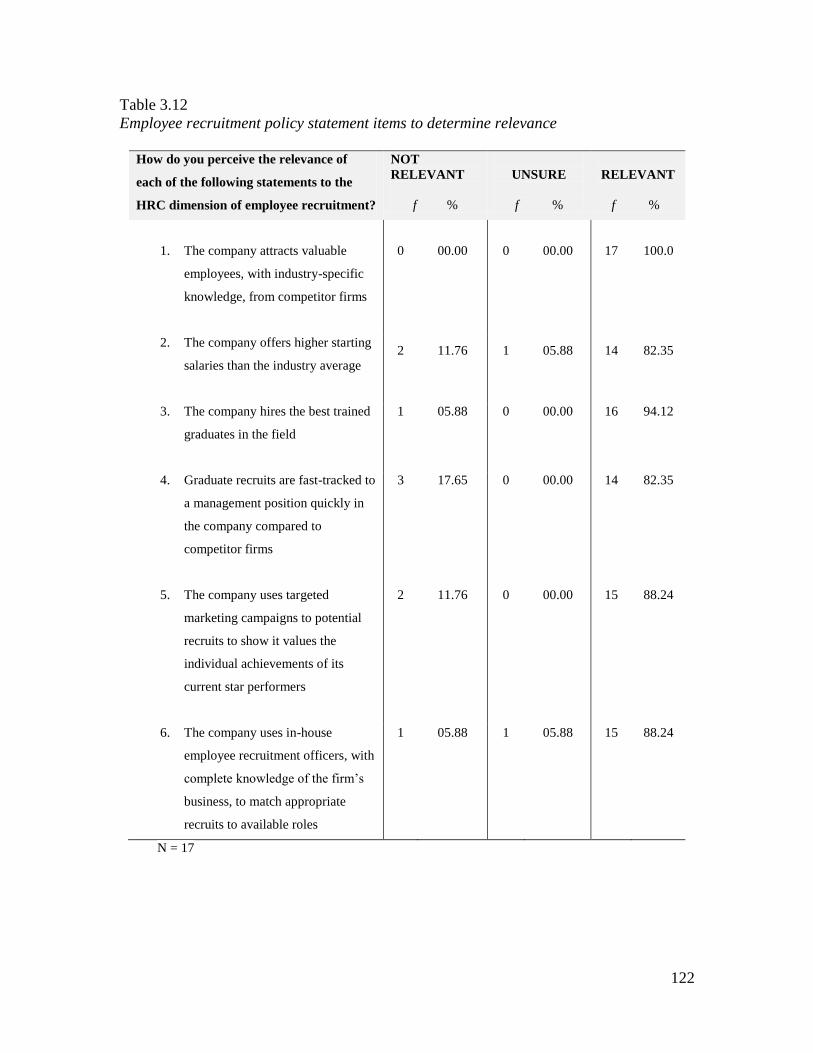
122
Table 3.12
Employee recruitment policy statement items to determine relevance
How do you perceive the relevance of
each of the following statements to the
HRC dimension of employee recruitment?
NOT
RELEVANT
f %
UNSURE
f %
RELEVANT
f %
1. The company attracts valuable
employees, with industry-specific
knowledge, from competitor firms
0
00.00
0
00.00
17
100.0
2. The company offers higher starting
salaries than the industry average
2 11.76 1 05.88 14 82.35
3. The company hires the best trained
graduates in the field
1 05.88 0 00.00 16 94.12
4. Graduate recruits are fast-tracked to
a management position quickly in
the company compared to
competitor firms
3 17.65 0 00.00 14 82.35
5. The company uses targeted
marketing campaigns to potential
recruits to show it values the
individual achievements of its
current star performers
2 11.76 0 00.00 15 88.24
6. The company uses in-house
employee recruitment officers, with
complete knowledge of the firm’s
business, to match appropriate
recruits to available roles
1 05.88 1 05.88 15 88.24
N = 17

123
For the purpose of confirmatory factor analysis, for the HRC dimension of
employee recruitment, relevant items 1, 2, 3, 5 and 6 (refer to Table 3.12) were chosen to
design the final questionnaire for the research study. Item 4 was not chosen as it had the
greatest frequency of “not relevant” responses, 17.65 percent.
Employee Retention
Seven statements in the pilot questionnaire were presented to address the HRC
dimension of employee retention. All statements were perceived, by a majority of
respondents, to be relevant to the HRC dimension of employee retention. Notably, for
five of the seven statements, at least 88.24 percent of respondents perceived the items to
be relevant to the HRC dimension of employee retention, as presented in Table 3.13.
Also, 17.65 percent of respondents perceived statements 2 and 4 to be not relevant to the
dimension.
Table 3.13
Employee retention policy statement items to determine relevance
How do you perceive the relevance of
each of the following statements to the
HRC dimension of employee
retention?
NOT
RELEVANT
f %
UNSURE
f %
RELEVANT
f %
1. The company encourages
current employees with good
performance results to nominate
themselves for future
management positions
0
00.00
0
00.00
17
100.0
2. The company is committed to
retaining employees by making
the job interesting for them
3 17.65 1 05.88 13 76.47

124
How do you perceive the relevance of
each of the following statements to the
HRC dimension of employee
retention?
NOT
RELEVANT
f %
UNSURE
f %
RELEVANT
f %
3. The company uses training and
development to improve
interpersonal communication
and teamwork
0 00.00 1 05.88 16 94.12
4. The company facilitates
workplace diversity and
workplace harmony by
employing females, mature-
aged staff, and those from
multi-cultural backgrounds
3 17.65 0 00.00 14 82.35
5. Specialist external firms provide
training to employees with
specialized product
knowledge/skills
1 05.88 1 05.88 15 88.24
6. The careers of junior employees
are developed through the
formal mentoring by
experienced staff
1 05.88 1 05.88 15 88.24
7. A formal performance appraisal
program provides employees
with constructive feedback and
remedial intervention
0 00.00 1 05.88 16 94.12
N = 17

125
For the purpose of conrfirmatory factor analysis, for the HRC dimension of
employee retention, relevant items 1, 3, 5, 6, and 7 (refer to Table 3.13) were chosen for
use in the final questionnaire. Items 2 and 4 were not chosen as they had the greatest
frequency of “not relevant” responses, 17.65 percent.
Development of Management and Leadership Qualities
Five statements were presented for the HRC dimension of the development of
management and leadership qualities. All statements were perceived, by the majority of
respondents, to be relevant to the HRC dimension of development of management and
leadership qualities. Notably, 82.35 percent of respondents (14 people) perceived all five
statements to be relevant to the HRC dimension of the development of management and
leadership qualities, as presented in Table 3.14. The analysis of the data from the pilot
questionnaire resulted in confirmation that all the five items could be incorporated into
the final questionnaire.
Table 3.14
Development of management and leadership qualities policy statement items to determine
relevance
How do you perceive the relevance of
each of the following statements to the
HRC dimension of management and
leadership qualities of managers?
NOT
RELEVANT
f %
UNSURE
f %
RELEVANT
f %
1. Training and development is
used to improve the leadership
qualities and styles of company
managers
1
05.88
0
00.00
16
94.12
2. Managers are allowed to use 1 05.88 0 00.00 16 94.12
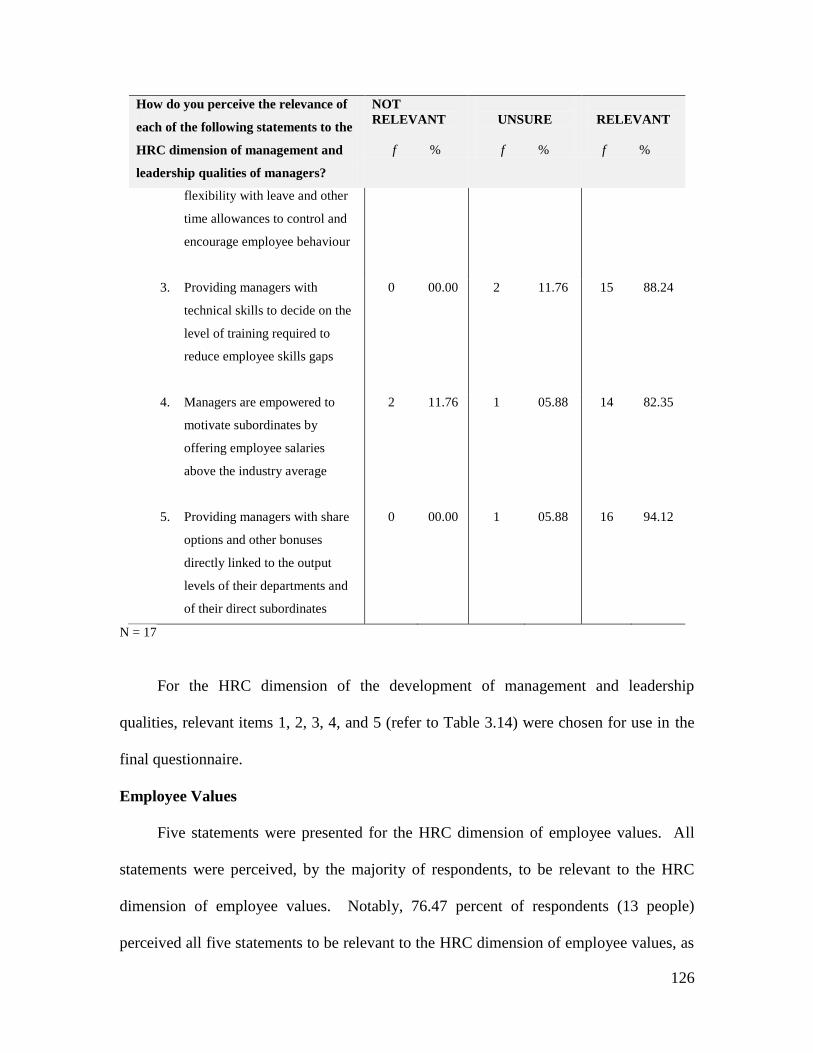
126
How do you perceive the relevance of
each of the following statements to the
HRC dimension of management and
leadership qualities of managers?
NOT
RELEVANT
f %
UNSURE
f %
RELEVANT
f %
flexibility with leave and other
time allowances to control and
encourage employee behaviour
3. Providing managers with
technical skills to decide on the
level of training required to
reduce employee skills gaps
0 00.00 2 11.76 15 88.24
4. Managers are empowered to
motivate subordinates by
offering employee salaries
above the industry average
2 11.76 1 05.88 14 82.35
5. Providing managers with share
options and other bonuses
directly linked to the output
levels of their departments and
of their direct subordinates
0 00.00 1 05.88 16 94.12
N = 17
For the HRC dimension of the development of management and leadership
qualities, relevant items 1, 2, 3, 4, and 5 (refer to Table 3.14) were chosen for use in the
final questionnaire.
Employee Values
Five statements were presented for the HRC dimension of employee values. All
statements were perceived, by the majority of respondents, to be relevant to the HRC
dimension of employee values. Notably, 76.47 percent of respondents (13 people)
perceived all five statements to be relevant to the HRC dimension of employee values, as

127
presented in Table 3.15. The analysis of the data from the pilot questionnaire confirmed
that all the five items could be incorporated into the final questionnaire.
Table 3.15
Employee values policy statement items to determine relevance
How do you perceive the relevance of
each of the following statements to the
HRC dimension of employee values?
NOT
RELEVANT
f %
UNSURE
f %
RELEVANT
f %
1. Managers build corporate trust and
goodwill with their subordinates by
negotiating difficult situations in an
open environment
2
11.76
2
11.76
13
76.47
2. Organizational synergy, which
improves company output, is a
result of a decentralized decision-
making process
2 11.76 2 11.76 13 76.47
3. The company motivates less
competitive employees by linking
output to a highly competitive
reward system
1 05.88 2 11.76 14 82.35
4. The company uses weekly
statistical analysis of staff
productivity to encourage
employees to reset goals and targets
0 00.00 2 11.76 15 88.24
5. Weekend workshops are used to
improve employee productivity by
encouraging them to broaden their
perspective in relation to their work
roles
0 00.00 1 05.88 16 94.12
N = 17

128
For the HRC dimension of employee values, relevant items 1, 2, 3, 4, and 5 (refer
to Table 3.15) were chosen for use in the final questionnaire.
Developing Employee Problem Solving Skills
Five statements were presented for the HRC dimension developing employee
problem solving skills. All statements were perceived, by the majority of respondents, to
be relevant to the HRC dimension of developing employee problem solving skills.
Notably, 82.35 percent of respondents perceived all five statements to be relevant to the
HRC dimension of developing employee problem solving skills, as presented in Table
3.16. Analysis confirmed the five items could be used in the final questionnaire.
Table 3.16
Developing employee problem solving skills policy statement items to determine
relevance
How do you perceive the relevance of each
of the following statements to the HRC
dimension of developing employee problem
solving skills?
NOT
RELEVANT
f %
UNSURE
f %
RELEVANT
f %
1. Managers facilitate the creation of an
organizational culture based on
work-groups and teams in the pursuit
of creating new products and
services
1
05.88
2
11.76
14
82.35
2. Managers are encouraged to
facilitate employees who are proven
and successful risk-takers
0 00.00 2 11.76 15 88.24
3. Managers readily encourage staff to
practice self-confidence and to
demonstrate authority as a result of
2 11.76 0 00.00 15 88.24

129
How do you perceive the relevance of each
of the following statements to the HRC
dimension of developing employee problem
solving skills?
NOT
RELEVANT
f %
UNSURE
f %
RELEVANT
f %
their own successful management
styles
4. Managers are empowered to select,
as mentors and role models,
employees who are creative and can
make their own decisions without the
help of others
0 00.00 0 00.00 17 100.0
5. Managers select, as supervisors,
employees that demonstrate the
ability to use their imagination to
develop original ideas for their
market
1 05.88 0 00.00 16 94.12
N = 17
For the HRC dimension of developing employee problem solving skills, the
relevant items 1, 2, 3, 4, and 5 (refer to Table 3.16) were chosen for use in the final
questionnaire. This was further contingent to passing reliability and validation testing in
the final questionnaire of the pilot study.
Customer Capital
Five statements were presented for the RC dimension of customer capital. All
statements were perceived, by a majority of respondents, to be relevant to the RC
dimension of customer capital. Notably, 88.24 percent of respondents (15 people)
perceived all five statements to be relevant to the RC dimension of customer capital, as
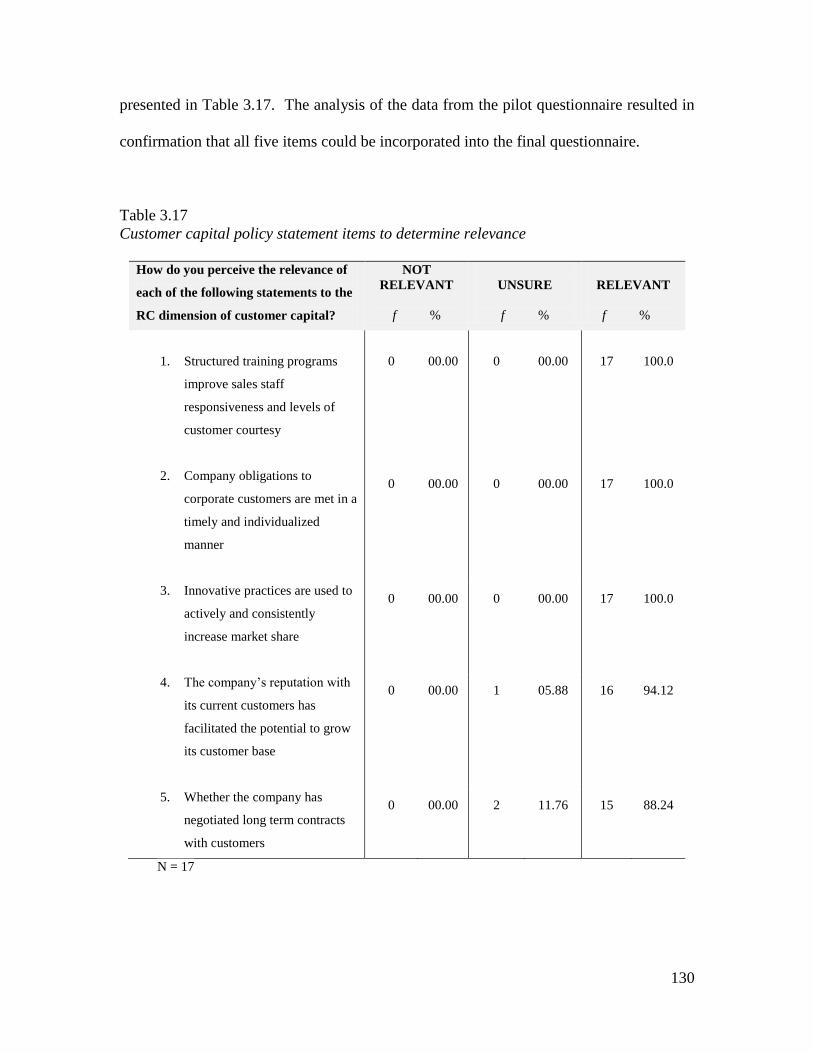
130
presented in Table 3.17. The analysis of the data from the pilot questionnaire resulted in
confirmation that all five items could be incorporated into the final questionnaire.
Table 3.17
Customer capital policy statement items to determine relevance
How do you perceive the relevance of
each of the following statements to the
RC dimension of customer capital?
NOT
RELEVANT
f %
UNSURE
f %
RELEVANT
f %
1. Structured training programs
improve sales staff
responsiveness and levels of
customer courtesy
0
00.00
0
00.00
17
100.0
2. Company obligations to
corporate customers are met in a
timely and individualized
manner
0 00.00 0 00.00 17 100.0
3. Innovative practices are used to
actively and consistently
increase market share
0 00.00 0 00.00 17 100.0
4. The company’s reputation with
its current customers has
facilitated the potential to grow
its customer base
0 00.00 1 05.88 16 94.12
5. Whether the company has
negotiated long term contracts
with customers
0 00.00 2 11.76 15 88.24
N = 17
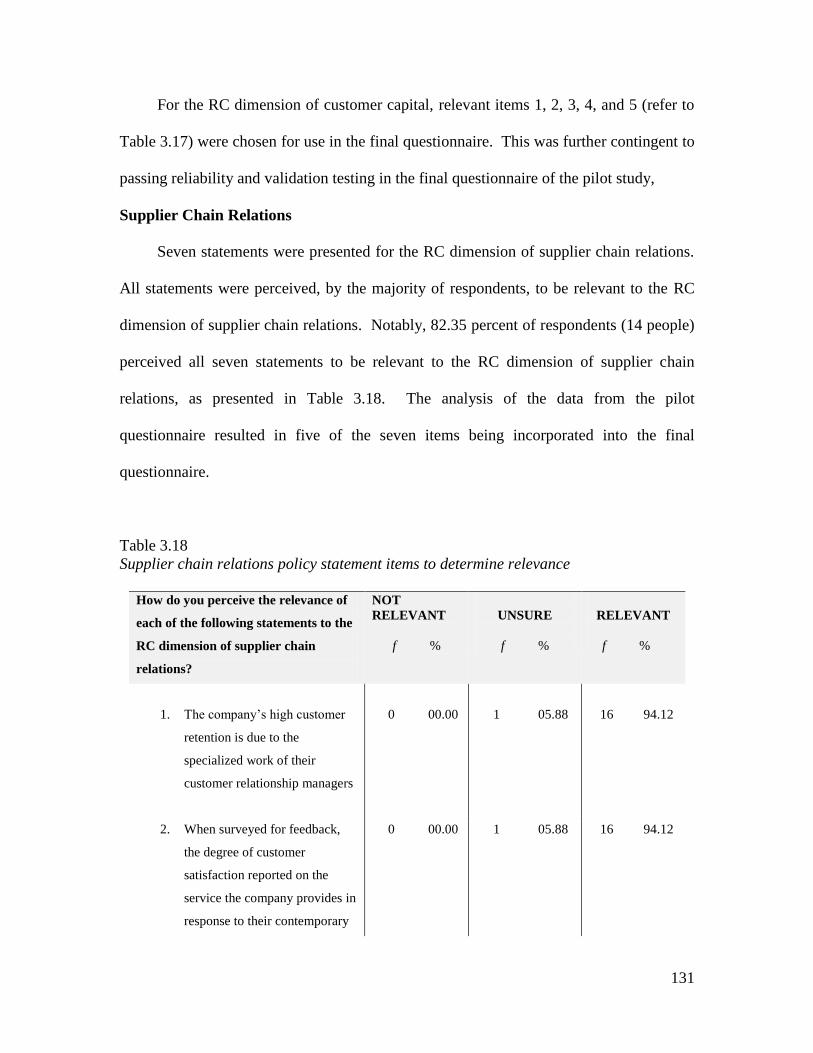
131
For the RC dimension of customer capital, relevant items 1, 2, 3, 4, and 5 (refer to
Table 3.17) were chosen for use in the final questionnaire. This was further contingent to
passing reliability and validation testing in the final questionnaire of the pilot study,
Supplier Chain Relations
Seven statements were presented for the RC dimension of supplier chain relations.
All statements were perceived, by the majority of respondents, to be relevant to the RC
dimension of supplier chain relations. Notably, 82.35 percent of respondents (14 people)
perceived all seven statements to be relevant to the RC dimension of supplier chain
relations, as presented in Table 3.18. The analysis of the data from the pilot
questionnaire resulted in five of the seven items being incorporated into the final
questionnaire.
Table 3.18
Supplier chain relations policy statement items to determine relevance
How do you perceive the relevance of
each of the following statements to the
RC dimension of supplier chain
relations?
NOT
RELEVANT
f %
UNSURE
f %
RELEVANT
f %
1. The company’s high customer
retention is due to the
specialized work of their
customer relationship managers
0
00.00
1
05.88
16
94.12
2. When surveyed for feedback,
the degree of customer
satisfaction reported on the
service the company provides in
response to their contemporary
0 00.00 1 05.88 16 94.12

132
How do you perceive the relevance of
each of the following statements to the
RC dimension of supplier chain
relations?
NOT
RELEVANT
f %
UNSURE
f %
RELEVANT
f %
needs
3. Whether the company has
negotiated long term contracts
with suppliers
1 05.88 1 05.88 15 88.24
4. Customer feedback is
encouraged through the
promptness of employees
responding to feedback
0 00.00 1 05.88 16 94.12
5. Management and staff at all
levels understand the size of
their share of the market
3 17.65 1 05.88 13 76.47
6. Employees know how their
customers want to be treated
3 17.65 0 00.00 14 82.35
7. Whether corporate stakeholders
are aware of where the company
wants to be in 3 to 5 years –
strategic objective
0 00.00 0 00.00 17 100.0
N = 17
For the RC dimension of supplier chain relations, relevant items 1, 2, 3, 4, and 7
(refer to Table 3.18) were chosen for use in the final questionnaire. This was further
contingent to passing reliability and validation testing in the final questionnaire of the
pilot study. All statements were perceived to be highly relevant to the RC dimension of
supplier chain relations.

133
Competitors
Seven statements were presented for the RC dimension of competitors. All
statements were perceived, by the majority of respondents, to be relevant to the RC
dimension of competitors. Notably, 82.35 percent of respondents (14 people) perceived
six of the seven statements to be relevant to the RC dimension of competitors, as
presented in Table 3.19. Also, 17.65 percent of respondents (3 people) perceived
statements 1 and 4 to be not relevant to the dimension. As a result, the analysis of the
data from the pilot questionnaire resulted in five of the seven items being incorporated
into the final questionnaire.
Table 3.19
Competitors’ policy statement items to determine relevance
How do you perceive the relevance of
each of the following statements to the
RC dimension of competitors?
NOT
RELEVANT
f %
UNSURE
f %
RELEVANT
f %
1. Information about the
awareness of a company’s
positioning within its market
3
17.65
0
00.00
14
82.35
2. Relative to itself, an awareness
of the positioning of its
competitors in the market
0 00.00 1 05.88 16 94.12
3. Information on how
management actively tests its
performance against its best
competitors to improve the
company’s performance and
overall position in the market
0 00.00 0 00.00 17 100.0

134
How do you perceive the relevance of
each of the following statements to the
RC dimension of competitors?
NOT
RELEVANT
f %
UNSURE
f %
RELEVANT
f %
4. Knowledge about how the
company works together with
its competitors to further
develop its markets (joint
ventures/alliances)
3 17.65 1 05.88 13 76.47
5. Information on how the
company seeks to predict
market trends
0 17.65 1 05.88 16 94.12
6. Information on how the
company uses market
intelligence increase its market
share
1 05.88 1 05.88 15 88.24
7. Knowledge about the potential
for a company to add value
through product and/or business
diversification
0 00.00 0 00.00 17 100.0
N = 17
For the RC dimension of competitors, relevant items 2, 3, 5, 6, and 7 (refer to Table
3.19) were chosen for use. All statements were perceived to be highly relevant to the RC
dimension of Competitors. However, items 1 and 4 were not chosen as they had the
greatest frequency of “not relevant” responses, 17.65 percent (3 people).
3.3.2.4 Discussion.
The development of the pilot questionnaire was influenced, in part, by Flamholtz,
Searfoss, and Coff (1998) who asserts that corporations need to provide greater

135
transparency to information-users. Their assertion is that companies need to understand,
measure, and disclose information on their intangible assets in order to manage their
companies and in order to communicate with their stakeholders.
The development of the pilot questionnaire was also influenced by research linking
SHRM, corporate strategy and competitive advantage (Wei, 2006). The creation and
implementation of HRM policies and practices, incorporated into corporate strategy, is
recognized as that which enables the human capital of a firm to better accomplish
corporate objectives (Wei, 2006).
Most importantly, the pilot questionnaire was developed acknowledging that
researchers have asserted the importance and relevance of HRM policies to corporate
objectives, about the requirement for strategically focused corporations to use HRM
policies to guide them in their practices to achieve competitive advantage (Wei, 2006).
This has provided the reasoning for using policy information related to the dimensions of
HRC and RC as items to be tested in the pilot questionnaire. The questionnaire dealt with
the relevance of the HRC and RC policy statements to each of the dimensions of HRC
and RC. For each of the dimensions, policy statements were presented and respondents
were asked to indicate whether they perceived each of the statements was either “not
relevant”, “unsure”, or “relevant” to the dimension it represented. There was no ready-
to-use diagnostic tool for the main study. There was no questionnaire specifically
developed to measure the variables under investigation. Hence, this exercise was a
necessary prerequisite to the creation of the questionnaire for the main study.

136
3.3.2.5 Summary.
The pilot study utilized the operational definitions created by Focus Group A and
the list of the HRC and RC dimensions of IC that relate to the functions HR professionals
undertake in their roles within a corporation. The final output of the pilot questionnaire
was a list of 40 HRC and RC policy statements, tested and determined, by respondents, to
be relevant to their corresponding HRC and RC dimensions. Hence, the statements were
retained for use as items in the final questionnaire of the pilot study.
3.3.3 Final questionnaire – CFA of items in HRC and RC perception scale.
The pilot questionnaire, as discussed in section 3.3.2, resulted in the determination
of the perceived relevance of a range of policy statements representing items relating to
the HRC and RC of a company. Upon completion of percentage analysis on the pilot
questionnaire results, a range of policy statements relevant to the dimensions of HRC and
RC were chosen for inclusion in the final questionnaire, a HRC and RC perception scale.
This part of the pilot study involved the administering of the final questionnaire, a
questionnaire that had the potential to measure shareholder perceptions and to enable the
testing of the proposed hypotheses. Respondents were asked to indicate if information
disclosure on each of the five HRC and three RC dimensions was perceived to be
important to their decisions to purchase banking sector shares. The objective of the final
questionnaire was twofold. First, it was to test the construct validity and construct
reliability of each of the 40 policy statement items, critical to this part of the research.
Second, it would allow the main study to be undertaken. Confirmatory factor analysis
was used to test the items in this, the final questionnaire of the pilot study.

137
3.3.3.1 Participants.
The final questionnaire was distributed and on forwarded to a total of 220
individuals, each of whom, at the time of distribution, was a current or previous
shareholder in at least one of the eight banks investigated, and none of whom had been
included in the group of 17 respondents to the preceding questionnaire. A response rate
of 37 percent was attained (N = 81). Of the 81 respondents to the final questionnaire,
65.43 percent (53 respondents) were male and 34.57 percent (28 respondents) were
female. Respondents to the final questionnaire were in a variety of age ranges; 38.17
percent of respondents (31 people) for the final questionnaire were aged between 26 and
35 years and 23.46 percent of respondents (19 people) were aged between 36 and 45
years.
This part of the pilot study was critical because the reliability and validity of the
constructs measured through the questionnaire needed to be established before the
questionnaire could be used in the testing of hypotheses. This part of the research
involved the application of a Confirmatory Factor Analysis (CFA) to determine construct
reliability and validity. Once CFA established reliability and validity, the final
questionnaire could be used in the main study.
3.3.3.2 Procedure.
Both judgment sampling and snowball sampling were used to engage participants
and invite them to respond to the questionnaire. Invited participants were assured
anonymity in that their identities and in their responses would remain anonymous.
Participants invited to reply to the final questionnaire included a group of shareholders of
ABSC. Paper copies of the final questionnaire were given to family, friends and

138
colleagues of the researcher to complete and/or further distribute to suitably eligible
individuals, those who were either previous or current holders of ABSC shares.
Participants were provided with sealed A3 envelopes containing the final questionnaire,
Expression of Interest Letter, two printed copies of the Participant Consent Form, and
postage-paid, researcher-addressed reply envelopes.
In responding to the final questionnaire, participants were invited to read and
complete each of the parts of the questionnaire by identifying the appropriate responses.
The participants were given four weeks to complete and return the questionnaires.
However, if the questionnaires arrived after the four week period, and before statistical
analysis commenced, they were included in the study. Participants were requested to
return the completed questionnaire and a signed copy of the Participant Consent Form.
Upon receipt of the completed questionnaires and the consent form by the
researcher, the questionnaires and consent forms were separated immediately ahead of
data extraction and analysis. The consent forms were gathered and put into a sealed file.
The questionnaires were also put into a separate sealed file for bulk processing by the
researcher. This was necessary to ensure the anonymity of respondents.
The findings from the analysis of the pilot questionnaire were used to create the
final questionnaire of the pilot study (refer to Appendix G). The final questionnaire was
comprised of two parts. The first part of the questionnaire was designed to extract
demographic information and information on the banking sector shareholdings of
respondents. The second part of the final questionnaire included statements relating to
information about the dimensions of HRC and RC. This was designed to extract
information on whether the respondents perceived the range of statements, relating to the

139
eight HRC and RC dimensions, as important to the decision to purchase banking sector
shares.
The final questionnaire provided items, in the form of policy statements, for each of
the eight HRC and RC dimensions. Eighty-one completed questionnaires were collected
from ABSC shareholders. A five-point Likert scale was used to indicate and measure the
responses from the participants. The Likert scale used by the final questionnaire
respondents included 1 = Not Important, 2 = Less Important, 3 = Unsure, 4 = Important,
and 5 = Very Important. The respondents were instructed to identify the importance of
each statement in their decision to purchase stocks by using the five-point Likert scale.
In developing the final questionnaire, 40 policy statements relating to each of the
five dimensions of HRC and three dimensions of RC were randomly dispersed
throughout the questionnaire. Microsoft ExcelTM
software was used to create a random
distribution of the items. The respondents were unaware of which policy statements
referred to which dimensions of HRC and RC. Table 3.20 provides a breakdown of
which policy statement items relate to which dimensions of HRC and RC.
Table 3.20
Items in the final questionnaire relating to specific dimensions of HRC and RC
Dimension Policy Statement Items
Employee Recruitment
1 11 17 21 24
Employee Retention
2 12 14 29 35
Development of Management &
Leadership Qualities
3 9 13 28 31
Employee Values
4 26 32 34 40

140
Dimension Policy Statement Items
Developing Employee Problem
solving Skills
5 16 22 25 37
Customer Capital
6 8 18 23 30
Supplier Chain Relations
7 19 33 36 38
Competitors
10 15 20 27 39
There were five policy statements for each of the eight dimensions of HRC and
RC. The 40 policy statements were presented to the respondents to measure their
perceptions about the importance of HRC dimensions including employee recruitment,
employee retention, development of management and leadership qualities, employee
values, and developing employee problem solving skills, and the three RC factors
including customer capital, supplier chain relations, and competitors. The data obtained
from the final questionnaire was subjected to validity and reliability testing of the
individual and overall constructs of HRC and RC and their dimensions.
3.3.3.3 Reliability and validation testing.
It was necessary to test the validity of the constructs to ensure the questionnaire
actually measured what should be measured. Confirmatory Factor Analysis (CFA) using
LISREL 8.7 and Reliability Analysis, using SPSS™ Version 15, was performed to test
psychometric properties of the construct including the sub dimensions of construct
validity including reliability, unidimensionality, and convergent validity (Bagozzi &
Phillips, 1982; Venkatraman & Grant, 1986).

141
It was necessary to test the reliability of the constructs to ensure the questionnaire
provided consistency in measurement. The reliability of the constructs was assessed
using Cronbach’s alpha coefficient which ranges from 0 to 1 (Cortina, 1993). An alpha
value of 0.70 and above is considered to be the criterion for demonstrating internal
consistency of established scale (Nunnally, 1988). In this case, an alpha value of 0.70
and above means that the reliability of the constructs used can be measured consistently.
3.3.3.4 Results and Analysis - Demographic Variables.
The demographic variables considered for the study were three categorical
variables. The variable of gender was used for descriptive analysis. Table 3.21 shows
the gender of the participants in this part of the pilot study. The sample of shareholders
was comprised of 53 males (65.43%) and 28 females (34.57%).
Table 3.21
Distribution of the demographic data categorized in a dichotomous manner among
gender
N = 81
The variable of age was also used for descriptive analysis. Table 3.22 shows the
ages of the participants in this part of the pilot study. The majority of the shareholders,
50 of the 81 respondents, belong to the age ranges of 26 to 45 years old (61.73%).
Gender
Frequency
Percent
Male 53 65.43
Female 28 34.57

142
Table 3.22
Distribution of the demographic data categorized among age
N = 81
The variable of education was also used for descriptive analysis. Table 3.23 shows
the education levels of the participants in this part of the research study. The majority of
shareholders, 43 of the 81 respondents (53.09%), were University educated.
Table 3.23
Distribution of the demographic data categorized among educational qualification
N = 81
Output from the final questionnaire also included information on the shareholdings
of the current and previous shareholders of ABSC stocks. That information is presented
in Table 3.24.
Age Frequency Percent
25 or Under 11 13.58
26-35 31 38.27
36-45 19 23.46
46-55 14 17.28
56-65 5 06.17
66 or Over 1 01.23
Education Frequency Percent
Primary 4 04.94
Secondary 19 23.46
TAFE 15 18.52
University 43 53.09

143
Table 3.24
Distribution of the current and previous bank shares held by respondents
Bank Frequency Percent
ADB 02 02.47
ANZ 32 38.27
BEN 03 03.70
BOQ 01 01.23
CBA 46 56.79
NAB 33 40.74
SGB 02 02.47
WBC 19 23.46
Other 02 02.47
The majority of shareholders, 46 of the 81 respondents (56.79%), held CBA shares,
either currently or previously. Over 40 percent of respondents (33 people) indicated they
held NAB shares and over 38 percent of respondents (32 people) indicated they held
ANZ shares. Further to this, 46 respondents indicated they held shares in only one bank
while 35 respondents indicated they held shares in multiple banks. This is shown in
Table 3.25.
Table 3.25
Distribution of the current and previous single or multiple bank shareholdings held by
respondents
N = 81
Frequency Percent
Shareholders of multiple
banks 35 43.21
Shareholders of only one
bank
46 56.79
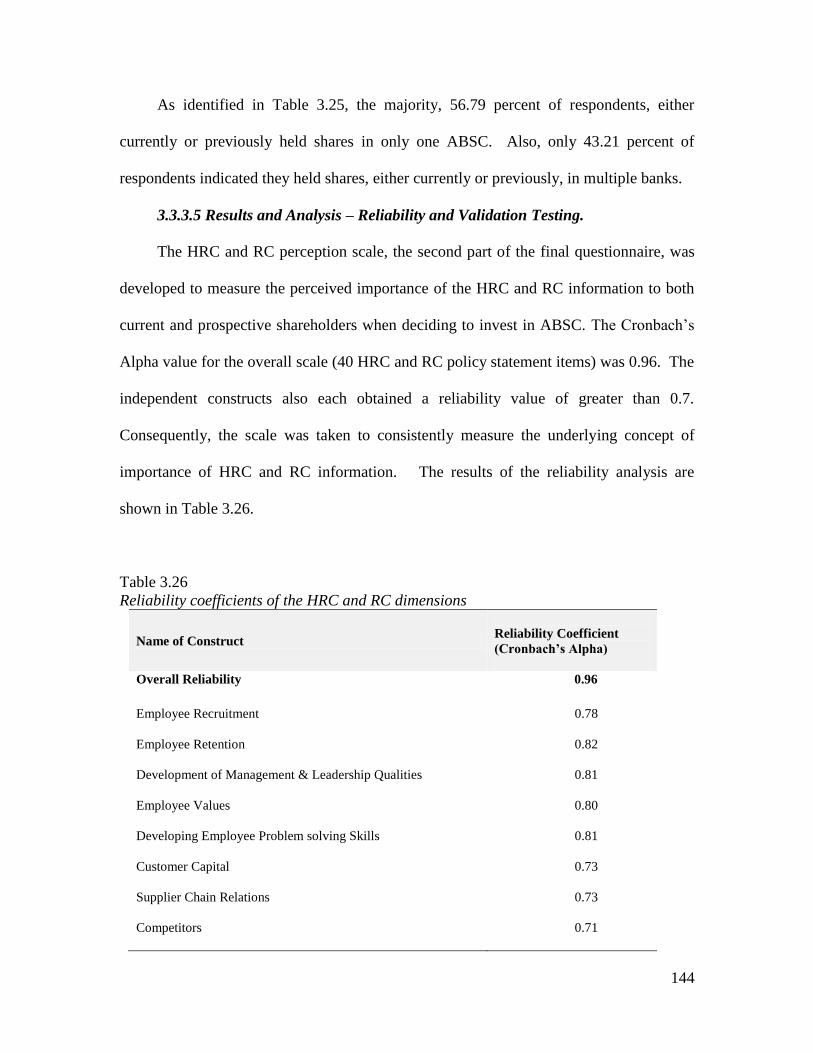
144
As identified in Table 3.25, the majority, 56.79 percent of respondents, either
currently or previously held shares in only one ABSC. Also, only 43.21 percent of
respondents indicated they held shares, either currently or previously, in multiple banks.
3.3.3.5 Results and Analysis – Reliability and Validation Testing.
The HRC and RC perception scale, the second part of the final questionnaire, was
developed to measure the perceived importance of the HRC and RC information to both
current and prospective shareholders when deciding to invest in ABSC. The Cronbach’s
Alpha value for the overall scale (40 HRC and RC policy statement items) was 0.96. The
independent constructs also each obtained a reliability value of greater than 0.7.
Consequently, the scale was taken to consistently measure the underlying concept of
importance of HRC and RC information. The results of the reliability analysis are
shown in Table 3.26.
Table 3.26
Reliability coefficients of the HRC and RC dimensions
Name of Construct
Reliability Coefficient
(Cronbach’s Alpha)
Overall Reliability 0.96
Employee Recruitment 0.78
Employee Retention 0.82
Development of Management & Leadership Qualities 0.81
Employee Values 0.80
Developing Employee Problem solving Skills 0.81
Customer Capital 0.73
Supplier Chain Relations 0.73
Competitors 0.71

145
CFA was conducted to establish the validity of the constructs in reference to
unidimensionality, convergent validity and internal consistency. The purpose of
performing the CFA was to test the unidimensionality of the multi-item constructs and to
eliminate unreliable items. The CFA contains inferential statistics that allow for a strict
and objective interpretation of validity (Byrne, 2006; Gerbing & Anderson, 1988).
Additionally, unidimensionality, convergent and discriminant validity tests can be
assessed. Two sets of statistics are used for the verification of unidimensionality and
convergent validity (Byrne, 2006; Venkatraman, 1989). These include the significance of
the factor loadings and the overall acceptability of the measurement model in terms of its
fit to the data using a χ2 test and adjunct fit indexes which should exceed the cut-off point
of 0.90. The Goodness of Fit Index (GFI) was devised by Joreskog and Sorbom (1984)
for maximum likelihood estimation and has been generalized to other estimation criteria
by Tanaka and Huba (1985). GFI has a value which ranges from zero to one; the value of
one indicates a perfect fit. The Normed Fit Index (NFI), also called Bentler-Bonnett
Coefficient, is an indication of convergent validity (Ahire, 1996; Byrne, 2006). A
Normed Fit Index (NFI) of 0.90 or above indicates that there is a strong evidence of
convergent validity for the construct (Ahire, 1996; Byrne, 2006). Unidimensionality
indicates the items of the factor/construct measure one common latent variable. To
measure unidimensionality, using CFA, a measurement model is specified for each
construct (Ahire, 1996; Byrne, 2006). A Comparative Fit Index (CFI) of 0.90 or above
indicates that there is strong evidence of unidimensionality for the construct (Ahire, 1996;
Byrne, 2006). While CFA terminology is used in a variety of ways in the literature, here
CFA was used as presented by Hunter and Gerbing (1982; Rubio, Berg-Weger, & Tebb,

146
2001); that is, CFA is a test of a theoretical model, as opposed to a random ordering of
factors based on matrix algebra and a varimax rotation formula embedded within the
principal components approach to factor analysis. CFA generates only the number of
factors that are specified. CFA also does not rely on Eigen values to compute the amount
of variance accounted for by each factor or to identify the appropriate number of factors
(Hunter & Gerbing, 1982; Rubio et al., 2001). CFA is an excellent method of factor
analysis in the identification and specification of item errors within a model (Hunter &
Gerbing, 1982; Rubio et al., 2001). Thus, CFA is a superior technique when the a priori
specification of items expected to cluster together is possible (Fink & Monge, 1985;
Hunter & Gerbing, 1982; Rubio et al., 2001). As shown in Table 3.27, the factor
loadings and CFI, GFI, and NFI values, respectively, are indicative of a good fit, which
means the scale demonstrated unidimensionality.
Table 3.27
Factor Loadings and Fit indices for CFA of HRC and RC Perception Scale
Construct Item No. Factor
loadings CFI NFI GFI
Employee Recruitment
1 0.65
0.990 0.981 0.986
11 0.70
17 0.64
21 0.71
24 0.57
Employee Retention
2 0.77
0.992 0.972 0.977
12 0.63
14 0.75
29 0.67
35 0.66
3 0.69
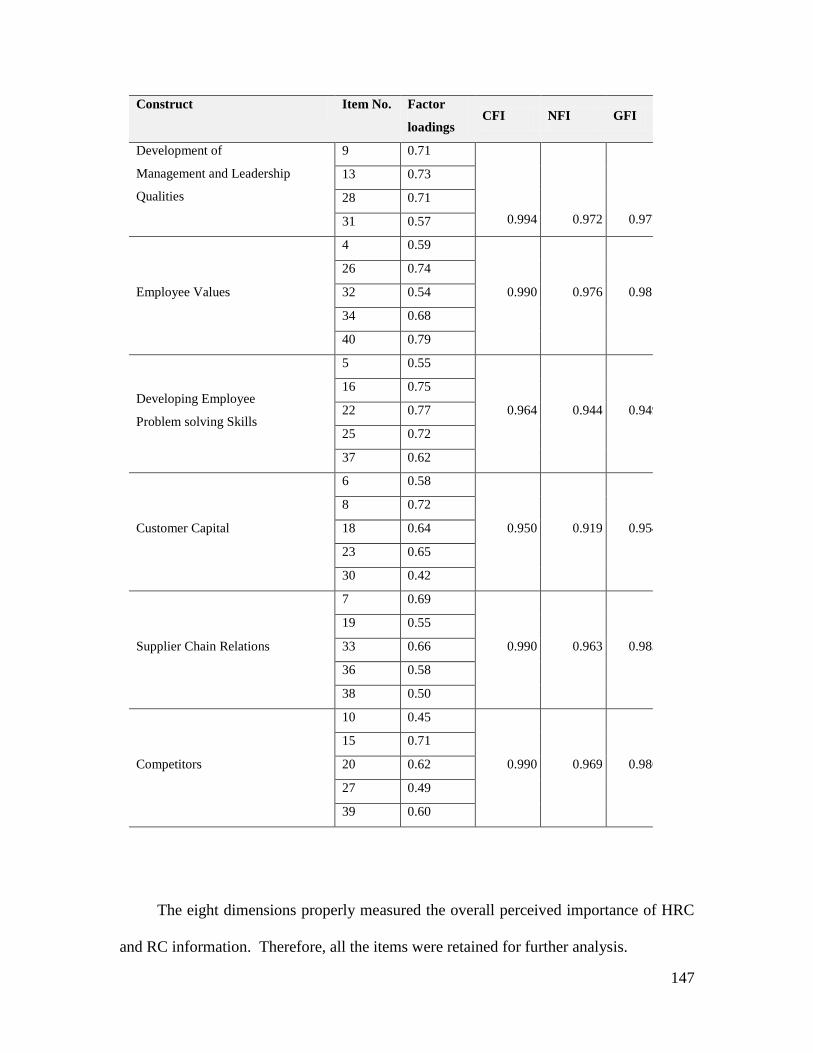
147
Construct Item No. Factor
loadings CFI NFI GFI
Development of
Management and Leadership
Qualities
9 0.71
0.994
0.972
0.977
13 0.73
28 0.71
31 0.57
Employee Values
4 0.59
0.990 0.976 0.981
26 0.74
32 0.54
34 0.68
40 0.79
Developing Employee
Problem solving Skills
5 0.55
0.964 0.944 0.949
16 0.75
22 0.77
25 0.72
37 0.62
Customer Capital
6 0.58
0.950 0.919 0.954
8 0.72
18 0.64
23 0.65
30 0.42
Supplier Chain Relations
7 0.69
0.990 0.963 0.983
19 0.55
33 0.66
36 0.58
38 0.50
Competitors
10 0.45
0.990 0.969 0.986
15 0.71
20 0.62
27 0.49
39 0.60
The eight dimensions properly measured the overall perceived importance of HRC
and RC information. Therefore, all the items were retained for further analysis.

148
3.3.3.6 Discussion.
Of the 81 respondents to the final questionnaire, 65.43 percent were male and 34.57
percent were female. The majority of the shareholders, 61.73 percent of respondents,
belonged to the age ranges of 26 to 45 years old. The majority of shareholders, 53.09
percent, responded they were university educated. Also, the majority of shareholders,
56.79 percent, held CBA shares, either currently or previously. More than 40 percent of
respondents indicated they held NAB shares and more than 38 percent of respondents
indicated they held ANZ shares. Additionally, 56.79 percent of respondents indicated
they held shares in only one bank while 43.21 percent of respondents indicated they held
shares in multiple banks. The majority of shareholders, 56.79 percent, either currently or
previously held shares in only one of the ABSC. However, only 43.21 percent of
respondents indicated they held shares, either currently or previously, in multiple banks.
The HRC and RC perception scale, the final questionnaire which includes the 40
HRC and RC policy statement items, was developed to measure the perceived importance
of HRC and RC information to shareholders when deciding on investing in banking
sector companies. The perception scale was subjected to CFA tests to establish reliability
and validity, to determine whether the items measured the constructs in a correct and
consistent manner.
CFA was conducted to establish the validity of the constructs in reference to
unidimensionality, convergent validity, and internal consistency. This was based on the
fact that CFA is a superior technique when the a priori specification of items expected to
cluster together is possible (Fink & Monge, 1985; Hunter & Gerbing, 1982; Rubio et al.,
2001). CFA is used to test if the measures of a given construct are consistent with the

149
understanding of the nature of that construct, to ensure that items presented by a
researcher are able to measure correctly the underlying concept.
Reliability analysis on the perception scale was conducted using Cronbach’s Alpha
Coefficient. The Cronbach’s Alpha value for the overall scale was 0.96. Each
independent construct also obtained a reliability value of greater than 0.7. As a result, the
scale was taken to measure consistently the underlying concept of the importance of HRC
and RC information to the decision to purchase banking sector stocks.
Based on the analysis, it was also found that the factor loadings and CFI, GFI, and
NFI values, respectively, were indicative of a good fit, which meant the scale
demonstrated construct validity. The eight HRC and RC dimensions were found to
measure properly the overall perceived importance of HRC and RC information to the
decision to purchase banking sector stocks. Therefore, all of the 40 HRC and RC policy
statements were retained for further analysis.
While the 40 HRC and RC policy statements were found to be both reliable and
valid items, the results of the CFA also represent a limitation of the study. In carrying out
CFA on a set of items, statisticians refer to a broad range of guidelines relating to
adequacy of sample size. CFA involves the testing of the null hypothesis, relating to
absolute confidence in the probability of model reproduction. However, the restrictive
nature of conventional CFA analysis has been questioned in relation to error of
approximation and confidence levels (Gagné & Hancock, 2006; Raycov, 1997). This is
especially in relation to the affect of sample size. Of significance to this research is the
awareness that, while all items were found to be reliable and valid, the use of CFA
presented a limitation to the research in terms of absolute confidence in the findings.

150
With regard to sample size, Raycov (1997) argues that the results of CFA may be
flawed and erroneous. This is because, in relation to personality testing, a traditional
approach to CFA is subject to a number of restrictive assumptions, including the need for
an optimal sample size (Raycov, 1997). Raycov suggests that both the size of the sample
and complexity of the factors tested needs to be considered by researchers. In proposing
a non-conventional method to CFA, Raycov suggests that the testing of the null
hypothesis is too rigid, and that testing for reasonable rather than absolute fit may be
what is needed in personality research in order to extract quality information.
Gagné and Hancock (2006) also assert that although there has been some
disputation concerning the size that represents “enough” two things have generally been
accepted. The first is that larger sample sizes appear to provide greater confidence in
CFA results, and the second is that any claims made in relation to a specific minimum
necessary sample size have little empirical support.
The research by Gagné and Hancock (2006) supports the contention that larger
samples, more indicators for each factor, and stronger factor loadings broadly improve
model convergence and parameter estimation. However, their research does not support
the idea of an absolute minimum sample size for CFA, nor does it support the idea of a
critical ratio of sample size to number of factors.
With the studies of Gagné and Hancock (2006) and Raycov (1997) in mind, it is
suggested that a limitation of the research study, in relation to the CFA, is that the sample
size used was not large. However, for the purpose of this current research, it means that
the CFA will not result in an absolute level of confidence but rather in a reasonable level
of confidence in the validation of the construct measures. The constraints posed by the

151
limited sample size also represent the potential for future research to test the perception
scale with a much larger sample size. Future research has the potential to determine
whether the perception scale will continue to be reliable and valid when CFA can be
carried out with a much larger sample size or whether changes will need to be made to
the perception scale.
3.3.3.7 Summary.
The pilot study successfully established the construct reliability and validity of the
final questionnaire. The Cronbach’s Alpha value was used to confirm reliability for the
overall scale and for the independent constructs and CFA was also used to establish the
validity of the constructs. The testing confirmed that the HRC and RC perception scale
questionnaire was both reliable and valid and could be used in the main study.
3.4 Overview of the Pilot Study
The completion of the pilot questionnaire resulted in the determination of a list of
the functions of HRM that represent the HRC and RC dimensions of IC. The dimensions
of HRC were determined to include employee recruitment, employee retention, employee
values, development of management and leadership qualities, and developing employee
problem solving skills. The dimensions of RC were determined to include customer
capital, supplier chain relations, and competitors. The five HRC dimensions and three
RC dimensions were determined to be relevant to decisions to purchase ABSC stocks.
Derived from the five HRC dimensions and three RC dimensions, 40 items, set out as
HRC and RC policy statements, were developed and presented to respondents in the pilot
questionnaire. Following this, the objective of the pilot study was successfully achieved.

152
In achieving the objective of the pilot study, CFA was used to successfully validate
the 40 policy statement items within the final questionnaire. This was necessary to
ensure the items within the final questionnaire were able to be used to properly measure
the five dimensions of HRC and three dimensions of RC. This was needed to measure
the perceptions of individual, ABSC shareholders, in relation to how relevant HRC and
RC policy information is to their decisions regarding purchasing ABSC stocks. The
items within the final questionnaire were determined to be reliable and valid and the
questionnaire was retained for use in the main study.
The completion of the pilot study represents the foundation for the main,
hypotheses-testing study. The main study is discussed in Chapter 4.

153
Chapter Four
Main Study Research Method
4.1 Research Methods – Supporting the Purpose of the Main Study
Previous research such as that conducted by Lev (2001) contends that information
asymmetry produces uncharacteristic gains to informed investors and chips away at
investor confidence in the integrity of capital markets. Lev contends that share market
volatility may be attributed to such deterioration in investor confidence (Lev, 2001). As
such, this research is driven by ideas aligned to behavioural economic theories and the
field of behavioural finance which infer that investors do not have equal access to
corporate information regarding HRC and RC dimensions and are not always rational in
their stock transaction decisions as they are influenced by psychological biases (Daniel,
Hirshleifer, & Subrahmanyam, 1998, 2004). Behavioural economic theories attempt to
explain market bubbles and crashes and suggest that market reactions may be attributed
to several cognitive biases including biased self-attribution and overconfidence (Daniel,
Hirshleifer, & Subrahmanyam, 1998, 2004). The researchers contend that stock investors
overreact to private information and under-react to public information signals due to their
biased self-attribution and over-confidence, and that behavioural economics is a
complement to rational economic theories by providing insight into instances of irrational
consumer decision-making and behaviour.
This research is also driven by the principle of HC representing a lead indicator of
future financial performance, and the idea that HC analysis is required for knowledge-
based industries which include banking sector industries (Chen, Cheng, & Hwang, 2005;
Royal & O’Donnell, 2008). It is further driven by the underlying theoretical principles

154
regarding tacit assets that suggest that a lack of reporting on intangible assets may make
intangible-rich companies appear less valuable than they really are (Guthrie & Petty,
1999; Guthrie, Petty, & Ricceri, 2006), and by what has been established about company
performance, that it is directly related to corporate SHRM practices and policies (Huselid
et al., 1997).
Past research in the fields of HR and IC Management, measurement and reporting,
has yielded a number of contentions. For example, this research study recognizes that IC
information, which includes information on the HRC and RC dimensions within a firm, is
likely considered by shareholders in their investment decisions (Ballow et al., 2004;
Bontis & Fitz-Enz, 2002; Bukh, 2003; Chen et al., 2005; Guthrie et al., 2006; Lev, 2000;
Saenz, 2005). The research study also recognizes that corporations infer their total value
from the difference between their market and book values (Ballow et al., 2004). As such,
the research study considers the contention that IC rich companies who fail to report on
their IC dimensions short-sell themselves by appearing to be of less value than they really
are (Guthrie & Petty, 1999; Guthrie et al., 2006). Finally, the research study is concerned
with the contention that the results of information asymmetry include abnormal gains to
informed investors, deterioration of investor confidence in capital markets based on
intangibles and information asymmetry, broadening of bid-ask spreads of securities and,
as a consequence, soaring transaction costs to investors and an increase in the cost of
capital (Lev, 1996; 2000).
As for the Australian banking sector, the public is often unaware of the positive
HRC and RC policy initiatives the banks carry out in an effort to grow the business, as
much of the focus of the annual reports is on the financial information. This therefore

155
leaves individual investors in the dark. Australian banking corporations stand to realize
an appreciation in their stock prices with the disclosure of HRC and RC information
which may prompt them to go beyond voluntary disclosure and work on an industry-wide
reporting template. Demonstrating a positive relationship between disclosure and stock
price appreciation may be the motivator needed to encourage and improve levels of
voluntary corporate transparency on the non-financial factors of HRC and RC.
Contingent on the results of the research, the ABSC may be encouraged to come
together to develop a structured and uniform way of reporting on their HRC and RC
policies within their annual reports. This will make it easier for individual shareholders
and potential investors to compare the HRC and RC policies of the corporations in
question and may ease the disparity between what HRC and RC policy information
professional investors have access to and what “mum and dad” investors have access to
in their investment decisions. Therefore, the main study is undertaken in two parts to
impress on the banks the importance of reporting on HRC and RC dimensions in their
annual reports to increase the market value of their shares.
The first part of the main study focuses on the perceptions of individual
shareholders about the importance of HRC and RC dimensions and focuses on the impact
of their perceptions on share investment decisions. The second part of the main study
focuses on assessing the frequency and quality of disclosure of HRC and RC dimensions
by the ABSC and whether disclosure leads to a net appreciation of share price for each of
the relevant ABSC. This research study was undertaken to achieve four specific aims.
These include: (1) to investigate the perceptions of individual investors about information
concerning the IC components of HRC and RC; (2) to understand the sources of share

156
investment advice individual investors turn to in their investment decisions; (3) to
determine if, in the corporate annual reports of ABSC, information on HRC and RC
dimensions is provided to investors, seeking an understanding of the differences in how
ABSC report on HRC and RC dimensions; and (4) to provide an assessment of the
relationship between the disclosure of HRC and RC and its impact on share value, as
share market volatility and share price fluctuation are issues that impact all investors.
Figure 4.1 demonstrates the design of the main study.
Figure 4.1. Design of the main study
Main Study
Part One
Aims
(1) To investigate shareholder perceptions
about the importance of HRC and RC dimensions
and
(2) To investigate the impact of sources of advice and
demographic variables on the relationship between
shareholder perceptions and share investment decisions
- Various statistical testing on data extracted from the Main Study Questionnaire
Part Two
Aims
(3) To investigate percent frequency and quality of
disclosure of HRC and RC dimensions of ABSC
and
(4) To investigate whether disclosure leads to net
appreciation of share price for each of the relevant ABSC
- Focus Group for thematic Content Analysis of ABSC Corporate Annual Reports
- Comparative Analysis on output of Content Analysis
- CAR Analysis based on output of Content Analysis
and Share Price Information for the relevant ABSC and
their reporting periods

157
The first two aims of the study are discussed in detail in Section 4.2. The second
two aims are discussed in detail in Section 4.3. To achieve these four aims,
investigations pertaining to the seven research questions were completed by testing
fourteen hypotheses and their related sub-hypotheses. The related research questions,
hypotheses, and their related sub-hypotheses are provided in both parts of the main study.
4.2 Main Study Part One - Importance and use of HRC and RC Dimensions
The first part of the main study is designed to achieve two aims of the research
study. The first research aim is to understand how important the individual shareholders
of ABSC perceive HRC and RC dimensions are and how they use information relating to
those dimensions. This is necessary to help determine the impact of those perceptions on
their investment decisions/choices to purchase, hold on to, and sell shares in ABSC. The
second aim of the research study is to provide an understanding of how individual
shareholder perceptions, sources of share investment advice individual investors refer to
in making their share investment choices, and the demographic profiles of shareholders,
impact on their investment decisions. The ASX shareholder survey 2006 (ASX, 2007)
identified a list of sources of advice used by Australian shareholders, and this research
study is set out to test whether the respondents are influenced by the same sources of
investment advice in their share investment decisions. Specifically relating to sources of
advice, the intention is to determine whether the advice has a moderating effect on the
share investment decisions of shareholders, given their own perceptions of importance of
the information about the HRC and RC dimensions.

158
4.2.1 Research questions, hypotheses, and sub-hypotheses.
Behavioural economic theories and the field of behavioural finance have suggested
that investors do not have equal access to corporate information (which includes HRC
and RC dimensions) and do not always make rational stock transaction decisions as
investors are influenced by psychological biases (Daniel, Hirshleifer, & Subrahmanyam,
1998, 2004). Behavioural economic theories, therefore, may be used to explain market
bubbles and crashes, as irrational market reactions have been attributed to several
cognitive biases including biased self-attribution and overconfidence (Daniel, Hirshleifer,
& Subrahmanyam, 1998, 2004). The contention is that stock investors tend to overreact
to private information and under-react to public information signals due to their biased
self-attribution and over-confidence. The previous research has suggested that
behavioural economics is a complement to rational economic theories, in that it has the
capacity to provide insight into instances of irrational decisions by investors and of
investor behaviour.
In addition to highlighting the application of behavioural economic theories, this
research also refers to previous research that contends that IC information, provided to
stakeholders of organizations, enhances the transparency of organizations by allowing
them to illustrate their hidden value and long term development options (Alwert et al.,
2009; Ax & Marton, 2008; Petty et al., 2008; Royal & O’Donnell, 2004, 2008). In light
of this contention, researchers have studied the perceptions and behaviours of various
groups of stakeholders, including analysts and bankers (Alwert et al, 2009; Royal &
O’Donnell, 2004, 2008), the perceptions of management (Ax & Marton, 2008) and the
perceptions of accountants (Petty et al., 2008) in relation to the importance they place on

159
the disclosure of IC information in corporate annual reports, to their assessments of
corporate values. Royal and O’Donnell (2008), go a step further by focusing specifically
on the human capital elements of IC. Also, research by the ASX (2005, 2007) has
provided an insight into the demographic information and investment actions of
Australian investors in the ASX listed companies.
Royal and O’Donnell (2004) found that the analysis of human capital is
tremendously important for general managed funds and securities analysts to enable them
to anticipate future events within corporations. They suggest a structured form of human
capital analysis as an indicator of future corporate performance rather than an analysis of
purely financial data which provides only historical performance measurement. This
current research has the potential to suggest that what Royal and O’Donnell (2004)
propose may be valid for both analysts and individual shareholders alike, depending on
the perceptions held by individual shareholders.
Royal and O’Donnell (2008) involved using a case study analysis to understand
how organizations, and their main stakeholders, may benefit from an enhanced
understanding of the role of intangible assets. In relation to the professional and non-
professional investors, the focus of the research was on how human capital has the power
to create corporate value for organizations. The focus was on biotechnology firms and
financial institutions were regarded as key stakeholders of the biotechnology firms. They
found that human capital analysis enables financial analysts, traders and fund managers to
potentially identify the resilience of a listed stock, ahead of time. They recognised that
each individual’s ability to read all the information, quantitative and qualitative, based on
tangible and intangible value creation processes and to act upon the information in a

160
timely manner, gave them a competitive edge, this was assuming that information on
intangibles was available to the public.
Royal and O’Donnell (2008) assert it is possible to analyse and interpret qualitative
information about public corporations to enable the investment process to be increasingly
transparent to all stakeholders, including securities analysts. They suggest that this may
convince other researchers in the field to build on intangible asset analysis approaches to
make the tacit assets more explicit. Their research supports their contention that
information on human capital is valuable and that it is being used unsystematically by
equity markets and hedge fund managers in their investment decision processes and that a
human capital lens proposes a systematic approach to examining the future potential
performance of listed stocks and can be utilized as a type of risk management which is
critically important to knowledge-intensive firms. Their research findings indicate that
the financial sector may be required to push past the use of indices and ethical investment
screens to provide a better understanding of the role of intangible assets in corporate
value creation and improvement. They argue that more qualitative information on listed
companies can be analysed and interpreted to make the investment process more
transparent to all stakeholders, including securities analysts. This has the potential to
influence other researchers to extend these approaches to improve the quality of
intangibles analysis.
Royal and O’Donnell (2008) deemed their research as valuable in adding to the
literature by creating the theoretical connection between the independent disciplines of
SHRM, intangible assets analysis, and innovation in investment. Unlike Royal and
O’Donnell (2008), this current research relates more to non-professional, rather than

161
professional investors. It does, however, share the idea of providing a link between
SHRM and analysis of information on intangibles, focusing on the ability of stakeholders
to analyse and interpret qualitative data. However, it does not have a focus on innovation
on investment, but rather on the specific components of HRC and RC dimensions and on
how important they are perceived to be by individual shareholders in their decision-
making.
Petty, Ricceri, and Guthrie (2008) also provide some valuable research in the field
of IC management and reporting. They provide an empirical assessment of how a group
of financial professionals in Hong Kong used IC information, and how valuable they
perceived IC reporting to be. They wanted to understand the group’s ability to privately
obtain information that had the potential to help them determine the value of a company’s
IC to support their decision-making. The researchers used a questionnaire, designed
using Kelly’s Repertory Grid procedure for extracting the respondents’ vocabulary
(Kelly, 1955). The survey was administered randomly to 238 members of CPA Australia,
during professional development sessions and office visits in 2004. Petty, Ricceri, and
Guthrie found that respondents did not find information provided by the traditional
financial accounting model all that useful and that this set of results agrees with the
literature that suggests a loss of relevance of accounting data. Despite this finding, they
were able to conclude that those members of CPA Australia, who work in Hong Kong,
were still using the annual reports to learn about a companies, and that the respondents
would prefer companies to be more transparent and provide more information about their
IC. Respondents indicated that they thought that increased IC disclosure would be.
However, what is generally missing from their research is information into the

162
perceptions of “mum and dad” investors, specifically, what their HRC and RC
information expectations and needs are, and how important they perceive the HRC and
RC information provided in corporate annual reports to be. Therefore, this also
represents a gap in the research and the prospect for the further expansion of knowledge
in the field of IC management and reporting from an HRM perspective. That is, as
distinct from most previous research, this research deals only with the HR components of
IC, deals only with the perceptions of “mum and dad” investors, and deals only with the
shareholders of ABSC.
To achieve the aims of Part One of the Main Study, it is necessary to provide the
requisite answers and insight into five research questions by testing 10 hypotheses
through the testing of their related sub-hypotheses. The research questions, hypotheses,
and their related sub-hypotheses are provided within this section.
Research Questions One to Five, focus on the perceptions of ABSC shareholders,
whether of single or multiple ABSC, on how their perceptions about the importance of
HRC and RC dimensions influence their share investment decisions, and on whether
sources of advice and demographic variables have a moderating influence between their
perceptions and their use of information regarding the HRC and RC dimensions of
ABSC. The dimensions of HRC and RC, as identified and developed in the pilot study,
have been thoroughly researched and set out in the pilot study, and have provided the
foundation for this component of the research study.
Broadly speaking, the utilization and evolution of IC management, measurement
and reporting practices is recognition of the high value attached to the disclosure of IC
information. However, what is missing from the research is information about what HRC

163
and RC dimensions individual “mum and dad” shareholders consider in their decisions
and what value they place on the information.
Building on what has already in the literature on IC management, measurement,
and reporting, this research study endeavours to extend the literature. This study attaches
importance to understanding, not only the perceptions of individual “mum and dad”
shareholders, but also the related actions of this group of investors as a result of their
individual perceptions. No research has gone so far as to focus on this specific segment
of the market in relation to their requirements for information about HRC and RC
dimensions.
Complementing prior research that investigated stock investments made by
professional investors, the research presented here, within the first part of the main study,
focuses on what is referred to as individual “mum and dad” investors. These investors
are identified as conservative in their investment choices and selective of shares in
companies that are household names, easily recognized in the community. Australia’s
banking sector was also selected for this research as it provides common and familiar
brand names and a conservative investment opportunity for “mum and dad” investors.
However, while this research study considers and draws on what has been
investigated in the past there is limited research available in the literature to use in
developing the hypotheses for research questions One to Five. The questions and
hypotheses have no specific, previous research to build on as what has been investigated
in the past is more broad-based and only provides a vague backdrop for this research.
The questions here are quite specific to this research study. The research intention is
explorative in nature, designed to assess whether there exists a relationship between

164
specific ABSC share ownership, ABSC share transaction decisions, and perceptions of
importance of HRC and RC dimensions to ABSC share transaction decisions. As such,
Part One of this current research study represents an exploratory study. The explorative
research focuses quite specifically on the perceptions of individual, “mum and dad”
investors, on how they perceive information on HRC and RC dimensions, especially in
the context of the corporate annual reports of ABSC.
Research Question One
What are the differences in the perceptions of individual shareholders of the
importance of HRC and RC dimensions between ownership of stocks in the different
ABSC?
Hypothesis 1
Shareholders of Australia’s four biggest banks, including the CBA, WBC, NAB
and ANZ, have significant differences in perception of the importance of HRC
dimensions in the decision to purchase ABSC stocks.
Sub-hypothesis 1 (a)
There is a significant difference in perception of the importance of “employee
recruitment” information in the decision to purchase ABSC stocks.
Sub-hypothesis 1 (b)
There is a significant difference in perception of the importance of “employee retention”
information in the decision to purchase ABSC stocks.
Sub-hypothesis 1 (c)
There is a significant difference in perception of the importance of “employee values”
information in the decision to purchase ABSC stocks.
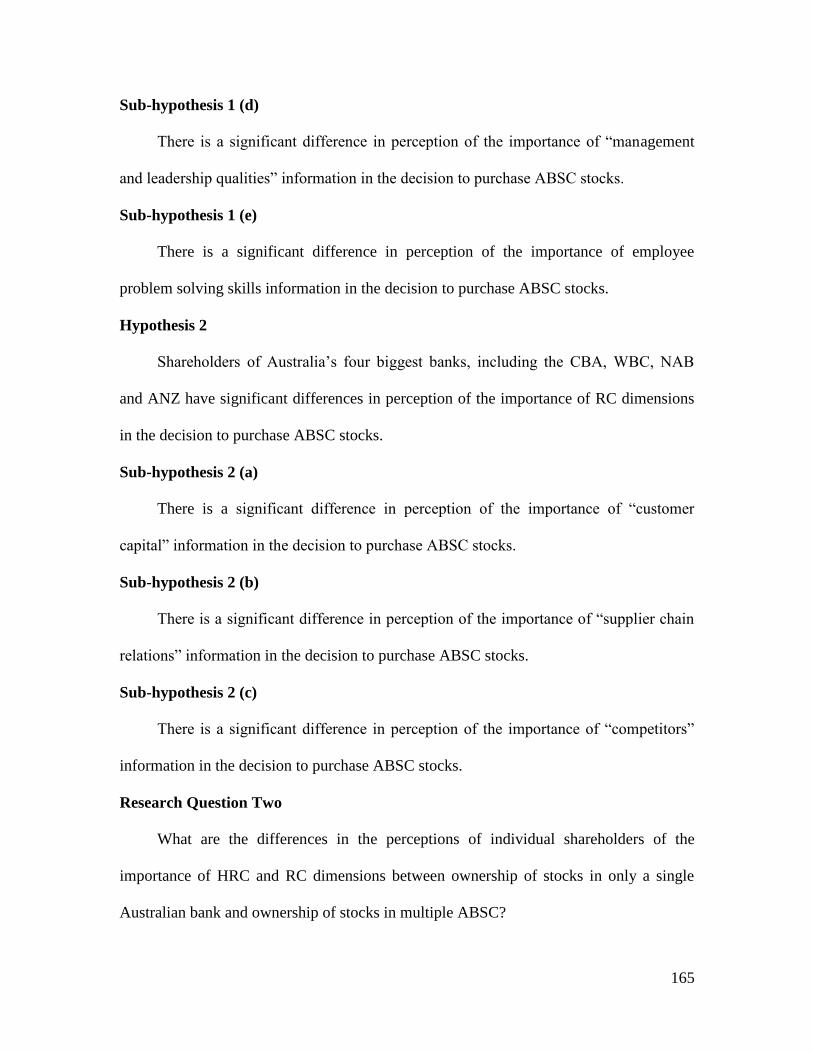
165
Sub-hypothesis 1 (d)
There is a significant difference in perception of the importance of “management
and leadership qualities” information in the decision to purchase ABSC stocks.
Sub-hypothesis 1 (e)
There is a significant difference in perception of the importance of employee
problem solving skills information in the decision to purchase ABSC stocks.
Hypothesis 2
Shareholders of Australia’s four biggest banks, including the CBA, WBC, NAB
and ANZ have significant differences in perception of the importance of RC dimensions
in the decision to purchase ABSC stocks.
Sub-hypothesis 2 (a)
There is a significant difference in perception of the importance of “customer
capital” information in the decision to purchase ABSC stocks.
Sub-hypothesis 2 (b)
There is a significant difference in perception of the importance of “supplier chain
relations” information in the decision to purchase ABSC stocks.
Sub-hypothesis 2 (c)
There is a significant difference in perception of the importance of “competitors”
information in the decision to purchase ABSC stocks.
Research Question Two
What are the differences in the perceptions of individual shareholders of the
importance of HRC and RC dimensions between ownership of stocks in only a single
Australian bank and ownership of stocks in multiple ABSC?

166
Hypothesis 3
There is a significant difference in the perceptions of importance of HRC
dimensions in the decision to purchase ABSC stocks of shareholders who have ownership
in only one of the big four Australian banks, and of shareholders who have ownership in
multiple banks, including one of the big four banks.
Sub-hypothesis 3.1
(a) There is a significant difference in the perceptions of importance of “employee
recruitment” information in the decision to purchase ABSC stocks of shareholders who
have ownership in CBA and of shareholders who have ownership in both CBA and
multiple banks.
(b) There is a significant difference in the perceptions of importance of “employee
retention” information in the decision to purchase ABSC stocks of shareholders who have
ownership in CBA and of shareholders who have ownership in both CBA and multiple
banks.
(c) There is a significant difference in the perceptions of importance of “employee
values” information in the decision to purchase ABSC stocks of shareholders who have
ownership in CBA and of shareholders who have ownership in both CBA and multiple
banks.
(d) There is a significant difference in the perceptions of importance of
“management and leadership qualities” information in the decision to purchase ABSC
stocks of shareholders who have ownership in CBA and of shareholders who have
ownership in both CBA and multiple banks.

167
(e) There is a significant difference in the perceptions of importance of “employee
problem solving skills” information in the decision to purchase ABSC stocks of
shareholders who have ownership in CBA and of shareholders who have ownership in
both CBA and multiple banks.
Sub-hypothesis 3.2
3.2 (a) to (e) is tested in relation to shareholders of WBC;
Sub-hypothesis 3.3
3.3 (a) to (e) is tested in relation to shareholders of NAB; and,
Sub-hypothesis 3.4
3.4 (a) to (e) is tested in relation to shareholders of ANZ.
Hypothesis 4
There is a significant difference in the perceptions of importance of RC dimensions
in the decision to purchase ABSC stocks of shareholders who have ownership in only one
of the big four Australian banks, and of shareholders who have ownership in multiple
banks, including one of the big four banks.
Sub-hypothesis 4.1
(a) There is a significant difference in the perceptions of importance of “customer
capital” information in the decision to purchase ABSC stocks of shareholders who have
ownership in CBA and of shareholders who have ownership in both CBA and multiple
banks.
(b) There is a significant difference in the perceptions of importance of “supplier
chain relations” information in the decision to purchase ABSC stocks of shareholders

168
who have ownership in CBA and of shareholders who have ownership in both CBA and
multiple banks.
(c) There is a significant difference in the perceptions of importance of
“competitors” information in the decision to purchase ABSC stocks of shareholders who
have ownership in CBA and of shareholders who have ownership in both CBA and
multiple banks.
Sub-hypothesis 4.2
4.2 (a) to (c) is tested in relation to shareholders of WBC;
Sub-hypothesis 4.3
4.3 (a) to (c) is tested in relation to shareholders of NAB; and,
Sub-hypothesis 4.4
4.4 (a) to (c) is tested in relation to shareholders of ANZ.
Research Question Three
Do individual shareholders’ perceptions of the importance of HRC and RC
dimensions relate to their decisions to purchase ABSC stocks?
Hypothesis 5
There is a significant relationship between an individual shareholder’s perception of
the importance of HRC dimensions and the use of HRC dimensions in the decision to
purchase ABSC stocks.
Sub-hypothesis 5 (a)
There is a significant relationship between an individual shareholder’s perception of
the importance of “employee recruitment” information and the use of that information in
the decision to purchase ABSC stocks.
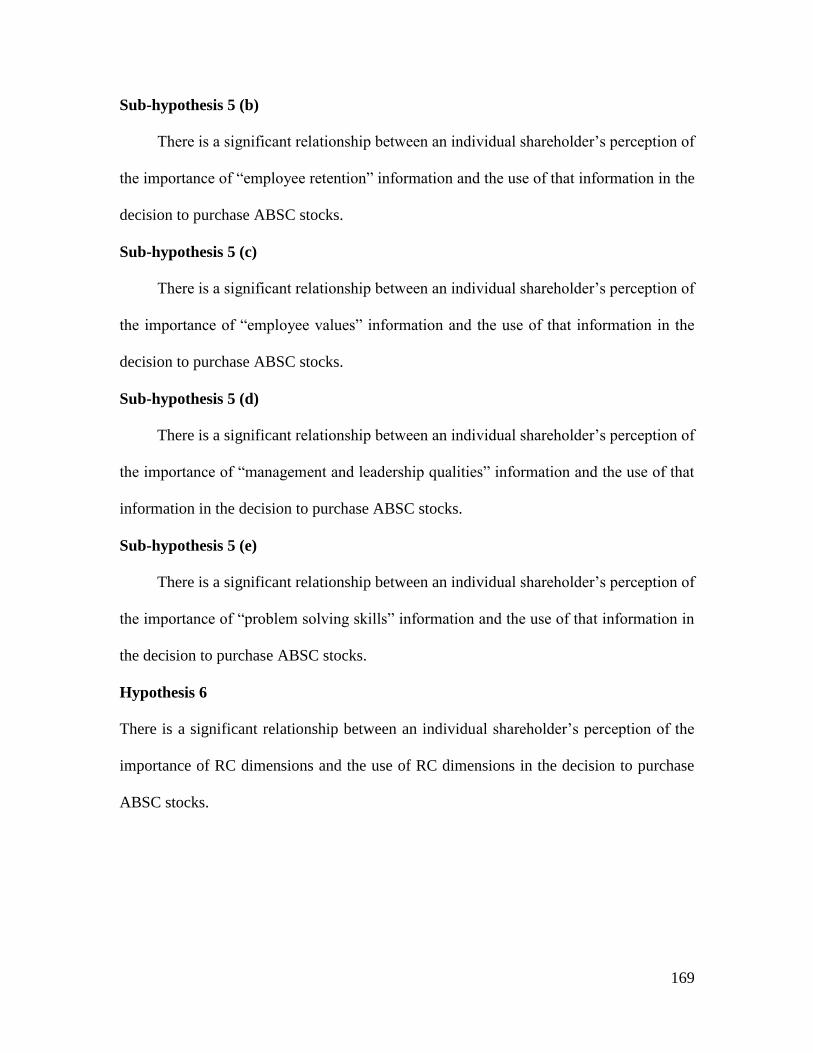
169
Sub-hypothesis 5 (b)
There is a significant relationship between an individual shareholder’s perception of
the importance of “employee retention” information and the use of that information in the
decision to purchase ABSC stocks.
Sub-hypothesis 5 (c)
There is a significant relationship between an individual shareholder’s perception of
the importance of “employee values” information and the use of that information in the
decision to purchase ABSC stocks.
Sub-hypothesis 5 (d)
There is a significant relationship between an individual shareholder’s perception of
the importance of “management and leadership qualities” information and the use of that
information in the decision to purchase ABSC stocks.
Sub-hypothesis 5 (e)
There is a significant relationship between an individual shareholder’s perception of
the importance of “problem solving skills” information and the use of that information in
the decision to purchase ABSC stocks.
Hypothesis 6
There is a significant relationship between an individual shareholder’s perception of the
importance of RC dimensions and the use of RC dimensions in the decision to purchase
ABSC stocks.

170
Sub-hypothesis 6 (a)
There is a significant relationship between an individual shareholder’s perception of
the importance of “customer capital” information and the use of that information in the
decision to purchase ABSC stocks.
Sub-hypothesis 6 (b)
There is a significant relationship between an individual shareholder’s perception of
the importance of “supplier chain relations” information and the use of that information
in the decision to purchase ABSC stocks.
Sub-hypothesis 6 (c)
There is a significant relationship between an individual shareholder’s perception of
the importance of “competitors” information and the use of that information in the
decision to purchase ABSC stocks.
Research Question Four
Do individual shareholders perceive HRC and RC dimensions to differ in
importance for use in the purchase, holding on to, or selling of ABSC stocks?
Hypothesis 7
There is a significant difference in the importance attributed to HRC dimensions
among the decisions to purchase, hold on to, or sell ABSC stocks.
Sub-hypothesis 7.1
There is a significant difference in the importance attributed to “employee
recruitment” information among the decisions to (a) purchase, (b) hold on to, or (c) sell
ABSC stocks.

171
Sub-hypothesis 7.2
There is a significant difference in the importance attributed to “employee
retention” information among the decisions to (a) purchase, (b) hold on to, or (c) sell
ABSC stocks.
Sub-hypothesis 7.3
There is a significant difference in the importance attributed to “employee values”
information among the decisions to (a) purchase, (b) hold on to, or (c) sell ABSC stocks.
Sub-hypothesis 7.4
There is a significant difference in the importance attributed to “management and
leadership qualities” information among the decisions to (a) purchase, (b) hold on to, or
(c) sell ABSC stocks.
Sub-hypothesis 7.5
There is a significant difference in the importance attributed to “employee problem
solving skills” information among the decisions to (a) purchase, (b) hold on to, or (c) sell
ABSC stocks.
Hypothesis 8
There is a significant difference in the importance attributed to RC dimensions
among the decision to purchase, hold on to, or sell ABSC stocks.
Sub-hypothesis 8.1
There is a significant difference in the importance attributed to “customer capital”
information among the decisions to (a) purchase, (b) hold on to, or (c) sell ABSC stocks.

172
Sub-hypothesis 8.2
There is a significant difference in the importance attributed to “supplier chain
relations” information among the decisions to (a) purchase, (b) hold on to, or (c) sell
ABSC stocks.
Sub-hypothesis 8.3
There is a significant difference in the importance attributed to “competitors”
information among the decisions to (a) purchase, (b) hold on to, or (c) sell ABSC stocks.
Additionally, Research Question Five is developed based on the findings of the
ASX (2004, 2007). Quite specifically, the ASX Shareholder Study 2006 (2007) resulted
in a list of sources of advice Australian shareholders refer to in their share investment
decisions. Building on from the fact that there is little to no research conducted on the
perceptions and actions of “mum and dad” shareholders, relating to the HRC and RC
dimensions of ABSC, this question also seeks to use the nominal information extracted
from the questionnaire administered in the first part of the main study, to assess if the
variables of gender, age, and education impact on shareholder decisions as a moderator.
The aim is to understand the influence of the advice of others and of the demographic
variables on the relationship between perception and action. The result of testing
Hypothesis 9 and Hypothesis 10 is that it will build on the research conducted by the
ASX (2004, 2007) and add a new dimension to what is understood about individual
investors, within the context of the Australian banking sector.
Research Question Five
In the ABSC stock transaction decisions of individual shareholders, is the
individual shareholder’s perception of the importance of HRC and RC dimensions

173
moderated by information provided by differing sources of advice and demographic
variables?
Hypothesis 9
Differing sources of advice (including “media”, “family and friends” and
“professional investment advisors”) and gender, age or education of individual
shareholders have a significant moderating effect on the relationship between the
individual shareholder’s perceptions of the importance of HRC dimensions and the
individual shareholder’s use of HRC dimensions in ABSC stock transactions.
Sub-hypothesis 9.1
Differing sources of investment advice, as moderators, have a significant effect on
the relationship between the individual shareholder’s perceptions of the importance of
HRC dimensions and the individual shareholder’s use of HRC dimensions in ABSC stock
transactions.
Sub-hypothesis 9.2
Gender, age and education of individual shareholders, as moderators, have a
significant effect on the relationship between the individual shareholder’s perceptions of
the importance of HRC dimensions and the individual shareholder’s use of HRC
dimensions in ABSC stock transactions.
Hypothesis 10
Differing sources of advice (including “media”, “family and friends” and
“professional investment advisors”) and gender, age or education of individual
shareholders have a significant moderating effect on the relationship between the

174
individual shareholder’s perceptions of the importance of RC dimensions and the
individual shareholder’s use of RC dimensions in ABSC stock transactions.
Sub-hypothesis 10.1
Differing sources of investment advice, as moderators, have a significant effect on
the relationship between the individual shareholder’s perceptions of the importance of
HRC dimensions and the individual shareholder’s use of RC dimensions in ABSC stock
transactions.
Sub-hypothesis 10.2
Gender, age and education of individual shareholders, as moderators, have a
significant effect on the relationship between the individual shareholder’s perceptions of
the importance of HRC dimensions and the individual shareholder’s use of RC
dimensions in ABSC stock transactions.
4.2.2 Research sample.
The questionnaire is the diagnostic tool from which the necessary data is extracted,
this to be able to achieve the aims of the first part of the main study. The questionnaire
was distributed and on forwarded to a total of 200 individuals, each of whom, at the time
of distribution, was a current or previous shareholder in at least one of the eight ABSC
investigated. This was achieved by having the researcher, the researcher’s network of
friends and family, and the researcher’s professional colleagues voluntarily take part in
contacting suitable participants, ABSC shareholders. A response rate of 58.5 percent was
attained (N = 117) for this part of the research study. Again, this study was dependent on
snowball sampling (Rubio et al., 2001) to augment the sample size.

175
4.2.2.1 Demographic profile of the research sample.
The demographic variables considered for the first part of the main study are three
categorical variables. The variables of gender, age, and education are used for descriptive
analysis. Table 4.1 sets out the distribution of the demographic data categorized in a
dichotomous manner among gender. The sample of shareholders of Australian banking
sector stock is comprised of 67.5 percent males (79 men) and 32.5 percent females (38
women).
Table 4.1
Distribution of demographic data categorized in a dichotomous manner among gender
Table 4.2 sets out the distribution of the demographic data categorized among age.
Five different age ranges are used to extract the information about the ages of the
individuals in the sample of shareholders of ABSC stocks. The majority of the
shareholders (43 people) belong to the age range of 26 to 45 years old. They represent
36.80 percent of the respondents.
Gender Frequency Percent
Male 79 67.50
Female 38 32.50
N = 117

176
Table 4.2
Distribution of the demographic data categorized among age
Respondents were asked to provide information on their level of education.
Table 4.3 sets out the distribution of the demographic data categorized among
educational qualification.
Table 4.3
Demographic data categorized among educational qualification
Table 4.3 sets out the range of response options relating to the educational
qualifications of respondents. The range includes Primary, Secondary, TAFE, and
University level education. The majority of shareholders, 53 percent, indicated they
have a University level education.
Age Frequency Percent
25 or Under 16 13.70
26-35 43 36.80
36-45 29 24.80
46-55 21 17.90
56-65 8 6.80
66 or Over 0 0.00
N = 117
Education Frequency Percent
Primary 6 5.10
Secondary 26 22.20
TAFE 23 19.70
University 62 53.00
N = 117
177
4.2.3 Tools.
The first part of the main study focuses specifically on shareholder perceptions
about information concerning the IC dimensions of HRC and RC, and on where the
shareholders source information on HRC and RC dimensions relevant to their share
investment decisions. This research is presented from a purely HR perspective. In
achieving the research aims of the first part of the main study, it was necessary to
distribute a perception measurement tool, the questionnaire, to current and/or previous
shareholders of ABSC. The questionnaire is an output of the pilot study, through which
the research successfully established the validity and reliability of the constructs. The
questionnaire was found to correctly and consistently measure each of the HRC and RC
dimensions. The dimensions of HRC include employee recruitment, employee retention,
employee values, development of management and leadership qualities, and developing
problem solving skills. The dimensions of RC include customer capital, supplier chain
relations, and competitors. The data extracted from the questionnaire provides insight
into the first five research questions by testing the proposed hypotheses.
To test the hypotheses, the research study utilises data extracted from the formal
structured questionnaire that resulted from the assessment of the Final Questionnaire in
the initial pilot study. The questionnaire for the main study (refer Appendix H) consists
of three parts. The first part, the preliminary section, includes definitions of the
constructs of HRC and RC, for the respondents to refer to. The first part is also devised
to extract demographic information and information on the banking sector shareholdings
of respondents. Respondents are asked to indicate their gender, age, level of education,
and Australian banking sector shares held either currently or previously. For ease of

178
reference, Figure 4.2 is an extract that represents the first, preliminary part of the
Questionnaire.
PLEASE TICK ( ) THE RELEVANT RESPONSES FOR THE FOLLOWING QUESTIONS:
Gender Male __ Female __
Age 25 or under __ 26-35 __ 36-45 __ 46-55 __ 56-65 __ 66 or over __
Level of education Primary __ Secondary __ TAFE __ University __
Do you have, or have you had, Australian banking sector shares? Yes __ No __
If you responded “yes” to having banking sector shares, in what banks do you have shares?
ADB (Adelaide Bank Ltd) _ _ ANZ (Australia & New Zealand Banking Group Ltd) _ _
BEN (Bendigo Bank Ltd) _ _ BOQ (Bank of Queensland Ltd) _ _
CBA (Commonwealth Bank of Australia) _ _ NAB (National Australia Bank) _ _
SGB (St. George Bank Ltd) _ _ WBC (Westpac Banking Corporation) _ _
Other banks (please specify which)
________________________________________________________________
If you responded “no” to having banking sector shares, you are no longer required to proceed with
the questionnaire. Thank you for your time and effort.
The definitions below are provided for your convenience, to help clarify what this questionnaire is
trying to explore.
Human resource capital (HRC) is the collective physical and intellectual skills and abilities of employees
that they bring with them to an organization in order to contribute to its overall performance and success.
Factors of HRC include learned abilities, management & leadership qualities, employee values and
problem solving capabilities.
Relational capital (RC) is the economic value of the working relationships between stakeholders,
including shareholders, management, staff, suppliers, customers, competitors, etc., needed for an
organization to be productive. Generally, and for the purpose of this study, both short and long term
aspects of customer capital, supplier chain relations and competitors make up the RC of a firm.
Figure 4.2. First part of the questionnaire

179
The second part of the questionnaire consists of questions one to five. Question
one is devised to extract information on whether respondents perceive HRC and RC
information to be important to making decisions regarding buying, holding on to, or
selling Australian banking sector shares. Respondents are asked to indicate if they used
HRC and/or RC information to decide on which Australian banking sector shares to buy,
hold on to, or sell. They are then asked, in question two, to indicate the importance of the
sources of investment advice. This question is based on the list of information sources
referred to in the ASX Shareholder Survey 2006 (ASX, 2007). The second part also
includes questions three to five. The questions ask the respondents to indicate the
importance of HRC and RC information in decisions to buy, hold on to, and sell
Australian banking sector shares. For ease of reference, Figure 4.3 is an extract that
represents the second part of the questionnaire.
1. Indicate with a tick ( ) if you have used Human Resource Capital (HRC) and/or Relational
Capital (RC) policy information to decide on which Australian banking sector shares to buy, hold on
to, or sell? (please refer to the definitions provided above)
HRC YES NO RC YES NO
To buy shares To buy shares
To hold on to Shares
To hold on to shares
To sell shares
To sell shares
2. Indicate the importance of the sources of advice below as either 1 – not important; 2 – important;
or 3 - most important, in providing HRC and/or RC information. Place a tick ( ) in the box
representing the appropriate response.
HRC RC
Newspapers 1 2 3 Newspapers 1 2 3
Family & Friends 1 2 3 Family & Friends 1 2 3
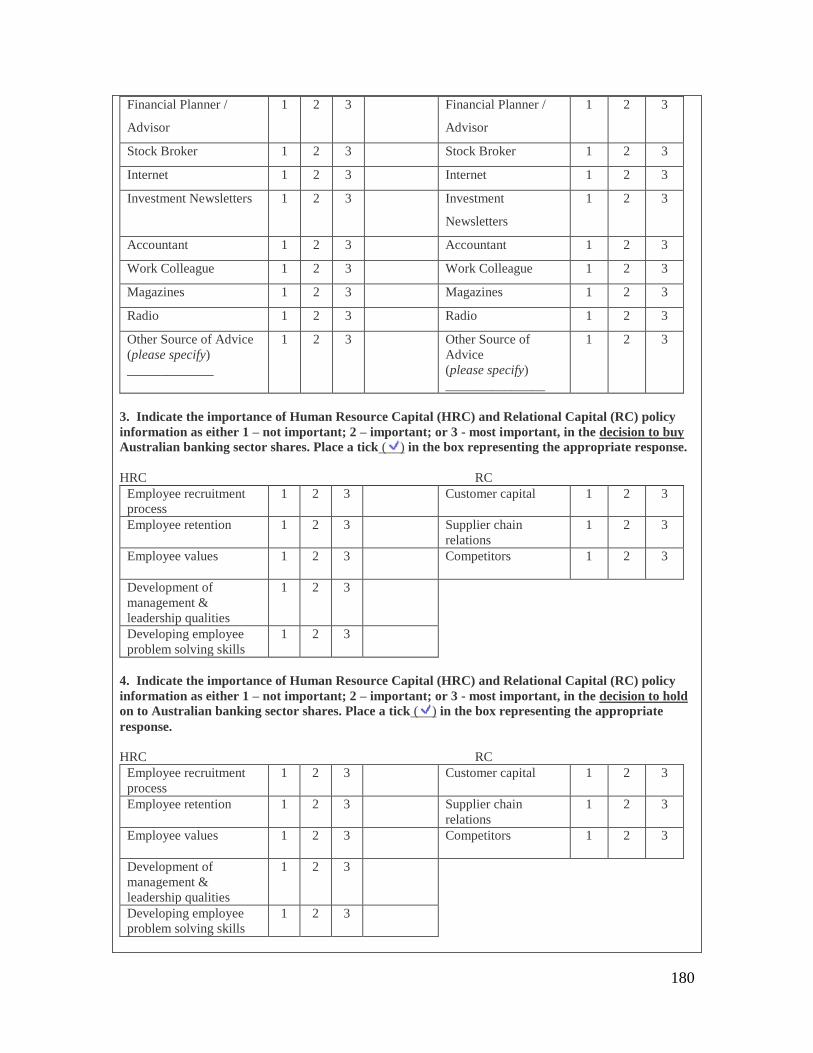
180
Financial Planner /
Advisor
1 2 3 Financial Planner /
Advisor
1 2 3
Stock Broker 1 2 3 Stock Broker 1 2 3
Internet 1 2 3 Internet 1 2 3
Investment Newsletters 1 2 3 Investment
Newsletters
1 2 3
Accountant 1 2 3 Accountant 1 2 3
Work Colleague 1 2 3 Work Colleague 1 2 3
Magazines 1 2 3 Magazines 1 2 3
Radio 1 2 3 Radio 1 2 3
Other Source of Advice
(please specify)
_____________
1 2 3 Other Source of
Advice
(please specify)
_______________
1 2 3
3. Indicate the importance of Human Resource Capital (HRC) and Relational Capital (RC) policy
information as either 1 – not important; 2 – important; or 3 - most important, in the decision to buy
Australian banking sector shares. Place a tick ( ) in the box representing the appropriate response.
HRC RC
Employee recruitment
process
1 2 3
Customer capital 1 2 3
Employee retention 1 2 3
Supplier chain
relations
1 2 3
Employee values 1 2 3
Competitors 1 2 3
Development of
management &
leadership qualities
1 2 3
Developing employee
problem solving skills
1 2 3
4. Indicate the importance of Human Resource Capital (HRC) and Relational Capital (RC) policy
information as either 1 – not important; 2 – important; or 3 - most important, in the decision to hold
on to Australian banking sector shares. Place a tick ( ) in the box representing the appropriate
response.
HRC RC
Employee recruitment
process
1 2 3
Customer capital 1 2 3
Employee retention 1 2 3
Supplier chain
relations
1 2 3
Employee values 1 2 3
Competitors 1 2 3
Development of
management &
leadership qualities
1 2 3
Developing employee
problem solving skills
1 2 3

181
5. Indicate the importance of Human Resource Capital (HRC) and Relational Capital (RC) policy
information as either 1 – not important; 2 – important; or 3 - most important, in the decision to sell
Australian banking sector shares. Place a tick ( ) in the box representing the appropriate response.
HRC RC
Employee recruitment
process
1 2 3
Customer capital 1 2 3
Employee retention 1 2 3
Supplier chain
relations
1 2 3
Employee values 1 2 3
Competitors 1 2 3
Development of
management &
leadership qualities
1 2 3
Developing employee
problem solving skills
1 2 3
Figure 4.3. The second part of the questionnaire
The third part of the questionnaire is devised to extract information on whether the
respondents perceive a range of HRC and RC policy statements as relevant to the
decision to purchase ABSC shares. Question six provides respondents with a range of
statements relating to the HRC and RC of a company and asks the respondents to indicate
how important they perceive the items, HRC and RC policy statements, to be to their
decision to purchase banking sector shares. Respondents are asked to read each statement
and to indicate the perceived importance of each in accordance with the five-point Likert
scale provided. For ease of reference, Figure 4.4 is an extract that represents the third and
final part of the questionnaire.
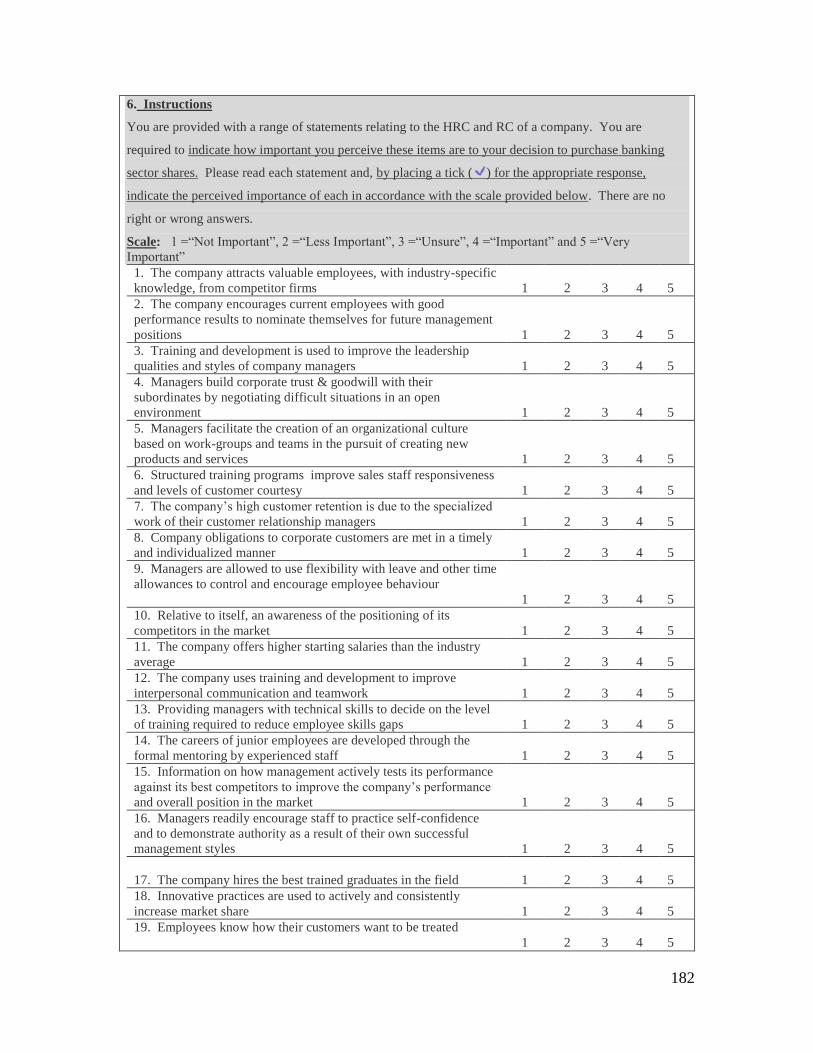
182
6. Instructions
You are provided with a range of statements relating to the HRC and RC of a company. You are
required to indicate how important you perceive these items are to your decision to purchase banking
sector shares. Please read each statement and, by placing a tick ( ) for the appropriate response,
indicate the perceived importance of each in accordance with the scale provided below. There are no
right or wrong answers.
Scale: 1 =“Not Important”, 2 =“Less Important”, 3 =“Unsure”, 4 =“Important” and 5 =“Very
Important”
1. The company attracts valuable employees, with industry-specific
knowledge, from competitor firms
1
2
3
4
5
2. The company encourages current employees with good
performance results to nominate themselves for future management
positions
1
2
3
4
5
3. Training and development is used to improve the leadership
qualities and styles of company managers
1
2
3
4
5
4. Managers build corporate trust & goodwill with their
subordinates by negotiating difficult situations in an open
environment
1
2
3
4
5
5. Managers facilitate the creation of an organizational culture
based on work-groups and teams in the pursuit of creating new
products and services
1
2
3
4
5
6. Structured training programs improve sales staff responsiveness
and levels of customer courtesy
1
2
3
4
5
7. The company’s high customer retention is due to the specialized
work of their customer relationship managers
1
2
3
4
5
8. Company obligations to corporate customers are met in a timely
and individualized manner
1
2
3
4
5
9. Managers are allowed to use flexibility with leave and other time
allowances to control and encourage employee behaviour
1
2
3
4
5
10. Relative to itself, an awareness of the positioning of its
competitors in the market
1
2
3
4
5
11. The company offers higher starting salaries than the industry
average
1
2
3
4
5
12. The company uses training and development to improve
interpersonal communication and teamwork
1
2
3
4
5
13. Providing managers with technical skills to decide on the level
of training required to reduce employee skills gaps
1
2
3
4
5
14. The careers of junior employees are developed through the
formal mentoring by experienced staff
1
2
3
4
5
15. Information on how management actively tests its performance
against its best competitors to improve the company’s performance
and overall position in the market
1
2
3
4
5
16. Managers readily encourage staff to practice self-confidence
and to demonstrate authority as a result of their own successful
management styles
1
2
3
4
5
17. The company hires the best trained graduates in the field
1
2
3
4
5
18. Innovative practices are used to actively and consistently
increase market share
1
2
3
4
5
19. Employees know how their customers want to be treated
1
2
3
4
5

183
20. Knowledge about the potential for a company to add value
through product and/or business diversification
1
2
3
4
5
21. The company uses targeted marketing campaigns to potential
recruits to show it values the individual achievements of its current
star performers
1
2
3
4
5
22. Managers are encouraged to facilitate employees who are
proven and successful risk-takers
1
2
3
4
5
23. The company’s reputation with its current customers has
facilitated the potential to grow its customer base
1
2
3
4
5
24. The company uses in-house employee recruitment officers,
with complete knowledge of the firm’s business, to match
appropriate recruits to available roles
1
2
3
4
5
25. Managers are empowered to select, as mentors and role models,
employees who are creative and can make their own decisions
without the help of others
1
2
3
4
5
26. The company motivates less competitive employees by linking
output to a highly competitive reward system
1
2
3
4
5
27. Information on how the company uses market intelligence
increase its market share
1
2
3
4
5
28. Managers are empowered to motivate subordinates by offering
employee salaries above the industry average
1
2
3
4
5
29. Specialist external firms provide training to employees with
specialized product knowledge/skills
1
2
3
4
5
30. Whether the company has negotiated long term contracts with
customers
1
2
3
4
5
31. Providing managers with share options and other bonuses
directly linked to the output levels of their departments and of their
direct subordinates
1
2
3
4
5
32. Organizational synergy, which improves company output, is a
result of a decentralized decision-making process
1
2
3
4
5
33. When surveyed for feedback, the degree of customer
satisfaction reported on the service the company provides in
response to their contemporary needs
1
2
3
4
5
34. Weekend workshops are used to improve employee
productivity by encouraging them to broaden their perspective in
relation to their work roles
1
2
3
4
5
35. A formal performance appraisal program provides employees
with constructive feedback and remedial intervention
1
2
3
4
5
36. Whether the company has negotiated long term contracts with
suppliers
1
2
3
4
5
37. Managers select, as supervisors, employees that demonstrate
the ability to use their imagination to develop original ideas for their
market
1
2
3
4
5
38. Whether corporate stakeholders are aware of where the
company wants to be in 3 to 5 years – strategic objective
1
2
3
4
5
39. Information on how the company seeks to predict market trends
1
2
3
4
5
40. The company uses weekly statistical analysis of staff
productivity to encourage employees to reset goals & targets
1
2
3
4
5
Scale: 1 = “Not Important”, 2 = “Less Important”, 3 = “Unsure”, 4 = “Important” and 5 = “Very
Important”
Figure 4.4. The third part of the questionnaire

184
As with the Final Questionnaire used in the pilot study, the questionnaire for the
main study includes the 40 policy statements relating to each of the five dimensions of
HRC and the three dimensions of RC. For ease of reference, Table 4.4 provides the
breakdown of policy statement items and their associated dimensions of HRC and RC.
Table 4.4
Items in questionnaire relating to dimensions of HRC and RC
Dimension Policy Statement Items
Employee Recruitment
1 11 17 21 24
Employee Retention
2 12 14 29 35
Development of Management and
Leadership Qualities
3 9 13 28 31
Employee Values
4 26 32 34 40
Developing Employee Problem
Solving Skills
5 16 22 25 37
Customer Capital
6 8 18 23 30
Supplier Chain Relations
7 19 33 36 38
Competitors
10 15 20 27 39
There are five policy statements for each of the five dimensions of HRC and the
three dimensions of RC. The 40 policy statements were presented to the respondents and
the data extracted from the questionnaire as a whole is analysed using SPSS™ Version
15.

185
4.2.4 Procedure.
Snowball sampling was used to engage participants and to invite them to respond to
the study. Invited participants were assured anonymity as their identities and their
responses remain anonymous. Participants invited to reply to the questionnaire include
only previous and current shareholders of ABSC. Paper copies of the questionnaire were
provided to family, friends and colleagues of the researcher to complete and/or further
distribute to suitably eligible individuals, those who are either previous or current holders
of ABSC shares. The participants were provided with sealed A3 envelopes containing
the questionnaire, Expression of Interest Letter, two printed copies of the Participant
Consent Form, and postage-paid, researcher-addressed reply envelopes.
In responding to the questionnaire, participants were requested to read and to fill
out each of the three parts of the questionnaire by indicating the appropriate responses.
The participants were allowed one month to complete and return the questionnaires.
However, if the questionnaires arrived after the one month period, and before statistical
analysis started, they were included in the study. Participants were asked to return the
completed questionnaire together with a signed copy of the Participant Consent Form.
Upon receipt of the completed questionnaires and the Participant Consent Form by
the researcher, the questionnaires and consent forms were separated without delay, before
data extraction and analysis was conducted. Consent forms were collected and placed
into a sealed file. The questionnaires were also placed into a separate sealed file for bulk
processing by the researcher. This process is carried out to ensure the anonymity of
respondents.

186
4.2.5 Data analysis.
Multiple statistical tests were performed on the data collected in this research.
Refer to Table 4.5 for a summary of the tests performed. This section provides a detailed
discussion about these tests and their application.
Table 4.5
Statistical Analysis of Hypothesis 1 to Hypothesis 10
Hypothesis Independent Variable Dependent Variable Moderator Statistical
Analysis
H 1 Share ownership in one
of Australia’s big four
banks
Perceived importance
of HRC dimensions
One-Way
ANOVA and
post hoc testing
(Bonferroni test)
H 2 Share ownership in one
of Australia’s big four
banks
Perceived importance
of RC dimensions
One-Way
ANOVA and
post hoc testing
(Bonferroni test)
H 3 Share ownership in one
of Australia’s big four
banks
Or
Share ownership in
multiple banks including
one of Australia’s big
four banks
Perceived importance
of HRC dimensions in
decision to purchase
ABSC stocks
T-test
H 4 Share ownership in one
of Australia’s big four
banks
Or
Share ownership in
multiple banks including
one of Australia’s big
four banks
Perceived importance
of RC dimensions in
decision to purchase
ABSC stocks
T-test
H 5 Perceived importance of
HRC dimension
Use of HRC
dimension in decision
to purchase ABSC
stocks
Logistic
Regression
H 6 Perceived importance of
RC dimension
Use of RC dimension
in decision to purchase
ABSC stocks
Logistic
Regression
H 7 Perceived importance of
HRC dimension to each
decision
Decision to
“purchase”, “hold on
to” Or “sell” ABSC
stocks
Discriminatory
Analysis
Friedman’s Test
H 8 Perceived importance of
RC dimension to each
decision
Decision to
“purchase”, “hold on
to” Or “sell” ABSC
stocks
Discriminatory
Analysis
Friedman’s Test

187
Hypothesis Independent Variable Dependent Variable Moderator Statistical
Analysis
H 9 Perceived importance of
HRC dimensions
Use of HRC
dimensions in the
decision to purchase
ABSC stocks
Sources of
Advice
And Gender, Age,
and
Education of
shareholder
Hierarchical
Logistic
Regression
H 10 Perceived importance of
RC dimensions
Use of RC dimensions
in the decision to
purchase ABSC stocks
Sources of
Advice
And
Gender, Age,
and
Education of
shareholder
Hierarchical
Logistic
Regression
4.2.5.1 Shareholders of ABSC and their perceptions about HRC and RC
dimensions.
The first two hypotheses are concerned with testing for significant differences on
the importance of HRC and RC dimensions between share ownership in Australia’s big
four banks, the CBA, WBC, NAB, and ANZ. In testing Hypotheses 1 and Hypothesis 2,
the independent variables consist of the specific Australian banking sector stocks held.
These are determined from the analysis of responses to the related question in the first
part, and on the first page, of the questionnaire (refer Figure 4.2). That question asks
respondents if they, either currently or in the past, held shares in ABSC. Respondents are
asked to identify, with a “tick”, the ABSC they have had shares in.
The dependent variables are perceived importance of HRC and RC dimensions.
Figures 4.5 and 4.6 demonstrate the relationship between the independent and dependent
variables. Data on the dependent variables is extracted from question six of the
questionnaire (refer to Figure 4.4).

188
Figure 4.5. Variables for Hypothesis 1
Figure 4.6. Variables for Hypothesis 2
One-way ANOVA
One-way ANOVA (Analysis of Variance) is used to test the statistical significance
of the hypotheses. One-way ANOVA tests differences in a single interval dependent
variable among two, three, or more groups formed by the categories of a single
categorical independent variable. Also known as Univariate ANOVA, Simple ANOVA,
Single Classification ANOVA, or One-factor ANOVA, this design deals with one
independent variable and one dependent variable. It tests whether the groups formed by
the categories of the independent variable seem similar (specifically that they have the
same pattern of dispersion as measured by comparing estimates of group variances). If
the groups seem different, then it is concluded that the independent variable has an effect
on the dependent.
Independent Variable
Share ownership in one of Australia's big four banks
Dependent Variable
Perceived importance of HRC dimensions
Independent Variable
Share ownership in one of Australia's big four banks
Dependent Variable
Perceived importance of RC dimensions

189
After ANOVA is carried out, a more stringent post hoc test (Bonferroni test) is
conducted on the data. Since there are four groups of ABSC shareholders being
compared in these hypotheses, the research requires this pair-wise comparison to
determine in which pair of ABSC shareholders there is a statistically significant
difference (Burns & Burns, 2008). Sometimes, even though the overall F-test is found to
be statistically significant at a 0.05 confidence level, none of the pairs are found to be
significant due to the stringent level of significance applied in the Bonferroni T-test
(Burns & Burns, 2008).
4.2.5.2 Differences between perceptions of shareholders of either single or
multiple ABSC.
The second two hypotheses (Hypothesis 3 and Hypothesis 4) are concerned with
testing whether there is a significant difference in the perceptions of importance of HRC
and RC dimensions to the decision to purchase ABSC stocks, between shareholders of
single and multiple ABSC stocks. As the independent variable, the two samples selected
to test these hypotheses include shareholders of ABSC stocks in only a single bank of the
big four banks and shareholders of ABSC shares in multiple banks including, at least, one
of the big four banks. This is determined from the analysis of responses to the related
question in the first part of the questionnaire (refer to Figure 4.2). That question asks
respondents if they, either currently or in the past, held shares in ABSC. Respondents are
asked to identify the ABSC they have had shares in.
The dependent variables are the HRC and RC dimensions measured by items in
question six of the questionnaire, and extracted for analysis (refer to Figure 4.4). Figures
4.7 and 4.8 define the relationship between the variables.

190
Figure 4.7. Variables for Hypothesis 3
Figure 4.8. Variables for Hypothesis 4
T-test
Hypothesis 3 and Hypothesis 4 for Research Question Two are tested and analysed
using a t-test. The t-test is appropriate when you have a single interval dependent and a
dichotomous independent, and wish to test the difference of means (for example, test
mean differences between samples of men and women). The t-test may be used to
compare the means of a criterion variable for two independent samples or for two
dependent samples or between a sample mean and a known mean (One Sample T-test).
Independent Two Sample T-test is used to test the statistical significance of the
hypotheses, to test mean differences between the samples of single and of multiple ABSC

191
shareholders and their perceptions of importance given to HRC and RC dimensions in the
decision to purchase ABSC.
4.2.5.3 Shareholder perceptions and the use of HRC and RC dimensions to
purchase ABSC stocks.
The third pair of hypotheses (Hypothesis 5 and Hypothesis 6) tests the relationship
between the independent variables of shareholder perception of the importance of HRC
and RC dimensions to the banking share purchase decision and the use of HRC and RC
dimensions in the purchase of ABSC stocks. Data on the independent variable is taken
from question six of the questionnaire (refer to Figure 4.4). The question presents
respondents with 40 policy statements for the dimensions of HRC and RC.
Data on the dependent variables is extracted from question one in the second part of
the questionnaire (refer to Figure 4.3). Figures 4.9 and 4.10 define the variables used
when testing the hypotheses to identify the relationship between shareholder perception
of the importance of HRC and RC dimensions to the banking share purchase decision and
the use of HRC and RC dimensions in the purchase of ABSC stocks.
Figure 4.9. Variables for Hypothesis 5

192
Figure 4.10. Variables for Hypothesis 6
Logistic Regression
Logistic regression modelling is used to test the relationship between individual
shareholders’ perceptions about the importance of each of the HRC and RC dimensions
to the banking share purchase decision. Binomial (or binary) logistic regression is a type
of regression used when the dependent is a dichotomy and the independents are of any
type (Agresti & Franklin, 2009). Logistic regression can be used to predict a dependent
variable based on continuous and/or categorical independents and to determine the
percent variance in the dependent variable explained by the independents; to rank the
relative importance of independents; to assess interaction effects; and to understand the
impact of covariate control variables. The impact of predictor variables is usually
explained in terms of odds ratios. Logistic regression applies maximum likelihood
estimation after transforming the dependent into a logit variable (the natural log of the
odds of the dependent occurring or not). In this way, logistic regression estimates the
odds of a certain event occurring.
The Wald Test is used to test the significance of individual logistic regression
coefficients (B) for each independent variable. Odds Ratio: Exp (B) is the natural log
base, e, to the exponent, B, where B = Logistic Regression Coefficient. Odds Ratio

193
represents the factor by which the odds change for a one-unit change in the independent
variable. An Exp (B) > 1 means the independent variable increases the odds. If Exp (B)
= 1.0, the independent variable has no effect. If an Exp (B) < 1, then the independent
variable decreases the odds.
As Hypothesis 5 and Hypothesis 6 test if there is a significant positive relationship
between an individual shareholder’s perception of the importance of the five HRC
dimensions and three RC dimensions, and the use of those HRC and RC dimensions in
the decision to purchase ABSC stocks, logistic regression is used to model the
relationship. In this, Wald Test is used to test the relationship of each of the HRC and RC
dimensions on the decision to purchase ABSC stocks.
4.2.5.4 Investment transaction decisions of shareholders and the influence of
HRC and RC dimensions.
The fourth pair of hypotheses (Hypothesis 7 and Hypothesis 8) test whether there is
a significant difference in the importance attributed to HRC and RC dimensions among
the decisions to purchase, hold on to or sell ABSC stocks. The independent variable is
the importance attributed to each of the five HRC and to each of the three RC dimensions.
The dependent variable is the decision on banking stock transactions, which includes the
purchase, holding on to, and selling of ABSC stocks. Figure 4.11 and Figure 4.12 set out
the relationship between the variables. Discriminatory analysis testing is conducted on
the information extracted from questions related to the investor transaction decisions in
the questionnaire to examine empirically whether there is a significant difference in the
importance attributed to HRC and RC dimensions among the decisions to purchase, hold
on to or sell ABSC stocks (refer to Figure 4.3).

194
Figure 4.11. Variables for Hypothesis 7
Figure 4.12. Variables for Hypothesis 8
Discriminatory Analysis - Friedman’s Test
For Research Question Four, the Friedman’s Test, a non-parametric randomized
analysis of variance, is used for the data analysis relating to both Hypotheses 7 and 8.
The Friedman’s Test is used in situations where the data are nominal or ordinal in
orientation. This test is used to compare observations repeated on the same subjects. This
is also called a non-parametric randomized block analysis of variance. This test is an
alternative to the ANOVA, when the assumption of normality or equality of variance is
not met. This, like many non-parametric tests, uses the ranks of the data rather than their
raw values to calculate the statistic. If the p-Value is < 0.05 for any of the sub-
hypotheses for Hypothesis 7, then the sub-hypothesis is accepted and it can be concluded
Independent Variable
Shareholder's perceived importance of HRC
information
(for each of the 5 individual dimensions of HRC)
to each of the decisions
Dependent Variable
The decision to "purchase"
OR
The decision to "hold" on to
OR
The decision to "sell"
ABSC stocks
Independent Variable
Shareholder's perceived importance of RC information
(for each of the 3 individual dimensions of RC)
to each of the decisions
Dependent Variable
The decision to "purchase"
OR
The decision to "hold" on to
OR
The decision to "sell"
ABSC stocks

195
that there exists a significant difference in mean importance attributed to the relevant
dimensions of HRC among the decisions to purchase, hold on to, or sell ABSC stocks.
4.2.5.5 Moderating the relationship between investment transaction decisions of
ABSC shareholders and the influence of HRC and RC dimensions.
There are a variety of data sources to which individuals may refer when considering
the purchase of stocks from ABSC shares; some of these are available for purchase via
the ASX and stock brokerage companies. These include highly specialized stock reports
and investment analyst reports. Additionally, current and potential investors may
investigate their prospective purchases by using information provided through
newspapers, friends and family, financial planners and advisors, stock brokers, the
internet, investment newsletters, accountants, work colleagues, magazines, radio, and
other sources (ASX, 2007). Furthermore, any combination of these sources may be used,
or not used, when contemplating the acquisition of ABSC shares.
The fifth pair of hypotheses (Hypothesis 9 and Hypothesis 10) tests whether
differing sources of advice (including “media”, “family and friends” and “professional
investment advisors”) and gender, age or education of individual shareholders have a
significant moderating effect on the relationship between the individual shareholder’s
perceptions of the importance of HRC and RC dimensions and the individual
shareholder’s use of information on HRC and RC dimensions in ABSC stock transactions.
For these hypotheses, the independent variable is information relating to the importance
placed on information about the five HRC and three RC dimensions, to banking stock
transaction decisions. This information is extracted from question six of the
questionnaire (refer to Figure 4.4). The question presents respondents with 40 policy

196
statements for the dimensions of HRC and RC. They are asked how important each of
the statements, or items, is to their ABSC share transaction decisions.
The dependent variable for Hypothesis 9 and Hypothesis 10 is the use of
information about the dimensions of HRC and RC in ABSC stock transactions, as
extracted from question one of the questionnaire (refer to Figure 4.3). Also for testing
Hypothesis 9 and Hypothesis 10, the moderating variables, are sources of share
investment advice (ASX, 2007) and gender, age and education of individual shareholders.
The data relating to the moderating variables is extracted from the first part (refer to
Figure 4.2) and from question two, of the second part of the questionnaire (refer to Figure
4.4). Also, question two of the questionnaire provides a list of 11 alternatives as sources
of share investment advice as proposed by the ASX Shareholder Survey 2006 (ASX,
2007). The question asks respondents to indicate the importance of sources of advice on
a scale from one to three. Figure 4.13 and Figure 4.14 help to define the relationship
between the independent, dependent, and moderating variables for the effect of
moderating variables upon the relationship between the use of HRC and RC dimensions
in investment transactions and the importance of the dimensions.

197
Figure 4.13. Variables for Hypothesis 9
Figure 4.14. Variables for Hypothesis 10
Moderating Variables
Differing sources of share investment advice as identified in the ASX Shareholder Study 2006
(ASX, 2007)
OR
Gender, age, or education of shareholder
Independent Variable
Individual shareholder's perceptions of importance of HRC information (for each of the 5 individual dimensions
of HRC)
Dependent Variable
Individual shareholder's use of information on HRC
dimensions in ABSC stock transactions
Moderating Variables
Differing sources of share investment advice as identified in the ASX Shareholder Study 2006
(ASX, 2007)
OR
Gender, age, or education of shareholder
Independent Variable
Individual shareholder's perceptions of importance of RC information (for each of the 3 individual dimensions
of RC)
Dependent Variable
Individual shareholder's use of information on RC dimensions
in ABSC stock transactions

198
Hierarchical Logistic Regression and Model Fit Change
As stated previously, logistic regression is used to predict probability of occurrence.
Hierarchical Logistic Regression involves testing multiple independent variables. In
testing Hypothesis 9 and Hypothesis 10, Hierarchical Logistic Regression is used. In
this, at Stage One, the initial model is tested with the dependent and independent
variables and in Stage Two moderator variables are added to test if the addition of
moderator variables significantly impacts the dependent variable by testing the
significance of the Model Fit Change. If p-Value < 0.05 for Model Fit Change in Stage
Two, the Hypothesis can be accepted and it can be concluded that the moderators do
significantly impact the use of HRC and/or RC information in the decision to transact on
ABSC stocks.
4.3 Main Study Part Two – Disclosure on HRC and RC Dimensions in Corporate
Annual Reports and its Relationship to Share Prices of ABSC
The annual reports of corporations provide valuable investment information. These
documents are created by the individual corporation responsible for their publication,
about their own organizations. They are required by the federal government to be
published and publically available (Australia, Treasury, 1999). They are to obtain and
incur no financial cost to interested parties to do so. Additionally, Alwert, Bornemann,
and Will (2009) found that business analysts reacted favourably to the addition of
subsidiary IC reports to traditional annual reports, enabling more homogenous results in
the credit ratings of companies and more homogenous results in the expert assessment of
the future growth of companies. They found that disclosure of information on IC
contributes to the improved transparency of organizations by allowing them to

199
demonstrate their unseen value and long term growth options (Alwert et al., 2009;
Edvinsson & Malone, 1997).
Alwert, Bornemann, and Will (2009) confirm that IC information is evaluated by
business practitioners including banks and financial institutions because they result in a
more homogeneous evaluation of the company, considering more than just current
financial performance. They suggested that by combining the annual report with the IC
report, a company fulfils its requirement for efficient communication with the capital
markets and, therefore, reduces risks of financial loss for investors, banks and small-to-
medium enterprises. However, Alwert, Bornemann, and Will did not go so far as to
suggest whether the IC report should be integrated into the annual report or whether it
should be in the explanatory section of the annual report.
Both internal and external stakeholders represent groups legitimately requiring IC
information about corporations. However, it is assumed that management, staff,
customers, suppliers and investors have different perceptions about the importance of IC
information disclosure. Concerning the investigation of the purchase decisions of
investors within the Australian banking sector, and in investigating the conclusions of
Alwert, Bornemann, and Will (2009) and Edvinsson and Malone (1997), the researcher
hosted Focus Group B (this Focus group is named as ‘B’ to avoid confusion with the
Focus group A used in the pilot study). Focus Group B was required to perform a
thematic content analysis of the corporate annual reports of the eight banking institutions
investigated in this research. This is needed to identify the HRC and RC information that
is provided to potential buyers, by the corporations themselves.
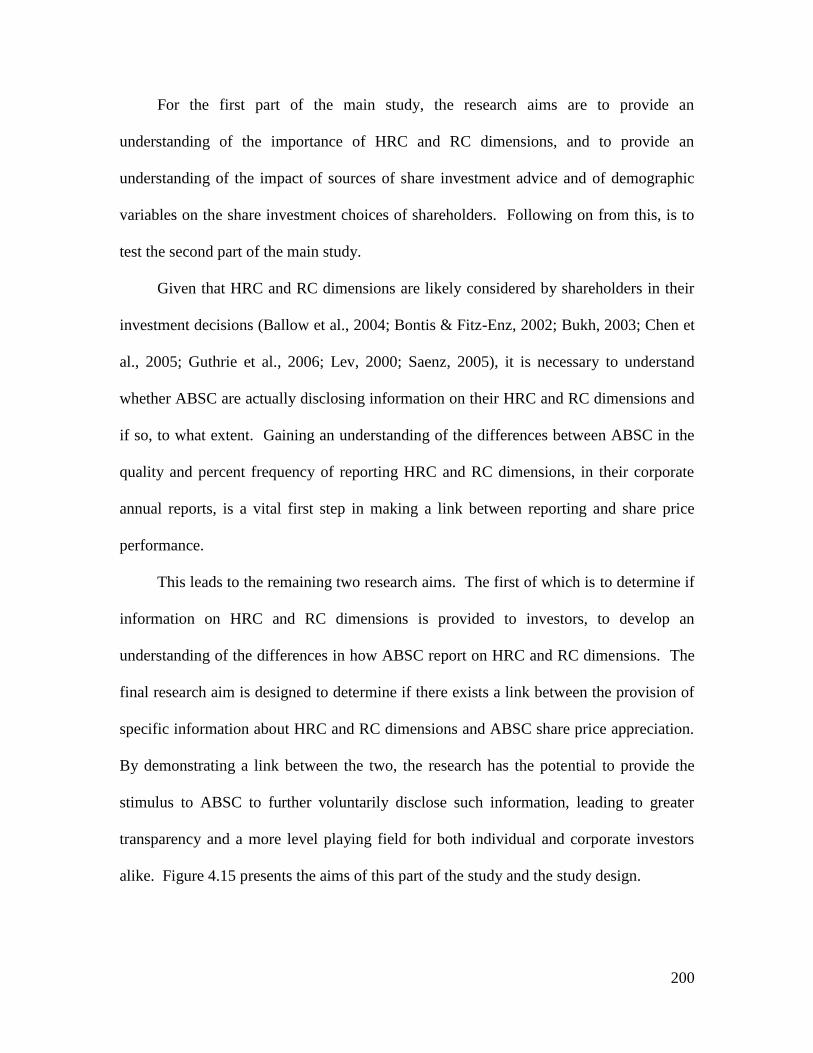
200
For the first part of the main study, the research aims are to provide an
understanding of the importance of HRC and RC dimensions, and to provide an
understanding of the impact of sources of share investment advice and of demographic
variables on the share investment choices of shareholders. Following on from this, is to
test the second part of the main study.
Given that HRC and RC dimensions are likely considered by shareholders in their
investment decisions (Ballow et al., 2004; Bontis & Fitz-Enz, 2002; Bukh, 2003; Chen et
al., 2005; Guthrie et al., 2006; Lev, 2000; Saenz, 2005), it is necessary to understand
whether ABSC are actually disclosing information on their HRC and RC dimensions and
if so, to what extent. Gaining an understanding of the differences between ABSC in the
quality and percent frequency of reporting HRC and RC dimensions, in their corporate
annual reports, is a vital first step in making a link between reporting and share price
performance.
This leads to the remaining two research aims. The first of which is to determine if
information on HRC and RC dimensions is provided to investors, to develop an
understanding of the differences in how ABSC report on HRC and RC dimensions. The
final research aim is designed to determine if there exists a link between the provision of
specific information about HRC and RC dimensions and ABSC share price appreciation.
By demonstrating a link between the two, the research has the potential to provide the
stimulus to ABSC to further voluntarily disclose such information, leading to greater
transparency and a more level playing field for both individual and corporate investors
alike. Figure 4.15 presents the aims of this part of the study and the study design.
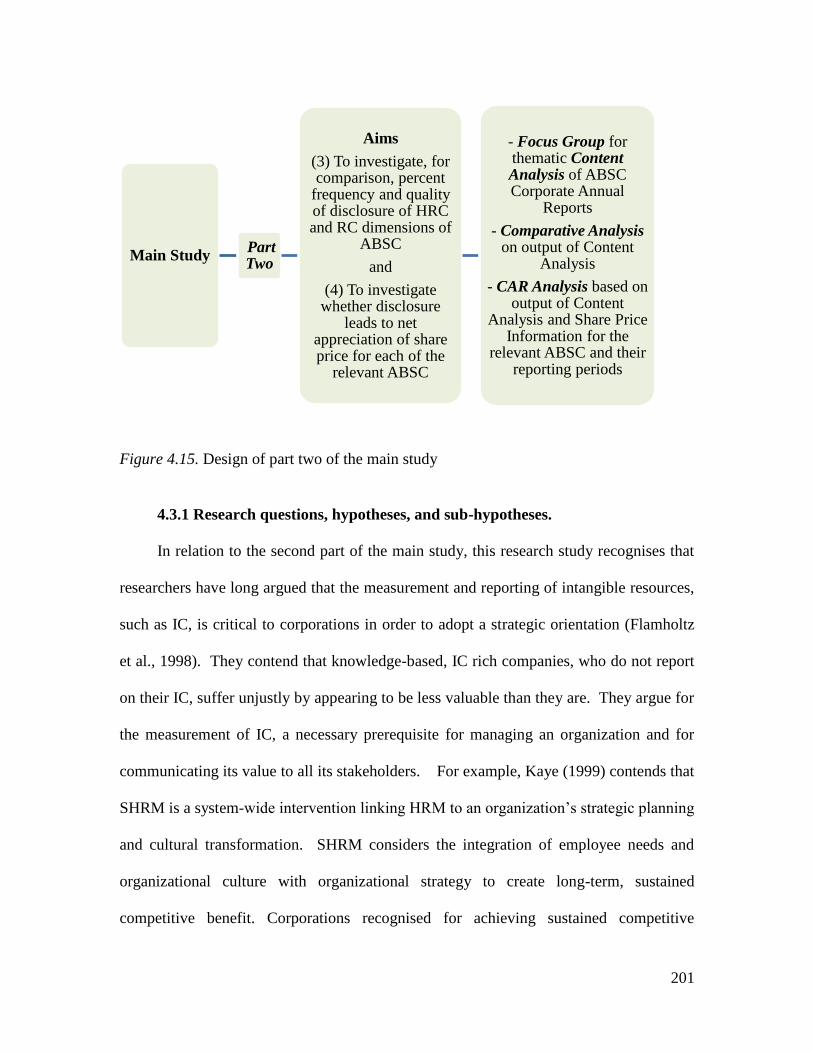
201
Figure 4.15. Design of part two of the main study
4.3.1 Research questions, hypotheses, and sub-hypotheses.
In relation to the second part of the main study, this research study recognises that
researchers have long argued that the measurement and reporting of intangible resources,
such as IC, is critical to corporations in order to adopt a strategic orientation (Flamholtz
et al., 1998). They contend that knowledge-based, IC rich companies, who do not report
on their IC, suffer unjustly by appearing to be less valuable than they are. They argue for
the measurement of IC, a necessary prerequisite for managing an organization and for
communicating its value to all its stakeholders. For example, Kaye (1999) contends that
SHRM is a system-wide intervention linking HRM to an organization’s strategic planning
and cultural transformation. SHRM considers the integration of employee needs and
organizational culture with organizational strategy to create long-term, sustained
competitive benefit. Corporations recognised for achieving sustained competitive
Main Study Part Two
Aims
(3) To investigate, for comparison, percent
frequency and quality of disclosure of HRC and RC dimensions of
ABSC
and
(4) To investigate whether disclosure
leads to net appreciation of share price for each of the
relevant ABSC
- Focus Group for thematic Content Analysis of ABSC Corporate Annual
Reports
- Comparative Analysis on output of Content
Analysis
- CAR Analysis based on output of Content
Analysis and Share Price Information for the
relevant ABSC and their reporting periods

202
advantage are those with leaders who have a strategic focus, who actively work to
support organizational strategy and to encourage a SHRM perspective.
This second part of the main study also considers that the IC of an organization is
regarded as having the potential to impact positively on the market value of a company
(Chen et al., 2005) and on its financial performance (Bontis, 1998, 2002; Bontis & Fitz-
enz, 2002). In his research findings, Bontis (1998, 2002) identified a causal link between
a company’s IC and its business performance. Chen, Cheng, and Hwang (2005) have
also successfully established a positive link between IC and market value. However,
regardless of the value IC represents to a corporation, public legislation in Australia, as in
most countries, does not require IC information disclosure in corporate annual reports.
Due to this fact, there exists a deficiency of disclosure on strategically important
organizational resources and corporate behaviour (Guthrie et al., 2005). Corporations fail
to meet the expectations and needs of the information users and, as a result, individual
investors find it difficult to analyse and compare the information that they are provided.
Therefore, since a causal link has been identified between IC and business performance,
researchers argue for the inclusion of IC information in the corporate annual reports,
either directly or as subsidiary reports (Chen et al., 2005; Guthrie et al., 2005).
Australian researchers have used a number of methods, including content analysis
methods, questionnaires, and event study windows to investigate the IC disclosure
practices of Australian companies and the share market reactions to IC information
disclosure. As a result, they argue for improved transparency in the corporate annual
reports of Australian companies to help all information users to analyse and interpret data
to make informed investment choices (Royal & O’Donnell, 2008). Researchers argue

203
that Australia continues to lag behind other countries in the IC disclosure practices of
listed companies (Guthrie & Petty, 2000). Researchers suggest that by including
qualitative information on tacit IC assets value is added, value that is needed to ensure the
systematic use of such information by stakeholders in their investment choices (Royal &
O’Donnell, 2008). Researchers suggest that disclosure on price-sensitive IC information,
in the corporate annual reports does influence the share prices of the relevant stocks
(Dumay & Tull, 2007) and they conclude that stakeholders, such as members of CPA
Australia, would prefer companies to be more transparent and provide more information
about their IC (Petty et al., 2008). Notably, what is missing from the research is
information about what individual investors are looking for with regard to HRC and RC
disclosure within the annual reports; what “mum and dad” investors are calling for. This
is what this current research study provides.
The objective of Hypothesis 11 and Hypothesis 12 is to determine whether ABSC
similarly report the information on HRC and RC dimensions in their corporate annual
reports. This current research study seeks to shed some light on whether the dimensions
of HRC and RC are perceived by ABSC shareholders to be contained in the corporate
annual reports of ABSC. This is to determine if the assumption that the information is
included in the annual reports is legitimate and useful to investors. Quite specifically,
this research also relates to the significance between being “Bank of the Year 2008” and
reporting RC information, to conclude whether there is a significant link between the two
variables. Testing these two hypotheses has the potential to present empirically the
efforts of corporations to disclose information about their HRM policies and their

204
strategic orientation, and to present a snapshot of what an awarded ABSC reports on in
terms of HRC and RC dimensions information.
This second part of the main study is concerned with testing the hypotheses relating
to the quality and frequency of the inclusion of HRC and RC dimensions information in
the annual reports and the impact of HRC and RC dimensions on share prices. The
associated research questions, and their related hypotheses and sub-hypotheses are
presented here:
Research Question Six
How does the CBA, Money Magazine’s “Bank of the Year 2008”, compare to the
other banks in the provision of HRC and RC information in the corporate annual reports?
Hypothesis 11
The CBA has significantly higher frequency and quality of disclosure on HRC
dimensions information in the corporate annual reports, in comparison to the other seven
ABSC.
Sub-hypothesis 11.1
The CBA has significantly higher perceived frequency of disclosure on HRC
dimensions information in the corporate annual reports, in comparison to the other seven
ABSC.
Sub-hypothesis 11.2
The CBA has significantly higher perceived quality of disclosure on HRC
dimensions information in the corporate annual reports, in comparison to the other seven
ABSC.

205
Hypothesis 12
The CBA has significantly higher frequency and quality of disclosure on RC
dimensions information in the corporate annual reports, in comparison to the other seven
ABSC.
Sub-hypothesis 12.1
The CBA has significantly higher perceived frequency of disclosure on RC
dimensions information in the corporate annual reports, in comparison to the other seven
ABSC.
Sub-hypothesis 12.2
The CBA has significantly higher perceived quality of disclosure on RC
dimensions information in the corporate annual reports, in comparison to the other seven
ABSC.
Event study windows help researchers examine stock market reaction to the firm-
specific events. Research conducted by Barnes and Ma (2001), Desai (2000), Dumay and
Tull (2007), and Lonie et al. (1996) provide the precedent for this part of the research
study. An event study window is used in assessing if IC disclosure by the ABSC, within
the context of their annual reports, has a positive relationship with the share prices of the
banks for the period in which they were studied.
Based on the research, the assumption is that corporations that create strategic and
tactical plans to voluntarily disclose IC information, through their corporate annual
reports, are potentially rewarded in their relationships with investors and with the capital
markets (Chen et al., 2005; Dumay & Tull, 2007; Guthrie & Petty, 2000; 2008; Royal &
O’Donnell, 2008). However, past research has shed no light on the relationship between

206
the reporting of information about HRC and RC dimensions in the corporate annual
reports of ABSC and the share prices of those ABSC.
As stated previously, a corporation’s IC is considered to have the potential to
impact positively on the market value and on the financial performance of the corporation
(Bontis, 1998, 2002; Bontis & Fitz-enz, 2002; Chen et al., 2005). However, this study
investigates, specifically, the HRC and RC dimensions of IC. The objective of
Hypothesis 13 and Hypothesis 14 is to present quantitative evidence on the relationship
between the reporting of information about HRC and RC dimensions in the corporate
annual reports of ABSC and the share prices of those ABSC. By filling this gap in the
research, ABSC may be motivated to voluntarily disclose the information in an effort to
affect a positive result in their share prices, and, as a result, make information availability
fairer to all investors, professional investors and “mum and dad” investors.
Research Question Seven
For ABSC, is there a positive relationship between the provision of information on
HRC and RC dimensions in the corporate annual reports and the corporation’s share
price?
Hypothesis 13
There is a positive relationship between the provision of information on HRC
dimensions in the corporate annual reports and the corporation’s share price
Sub-hypothesis 13.1
There is a significant positive relationship between the perceived frequency of
reporting on HRC dimensions in the corporate annual reports of ABSC and the CAR of
the related stocks during the relevant reporting period.

207
Sub-hypothesis 13.2
There is a significant positive relationship between the perceived quality of
reporting on HRC dimensions in the corporate annual reports of ABSC and the CAR of
the related stocks during the relevant reporting period.
Hypothesis 14
There is a positive relationship between the provision of information on RC
dimensions in the corporate annual reports and the corporation’s share price?
Sub-hypothesis 14.1
There is a significant positive relationship between the perceived frequency of
reporting on RC dimensions in the corporate annual reports of ABSC and the CAR of the
related stocks during the relevant reporting period.
Sub-hypothesis 14.2
There is a significant positive relationship between the perceived quality of
reporting on RC dimensions in the corporate annual reports of ABSC and the CAR of the
related stocks during the relevant reporting period.
4.3.2 Research sample.
The participants in Focus Group B (N = 7) were simply individual shareholders, not
corporate investors or professional stock traders. It is acknowledged that none of the
participants in Focus Group B were participants in Focus Group A of the pilot study.
Finally, it is ensured that all participants in Focus Group B owned shares in at least one of
the eight corporations whose annual reports were reviewed. The sample range in age
from 22 to 59 years, these included two housewives, two retail salespersons, an
accountant, a bookkeeper, and university student.

208
The research sample under analysis for this part of the main study is the group of
eight ABSC listed on the ASX 200 at the end of the 2006/2007 financial year. The
2006/2007 financial year reports were the most recent reports available at the time (2008)
of conducting the focus group to apply the thematic content analysis. The names of those
members, and their ASX stock codes, are shown in Table 4.6.
Table 4.6
ABSC and their stock codes as per the ASX 200 as at the end of the financial year
2006/2007
Bank Name
Stock Code
Adelaide Bank Limited
ADB
Australia and New Zealand Banking Group Limited
ANZ
Bendigo Bank Limited
BEN
Bank of Queensland Limited
BOQ
Commonwealth Bank of Australia
CBA
National Australia Bank Limited
NAB
St.George Bank Limited
SGB
Westpac Banking Corporation
WBC
The CBA is the sample bank chosen to be compared against the other seven ABSC
based on its public profile and reputation as Money Magazine’s “Bank of the Year 2008”.
This is necessary to determine if there is a positive relationship between being the “Bank

209
of the Year” and the reporting to shareholders of information regarding HRC and RC
dimensions.
The research sample under analysis for testing the relationship between HRC and
RC dimensions and the share prices of ABSC is the group of eight ABSC listed on the
ASX 200 at the end of the 2006/2007 financial year. The share prices of those ABSC are
extracted from the Computershare and Commonwealth Securities websites. The share
prices under investigation are for the event windows linked to the reporting periods of
each of the ABSC.
4.3.3 Tools.
4.3.3.1 HRC and RC dimensions disclosure by CBA, “Bank of the Year 2008”, in
comparison to disclosure by other ABSC.
In conducting the thematic analysis of the corporate annual reports, the seven
members of the focus group used the predetermined operational definitions, those derived
from the pilot study, Focus Group A, for application. The group’s involvement in the
initial content analysis study, involves discussion and reporting, in writing or by
highlighting, on the perceived frequency and perceived quality of HRC and RC
dimensions disclosure in the annual reports of the eight ABSC listed on the ASX200 as at
financial year 2006/2007. The output is used for analyses for both parts of this, the
second part of the main study.
4.3.3.2 HRC and RC dimensions and the share prices of ABSC.
Event windows have been used successfully by past researchers when assessing the
impact of specific events on share prices (Barnes & Ma, 2001; Desai, 2000; Dumay &
Tull, 2007; Lonie, Abeyratna, Power, & Sinclair, 1996). An event window allows a
210
researcher to study an occurrence within a specified stated time frame, a time frame that
relates to the occurrence of a specific event (Barnes & Ma, 2001). In much the same way
as research conducted by others, this research study also utilises an event window to
empirically assess the share price movements of the banks to provide a relative
comparison between the fluctuations of the banks stock prices in an effort to identify a
positive relationship between HRC and RC reporting and stock prices (Barnes & Ma,
2001; Desai, 2000; Dumay & Tull, 2007; Lonie et al., 1996). Their share price increases
and decreases within their individual reporting periods provide the variables needed for
CAR analysis.
4.3.4 Procedure.
This part of the main study is performed with the data available from the content
analysis of the corporate annual report inclusion of HRC and RC dimensions information.
This includes the use of a comparative analysis of the corporate annual report
information, followed by a CAR analysis of share prices, to determine the significance of
the relationship between the inclusion of HRC and RC dimensions information in annual
corporate reporting and share prices of ABSC.
4.3.4.1 HRC and RC dimensions and the CBA “Bank of the Year 2008” -
Comparative analysis of the corporate annual report information.
Following on from the thematic content analysis, a comparative analysis is
conducted on the output. The CBA is chosen to be compared against the other ABSC as
it was, at the time of analysis, recognized as Money Magazine’s “Bank of the Year 2008”.
This represents the period of time just after the 2006/2007 reporting period. Comparison

211
on HRC and RC dimensions reporting is used to determine the significance of being
“Bank of the Year” in terms of reporting.
In selecting the candidates to participate in Focus Group B, engaged to analyse the
content of the aforementioned annual reports, participants were chosen with the
acknowledgement that the larger population which the sample represents has its one a
priori being individuals familiar with corporate annual reports, with a general
understanding of the layout, format, and intent of the content of annual reports. The
operational definitions of HRC and RC, developed through Focus Group A in the pilot
study, are used in this, the content analysis by Focus Group B. The members of the focus
group were asked to apply the operational definitions in the thematic content analysis of
the annual reports of the eight Australian banks investigated as at the end of the
2006/2007 financial year.
Throughout this entire research study, participants involved in the focus groups or
in completing any of the questionnaires provided to them, are required to provide
informed, written consent in accordance with the HREC requirements. These
requirements were met prior to the first Focus Group B meeting held.
During the first discussion, the Focus Group B participants were introduced to one
another by the researcher, being unknown to each other, although all known to the
researcher. The researcher provided a brief overview of the purpose of the focus group
and the goals the researcher sought to attain from the participants and their contributions.
Each participant was given a written copy of the definitions of HRC and RC, and of the
dimensions of each, as finalized by Focus Group A. HRC was represented through the
dimensions of employee recruitment, employee retention, employee values, development

212
of management and leadership qualities, and developing employee problem solving
skills. RC was represented through the dimensions of customer capital, supplier chain
relations and competitors. The participants became familiar with the terms as defined by
reading the definitions and discussing them; clarifying any of the wording that was either
unclear or unfamiliar to them. Each participant was then given copies of the corporate
annual reports of two of the eight ABSC listed on the ASX 200 at the end of the
2006/2007 financial year. They were asked by the researcher to review the two of them
for one hour, individually, without discussion. They were allowed to make notes on the
documents relating to what and where HRC and RC was reported, to be able to reference
their notes during the focus group discussion. Upon completion of the individual review,
the reviewed annual reports of the companies were discussed. The remaining six annual
reports were distributed and reviewed in the second and third meetings, three on each
occasion.
During the first meeting, the participants reviewed the annual reports of CBA and
WBC and discussed where and what HRC and RC information was evident to each of the
participants. During the second meeting, they analysed the annual reports of ADB, ANZ,
and BEN. During the third meeting, they analysed the reports of BOQ, NAB, and SGB.
At each session, the reports were initially reviewed by individuals without
discourse; the second hour was spent in discussing and making a written list of their
findings. There was no formal break taken during any of the two hours sessions;
however, individuals were free to attend and leave the meetings as necessary. None left
during any meeting and failed to return.
213
The participants were asked to identify the inclusion of information on HRC and
RC dimensions identified within the annual reports. They identified what HRC and RC
information they perceived was provided by each of the banks in their financial year
2006/2007 annual reports and how frequently, based on the number of instances the
information was cited, the HRC and RC information they perceived was provided in the
corporate annual reports. Also, based on their perceptions, they were asked to identify
those banks that had provided HRC and RC information in their annual reports and they
were asked to rank them against the others in terms of perceived quantity and quality of
information.
At each focus group meeting, of which there were three, participants in Focus
Group B read through the annual reports and manually highlighted the HRC and RC
information they evidenced in the reports. The outcomes of the discussions of Focus
Group B were documented by the researcher and a set of data, based on the detection and
manual coding of statements relating to HRC and RC information, was collected and
referred to the perceived frequency. Perceived frequency relates to the number of times
the information of HRC and RC was perceived to have been reported throughout all the
corporate annual reports. Quantitative analysis of the collected data provided the
researcher the ability to perform content analysis and identify the frequency of use of and
references to the HRC constructs in the 2006/2007 annual reports of each organization.
Subsequently, the members discussed their individual findings with the other participants
and a list of statements relating to the HRC and RC dimensions was compiled for each of
the reports analysed. The researcher compiled the summary of information into a single
document. The summarized information on the perceived number of times companies

214
reported HRC and RC dimensions information in the annual reports of the eight
Australian banks was tallied manually.
As for the perceived quality of the HRC and RC information provided, participants
used the discussion to conclude how each of the banks ranked, relative to the others, on
the value of the HRC and RC information provided. Members of Focus Group B were
asked to rank, collectively, for each of the eight dimensions of HRC and RC, the quality
of the information provided relative to the quality of information provided by each of the
others of the eight banks. They were asked to rank the banks on each dimension from 1,
being the top-ranked and best on quality disclosure, to 8, being the bottom-ranked on
quality disclosure.
4.3.4.2 HRC and RC dimensions and the share prices of ABSC - CAR analysis of
share prices.
To analyse the relationship between the HRC and RC dimensions and the share
price of each bank, CAR analysis is used in this part of the research study. This work is
performed using the information extracted from the 2006/2007 financial year corporate
annual reports of all eight ABSC listed on the ASX 200 at the end of the 2006/2007
financial year. As with Dumay and Tull (2007), the CAR occurring during the event
window is investigated to evaluate whether the market reacts favourably to disclosure.
An event window period of +5 to -3 days of release of the corporate annual report, for
each of the ABSC being investigated is used. This is to include the period of anticipation
and speculation and, the period in which the information provided is sifted through by
shareholders. By giving an adequate period of time for the shareholders to assess and

215
react to the information disclosed in the corporate annual reports, the potential for
measuring only a knee-jerk reaction is diminished.
4.3.5 Data analysis.
4.3.5.1 HRC and RC dimensions and the CBA “Bank of the Year 2008”.
The purpose of the content analysis is to obtain information regarding the frequency
and quality of HRC and RC dimensions reported in each of the annual reports of eight
banks represented in the list of ABSC. Output from the content analysis of ABSC
corporate annual reports for the financial year 2006/2007 is used for the analysis for this
part of the research.
The sixth pair of hypotheses (Hypothesis 11 and Hypothesis 12) is concerned with
determining whether there is a significant difference between the CBA and the other
ABSC in the provision of information about HRC and RC dimensions in the corporate
annual reports. For these hypotheses, the dependent variables are perceived frequency
and perceived quality of reporting on HRC and RC dimensions. The independent
variable is each one of the eight ABSC under investigation in this research study. Figure
4.16 and Figure 4.17 define the variables for Hypothesis 11 and Hypothesis 12.
Figure 4.16. Variables for Hypothesis 11

216
Figure 4.17. Variables for Hypothesis 12
Discriminatory Analysis - Friedman’s Test
For Research Question Six, the Friedman’s Test, a non-parametric randomized
block analysis of variance, is used for the data analysis relating to both Hypotheses 11
and 12. Used in situations where the data is nominal or ordinal in orientation, this test is
used to compare observations repeated on the same subjects. An alternative to the
ANOVA, when the assumption of normality or equality of variance is not met, this, like
many non-parametric tests, uses the ranks of the data rather than their raw values to
calculate the statistic. For the hypothesis to be accepted, the p-Value must be < 0.05.
4.3.5.2 HRC and RC dimensions and the share prices of ABSC.
Among the aims of this research study was to investigate the relationship between
the perceptions of HRC and RC dimensions information and the share prices of ABSC.
This is first to identify which of the eight ABSC report information on their HRC and RC
in their annual reports, what they reported on their HRC and RC, and to what extent it
was reported. In addition to this, comparisons are also made between the ABSC based on
their share price movements and CAR during their related corporate reporting periods.
To carry this out, a list of the relevant share prices is needed. A list of the relevant share

217
prices of the ABSC stocks, used for analysis in this part of the study, is provided in
Figure 4.18. The information was sourced from both Computershare and Commonwealth
Securities websites.
ADB ANNUAL REPORT 31/10/2007
DATE 26/10 29/10 30/10 31/10 1/11 2/11 5/11 6/11 7/11
PRICE 14.66 14.70 14.80 14.67 15.00 14.90 14.46 14.42 14.42
ANZ ANNUAL REPORT 14/11/2007
DATE 9/11 12/11 13/11 14/11 15/11 16/11 19/11 20/11 21/11
PRICE 27.95 27.40 28.38 28.70 28.14 27.70 28.05 28.34 27.83
BEN ANNUAL REPORT 27/09/2007
DATE 24/09 25/09 26/09 27/09 28/09 1/10 2/10 3/10 4/10
PRICE 13.79 13.63 13.53 13.65 13.70 13.71 13.91 13.77 13.65
BOQ ANNUAL REPORT 07/11/2007
DATE 2/11 5 /11 6/11 7/11 8/11 9/11 12/11 13/11 14/11
PRICE 19.10 18.76 19.30 19.29 18.80 18.27 17.90 18.39 18.23
CBA ANNUAL REPORT 29/08/2007
DATE 24/08 27/08 28/08 29/08 30/08 31/08 3/09 4/09 5/09
PRICE 54.81 55.20 54.62 54.20 53.86 55.15 55.27 55.65 55.10
NAB ANNUAL REPORT 07/12/2007
DATE 4/12 5/12 6/12 7/12 10/12 11/12 12/12 13/12 14/12
PRICE 39.10 38.90 39.06 39.22 38.88 38.91 39.16 39.18 38.45
SGB ANNUAL REPORT 31/10/2007
DATE 26/10 29/10 30/10 31/10 1/11 2/11 5/11 6/11 7/11
PRICE 36.23 36.35 35.33 36.35 37.10 36.76 36.25 36.84 37.56
WBC ANNUAL REPORT 08/11/2007
DATE 5/11 6/11 7/11 8/11 9/11 12/11 13/11 14/11 15/11
PRICE 30.15 30.46 29.80 28.98 28.62 28.00 28.35 28.71 28.22
Stock share prices are expressed in AUD
Sources:
www.au.computershare.com. , accessed 21/07/08
www.commsec.com.au, accessed 21/07/08
Figure 4.18. Share prices for banks listed on the ASX 200, as at end financial year
2006/2007, for disclosure periods of +5 to -3 days (relating to release of annual reports)

218
The seventh pair of hypotheses (Hypothesis 13 and Hypothesis 14) is concerned
with testing whether there is a positive relationship between the provision of information
on HRC and RC dimensions in the corporate annual reports of ABSC and the
corporation’s share price. The independent variables for both hypotheses are the
frequency and the quality of reporting on HRC and RC dimensions in the corporate
annual reports of each of the ABSC representing the sample group. Also, for both
hypotheses, the dependent variable is the CAR of the ABSC. Figure 4.19 and Figure 4.20
set out the variables for Hypothesis 13 and Hypothesis 14.
Figure 4.19. Variables for Hypothesis 13
Figure 4.20. Variables for Hypothesis 14

219
The CAR on the share price of ABSC is used to measure its change in market
value. This study uses the same method to determine CAR as employed by Dumay and
Tull (2007). For the event window +5 to -3 days of releasing the annual report, the
cumulative return (stock) is calculated by applying the company’s closing share price at
Day +5 and subtracting the closing share price at Day -3. That is then divided by the
closing share price at Day -3 and the total is then converted into a percentage by
multiplying the figure by 100. Figure 4.21 demonstrates this process.
Cumulative return (Stock) = (Closing price (Day +5) – Closing price (Day -3) x 100
Closing price (Day -3) 1
Therefore, Cumulative return (Banking sector stock on ASX 200 as at 30 June
2007)
= (Total of closing prices (Day +5) – Total of closing prices (Day -3)) x 100
Total of Closing prices (Day -3) 1
Figure 4.21. Process to determine cumulative return (stock) and cumulative return
(banking sector stock on ASX 200 as at 30 June 2007)
To calculate each company’s CAR for the event window +5 to -3 days of releasing
the annual report, the cumulative return (banking sector stock on ASX 200 as at 30 June
2007) is subtracted from the cumulative return (stock). Figure 4.22 demonstrates the
process.
CAR of each stock = Cumulative return (Stock) - Cumulative return (Banking sector
stock on ASX 200 as at 30 June 2007)
Figure 4.22. Process to determine CAR of each bank stock

220
Hypothesis Rank Correlation
For both Hypothesis 13 and Hypothesis 14, Hypothesis Rank Correlation test is
used to assess the relationship between frequency and quality of HRC and RC
information disclosure, CAR, and p-value. The correlations are used to identify whether
there exists a positive relationship between reporting on the HRC and RC dimensions and
share price appreciation of the related ABSC stocks. The implication is that it should be
easier to convince companies to be more transparent and to provide their stakeholders
with more information on their HRC and RC dimensions if they held the view that such
disclosure would be rewarded with an appreciation in the corporation’s share price.
4.4 Summary
The main study is set out in two distinct parts. The first part relates to the
importance of HRC and RC dimensions to shareholders in their investment decisions.
The second part relates to the disclosure practices of ABSC in relation to HRC and RC
dimensions and to the implications of disclosure on share prices of ABSC.
The main study is undertaken to accomplish four distinct research aims. Each
research aim is achieved through the testing of a number of hypotheses. The first two
research aims relate to the first part of the main study and require the testing of the
hypotheses relating to research questions one to five. This is made possible by analysing
the output of the questionnaire. The questionnaire provides the necessary data as the
output of the questionnaire provides insight into the perceptions and behaviours of the
individual shareholders of ABSC.
The second part of the main study is concerned with the final two aims of the
research study. The third research aim involves testing the hypotheses relating to

221
research question six. This is made possible by analysing the output of the content
analysis of the ABSC corporate annual reports for the financial year 2006/2007. The
content analysis is conducted through the use of Focus Group B, a focus group of seven
individual shareholders of ABSC. The data extracted from the analysis makes it possible
to compare disclosure practices of the CBA, “Australian Bank of the Year 2008”, to the
disclosure practices of the other seven ABSC identified for this study. Finally, the fourth
research aim involves an event window study of the share price movements of the eight
ABSC. This is for the event window relating to the release of the 2006/2007 financial
year annual reports of each of those individual banks. This process makes it possible to
measure for potential share price appreciation, within the period of the corporate annual
reporting disclosure. The relationship between disclosure on HRC and RC dimensions
within the corporate annual reports of ABSC and the share price of the ABSC stocks is
assessed in a way that is simple, clear, and relevant to this research study. Chapter Five
provides a discussion of the results of the main study.
222
Chapter Five
Main Study Results
The purpose of this chapter is to provide the results of data analysis within the main
study. Analysis of the data followed the testing of each of the fourteen hypotheses,
developed to investigate the seven research questions. A range of statistical tests were
used for analysis. The first part of the study included the use of ANOVA and post hoc
analysis, t-test, logistic regression, and discriminatory analysis. The second part of the
study included the use of a comparative analysis on the data obtained from the content
analysis and a CAR analysis on the share prices of ABSC. The statistical tests and the
variables tested were discussed in detail in Chapter Four. The test results are set out in
detail in this chapter.
5.1 Aims of Main Study
This research study was undertaken to achieve four specific aims (refer to Figure
4.1). Just to recapitulate, the first part of this study focuses on two of the four aims.
These include to investigate the perceptions of individual investors about information
concerning the IC components of HRC and RC, and to provide an assessment of the
relationship between the disclosure of HRC and RC and its impact on share value, as
share market volatility and share price fluctuation are issues that impact all investors.
The second part of the main study focuses on the remaining two aims. These aims
include, to investigate if, in the corporate annual reports of ABSC, information on HRC
and RC dimensions is provided to investors, seeking an understanding of the differences
in how ABSC report on HRC and RC dimensions, and, to understand the sources of share
investment advice individual investors turn to in their investment decisions.

223
A questionnaire was used for a large component of this study (for Part One). The
questionnaire was used to investigate demographic information, shareholder perceptions,
and shareholder behaviour relating to the first five research questions and their related
hypotheses. The demographic information obtained from the questionnaire was
discussed in Chapter Four. This chapter focuses on the results of the testing of
hypotheses.
5.2 Demographic Results
The demographic data captured in this research study included descriptive measures
on gender, age, and education of the research participants. While demographic results are
not presented here, all are discussed in section 4.1.2.1 and the conclusions regarding the
demographic data, drawn from the research, are tested for their moderating influence on
the perceptions and investment behaviours of investors. This is discussed further in
section 5.3.1.5.
5.3 Results of Testing Hypotheses
This section deals with the results of hypotheses testing for the first part of the main
study. These include tests of: (1) the relationship between ownership in ABSC and
shareholder perceptions about the importance of HRC and RC dimensions, (2) the
relationship between shareholder perceptions about the importance of HRC and RC
dimensions and the investment decisions of those shareholders regarding ABSC, (3) the
comparison of ABSC on the quality and percent frequency of disclosure of HRC and RC
dimensions information in their corporate annual reports of ABSC, and (4) the
relationship between disclosure on HRC and RC dimensions and share prices of ABSC.

224
The data for analysis is extracted from a number of sources including the
questionnaire; the content analysis of the financial year 2006/2007 corporate annual
reports of the eight ABSC stocks investigated, and the list of share prices of the ABSC
stock during the event window +5 to -3 days of release of their corporate annual reports.
5.3.1 Part One - Importance and use of HRC and RC dimensions.
Part One investigated how important the “mum and dad” shareholders of ABSC
perceived HRC and RC dimensions to be and how they used the information relating to
those dimensions. This was necessary to assess the impact of their perceptions on their
investment decisions, especially in the case of purchasing, holding on to, and selling
shares in ABSC. Furthermore, Part One investigated how individual shareholder
perceptions, sources of share investment advice individual investors refer to in making
their share investment choices, and the demographic profiles of shareholders, impacted
on their investment decisions.
As such, Part One was designed to provide answers to five research questions and,
as a result, tested a total of ten related hypotheses. Each of the ten hypotheses is made up
of a number of sub-hypotheses relating to each of the relevant variables. This section
deals with the various hypotheses findings.
5.3.1.1 Relationship between shareholders of ABSC and their perceptions about
HRC and RC dimensions.
In assessing differences in the perceptions of individual shareholders of the
importance of HRC and RC dimensions between ownership of stocks in the different
ABSC, One-way ANOVA (Analysis of Variance) was used. This was to test the
statistical significance of the relationship between the variables of ownership in specific

225
ABSC and shareholder perceptions about the importance of HRC and RC dimensions.
Since One-way ANOVA tests the differences in a single interval dependent variable
between two, three, or more groups formed by the categories of a single categorical
independent variable, it was used to analyse the information captured in this part of the
research undertaken.
After ANOVA testing was concluded, a more stringent post hoc test, Bonferroni
test (Burns & Burns, 2008), was also conducted on the data. As there were four groups
of ABSC shareholders being compared in these hypotheses, the research required this
pair-wise comparison to determine in which pair of ABSC shareholders there was a
statistically significant difference (Burns & Burns, 2008). This is because sometimes,
even though the overall F-test is found to be statistically significant at a 95 percent
confidence level, none of the pairs of variables analysed can be found to be significant.
This is due to a stringent level of significance applied in the Bonferroni test.
Hypotheses 1 was concerned with testing whether shareholders of Australia’s four
biggest banks (CBA, WBC, NAB, and ANZ) have significant differences in perceptions
of the importance of HRC dimensions in the decision to purchase ABSC stock. For this
hypothesis, testing was conducted on each of the independent variables, ownership of
shares in only one of the big four banks.
Data extracted from the questionnaire included the necessary information on the
share ownership of respondents in relation to ABSC. In relation to this investigation, it
was determined that 23.08 percent of respondents indicated they held shares in only
CBA, 5.99 percent of respondents indicated they held shares in only WBC, 14.53 percent

226
of respondents indicated they held shares in only NAB, and 6.84 percent of respondents
indicated they held shares in only ANZ (refer to Table 5.1).
Table 5.1 Stock ownership of respondents relating to the eight ABSC
Stock ownership of respondents relating to the eight ABSC
Bank Ownership Frequency Percent
CBA
Yes 27 23.08
Yes With Other Banks 42 35.90
WBC
Yes 27 05.99
Yes With Other Banks 19 16.24
NAB
Yes 27 14.53
Yes With Other Banks 37 31.62
ANZ
Yes 27 06.84
Yes With Other Banks 41 35.04
For this main study, each hypothesis in itself became a test of numerous sub-
hypotheses. In testing Hypothesis 1, One-Way ANOVA was used for testing sub-
hypotheses 1 (a) to 1 (e). The dependent variables were the responses about the
importance of the HRC dimensions to deciding to purchase bank stocks. These variables
were extracted from question six of the questionnaire. Table 5.2 sets out the results of the
One-way ANOVA testing for Hypothesis 1.

227
Table 5.2
Results for One-way ANOVA testing of differences in perceptions of importance of HRC
dimensions in ABSC stock purchase decision
HRC Variables
Shares
Held
N
Mean
SD
ANOVA
F-Value
DF = (3,55)
ANOVA
P-Value
Levene #
P-Value
DF = (3,55)
Kruskal
Wallis P-
Value
DF = 3
Employee
Recruitment
CBA 27 3.830 0.762
1.370 0.260 0.209 0.190 WBC 7 3.686 0.863
NAB 17 4.106 0.388
ANZ 8 3.600 0.555
Employee
Retention
CBA 27 3.807 0.812
1.270 0.290 0.070 0.150 WBC 7 3.743 0.991
NAB 17 4.094 0.375
ANZ 8 3.550 0.463
Employee Values
CBA 27 3.659 0.824
1.430 0.240 0.040 0.230 WBC 7 3.571 0.867
NAB 17 4.047 0.384
ANZ 8 3.550 0.798
Management &
Leadership
Qualities
CBA 27 3.741 0.786
3.130* 0.030 0.170 0.020
WBC 7 3.486 0.747
NAB 17 4.235 0.443
ANZ 8 3.575 0.654
Employee
Problem Solving
Skills
CBA 27 3.719 0.831
2.790* 0.049 0.120 0.030
WBC 7 3.486 0.807
NAB 17 4.224 0.418
ANZ 8 3.650 0.542
*P < 0.05
The research finds, based on the mean perceptions of NAB shareholders in relation
to the HRC dimensions (M = 4.106, M = 4.094, M = 4.047, M = 4.235, and M = 4.224),
that only bank shareholders of solely NAB stocks perceive all five dimensions of HRC to

228
be important to their decisions to purchase ABSC stocks (refer to Table 5.2).
Additionally, with a 95 percent level of confidence in the ANOVA results (p-value <
0.05), it is noted in Table 5.2 that the F-value [(3, 55) = 3.13 p = 0.030] for employee
problem solving skills, and F-value [(3, 55) = 2.79, p = 0.049] management and
leadership qualities dimensions of HRC are significant. Also, Levene Test is used for
testing Homogeneity of Variances assumption for ANOVA. Since p-value for all the
HRC variables except employee values is > 0.05, it is concluded that the assumption is
not failed. Finally, non-parametric tests are used against ANOVA if the sample size is
small or if any of the assumption of ANOVA fails (Agresti & Franklin, 2009). Kruskal-
Wallis is a non-parametric test which is used against ANOVA if the sample size is small
(< 30) or if any of the assumption of ANOVA fails. Based on the p-value for all the HRC
variables, it also leads to the same conclusion derived from findings of ANOVA. Taken
together, these results suggest that there is a significant difference in perceptions of the
importance of the HRC dimension of management and leadership and employee problem
solving skills information in the decision to purchase ABSC stock. Additionally, it was
found that for employee problem solving skills and management and leadership qualities
dimensions, the mean perception (M = 4.224 and M = 4.235) of importance is
significantly higher for NAB shareholders than other bank’s shareholders. This result
delivers a calculated mean of less than four for other bank shareholders. Furthermore,
given that p-value is > 0.05 in Table 5.2 for employee recruitment, employee retention,
and employee values dimensions of HRC, sub-hypotheses 1 (a) to 1 (c) are rejected and
it is concluded that the perception of importance values for these HRC dimensions are not

229
significantly different between Australia’s four biggest banks (CBA, WBC, NAB, and
ANZ).
Hypothesis 2 was concerned with testing whether shareholders of Australia’s four
biggest banks (CBA, WBC, NAB, and ANZ) have significant differences in perceptions
of the importance of RC dimensions in the decision to purchase ABSC stock. Hypothesis
2, including sub-hypotheses 2 (a) to 2 (c), was also analysed using One-way ANOVA.
Again, the independent variables for this hypothesis consisted of the specific ABSC
stocks held. The dependent variables were the responses about the importance of the RC
dimensions to deciding to purchase bank stocks. These variables were extracted from
question six of the questionnaire. Table 5.3 sets out the results of the One-way ANOVA
testing for Hypothesis 2.
Table 5.3
Results for One-way ANOVA testing of differences in perceptions of the importance of
HRC dimensions in ABSC stock purchase decision
HRC Variables
Shares
Held
N
Mean
SD
ANOVA
F-Value
DF = (3,55)
ANOVA
P-Value
Levene # P-
Value
DF = (3,55)
Kruskal
Wallis P-
Value
DF = 3
Customer
Capital
CBA 27 4.096 0.539
3.780* 0.020 0.120 0.010
WBC 7 3.971 0.605
NAB 17 4.459 0.262
ANZ 8 3.825 0.609
Supplier Chain
Relations
CBA 27 4.037 0.679
3.240* 0.030 0.140 0.020
WBC 7 4.257 0.755
NAB 17 4.459 0.337
ANZ 8 3.750 0.475

230
HRC Variables
Shares
Held
N
Mean
SD
ANOVA
F-Value
DF = (3,55)
ANOVA
P-Value
Levene # P-
Value
DF = (3,55)
Kruskal
Wallis P-
Value
DF = 3
Competitors
CBA 27 4.052 0.556
2.110 0.110 0.620 0.060 WBC 7 3.914 0.598
NAB 17 4.294 0.382
ANZ 8 3.800 0.466
*P < 0.05
The research finds, based on the mean perceptions of CBA shareholders in relation
to RC dimensions (M = 4.096, M = 4.037, M = 4.052), and on the mean perceptions of
NAB shareholders in relation to the RC dimensions (M = 4.4.459, M = 4.459, and M =
4.294), that both bank shareholders of solely CBA and solely NAB stocks perceive all
three dimensions of RC to be important to their decisions to purchase ABSC (refer to
Table 5.3). The research finds, based on the mean perceptions of WBC shareholders in
relation to RC dimensions (M = 4.257), that bank shareholders of solely WBC stocks
perceive the dimension of supplier chain relations to be important to their decisions to
purchase ABSC (refer to Table 5.3). Additionally, with a 95 percent level of confidence
in the ANOVA results (p-value < 0.05), it is noted in Table 5.3 that the F-value [(3, 55) =
3.78 p = 0.020] for customer capital and F-value [(3, 55) = 3.24, p = 0.030] for supplier
chain relations dimensions of RC are significant. Also, Levene Test is used for testing
Homogeneity of Variances assumption for ANOVA. Since p-value for all the RC
variables is > 0.05, it is concluded that the assumption is not failed. Finally, Kruskal-
Wallis is a non-parametric test which is used against ANOVA if the sample size is small

231
(< 30) or if any of the assumption of ANOVA fails. Based on the p-value for all the RC
variables, it also leads to the same conclusion derived from findings of ANOVA. Taken
together these results suggest that there is a significant difference in perceptions of the
importance of the RC dimension of customer capital and supplier chain relations
information in the decision to purchase ABSC stock. Furthermore, given that the p-value
is > 0.05 in Table 5.3 for the competitors dimension of RC, the results suggest
Hypothesis 2, including only sub-hypotheses 2 (c), is rejected and it is concluded that the
perception of importance value for the RC dimension of competitors is not significantly
different between Australia’s four biggest banks (CBA, WBC, NAB, and ANZ).
Based on the conclusions drawn from the ANOVA testing for both Hypothesis 1
and Hypothesis 2, more stringent post hoc tests were conducted. Bonferroni test was
conducted on the results determined to be of statistical significance. The results of post
hoc testing are demonstrated in Table 5.4.
Table 5.4
Results of post hoc comparisons (Bonferroni test)
Dependent
Variable Post Hoc Test
Shares
Held In
Shares
Held In
Mean
Difference
Standard
Error
P-
Value
Management &
Leadership
Qualities
Bonferroni
Adjusted T-
test (Dunn
Test)
CBA WBC 0.26 0.29 1.00
CBA NAB -0.49 0.21 0.14
CBA ANZ 0.17 0.27 1.00
WBC NAB -0.75 0.31 0.11
WBC ANZ -0.09 0.35 1.00
NAB ANZ 0.66 0.29 0.17
Employee
Problem-solving
Skills
Bonferroni
Adjusted T-
test (Dunn
Test)
CBA WBC 0.23 0.30 1.00
CBA NAB -0.51 0.22 0.14
CBA ANZ 0.07 0.28 1.00
WBC NAB -0.74 0.31 0.13
WBC ANZ -0.16 0.36 1.00
NAB ANZ 0.57 0.30 0.36

232
Customer Capital
Bonferroni
Adjusted T-
test (Dunn
Test)
CBA WBC 0.12 0.21 1.00
CBA NAB -0.36 0.15 0.13
CBA ANZ 0.27 0.20 1.00
WBC NAB -0.49 0.22 0.19
WBC ANZ 0.15 0.26 1.00
NAB ANZ 0.63 0.21 0.03
Supplier Chain
Relations
Bonferroni
Adjusted T-
test (Dunn
Test)
CBA WBC -0.22 0.25 1.00
CBA NAB -0.42 0.18 0.14
CBA ANZ 0.29 0.24 1.00
WBC NAB -0.20 0.26 1.00
WBC ANZ 0.51 0.30 0.60
NAB ANZ 0.71 0.25 0.04
Burns and Burns (2008) refer to the use of post hoc tests, including Bonferroni T-
test. They suggest Bonferroni Adjusted T-tests, which are also referred to as the Dunn
test, are used when there are multiple comparisons of means. As a general principle,
when comparisons of group means are selected on a post hoc basis simply because they
are large, there is an expected increase in variability for which the researcher must
compensate by applying a more conservative test, otherwise, the likelihood of type 1
errors will be substantial. The Bonferroni adjustment is perhaps the most common
approach to making post-hoc significance tests more conservative.
Post hoc tests help to control type 1 error by demanding a more rigorous level for
significance on every successive test (Burns & Burns, 2008). Since p-value < 0.05 (95%
confidence level), the results suggest there is significant difference in the perceptions of
importance of customer capital between NAB shareholders and ANZ shareholders (refer
to Table 5.4). Since p-value < 0.05 (95% confidence level), the results also suggest that
there is a significant difference in the perceptions of importance of supplier chain
relations between NAB shareholders and ANZ shareholders (refer to Table 5.4).

233
Therefore, Hypothesis 2, including sub-hypotheses 2 (a) and 2 (b), is accepted.
That is, there is a significant difference in perceptions of the importance of the RC
dimensions of customer capital and supplier chain relations information in the decision to
purchase ABSC stock. The research finds that shareholders of solely NAB stocks have
significantly higher perceptions of importance of information about the RC dimensions of
customer capital and supplier chain relations, to their decisions to purchase ABSC stocks
than shareholders of solely ANZ stocks in particular. Additionally, it was found that for
all three RC dimensions, the mean perception (M = 4.459, M = 4.459, and M = 4.294) of
importance is higher for NAB shareholders than other bank’s shareholders. This result
delivers a calculated mean of less than these mean scores for other bank shareholders.
Furthermore, given that the p-value is > 0.05 in Table 5.3 for the competitors dimension
of RC, Hypothesis 2, including only sub-hypotheses 2 (c), is rejected and it is concluded
that the perception of importance value for the RC dimension of competitors is not
significantly different between Australia’s four biggest banks (CBA, WBC, NAB, and
ANZ). Also, as demonstrated in Table 5.4, post hoc testing does not result in a
significant difference in the perception of importance of the two HRC dimensions of
management and leadership qualities and employee problem solving skills. As such, it is
concluded that Hypothesis 1, including sub-hypotheses 1 (a) to 1 (e), is rejected and it is
concluded that the perception of importance value for all HRC dimensions is not
significantly different between Australia’s four biggest banks, including CBA, WBC,
NAB, and ANZ.

234
5.3.1.2 Differences between perceptions of shareholders of either single or
multiple ABSC.
This part of the study is concerned with testing the differences perceptions of
individual shareholders of the importance of HRC and RC information between
ownership of stocks in only a single Australian bank and ownership of stocks in multiple
Australian banks. Table 5.1 sets out the results of the data extracted from the responses
to the questionnaire regarding ownership of stocks in the big four banks.
In addition to what was established for Hypothesis 1 and Hypothesis 2 regarding
the single bank shareholdings of respondents, this hypothesis utilises data on multiple
bank shareholdings (refer to Table 5.1). It was established that 35.90 percent of
respondents indicated they held shares in CBA along with other banks, 16.24 percent of
respondents indicated they held shares in WBC along with other banks, 31.62 percent of
respondents indicated they held shares in NAB along with other banks, and, 35.04
percent of respondents indicated they held shares in ANZ along with other banks.
Hypothesis 3 and Hypothesis 4 are tested for significant differences in the
perceptions of importance of HRC and RC dimensions to the decision to purchase ABSC
stocks among shareholders of only a single bank of the big four banks and shareholders
of multiple banks including, at least, one of the big four banks. As the independent
variable, the two samples selected to test these hypotheses included shareholders of
ABSC stocks in only a single bank of the big four banks and shareholders of ABSC
shares in multiple banks including, at least, one of the big four banks. This was
determined from the analysis of responses to the related question in the first part of the
questionnaire (refer to Figure 4.2).

235
The dependent variables were the responses about the importance of the HRC and
RC dimensions to deciding to purchase bank stocks. These variables were extracted from
question six of the questionnaire (refer to Figure 4.4).
Quite specifically, Hypothesis 3 tested for a significant difference in the
perceptions of importance of HRC information in the decision to purchase ABSC stock,
of shareholders who have ownership in only one of the big four Australian banks, and of
shareholders who have ownership in multiple banks. Similarly, Hypothesis 4 tested for a
significant difference in the perceptions of importance of RC information in the decision
to purchase ABSC stock of shareholders who have ownership in only one of the big four
Australian banks, and of shareholders who have ownership in multiple banks.
Both hypotheses were tested and analysed using a t-test to determine the
relationship between the independent and dependent variables. Tables 5.5 to 5.8 set out
the results of the t-test for Hypothesis 3.
Table 5.5
Results for difference in perceptions of HRC in ABSC stock purchase decisions of CBA
shareholders and of shareholders of multiple ABSC including CBA
HRC
Variables
CBA Shares
Held
N Mean SD
Mean
Differ-
ence
T-
Value
DF = 67
P-Value
Levene
# P-
Value
DF =
(1,67)
Mann-
Whitney
P-Value
Employee
Recruitment
Yes 27 3.830 0.762
0.001 0.006 0.995 0.935 0.920 Yes With
Other Banks 42 3.829 0.675
Employee
Retention
Yes 27 3.807 0.812
-0.050 -0.277 0.783 0.387 0.920 Yes With
Other Banks 42 3.857 0.669

236
HRC
Variables
CBA Shares
Held
N Mean SD
Mean
Differ-
ence
T-
Value
DF = 67
P-Value
Levene
# P-
Value
DF =
(1,67)
Mann-
Whitney
P-Value
Employee
Values
Yes 27 3.659 0.824
0.021 0.108 0.914 0.767 0.890 Yes With
Other Banks 42 3.638 0.776
Management
& Leadership
Qualities
Yes 27 3.741 0.786
-0.026 -0.138 0.890 0.678 0.890 Yes With
Other Banks 42 3.767 0.743
Employee
Problem
Solving Skills
Yes 27 3.719 0.831
-0.043 -0.227 0.821 0.823 0.850 Yes With
Other Banks 42 3.762 0.739
Table 5.5 relates to sub-hypothesis 3.1, including 3.1 (a) to 3.1 (e). The
independent variable is the ABSC stocks held and the dependent variable is HRC
dimensions. Sub-hypothesis 3.1 was tested using Independent Samples T-test.
With a 95 percent confidence level, it is noted that the t-test p-value is > 0.05 (refer
to Table 5.5) for all HRC dimensions, and, as such, the sub-hypothesis 3.1 (a) to 3.1 (e) is
rejected and it is concluded that the mean values for these dimensions are not
significantly different between CBA and other three of the big four ABSC. Also, the
Levene test is used for testing Homogeneity of Variances assumption for t-test. Since p-
value for all HRC variables is > 0.05, it is concluded that the assumption is not failed.
Further, Mann-Whitney is a non-parametric test that is used against t-test if the sample

237
size is small (< 30) or if any of the assumption of t-test fails. Based on the p-value for all
HRC variables, it also leads to the same conclusion derived from the t-test.
Table 5.6 relates to sub-hypothesis 3.2, including 3.2 (a) to 3.1 (e). The
independent variable is the ABSC stocks held and the dependent variable is HRC
dimensions. Sub-hypothesis 3.2 was tested using Independent Samples T-test.
Table 5.6
Results for difference in perceptions of HRC in ABSC stock purchase decisions of WBC
shareholders and of shareholders of multiple ABSC including WBC
HRC
Variables
WBC Shares
Held
N Mean SD
Mean
Differ-
ence
T-
Value
DF = 24
P-Value
Levene
# P-
Value
DF =
(1,24)
Mann-
Whitney
P-Value
Employee
Recruitment
Yes 7 3.686 0.863
0.023 0.067 0.947 0.809 0.810 Yes With
Other Banks 19 3.663 0.727
Employee
Retention
Yes 7 3.743 0.991
-0.120 -0.417 0.680 0.069 0.700 Yes With
Other Banks 19 3.863 0.490
Employee
Values
Yes 7 3.571 0.867
0.108 0.316 0.755 0.870 0.830 Yes With
Other Banks 19 3.463 0.743
Management
& Leadership
Qualities
Yes 7 3.486 0.747
-0.146 -0.492 0.627 0.892 0.790 Yes With
Other Banks 19 3.632 0.644
Employee
Problem
Solving Skills
Yes 7 3.486 0.807
-0.156 -0.416 0.681 0.630 0.710 Yes With
Other Banks 19 3.642 0.863

238
With a 95 percent confidence level, it is noted that the t-test p-value is > 0.05 (refer
to Table 5.6) for all HRC dimensions, and, as such, the sub-hypothesis 3.2 (a) to 3.2 (e) is
rejected and it is concluded that the mean values for these dimensions are not
significantly different between WBC and other three of the big four ABSC. Also, the
Levene test is used for testing Homogeneity of Variances assumption for t-test. Since p-
value for all HRC variables is > 0.05, it is concluded that the assumption is not failed.
Further, Mann-Whitney is a non-parametric test that is used against t-test if the sample
size is small (< 30) or if any of the assumption of t-test fails. Based on the p-value for all
HRC variables, it also leads to the same conclusion derived from the t-test.
Table 5.7 relates to sub-hypothesis 3.3, including 3.3 (a) to 3.1 (e). The
independent variable is the ABSC stocks held and the dependent variable is HRC
dimensions. Sub-hypothesis 3.3 was tested using Independent Samples T-test.
Table 5.7
Results for difference in perceptions of HRC in ABSC stock purchase decisions of NAB
shareholders and of shareholders of multiple ABSC including NAB
HRC
Variables
NAB Shares
Held
N Mean SD
Mean
Differ-
ence
T-
Value
DF = 52
P-Value
Levene
# P-
Value
DF =
(1,52)
Mann-
Whitney
P-Value
Employee
Recruitment
Yes 17 4.106 0.388
0.225 1.410 0.165 0.042 0.180 Yes With
Other Banks 37 3.881 0.601
Employee
Retention
Yes 17 4.094 0.375
0.051 0.382 0.704 0.286 0.590 Yes With
Other Banks 37 4.043 0.486
Yes 17 4.047 0.384 0.198 1.061 0.294 0.001 0.410
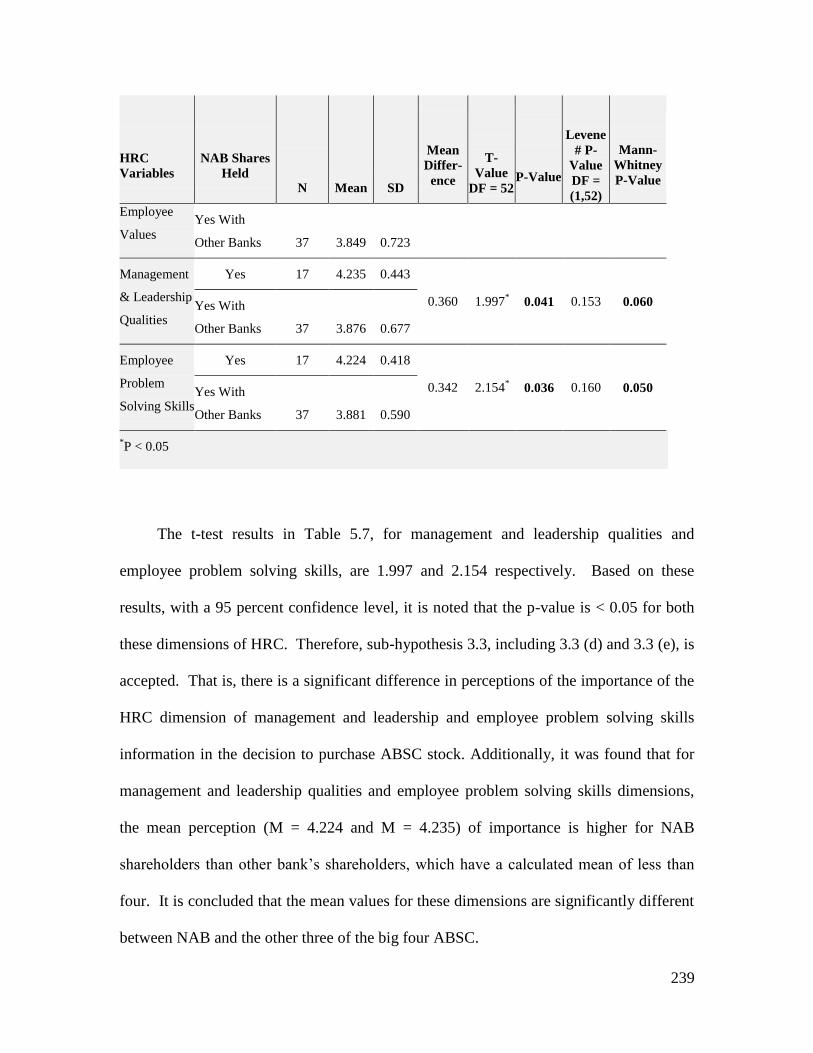
239
HRC
Variables
NAB Shares
Held
N Mean SD
Mean
Differ-
ence
T-
Value
DF = 52
P-Value
Levene
# P-
Value
DF =
(1,52)
Mann-
Whitney
P-Value
Employee
Values Yes With
Other Banks 37 3.849 0.723
Management
& Leadership
Qualities
Yes 17 4.235 0.443
0.360 1.997* 0.041 0.153 0.060 Yes With
Other Banks 37 3.876 0.677
Employee
Problem
Solving Skills
Yes 17 4.224 0.418
0.342 2.154* 0.036 0.160 0.050 Yes With
Other Banks 37 3.881 0.590
*P < 0.05
The t-test results in Table 5.7, for management and leadership qualities and
employee problem solving skills, are 1.997 and 2.154 respectively. Based on these
results, with a 95 percent confidence level, it is noted that the p-value is < 0.05 for both
these dimensions of HRC. Therefore, sub-hypothesis 3.3, including 3.3 (d) and 3.3 (e), is
accepted. That is, there is a significant difference in perceptions of the importance of the
HRC dimension of management and leadership and employee problem solving skills
information in the decision to purchase ABSC stock. Additionally, it was found that for
management and leadership qualities and employee problem solving skills dimensions,
the mean perception (M = 4.224 and M = 4.235) of importance is higher for NAB
shareholders than other bank’s shareholders, which have a calculated mean of less than
four. It is concluded that the mean values for these dimensions are significantly different
between NAB and the other three of the big four ABSC.

240
Also, the Levene test is used for testing Homogeneity of Variances assumption for
t-test. Since p-value for the HRC dimensions of management and leadership qualities
and employee problem solving skills is < 0.05, it is concluded that the assumption is not
failed. Further, Mann-Whitney is a non-parametric test that is used against t-test if the
sample size is small (< 30) or if any of the assumption of t-test fails. Based on the p-
value for all HRC variables, it also leads to the same conclusion derived from the t-test.
Furthermore, based on the results of the t-test, given that the p-value is > 0.05 in
Table 5.7 for the HRC dimensions of employee recruitment, employee retention, and
employee values, Hypothesis 3.3, including 3.3 (a) to 3.3 (c) is rejected. Therefore, it is
concluded that the perception of importance value for the HRC dimensions of employee
recruitment, employee retention, and employee values is not significantly different
between NAB and the other three of the big four ABSC.
Table 5.8 relates to sub-hypothesis 3.4, including 3.4 (a) to 3.1 (e). The
independent variable is the ABSC stocks held and the dependent variable is HRC
dimensions. Sub-hypothesis 3.4 was tested using Independent Samples T-test.
Table 5.8
Results for difference in perceptions of HRC in ABSC stock purchase decisions of ANZ
shareholders and of shareholders of multiple ABSC including ANZ
HRC
Variables
ANZ Shares
Held
N Mean SD
Mean
Differ-
ence
T-
Value
DF = 47
P-Value
Levene
# P-
Value
DF =
(1,47)
Mann-
Whitney
P-Value
Employee
Recruitment
Yes 8 3.600 0.555
-0.220 -0.926 0.359 0.721 0.280 Yes With
Other Banks 41 3.820 0.623

241
HRC
Variables
ANZ Shares
Held
N Mean SD
Mean
Differ-
ence
T-
Value
DF = 47
P-Value
Levene
# P-
Value
DF =
(1,47)
Mann-
Whitney
P-Value
Employee
Retention
Yes 8 3.550 0.463
-0.348 -1.534 0.132 0.806 0.050 Yes With
Other Banks 41 3.898 0.605
Employee
Values
Yes 8 3.550 0.798
-0.235 -0.830 0.411 0.755 0.430 Yes With
Other Banks 41 3.785 0.722
Manage-ment
& Leadership
Qualities
Yes 8 3.575 0.654
-0.201 -0.682 0.499 0.643 0.260 Yes With
Other Banks 41 3.776 0.779
Employee
Problem
Solving Skills
Yes 8 3.650 0.542
-0.170 -0.637 0.527 0.306 0.340 Yes With
Other Banks 41 3.820 0.711
With a 95 percent confidence level, it is noted that the t-test p-value is > 0.05 (refer
to Table 5.8) for all HRC dimensions, and, as such, the sub-hypothesis 3.4 (a) to 3.1 (e) is
rejected and it is concluded that the mean values for these dimensions are not
significantly different between ANZ and other three of the big four ABSC. Also, the
Levene test is used for testing Homogeneity of Variances assumption for t-test. Since p-
value for all HRC variables is > 0.05, it is concluded that the assumption is not failed.
Further, Mann-Whitney is a non-parametric test that is used against t-test if the sample
size is small (< 30) or if any of the assumption of t-test fails. Based on the p-value for all
HRC variables, it also leads to the same conclusion derived from the t-test.

242
Testing for significant differences in the perceptions of importance of RC
dimensions to the decision to purchase ABSC stocks among shareholders of only a single
bank of the big four banks and shareholders of multiple banks including, at least, one of
the big four ABSC (Hypothesis 4) was necessary to complete this research. The
information provided in the tables 5.9 through 5.12 includes results from investigations
into Hypothesis 4, including that from sub-hypotheses 4.1 (a) to (c) through to 4.4 (a) to
(c).
Table 5.9 relates to sub-hypothesis 4.1, including 4.1 (a) to 4.1 (c). The
independent variable is the ABSC stocks held and the dependent variable is RC
dimensions. Sub-hypothesis 4.1 was tested using Independent Samples T-test.
Table 5.9
Results for difference in perceptions of RC in ABSC stock purchase decisions of CBA
shareholders and of shareholders of multiple ABSC including CBA
RC
Variables
CBA Shares
Held
N Mean SD
Mean
Differ-
ence
T-
Value
DF = 67
P-
Value
Levene
# P-
Value
DF =
(1,67)
Mann-
Whitney
P-Value
Customer
Capital
Yes 27 4.096 0.539
-0.042 -0.308 0.759 0.612 0.710 Yes With
Other Banks 42 4.138 0.556
Supplier
Chain
Relations
Yes 27 4.037 0.679
0.023 0.138 0.890 0.912 0.990 Yes With
Other Banks 42 4.014 0.659
Competitors Yes 27 4.052 0.556
0.123 0.807 0.423 0.339 0.640 Yes With
Other Banks 42 3.929 0.656

243
With a 95 percent confidence level, it is noted that the t-test p-value is > 0.05 (refer
to Table 5.9) for all RC dimensions, and, as such, the sub-hypothesis 4.1 (a) to 4.1 (c) is
rejected and it is concluded that the mean values for these dimensions are not
significantly different between CBA and the other three of the big four ABSC. Also, the
Levene test is used for testing Homogeneity of Variances assumption for t-test. Since p-
value for all RC variables is > 0.05, it is concluded that the assumption is not failed.
Further, Mann-Whitney is a non-parametric test that is used against t-test if the sample
size is small (< 30) or if any of the assumption of t-test fails. Based on the p-value for all
RC variables, it also leads to the same conclusion derived from the t-test.
Table 5.10 relates to sub-hypothesis 4.2, including 4.2 (a) to 4.2 (c). The
independent variable is the ABSC stocks held and the dependent variable is RC
dimensions. Sub-hypothesis 4.2 was tested using Independent Samples T-test.
Table 5.10
Results for difference in perceptions of RC in ABSC stock purchase decisions of WBC
shareholders and of shareholders of multiple ABSC including WBC
RC
Variables
WBC Shares
Held
N Mean SD
Mean
Differ-
ence
T-
Value
DF = 24
P-Value
Levene
# P-
Value
DF = (1,
24)
Mann-
Whitney
P-Value
Customer
Capital
Yes 7 3.971 0.605
-0.144 -0.584 0.565 0.875 0.740 Yes With Other
Banks 19 4.116 0.543
Supplier
Chain
Relations
Yes 7 4.257 0.755
0.162 0.593 0.559 0.661 0.430 Yes With Other
Banks 19 4.095 0.567

244
RC
Variables
WBC Shares
Held
N Mean SD
Mean
Differ-
ence
T-
Value
DF = 24
P-Value
Levene
# P-
Value
DF = (1,
24)
Mann-
Whitney
P-Value
Competitors Yes 7 3.914 0.598
0.072 0.242 0.811 0.463 0.720 Yes With Other
Banks 19 3.842 0.698
With a 95 percent confidence level, it is noted that the t-test p-value is > 0.05 (refer
to Table 5.10) for all RC dimensions, and, as such, the sub-hypothesis 4.2 (a) to 4.2 (c) is
rejected and it is concluded that the mean values for these dimensions are not
significantly different between WBC and the other three of the big four ABSC. Also, the
Levene test is used for testing Homogeneity of Variances assumption for t-test. Since p-
value for all RC variables is > 0.05, it is concluded that the assumption is not failed.
Further, Mann-Whitney is a non-parametric test that is used against t-test if the sample
size is small (< 30) or if any of the assumption of t-test fails. Based on the p-value for all
RC variables, it also leads to the same conclusion derived from the t-test.
Table 5.11 relates to sub-hypothesis 4.3, including 4.3 (a) to 4.3 (c). The
independent variable is the ABSC stocks held and the dependent variable is RC
dimensions. Sub-hypothesis 4.3 was tested using Independent Samples T-test.

245
Table 5.11
Results for difference in perceptions of RC in ABSC stock purchase decisions of NAB
shareholders and of shareholders of multiple ABSC including NAB
RC
Variables
NAB Shares
Held
N
Mean
SD
Mean
Differ-
ence
T-
Value
DF = 52
P-
Value
Levene
# P-
Value
DF =
(1,52)
Mann-
Whitney
P-Value
Customer
Capital
Yes 17 4.459 0.262
0.264 2.230* 0.030 0.060 0.030 Yes With Other
Banks 37 4.195 0.453
Supplier
Chain
Relations
Yes 17 4.459 0.337
0.356 2.424* 0.019 0.111 0.020 Yes With Other
Banks 37 4.103 0.559
Competitors Yes 17 4.294 0.382
0.294 2.089* 0.042 0.568 0.030 Yes With Other
Banks 37 4.000 0.519
*P < 0.05
The t-test values for the RC dimensions of customer capital, supplier chain relations,
and competitors are 2.230, 2.424, and 2.089, respectively (refer to Table 5.11). Based on
these values, and with a 95 percent confidence level, it is noted that the t-test p-value is <
0.05 (0.030, 0.019, and 0.042 respectively) for all RC dimensions (refer to Table 5.11),
and, as such, the sub-hypothesis 4.3 (a) to 4.3 (c) is accepted and it is concluded that the
mean values for these dimensions are significantly different between NAB and the other
three of the big four ABSC. Also, the Levene test is used for testing Homogeneity of
Variances assumption for t-test. Since p-value for all RC variables is > 0.05, it is
concluded that the assumption is not failed. Further, Mann-Whitney is a non-parametric

246
test that is used against t-test if the sample size is small (< 30) or if any of the assumption
of t-test fails. Based on the p-value for all RC variables, it also leads to the same
conclusion derived from the t-test.
Table 5.12 relates to sub-hypothesis 4.4, including 4.4 (a) to 4.4 (c). The
independent variable is the ABSC stocks held and the dependent variable is RC
dimensions. Sub-hypothesis 4.4 was tested using Independent Samples T-test.
Table 5.12
Results for difference in perceptions of RC in ABSC stock purchase decisions of ANZ
shareholders and of shareholders of multiple ABSC including ANZ
RC Variables
ANZ Shares
Held
N
Mean
SD
Mean
Differ-
ence
T-
Value
DF = 47
P-
Value
Levene
# P-
Value
DF =
(1,47)
Mann-
Whitney
P-Value
Customer
Capital
Yes 8 3.825 0.609
-0.346 -1.634 0.109 0.623 0.110 Yes With
Other Banks 41 4.171 0.536
Supplier Chain
Relations
Yes 8 3.750 0.475
-0.367 -1.810 0.077 0.713 0.050 Yes With
Other Banks 41 4.117 0.533
Competitors Yes 8 3.800 0.466
-0.215 -0.973 0.336 0.461 0.110 Yes With
Other Banks 41 4.015 0.587
*P < 0.05
Finally, in relation to sub-hypothesis 4.4, with a 95 percent confidence level, it is
noted that the t-test p-value is > 0.05 (refer to Table 5.12) for all RC dimensions, and, as
such, the sub-hypothesis 4.4 (a) to 4.4 (c) is rejected. It is concluded that the mean values

247
for these dimensions are not significantly different between ANZ and the other three of
the big four ABSC. Also, the Levene test is used for testing Homogeneity of Variances
assumption for t-test. Since p-value for all RC variables is > 0.05, it is concluded that the
assumption is not failed. Further, Mann-Whitney is a non-parametric test that is used
against t-test if the sample size is small (< 30) or if any of the assumption of t-test fails.
Based on the p-value for all RC variables, it also leads to the same conclusion derived
from the t-test.
5.3.1.3 Relationship between shareholder perceptions and the use of HRC and
RC dimensions to purchase ABSC stocks.
Hypothesis 5 and Hypothesis 6 tested the relationship between the independent
variables of shareholder perceptions of the importance of HRC and RC dimensions to the
banking share purchase decisions and the use of information on HRC and RC dimensions
in the purchase of ABSC stocks. Data on the independent variable was extracted from
the responses to question six of the questionnaire (refer to Figure 4.4). That was the
question that presented respondents with 40 policy statements for the dimensions of HRC
and RC.
Data on the dependent variables was extracted from question one in the second part
of the questionnaire (refer to Figure 4.3). That data referred to whether respondents used
HRC and RC information to buy ABSC shares. Table 5.13 provides the total responses
for that question. The majority of respondents indicated they used HRC and RC
dimensions to buy ABSC shares. Of the respondents, 59.80 percent indicated they used
information on HRC dimensions to buy ABSC shares. Additionally, 59 percent indicated
they used information on RC dimensions to buy ABSC shares.

248
Table 5.13 Use of HRC and RC dimensions in “Buy” decisions for ABSC
Use of HRC and RC dimensions in “Buy” decisions for ABSC
Use HRC
in “BUY”
Frequency Percent Use RC in
“BUY”
Frequency Percent
NO
47.00
40.20
NO
48.00
41.00
YES 70.00 59.80 YES 69.00 59.00
TOTAL 117.00 100.00 TOTAL 117.00 100.00
Hypothesis 5 tested for a significant relationship between an individual
shareholder’s perception of the importance of HRC dimensions information and the use
of HRC dimensions information in the decision to purchase ABSC stocks. Logistic
Regression Modelling was used to test the hypothesis. This is a form of regression used
when the dependent is a dichotomy and the independent variables are of any type.
Logistic regression can predict a dependent variable on the basis of continuous and/or
categorical independents and to determine the percent of variance in the dependent
variable described by the independents; to rank the relative importance of independents;
to measure interaction effects; and to identify the impact of covariate control variables.
The impact of predictor variables is usually explained as odds ratios. Logistic regression
applies maximum likelihood estimation after transforming the dependent into a logit
variable (the natural log of the odds of the dependent occurring or not). In this way,
logistic regression estimates the odds of a certain event occurring. Table 5.14 sets out the
results of the logistic regression analysis and the results of the Wald Test, used to test the
relationship of each of the HRC dimensions on the decision to buy ABSC stock.

249
Table 5.14
Results of testing the relationship between perception and use of HRC dimensions in
ABSC stock purchase decision
Use HRC In Buy
(Yes/No) Exp (B)
Wald Test
P-Value
DF = 1
(based on
Chi-
Square
95.0% C.I.
for EXP (B)
Model Fit Chi-
Square Value
DF = 5
Model Fit P-
Value
Employee Recruitment 1.105 0.856 0.375 3.260
6.337 0.275
Employee Retention 1.942 0.282 0.580 6.497
Employee Values 1.322 0.583 0.488 3.579
Management &
Leadership Qualities 0.419 0.184 0.116 1.514
Employee Problem
Solving Skills 1.626 0.472 0.432 6.123
The Wald Test was used to test the significance of individual logistic regression
coefficients\beta (B) for each independent variable. Odds Ratio: Exp (B) is the natural
log base, e, to the exponent, B, where B = Logistic Regression Coefficient. Odds Ratio
represents the factor by which the odds change for a one-unit change in the independent
variable. An Exp (B) > 1 means the independent variable increases the odds. If Exp (B)
= 1.0, the independent variable has no effect. If Exp (B) is < 1, then the independent
variable decreases the odds.
Sub-hypothesis 5 (a) to (e) tested if there was a significant relationship between an
individual shareholder’s perception of the importance of HRC dimensions and the use of
HRC dimensions in the decision to purchase ABSC stocks. The independent variable is

250
HRC dimensions and dependent variable is the use of HRC dimension information in the
decision to purchase ABSC stocks. Logistic regression was used to model the
relationship. In this, Wald Test was used to test the relationship of each HRC dimension
on the decision to purchase ABSC stock. Table 5.14 demonstrates the results of testing
Hypothesis 5. Since p-value > 0.05 (refer to Table 5.14), the hypothesis is rejected and it
is concluded that none of the five HRC dimensions significantly impacts the decision to
purchase ABSC stocks.
Furthermore, for Hypothesis 6, the independent variables are RC dimensions and
dependent variable is the use of RC dimensions in the decision to purchase ABSC stocks.
Sub-hypotheses 6 (a) to 6 (c) tested if there was a significant relationship between an
individual shareholder’s perception of the importance of each of the three RC dimensions,
including (a) customer capital, (b) supplier chain relations, and (c) competitors, and the
use of the information in the decision to purchase ABSC stocks. Logistic regression was
used to model the relationship. In this, Wald Test was also used to test the relationship of
each of the RC dimensions on the decision to purchase ABSC stock.
Table 5.15
Results of testing the relationship between perception and use of RC dimensions in ABSC
stock purchase decision
Use RC In Buy
(Yes/No) Exp (B)
Wald Test P-
Value DF = 1
(based on Chi-
Square
95.0% C.I.
for EXP (B)
Model Fit
Chi-
Square
Value
DF = 3
Model Fit
P-Value
Customer Capital 2.801 0.100**
0.806 9.740
11.673
0.009*
Supplier Chain
Relations 0.903 0.862**
0.283 2.874

251
Use RC In Buy
(Yes/No) Exp (B)
Wald Test P-
Value DF = 1
(based on Chi-
Square
95.0% C.I.
for EXP (B)
Model Fit
Chi-
Square
Value
DF = 3
Model Fit
P-Value
Competitors 1.526 0.415**
0.553 4.215
*Since P-Value for Model Fit is < 0.05, Overall Model Fit is significant at 95% Confidence Level
**Since Wald Test P-Value is > 0.05, Hypothesis 6 is rejected for all HRC variables
It is noted that in Table 5.15, the Model Fit Chi-Square value is 11.673 (DF = 3).
As a result, p-value for Model Fit is < 0.05 for all RC dimensions and the overall Model
Fit is significant at a 95 percent confidence level. The result is indicative of the statistical
model fitting well with the observed data. However, this in itself is not indicative of an
acceptance or rejection of the hypothesis. In this instance, the Wald Test p-value based
on Chi-Square is > 0.05 (DF = 1) for all RC variables. This result is in relation to testing
for a significant positive relationship between an individual shareholder’s perception of
the importance of RC dimensions and the use of RC dimensions information in the
decision to purchase ABSC stock. Since p > 0.05 for all the RC factors (refer to Wald
Test P-Value column), this research rejects the hypothesis. The rejection of the
hypothesis, based on the Wald test p-value, results in the conclusion that perceptions
about RC dimensions do not significantly impact the decisions to use information on RC
dimensions in the purchase of ABSC stocks.

252
5.3.1.4 Relationship between importance of HRC and RC dimensions and
investment transaction decisions of shareholders.
The fourth pair of hypotheses, Hypothesis 7 and Hypothesis 8, tested for
differences in the importance given to HRC and RC dimensions among the decisions to
purchase, hold on to or sell ABSC stocks. The dependent variable is the decision on
banking stock transactions, which includes the purchase, holding on to, and selling of
ABSC stocks. The independent variable is the importance given to each of the five HRC
and to each of the three RC dimensions. Both dependent and independent variables
information was extracted from questions 3, 4, and 5 related to the investor transaction
decisions in the questionnaire (refer to Figure 4.3). Table 5.16 provides a summary of the
responses to the related questions.
Table 5.16
Importance of HRC and RC policy information and share investment transaction
decisions
In decision to hold
ABSC shares
1 2 3 1 2 3
HRC RC
Frequency of rating
Employee
recruitment process
21 59 37 Frequency of rating
Customer capital
5 65 47
Frequency of rating
Employee retention
13 63 41 Frequency of rating
Supplier chain relations
7 57 53
Frequency of rating
Employee values
13 57 47
Frequency of rating
Competitors
11 39 67
Frequency of rating
Development of
management &
leadership qualities
4 48 65
Frequency of rating
Developing
employee problem
solving skills
9 55 53

253
In decision to hold
ABSC shares
HRC RC
Frequency of rating
Employee
recruitment process
23 64 30 Frequency of rating
Customer capital
3 58 56
Frequency of rating
Employee retention
14 56 47 Frequency of rating
Supplier chain relations
11 60 46
Frequency of rating
Employee values
13 59 45
Frequency of rating
Competitors
6 44 67
Frequency of rating
Development of
management &
leadership qualities
8 53 56
Frequency of rating
Developing
employee problem
solving skills
11 56 50
In decision to sell
ABSC shares
HRC RC
Frequency of rating
Employee
recruitment process
31 57 29 Frequency of rating
Customer capital
6 55 56
Frequency of rating
Employee retention
18 57 42 Frequency of rating
Supplier chain relations
10 61 46
Frequency of rating
Employee values
16 55 46
Frequency of rating
Competitors
3 46 68
Frequency of rating
Development of
management &
leadership qualities
11 44 62
Frequency of rating
Developing
employee problem
solving skills
15 48 54
Discriminatory analysis testing was conducted on the data. The Friedman’s test, a
non-parametric test, is used in situations where the data are nominal or ordinal in
orientation. This test is used to compare observations repeated on the same subjects. This,
like many non-parametric tests, uses the ranks of the data rather than their raw values to
calculate the statistic.

254
In relation to Research Question Four, Hypothesis 7 tested the differences in the
importance given to HRC information among the decision to purchase, hold on to, or sell
ABSC stocks. Table 5.17 sets out the results of the non-parametric randomized analysis
of variance for Hypothesis 7.
Table 5.17
Results of analysis of variance for testing differences given to HRC in transaction
decisions involving ABSC stocks
Importance Given to
Employee Recruitment
(HRC)
N
Mean
Standard
Deviation
Friedman Test
Chi-Square
Value
DF = 2
Friedman Test P-
Value
Buying Banking Share 117.000 2.137 0.694
8.052* 0.018 Holding Banking Share 117.000 2.060 0.673
Selling Banking Share 117.000 1.983 0.719
* P < 0.05
Importance Given to
Employee Retention
(HRC)
N
Mean
Standard
Deviation
Friedman Test
Chi-Square Value
DF = 2
Friedman Test P-
Value
Buying Banking Share 117.000 2.239 0.639
1.660 0.436 Holding Banking Share 117.000 2.282 0.668
Selling Banking Share 117.000 2.205 0.689
Importance Given to
Employee Values
(HRC)
N Mean Standard
Deviation
Friedman Test
Chi-Square Value
DF = 2
Friedman Test P-
Value
Buying Banking Share 117.000 2.291 0.657
0.338 0.845 Holding Banking Share 117.000 2.274 0.652
Selling Banking Share 117.000 2.256 0.684

255
Importance Given to
Management &
Leadership Qualities
(HRC)
N
Mean
Standard
Deviation
Friedman Test
Chi-Square Value
DF = 2
Friedman Test P-
Value
Buying Banking Share 117.000 2.521 0.566
3.913 0.141 Holding Banking Share 117.000 2.410 0.618
Selling Banking Share 117.000 2.436 0.662
Importance Given to
Employee Problem
Solving Skills
(HRC)
N
Mean
Standard
Deviation
Friedman Test
Chi-Square Value
DF = 2
Friedman Test P-
Value
Buying Banking Share 117.000 2.376 0.626
1.633 0.442 Holding Banking Share 117.000 2.333 0.643
Selling Banking Share 117.000 2.333 0.695
Sub-hypotheses 7.1 to 7.5 tested the difference in the importance given to each of
the HRC dimensions among the decisions to (a) purchase, (b) hold on to, or (c) sell
ABSC stocks. Hypothesis 7 was tested using Friedman’s test. The independent variable
is the importance given to information on the HRC dimensions and the dependent
variable is the decision on banking stock transactions.
It is noted that the p-value in Table 5.17 is < 0.05 for sub-hypothesis 7.1, and, as
such, sub-hypothesis 7.1 is accepted and it is concluded that there is a significant
difference in the mean importance given to information on the HRC dimension of
employee recruitment among the decisions to purchase, hold on to, or sell ABSC stocks.

256
Also, the mean importance (M = 2.137) given to information on employee recruitment is
highest for the decision to purchase ABSC stocks.
However, it is also noted that in Table 5.17, the p-value is > 0.05 for sub-
hypotheses 7.2 to Hypothesis 7.5. As such, sub-hypotheses 7.2 to 7.5 are rejected and it
is concluded that there is no significant difference in mean importance given to
information about the HRC dimensions of employee retention, employee values,
management and leadership qualities, and employee problem solving skills, among the
decisions to purchase, hold on to, or sell ABSC stocks.
Also, in relation to this part of the study, Hypothesis 8 was designed to test for a
significant difference in the importance given to information about RC dimensions
among the decisions to purchase, hold on to, or sell ABSC stocks. Sub-hypotheses 8.1 to
8.3 tested whether there was a significant difference in the importance given to
information about each of the specific RC dimensions, including customer capital,
supplier chain relations, and competitors. Table 5.18 presents the results of the non-
parametric randomized analysis of variance for Hypothesis 8.
Table 5.18
Results of analysis of variance for testing differences given to RC in transaction decisions
involving ABSC stocks
Importance Given to
Customer Capital
(RC)
N
Mean
Standard
Deviation
Friedman Test
Chi-Square
Value
DF = 2
Friedman Test
P-Value
Buying Banking Share 117.000 2.359 0.564
3.982 0.137 Holding Banking Share 117.000 2.453 0.549
Selling Banking Share 117.000 2.427 0.592

257
Importance Given to
Supplier Chain Relations
(RC)
N
Mean
Standard
Deviation
Friedman Test
Chi-Square
Value
DF = 2
Friedman Test
P-Value
Buying Banking Share 117.000 2.393 0.601
2.792 0.248 Holding Banking Share 117.000 2.299 0.633
Selling Banking Share 117.000 2.308 0.622
Importance Given to
Competitors
(RC)
N
Mean
Standard
Deviation
Friedman Test
Chi-Square
Value
DF = 2
Friedman Test
P-Value
Buying Banking Share 117.000 2.479 0.664
0.810 0.667 Holding Banking Share 117.000 2.521 0.596
Selling Banking Share 117.000 2.556 0.548
It is noted that the p-value in Table 5.18 is > 0.05. As such, Hypothesis 8,
including sub-hypotheses 8.1 to 8.3, is rejected. It is concluded that there is no
significant difference in mean importance given to information on each of the RC
dimensions, including customer capital, supplier chain relations, and competitors, among
the decisions to purchase, hold on to, or sell ABSC stocks.

258
5.3.1.5 Testing for moderators on the relationship between investment
transaction decisions of shareholders and the influence of HRC and RC
dimensions.
The ASX shareholder studies (2005, 2007) identified a range of sources of share
investment advice used by individual Australian shareholders. These sources of share
investment advice include newspapers, family and friends, financial planner/advisor,
stock broker, internet, investment newsletters, accountant, work colleague, magazines,
radio, and others (not specified) (refer to Table 5.19). These sources of share investment
advice are consolidated into “media” (includes newspapers, internet, investment
newsletters, magazines, and radio), “family and friends” (includes family and friends and
work colleague) and “professional investment advisors” (includes financial
planner/advisor, stock broker, and accountant). Hypothesis 9 tested whether these
differing sources of advice, and, gender, age and education of individual shareholders as
moderators had a significant effect on the relationship between the individual
shareholder’s perceptions of the importance of HRC dimensions information and the
individual shareholder’s use of the information on HRC dimensions in ABSC stock
transactions. For this hypothesis, the independent variables are the perceptions of
importance of the HRC dimensions and the dependent variable is the use of HRC
information in ABSC stock transactions. Additionally, the moderator variables tested are
gender, age and education of individual shareholders as well as sources of share
investment advice as identified through the ASX Shareholder Study 2006 (ASX, 2007).
The descriptive data relating to the demographic profile of the respondents was extracted
from the first part of the questionnaire. The data extracted from question 2 of the

259
questionnaire is also used in testing and analysis. A summary of the information
extracted on sources of advice is provided in table 5.19.
Table 5.19
Responses of respondents ranking sources of share investment advice
In addition to the demographic data and responses from question 2 of the
questionnaire, the data relating to the perceptions of importance of shareholders of HRC
and RC dimensions was also utilized for this analysis. This was extracted from the
responses to question 6 of the questionnaire.
HRC Ranking RC Ranking
1 2 3 1 2 3
f f f f f f
Newspapers 10 74 33 Newspapers 11 67 39
Family & Friends 23 63 31 Family & Friends 23 62 32
Financial Planner / Advisor 22 56 38 Financial Planner /
Advisor
24 49 44
Stock Broker 27 61 29 Stock Broker 23 57 37
Internet 17 65 35 Internet 19 61 37
Investment Newsletters 12 68 37 Investment Newsletters 11 73 33
Accountant 28 49 40 Accountant 21 56 40
Work Colleague 30 61 26 Work Colleague 31 62 24
Magazines 35 56 26 Magazines 31 58 28
Radio 34 52 31 Radio 35 54 28
Other Source of
Advice
30 67 20 Other Source of
Advice
26 56 35

260
Hierarchical Logistic Regression (refer to Table 5.20) was used to test this
hypothesis. In this, at Stage One, the initial model was tested with the dependent and
independent variables and in Stage Two “moderator” variables were added to test if the
addition of moderator variables significantly impacts the dependent variable by testing
the significance of the Model Fit Change.
Table 5.20
Results for moderator variables on relationship between perceptions and use of HRC
dimensions information in ABSC stock transactions
Use HRC In Buy (Yes/No) Exp (B)
Wald
Test
P-Value
DF = 1
(based
on Chi-
Square)
95.0% C.I. for
EXP (B)
Model
Fit Chi-
Square
Value
Stage 1
DF = 5
Stage 2
DF = 11
Model
Fit P-
Value
Model Fit
Chi-Square
Value
Change
due to
Moderators
DF = 6
Model Fit
P-Value
Change
due to
Moderators
Stage 1 Initial Model with HRC Perception Variables
Employee Recruitment 1.105 0.856 0.375 3.260
6.337 0.275
Employee Retention 1.942 0.282 0.580 6.497
Employee Values 1.322 0.583 0.488 3.579
Management & Leadership Qualities 0.419 0.184 0.116 1.514
Employee Problem-solving Skills 1.626 0.472 0.432 6.123
Stage 2 Revised Model with HRC Perception Variables with Moderators Added
Employee Recruitment 1.398 0.330 0.446 4.380
11.779 0.380 5.442 0.489
Employee Retention 1.264 0.124 0.343 4.664
Employee Values 1.486 0.517 0.505 4.378
Management & Leadership Qualities 0.567 0.656 0.143 2.239
Employee Problem-solving Skills 1.848 0.758 0.464 7.365
Gender 1.053 0.014 0.455 2.436
Age 0.641 0.968 0.264 1.555
Education 0.410 3.453 0.160 1.050
Media 0.696 0.429 0.236 2.058
Family and Friends 0.953 0.008 0.320 2.832
Professional Advisor 0.804 0.220 0.323 2.002
Use HRC In Hold (Yes/No) Exp (B)
Wald
Test
P-Value
DF = 1
95.0% C.I. for
EXP (B)
Model
Fit Chi-
Square
Value
Model
Fit P-
Value
Model Fit
Chi-Square
Value
Change
Model Fit
P-Value
Change
due to

261
(based
on Chi-
Square)
Stage 1
DF = 5
Stage 2
DF = 11
due to
Moderators
DF = 6
Moderators
Stage 1 Initial Model with HRC Perception Variables
Recruitment 1.237 0.710 0.404 3.789
5.236 0.388
Retention 2.642 0.122 0.772 9.044
Employee Values 1.077 0.886 0.390 2.977
Management & Leadership Qualities 0.992 0.991 0.263 3.746
Employee Problem-solving Skills 0.517 0.350 0.130 2.061
Stage 2 Revised Model with HRC Perception Variables with Moderators Added
Employee Recruitment 1.342 0.628 0.407 4.424
13.422 0.267 8.187 0.225
Employee Retention 2.550 0.176 0.658 9.883
Employee Values 1.379 0.570 0.455 4.173
Management & Leadership Qualities 1.378 0.671 0.313 6.060
Employee Problem-solving Skills 0.508 0.369 0.116 2.230
Gender 1.421 0.420 0.605 3.334
Age 0.718 0.464 0.296 1.743
Education 0.984 0.975 0.374 2.592
Media 1.526 0.463 0.494 4.715
Family and Friends 0.306 0.040* 0.099 0.945
Professional Advisor 0.757 0.559 0.297 1.928
Use HRC In Sell (Yes/No) Exp (B)
Wald
Test
P-Value
DF = 1
(based
on Chi-
Square)
95.0% C.I. for
EXP (B)
Model
Fit Chi-
Square
Value
Stage 1
DF = 5
Stage 2
DF = 11
Model
Fit P-
Value
Model Fit
Chi-Square
Value
Change
due to
Moderators
DF = 6
Model Fit
P-Value
Change
due to
Moderators
Stage 1 Initial Model with HRC Perception Variables
Employee Recruitment 0.676 0.508 0.212 2.156
14.750 0.011
Employee Retention 3.524 0.061 0.941 13.191
Employee Values 2.480 0.086 0.880 6.988
Management & Leadership Qualities 0.210 0.031 0.051 0.865
Employee Problem-solving Skills 1.994 0.345 0.475 8.367
Stage 2 Revised Model with HRC Perception Variables with Moderators Added
Employee Recruitment 0.596 0.402 0.178 1.998
17.001 0.108 2.251 0.895
Employee Retention 4.136 0.050 1.000 17.102
Employee Values 2.188 0.156 0.742 6.453
Management & Leadership Qualities 0.197 0.032 0.045 0.866
Employee Problem-solving Skills 1.937 0.371 0.455 8.256
Gender 0.976 0.956 0.410 2.322
Age 0.984 0.972 0.406 2.388
Education 0.851 0.742 0.327 2.218
Media 1.721 0.356 0.543 5.455
Family and Friends 0.813 0.707 0.276 2.396
Professional Advisor 1.546 0.369 0.598 3.998

262
Sub-hypothesis 9.1 tested whether differing sources of share investment advice, as
moderators, have a significant effect on the relationship between the individual
shareholder’s perceptions of the importance of HRC information and the individual
shareholder’s use of HRC information in ABSC stock transactions. The hypothesis was
tested using Hierarchical Logistic Regression. Table 5.20 provides the results of analysis
for the hypothesis.
The results of testing demonstrated that, since p-value > 0.05 for Model Fit Change
in Stage Two of analysis, the hypothesis is rejected. As such, it is concluded that the
moderators do not significantly impact the shareholder’s use of HRC information in the
decision to purchase, hold on to, or sell ABSC stock. The only exception is the source of
advice referred to as “family and friends”. The odds ratio for “family and friends” (0.306)
means that the odds of using HRC information in holding shares is three times more than
the odds of not using HRC information, when more importance is given to family and
friends as a source of share investment advice. The data suggests that the advice sought
in this case, from “family and friends”, is three times more likely to be significant if the
shareholder is deciding to hold on to shares.
Similarly, sub-hypothesis 9.2 was designed to test whether descriptive variables of
gender, age and education of individual shareholders, as moderators, have a significant
effect on the relationship between the individual shareholder’s perceptions of the
importance of HRC information and the individual shareholder’s use of HRC information
in ABSC stock transactions. The hypothesis was tested using Hierarchical Logistic
Regression. Table 5.20 also provides the results of analysis for this sub-hypothesis.

263
At 95 percent confidence, p-value for model fit is > 0.05, and as such, overall
model fit is not significant. Also, since p-value > 0.05 for Model Fit Change in Stage
Two of analysis, Hypothesis 9, including sub-hypotheses 9.1 and 9.2, is rejected and it is
concluded that the descriptive variables of gender, age, and education of shareholders, as
moderators, do not significantly impact the shareholder’s use of HRC information in
ABSC stock transaction decisions of ABSC shareholders.
Hypothesis 10, sub-hypotheses 10.1 and 10.2, also tested whether differing sources
of advice, gender, age and education of individual shareholders as moderators have a
significant effect on the relationship between the individual shareholder’s perceptions of
the importance of RC information and the individual shareholder’s use of RC information
in ABSC stock transactions. Hypothesis 10 was tested using Hierarchical Logistic
Regression. Table 5.21 provides the results of testing for the hypothesis.
Table 5.21
Results for moderator variables on relationship between perceptions and use of RC
dimensions information in ABSC stock transactions
Use RC In Buy (Yes/No) Exp (B)
Wald
Test
P-Value
DF = 1
(based
on Chi-
Square)
95.0% C.I. for
EXP (B)
Model
Fit Chi-
Square
Value
Stage 1
DF = 3
Stage 2
DF = 9
Model
Fit P-
Value
Model Fit
Chi-Square
Value
Change
due to
Moderators
DF = 6
Model Fit
P-Value
Change
due to
Moderators
Stage 1 Initial Model with RC Perception Variables Customer Capital 2.801 0.100 0.806 9.740
11.673 0.009 Supplier Chain Relations 0.903 0.862 0.283 2.874
Competitors 1.526 0.415 0.553 4.215
Stage 2 Revised Model with RC Perception Variables with Moderators Added Customer Capital 2.841 0.107 0.799 10.098
14.719 0.099 3.046 0.803
Supplier Chain Relations 0.704 0.570 0.210 2.364
Competitors 2.190 0.171 0.712 6.731
Gender 0.792 0.600 0.332 1.891
Age 1.069 0.883 0.443 2.574

264
Education 0.737 0.521 0.290 1.874
Media 1.180 0.743 0.439 3.167
Family and Friends 1.459 0.452 0.545 3.902
Professional Advisor 0.553 0.225 0.212 1.440
Use RC In Hold (Yes/No) Exp (B)
Wald
Test
P-Value
DF = 1
(based
on Chi-
Square)
95.0% C.I. for
EXP (B)
Model
Fit Chi-
Square
Value
Stage 1
DF = 3
Stage 2
DF = 9
Model
Fit P-
Value
Model Fit
Chi-Square
Value
Change
due to
Moderators
DF = 6
Model Fit
P-Value
Change
due to
Moderators
Stage 1 Initial Model with RC Perception Variables Customer Capital 1.919 0.304 0.554 6.651
10.176 0.017 Supplier Chain Relations 0.357 0.100 0.105 1.218
Competitors 4.087 0.016 1.298 12.866
Stage 2 Revised Model with RC Perception Variables with Moderators Added Customer Capital 2.298 0.209 0.627 8.420
14.506 0.105 4.330 0.632
Supplier Chain Relations 0.331 0.098 0.089 1.227
Competitors 4.933 0.015 1.372 17.737
Gender 0.795 0.608 0.330 1.911
Age 0.675 0.379 0.281 1.622
Education 0.731 0.515 0.285 1.878
Media 1.501 0.430 0.547 4.117
Family and Friends 0.721 0.509 0.273 1.905
Professional Advisor 0.600 0.289 0.233 1.544
Use RC In Sell (Yes/No) Exp (B)
Wald
Test
P-Value
DF = 1
(based
on Chi-
Square)
95.0% C.I. for
EXP (B)
Model
Fit Chi-
Square
Value
Stage 1
DF = 3
Stage 2
DF = 9
Model
Fit P-
Value
Model Fit
Chi-Square
Value
Change
due to
Moderators
DF = 6
Model Fit
P-Value
Change
due to
Moderators
Stage 1 Initial Model with RC Perception Variables Customer Capital 2.312 0.181 0.677 7.902
7.348 0.062 Supplier Chain Relations 0.587 0.370 0.183 1.882
Competitors 2.055 0.175 0.726 5.813
Stage 2 Revised Model with RC Perception Variables with Moderators Added Customer Capital 2.020 0.271 0.577 7.064
15.430 0.080 8.082 0.232
Supplier Chain Relations 0.375 0.136 0.103 1.362
Competitors 3.366 0.057 0.966 11.727
Gender 0.506 0.140 0.205 1.251
Age 1.232 0.636 0.519 2.927
Education 0.640 0.360 0.247 1.662
Media 2.664 0.062 0.951 7.461
Family and Friends 1.030 0.952 0.391 2.714
Professional Advisor 0.778 0.592 0.310 1.953
265
Sub-hypothesis 10.1 tested whether differing sources of share investment advice, as
moderators, have a significant effect on the relationship between the individual
shareholder’s perceptions of the importance of RC information and the individual
shareholder’s use of RC information in ABSC stock transactions. Similarly, sub-
hypothesis 10.2 was tested to determine whether gender, age and education of individual
shareholders, as moderators, have a significant effect on the relationship between the
individual shareholder’s perceptions of the importance of RC information and the
individual shareholder’s use of RC information in ABSC stock transactions.
The sub-hypotheses were tested using Hierarchical Logistic Regression. Table 5.21
provides the results of testing. At Stage One, with a 95 percent confidence level, p-value
for Model Fit is < 0.05 for all RC dimensions. The overall Model Fit is statistically
significant. The result is indicative of the statistical model fitting well with the observed
data. That is, that there is a significant relationship between shareholder perceptions and
shareholder use of RC dimensions in ABSC stock purchase decisions. However, since p-
value > 0.05 for Model Fit Change in Stage Two of analysis, Hypothesis 10, including
sub-hypotheses 10.1 and 10.2, is rejected and it is concluded that the differing sources of
advice, gender, age and education of individual shareholders, as moderators, do not have
a significant effect on the relationship between the individual shareholder’s perceptions
of the importance of RC information and the individual shareholder’s use of RC
information in ABSC stock transactions.

266
5.3.2 Part Two – Disclosure on HRC and RC dimensions in corporate annual
reports and its relationship to share prices of ABSC.
The second part of the main study was designed to provide answers to two research
questions and, as a result, tested a total of four related hypotheses. Each of the four
hypotheses is made up of a number of sub-hypotheses relating to each of the relevant
variables. This section deals with the various hypotheses findings. Interpretation of
results is made to accept or reject the null hypothesis.
5.3.2.1 Comparing CBA to other ABSC in the provision of HRC and RC
dimensions information in their corporate annual reports
The objective here was to demonstrate how ABSC compared to each other in the
provision of information about their HRC and RC dimensions. In particular, the
objective was to determine if CBA, Money Magazine’s “Bank of the Year 2008”, was
significantly different compared to the other seven ABSC, in the provision of HRC and
RC information in the financial year 2006/2007 corporate annual reports. Hypothesis 11
tested specifically for a significant difference between the CBA and the other ABSC in
the provision of HRC information in their corporate annual reports. In the same way,
Hypothesis 12 tested for a significant difference between the CBA and the other ABSC in
the provision of RC information in their corporate annual reports. Data extracted from
the content analysis of the corporate annual reports of the eight ABSC for the financial
year 2006/2007 was analysed. Table 5.22 provides a summary of the perceived
frequency of reporting on HRC information in the annual reports of the eight Australian
banks by the Focus Group B.

267
Table 5.22
Summary of the percent of perceived frequency of reporting HRC dimensions information
in the corporate annual reports of the eight ABSC
Bank
Employee
Recruitment
Employee
Retention
Developing
Management
and
Leadership
Qualities
Employee
Values
Developing
Employee
Problem
solving Skills
f % f % f % f % f %
ADB 7 11.86 13 8.18 13 9.29 14 8.70 8 8.25
ANZ 7 11.86 15 9.43 11 7.86 8 4.97 7 7.22
BEN 3 5.08 17 10.69 14 10.00 18 11.18 7 7.22
BOQ 8 13.56 17 10.69 22 15.71 16 9.94 10 10.31
CBA 11 18.64 18 11.32 18 12.86 18 11.18 20 20.62
NAB 5 8.47 35 22.01 23 16.43 29 18.01 14 14.43
SGB 7 11.86 15 9.43 17 12.14 19 11.80 11 11.34
WBC 11 18.64 29 18.24 22 15.71 39 24.22 20 20.62
TOTAL 59 159 140 161 97
In relation to the reporting of HRC information, the banks were perceived to have
reported most often on the HRC dimension of employee values (f = 161). In relation to
the dimension of employee values, WBC was perceived to have disclosed the information
most often, accounting for 24.22 percent of the reported information. The ANZ was
perceived to have disclosed information on employee values least often, accounting for
only 4.97 percent of the reported information.
After that, the HRC dimension of employee retention was perceived to have been
reported 159 times. In relation to the dimension of employee retention, NAB was
perceived to have disclosed the information most often, accounting for 22.01 percent of
the reported information. The ADB was perceived to have disclosed information on

268
employee retention least often, accounting for only 8.81 percent of the reported
information.
Employee retention was followed by the development of management and
leadership qualities, perceived to have been reported 140 times. In relation to the
dimension of management and leadership qualities, NAB was perceived to have disclosed
the information most often, accounting for 16.43 percent of the reported information.
The ANZ was perceived to have disclosed information on the dimension of management
and leadership qualities least often, accounting for only 7.86 percent of the reported
information.
Developing employee problem solving skills was perceived to have been reported
97 times throughout the annual reports. In relation to the dimension of employee
problem solving skills, both CBA and WBC were perceived to have disclosed the
information most often, each accounting for 20.62 percent of the information reported.
Also, both ANZ and BEN were perceived to have disclosed the information on employee
problem solving skills least often, each accounting for only 7.22 percent of the reported
information.
Perceived to have been reported least times was the HRC dimension of employee
recruitment (f = 59). In relation to the dimension of employee recruitment, both CBA
and WBC were perceived to have disclosed the information most often, each accounting
for 18.64 percent of the information reported, and BEN was perceived to have reported
the information least often, accounting for 5.08 percent of the employee recruitment
information reported.
269
Quantitative analysis of the collected data also provided the researcher the ability to
perform content analysis and identify the frequency of use of and references to the RC
constructs in the 2006/2007 annual reports of each organization. Table 5.23 provides a
summary of the number of times companies were perceived to have reported RC
information in the annual reports of the eight Australian banks.
In relation to the reporting of RC information, the banks were perceived to have
reported most often on the RC dimension of supplier chain relations (f = 123). In relation
to the dimension of supplier chain relations, BOQ was perceived to have disclosed the
information most often, accounting for 24.39 percent of the information reported. The
ADB was perceived to have reported the information least often, accounting for 4.88
percent of the information reported about supplier chain relations.
The RC dimension of competitors was perceived to have been reported 81 times.
In relation to the dimension of competitors, BOQ was perceived to have disclosed the
information most often, accounting for 27.16 percent of the information disclosed. The
SGB was perceived to have disclosed the information least often, accounting for 1.23
percent of the information reported about the RC dimension of competitors.
Finally, the RC dimension of customer capital was perceived to have been reported
74 times. In relation to the dimension of customer capital, BOQ was perceived to have
disclosed the information most often, accounting for 27.03 percent of the information
reported. Finally, ADB was perceived to have disclosed the information least often,
accounting for 4.05 percent of the customer capital information reported.

270
Table 5.23
Summary of the percent of perceived frequency of reporting RC dimensions information
in the corporate annual reports of the eight ABSC
Bank
Customer Capital Supplier Chain
Relations Competitors
f % f % f %
ADB 3 4.05 6 4.88 7 8.64
ANZ 6 8.11 9 7.32 10 12.35
BEN 9 12.16 14 11.38 8 9.88
BOQ 20 27.03 30 24.39 22 27.16
CBA 18 24.32 24 19.51 21 25.93
NAB 4 5.41 12 9.76 2 2.47
SGB 4 5.41 8 6.50 1 1.23
WBC 13 17.57 26 21.14 17 20.99
TOTAL 74 123 81
Perceived quality of HRC and RC information referred to whether the information
was deemed to be more or less valuable to investors, by the focus group members. As
explained to, and understood by the focus group members, for the information to be
considered valuable in this case was for it to be perceived as relevant to the related HRC
and RC dimension it reports on, and, for it to be of value to the decision-making of
investors. In the content analysis of the 2006/2007 corporate annual reports, the
participants of Focus Group B, as a group, ranked, for each of the eight dimensions of
HRC and RC, the quality of the information presented relative to the quality of
information presented by each of the others of the eight banks. There were eight banks
analysed and they were ranked on a scale from one to eight. The bank considered, by the

271
respondents, to have provided information relevant to the related HRC or RC dimension
and most valuable to investors, received a ranking of one for that dimension. The bank
considered, by the respondents, to have provided information relevant to the related HRC
or RC dimension but least valuable to investors, received a ranking of 8 for that
dimension. Tables 5.24 and 5.25 present the data on how the group perceived and ranked
each of the banks relative to each other.
Table 5.24
Summary of ranking of perceived quality of reporting HRC dimensions information in the
corporate annual reports of the eight ABSC
Bank
Employee
Recruit-
ment
Employee
Retention Developing
Manage-
ment and
Leadership
Qualities
Employee
Values Developing
Employee
Problem
solving
Skills
ADB 6 7 6 7 7
ANZ 5 5 8 8 6
BEN 8 8 7 6 8
BOQ 7 6 5 5 5
CBA 1 1 2 2 1
NAB 4 3 1 3 3
SGB 3 4 3 4 4
WBC 2 2 4 1 2
In relation to the quality of reporting of HRC information, participants of Focus
Group B perceived CBA to have provided the highest quality of information related to
the dimension of employee recruitment. The CBA achieved top ranking, a ranking of

272
one, for three of the five dimensions of HRC and was ranked second out of eight for the
other two dimensions of HRC. However, BEN achieved the lowest ranking of the banks,
a ranking of eight, for three of the five HRC dimensions and was ranked sixth out of the
eight banks once and seventh out of the eight banks once for the remaining two HRC
dimensions. The CBA was also perceived to have the highest quality of disclosure of
employee retention information, while BEN again was ranked eighth out of the eight
banks. For the HRC dimension of developing management and leadership qualities,
NAB was ranked first out of the eight banks on quality of information disclosure, while
ANZ was ranked eighth out of the eight banks, perceived as having the lowest quality of
information disclosure. For the HRC dimension of employee values, WBC was ranked
first of the eight banks, perceived to have the highest quality of information disclosure,
while ANZ was ranked eighth out of eight banks, perceived as having the lowest quality
of information disclosure. Finally, while CBA was perceived to have the highest quality
of information disclosure on the HRC dimension of developing employee problem
solving skills, BEN was ranked eighth out of the eight banks, perceived as having the
lowest quality of information disclosure.
Overall, in relation to the ranking on the quality of reporting of RC information,
participants of Focus Group B perceived CBA to have provided the highest quality of
information. The CBA achieved top ranking for two of the three RC dimensions,
customer capital and supplier chain relations, and was ranked second out of the eight
banks for the remaining RC dimension, competitors. However, ADB achieved the lowest
ranking of the banks, in eighth position for two of the three RC dimensions, customer
capital and supplier chain relations. Also, in relation to perceptions of highest and lowest

273
quality of information, WBC was perceived to have the highest quality of disclosure of
the RC dimension of competitors, ranking first out of the eight banks, while SGB was
perceived as having the lowest quality, ranking eighth out of the eight banks.
Table 5.25
Summary of perceived ranking of quality of reporting RC dimensions information in the
corporate annual reports of the eight ABSC
Bank
Customer capital Supplier Chain
Relations Competitors
ADB 8 8 7
ANZ 7 6 4
BEN 4 7 5
BOQ 3 3 3
CBA 1 1 2
NAB 6 4 6
SGB 5 5 8
WBC 2 2 1
Finally, Table 5.26 presents a summary of the banks perceived to have the highest
and lowest percentage ranking on the frequency of reporting HRC and RC information,
and highest and lowest ranking on the quality of reporting HRC and RC information in
their corporate annual reports. All eight banking sector corporations reported some HRC
and RC information in their annual reports; however, the corporations varied in the
frequency and types of HRC and RC information provided in the annual reports.

274
Table 5.26
Banks perceived to have highest and lowest percentage and quality of HRC and RC
dimensions reporting in their 2006/2007 financial year corporate annual reports
Dimension
High % of
Information
Reporting
Low % of
Information
Reporting
High Quality of
Information
Reporting
Low Quality of
Information
Reporting
HRC
WBC
ANZ
CBA
BEN
RC
BOQ
ADB
CBA
ADB
The HRC and RC information under investigation in this research study was
perceived as being presented in neither a consistent nor structured manner in the reports,
either in individual reports or within the collection of reports. The information was
perceived by Focus Group B as being scattered throughout the bodies of the annual
reports. The information relating to the dimensions of HRC and RC dimensions was not
cited or referenced in a designated section.
Table 5.26 refers to highlights of the findings of the focus group. Focus Group B
perceived CBA to have provided the highest quality HRC and RC information disclosure.
Focus Group B perceived WBC to have disclosed HRC information more frequently
throughout its annual report; additional, Focus Group B found that the BOQ disclosed RC
information more frequently than all the other banks within its annual report.
Focus Group B perceived BEN to have provided the lowest quality HRC
information. They also perceived ADB to have provided the lowest quality RC
information disclosure. Focus Group B perceived ANZ to have disclosed HRC less
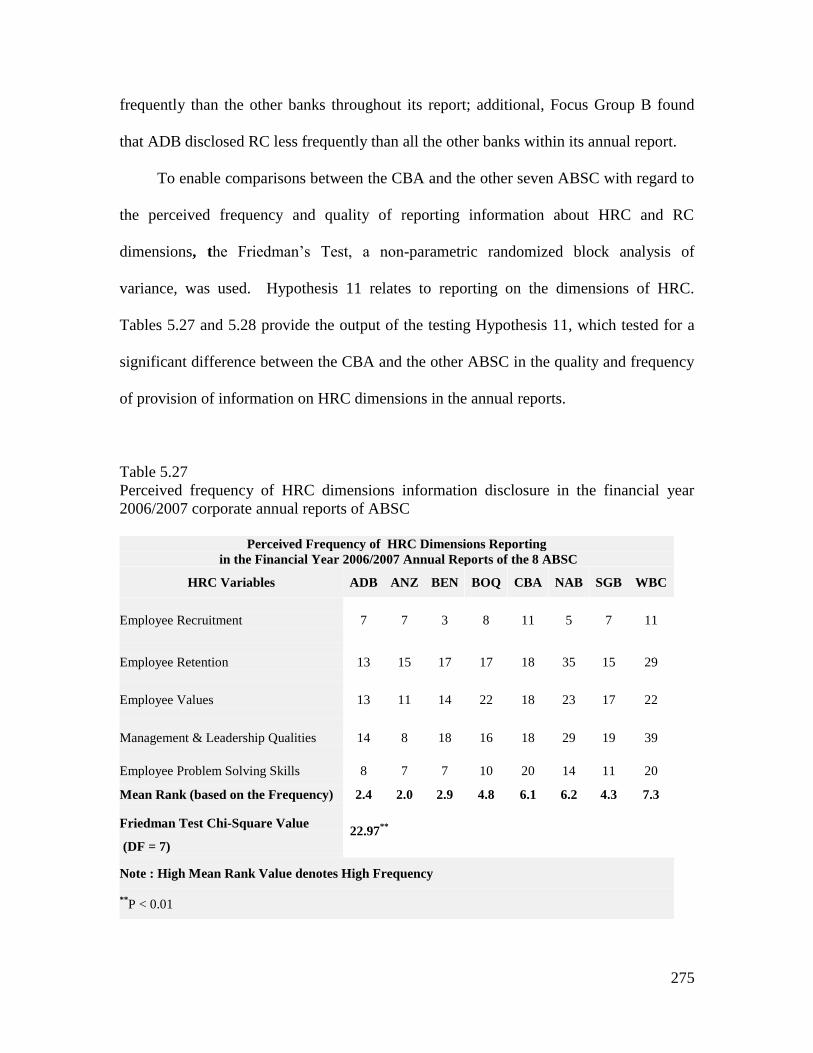
275
frequently than the other banks throughout its report; additional, Focus Group B found
that ADB disclosed RC less frequently than all the other banks within its annual report.
To enable comparisons between the CBA and the other seven ABSC with regard to
the perceived frequency and quality of reporting information about HRC and RC
dimensions, the Friedman’s Test, a non-parametric randomized block analysis of
variance, was used. Hypothesis 11 relates to reporting on the dimensions of HRC.
Tables 5.27 and 5.28 provide the output of the testing Hypothesis 11, which tested for a
significant difference between the CBA and the other ABSC in the quality and frequency
of provision of information on HRC dimensions in the annual reports.
Table 5.27
Perceived frequency of HRC dimensions information disclosure in the financial year
2006/2007 corporate annual reports of ABSC
Perceived Frequency of HRC Dimensions Reporting
in the Financial Year 2006/2007 Annual Reports of the 8 ABSC
HRC Variables ADB ANZ BEN BOQ CBA NAB SGB WBC
Employee Recruitment 7 7 3 8 11 5 7 11
Employee Retention 13 15 17 17 18 35 15 29
Employee Values 13 11 14 22 18 23 17 22
Management & Leadership Qualities 14 8 18 16 18 29 19 39
Employee Problem Solving Skills 8 7 7 10 20 14 11 20
Mean Rank (based on the Frequency) 2.4 2.0 2.9 4.8 6.1 6.2 4.3 7.3
Friedman Test Chi-Square Value
(DF = 7)
22.97**
Note : High Mean Rank Value denotes High Frequency
**P < 0.01

276
For sub-hypothesis 11.1 and 11.2, the dependent variables are frequency and
quality of HRC reporting and the independent variable is the ABSC. Hypothesis 11.1
refers to the frequency of HRC reporting. In testing sub-hypothesis 11.1 the Chi-square
value in Table 5.27 is 22.97 and it is significant (p-value is < 0.01) with a 99 percent
confidence level. Therefore, the results for Hypothesis 11.1 concluded that there is
difference in the frequency of reporting on HRC dimensions among the Australian Banks.
However, Hypothesis 11.1 is rejected because the CBA was not the bank found to have
the highest mean rank. The bank with the highest mean rank of 7.3 was WBC. This is
demonstrated in Figure 5.1. This means that the WBC, and not the CBA, reports more
number of times HRC dimensions information in the corporate annual reports. As the
research relates to the significance between being “Bank of the Year 2008” and reporting
HRC information, this research concludes that there is no significant link between the
two variables.
Figure 5.1. Comparison of ABSC based on frequency of disclosure on HRC dimensions
in corporate annual report 2006/2007
2.4 2.0
2.9
4.8
6.1 6.2
4.3
7.3
0.0
1.0
2.0
3.0
4.0
5.0
6.0
7.0
8.0
ADB ANZ BEN BOQ CBA NAB SGB WBC
Me
an
Ran
k
Bank
Comparison of Australian Banks based on Frequecny of HRC Reporting in Annual Repots High Mean Rank Value denotes High Frequency Comparison of ABSC
Based on Frequency of HRC Dimensions Information Disclosure in
Corporate Annual Report 2006/2007
(High mean rank value denotes high frequency)

277
For sub-hypothesis 11.2, the dependent variable is quality of HRC reporting and the
independent variable is the ABSC. The Chi-square value is also used to test this
hypothesis.
Table 5.28
Perceived quality of HRC information disclosure in the financial year 2006/2007
corporate annual reports
Perceived Quality of HRC Reporting
in the Financial Year 2006/2007Annual Reports of the 8 Banks
HRC Variables ADB ANZ BEN BOQ CBA NAB SGB WBC
Employee Recruitment 6 5 8 7 1 4 3 2
Employee Retention 7 5 8 6 1 3 4 2
Employee Values 6 8 7 5 2 1 3 4
Management & Leadership Qualities 7 8 6 5 2 3 4 1
Employee Problem Solving Skills 7 6 8 5 1 3 4 2
Mean Rank (based on Focus
Group Ranking) 6.6 6.4 7.4 5.6 1.4 2.8 3.6 2.2
Friedman Test Chi-Square Value
(DF = 7) 30.2
**
Note : Low Mean Rank Value denotes High Quality **
P < 0.01
In testing sub-hypothesis 11.2 the Chi-square value in Table 5.28 is 30.2 and it is
significant (p-value is < 0.01) with a 99 percent confidence level. Therefore, Hypothesis
11.2 is accepted and it is concluded that there is difference in quality of reporting on HRC
dimensions among the ABSC. Again, the CBA had the lowest mean rank of 1.4 (as low
mean denotes high quality). This is demonstrated in Figure 5.2. This result means that
the quality of reporting on HRC dimensions by the CBA is ranked as the best in focus
group ranking.

278
Figure 5.2. Comparison of ABSC based on quality of information disclosure on HRC
dimensions in corporate annual report 2006/2007
Hypothesis 12 relates to reporting on the dimensions of RC. Tables 5.29 and 5.30
provide the output of the testing Hypothesis 12, which tested for a significant difference
between the CBA and the other ABSC in the quality and frequency of provision of
information on RC dimensions in the corporate annual reports.
Table 5.29
Perceived frequency of RC dimensions information disclosure in the financial year
2006/2007 corporate annual reports of ABSC
Frequency of RC Dimensions Reporting in the Annual Reports of the 8 ABSC
RC Variables ADB ANZ BEN BOQ CBA NAB SGB WBC
Customer Capital 3 6 9 20 18 4 4 13
Supplier Chain Relations 6 9 14 30 24 12 8 26
Competitors 7 10 8 22 21 2 1 17
Mean Rank (based on the Frequency) 1.7 4.0 4.7 8.0 6.7 2.8 1.8 6.3
Friedman Test Chi-Square Value (DF = 7) 19.33**
**P < 0.01, Note : High Mean Rank Value denotes High Frequency
6.6 6.4
7.4
5.6
1.4
2.8
3.6
2.2
0.0
1.0
2.0
3.0
4.0
5.0
6.0
7.0
8.0
ADB ANZ BEN BOQ CBA NAB SGB WBC
Me
an
Ra
nk
Bank
Comparison of Australian Banks based on Quality of HRC Reporting in Annual Repots Low Mean Rank Value denotes High Quality
Comparison of ABSC
Based on Quality of HRC Dimensions Information Disclosure in
Corporate Annual Report 2006/2007
(Low mean rank value denotes high quality)

279
For sub-hypothesis 12.1 and 12.2, the dependent variables are frequency and
quality of RC reporting and the independent variable is the ABSC. Hypothesis 12.1
refers to the frequency of RC reporting. In testing sub-hypothesis 12.1 the Chi-square
value in Table 5.29 is 19.33 and it is significant (p-value is < 0.01) with a 99 percent
confidence level. Therefore, it is concluded that there is difference in the frequency of
reporting on RC dimensions among the Australian Banks. However, Hypothesis 12.1 is
rejected because the CBA was not the bank found to have the highest mean rank. The
BOQ was found to have the highest mean rank of 8.0. Yet, as the research relates to the
significance between being “Bank of the Year 2008” and reporting RC information, this
research concludes that there is no significant link between the two variables.
Figure 5.3. Comparison of ABSC based on frequency of reporting information about RC
dimensions in corporate annual report 2006/2007
Ranking on frequency of reporting RC dimensions information is also demonstrated
above in Figure 5.3. This shows more clearly that the CBA does not report more number
1.7
4.0 4.7
8.0
6.7
2.8
1.8
6.3
0.0
1.0
2.0
3.0
4.0
5.0
6.0
7.0
8.0
9.0
ADB ANZ BEN BOQ CBA NAB SGB WBC
Mean
Ran
k
Bank
Comparison of Australian Banks based on Frequecny of RC Reporting in Annual Repots High Mean Rank Value denotes High Frequency Comparison of ABSC
Based on Frequency of HRC Dimensions Information Disclosure in
Corporate Annual Report 2006/2007
(High mean rank value denotes high frequency)

280
of times RC dimensions information in the corporate annual reports, when compared to
the other seven ABSC.
As for sub-hypothesis 12.2, the dependent variable is quality of RC reporting and
the independent variable is the ABSC. Friedman’s Test and the Chi-square value is also
used to test this hypothesis. Table 5.30 sets out the results of testing.
Table 5.30
Perceived quality of RC dimensions information disclosure in the financial year
2006/2007 corporate annual reports
Quality of RC Dimensions Reporting in the Annual Reports of the 8 ABSC
RC Variables ADB ANZ BEN BOQ CBA NAB SGB WBC
Customer Capital 8 7 4 3 1 6 5 2
Supplier Chain Relations 8 6 7 3 1 4 5 2
Competitors 7 4 5 3 2 6 8 1
Mean Rank (based on Focus Group
Ranking) 7.7 5.7 5.3 3.0 1.3 5.3 6.0 1.7
Friedman Test Chi-Square Value (DF = 7) 17.67**
Note : Low Mean Rank Value denotes High Quality
**P < 0.01
For sub-hypothesis 12.2, in testing for a significant difference in quality of
reporting information on RC dimensions among the ABSC, the hypothesis was tested
using Friedman’s test. The dependent variable is quality of reporting on RC dimensions
and the independent variable is the ABSC. In testing sub-hypothesis 12.2 the Chi-square
value in Table 5.30 is 17.67 and it is significant (p-value is < 0.01) with a 95 percent

281
confidence level. Therefore, Hypothesis 12.2 is accepted and it is concluded that there is
difference in quality of reporting on HRC dimensions among the ABSC. The CBA had
the lowest mean rank of 1.3 (as low mean denotes high quality). Figure 5.4 sets out the
results of the mean rank comparisons.
Figure 5.4. Comparison of ABSC based on quality of RC information disclosure in
corporate annual report 2006/2007
The results demonstrated in Figure 5.4 means that the quality of reporting on RC
dimensions by the CBA is ranked as the best in focus group ranking. As such, indicate
there is significant difference in the quality of information disclosure on RC dimensions
among the ABSC. The hypothesis is accepted. The conclusion is that there is difference
between the quality of disclosure by the CBA, Money Magazine’s “Bank of the Year
2008”, and the other seven ABSC as ranked by the focus group.
7.7
5.7 5.3
3.0
1.3
5.3 6.0
1.7
0.0
1.0
2.0
3.0
4.0
5.0
6.0
7.0
8.0
9.0
ADB ANZ BEN BOQ CBA NAB SGB WBC
Me
an
Ran
k
Bank
Comparison of Australian Banks based on Quality of HRC Reporting in Annual Repots Low Mean Rank Value denotes High Quality Comparison of ABSC
Based on Quality of RC Dimensions Information Disclosure in
Corporate Annual Report 2006/2007
(Low mean rank value denote high quality)
282
5.3.2.2 Relationship between HRC and RC dimensions and the share prices of
ABSC.
The seventh pair of hypotheses, Hypothesis 13 and Hypothesis 14, tested whether
there was a positive relationship between the provision of information on HRC and RC
dimensions in the corporate annual reports of ABSC and the corporation’s share price.
The independent variables for both hypotheses are the frequency and the quality of
reporting on HRC and RC dimensions in the corporate annual reports of each of the
ABSC representing the sample group. Also, for both hypotheses, 13 and 14, the
dependent variable is the CAR of ABSC.
The CAR on the share price of ABSC was used to measure the change in the
market value of the ABSC. This study used the same method to determine CAR as
employed by Dumay and Tull (2007). For the event window +5 to -3 days of releasing
the annual report, the cumulative return (stock) was calculated by applying the
company’s closing share price at Day +5 and subtracting the closing share price at Day -
3. That is then divided by the closing share price at Day -3 and the total was then
converted into a percentage. Table 5.31 presents the results of the CAR analysis on the
share prices of the eight ABSC. Table 5.32 presents the results of the rankings in regards
frequency and quality of reporting information about HRC dimensions. Table 5.32 also
details the rank correlation between frequency or quality and CAR and p-value.

283
Table 5.31
CAR of ABSC stocks for event window +5 to -3 days of release of 2006/2007corporate
annual reports
CAR of ABSC Stocks
For +5 to -3 day Event Window (from highest to lowest)
SGB ANZ CBA NAB ADB BOQ BEN WBC
CAR in -3 to +5
day event window
2.70 1.96 0.90 -2.07 -2.61 -3.91 -4.64 -5.62
Table 5.32
Rank correlation between frequency and quality of reporting HRC dimensions and CAR
Bank Name Ranking based
on Frequency of
HRC Reporting
Ranking based
on Quality of
HRC Reporting
Ranking based
on CAR
Rank
Correlation
between
Frequency &
CAR and P-
Value
Rank
Correlation
between Quality
& CAR and P-
Value
ADB 7 7 5
-0.357 0.143 ANZ 8 6 2
BEN 6 8 7
BOQ 4 5 6
CBA 3 1 3
0.385 0.736 NAB 2 3 4
SGB 5 4 1
WBC 1 2 8
Note : Ranked From Highest to Lowest
Hypothesis 13 tested the relationship between the frequency and quality of the
provision of information on HRC dimensions in the corporate annual reports of ABSC
and the corporation’s share price. For sub-hypothesis 13.1, CAR analysis was used to

284
determine if there was a significant positive relationship between the frequency of
provision of HRC information in the annual reports of ABSC and the corporation’s share
price.
Further to CAR analysis, a Hypothesis Rank Correlation was computed for the
hypothesis. From the above Table 5.32, with a 95 percent confidence level, the rank
correlation was found to be -0.36. The conclusion is that this is not significant. The
hypothesis is rejected and it is concluded there is no evidence to support the relationship
between frequency of reporting on HRC dimensions and CAR. This can be evidenced by
the scatter plot presented in Figure 5.5.
876543210
8
7
6
5
4
3
2
1
0
Rank Based on CAR
Ra
nk B
ase
d o
n F
req
ue
ncy
of
HR
C R
ep
ort
ing
WBC
SGB
NAB
CBA
BOQ
BEN
ANZ
ADB
Figure 5.5. Scatter plot demonstrating the relationship between rank based on frequency
of reporting HRC dimensions and rank based on CAR

285
For sub-hypothesis 13.2, CAR analysis was carried out to determine if there was a
significant positive relationship between the quality of provision of HRC information in
the annual reports of ABSC and the corporation’s share price.
Further to CAR analysis, a Hypothesis Rank Correlation was computed for the
hypothesis. From the above Table 5.32, with a 95 percent confidence level, the rank
correlation was found to be 0.14. The conclusion is that this is not significant. Therefore,
the hypothesis is rejected and it is concluded there is no evidence to support the
relationship between quality of reporting on HRC dimensions and CAR. This can be
evidenced by the scatter plot presented in Figure 5.6.
876543210
8
7
6
5
4
3
2
1
0
Rank Based on CAR
Ra
nk B
ase
d o
n Q
ua
lity
of
HR
C R
ep
ort
ing
WBC
SGB
NAB
CBA
BOQ
BEN
ANZ
ADB
Figure 5.6. Scatter plot demonstrating the relationship between rank based on quality of
reporting HRC dimensions and rank based on CAR
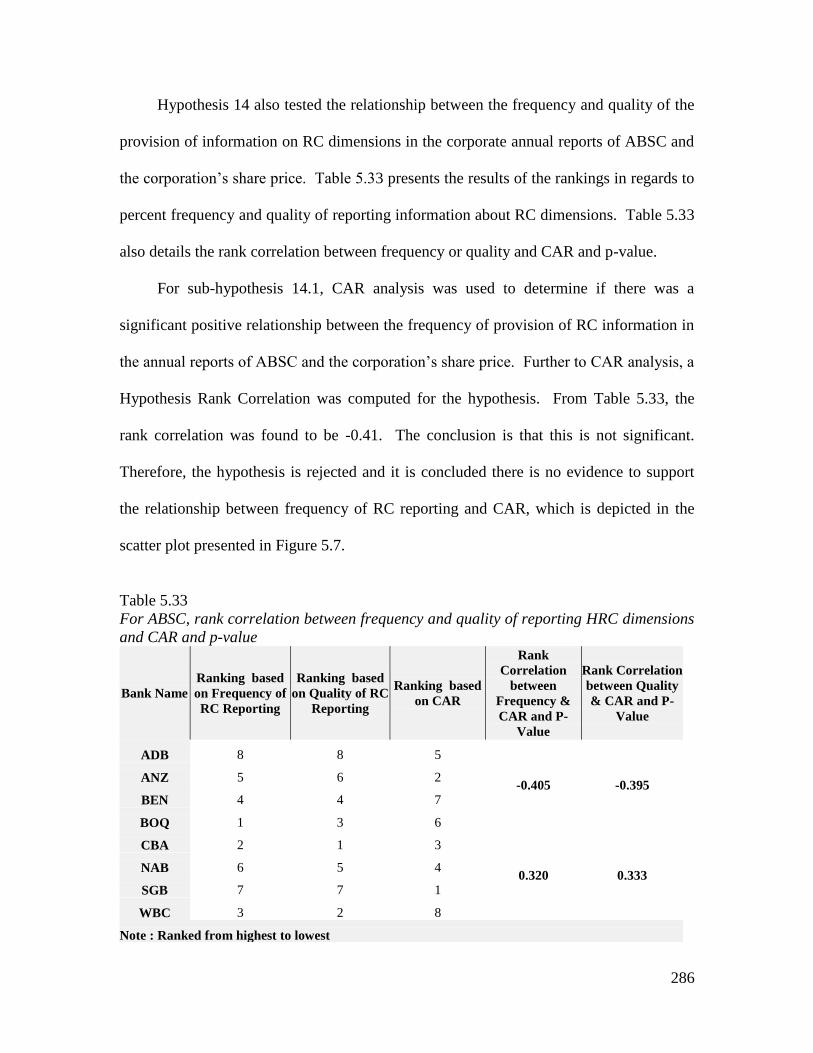
286
Hypothesis 14 also tested the relationship between the frequency and quality of the
provision of information on RC dimensions in the corporate annual reports of ABSC and
the corporation’s share price. Table 5.33 presents the results of the rankings in regards to
percent frequency and quality of reporting information about RC dimensions. Table 5.33
also details the rank correlation between frequency or quality and CAR and p-value.
For sub-hypothesis 14.1, CAR analysis was used to determine if there was a
significant positive relationship between the frequency of provision of RC information in
the annual reports of ABSC and the corporation’s share price. Further to CAR analysis, a
Hypothesis Rank Correlation was computed for the hypothesis. From Table 5.33, the
rank correlation was found to be -0.41. The conclusion is that this is not significant.
Therefore, the hypothesis is rejected and it is concluded there is no evidence to support
the relationship between frequency of RC reporting and CAR, which is depicted in the
scatter plot presented in Figure 5.7.
Table 5.33
For ABSC, rank correlation between frequency and quality of reporting HRC dimensions
and CAR and p-value
Bank Name
Ranking based
on Frequency of
RC Reporting
Ranking based
on Quality of RC
Reporting
Ranking based
on CAR
Rank
Correlation
between
Frequency &
CAR and P-
Value
Rank Correlation
between Quality
& CAR and P-
Value
ADB 8 8 5
-0.405 -0.395 ANZ 5 6 2
BEN 4 4 7
BOQ 1 3 6
CBA 2 1 3
0.320 0.333 NAB 6 5 4
SGB 7 7 1
WBC 3 2 8
Note : Ranked from highest to lowest

287
876543210
8
7
6
5
4
3
2
1
0
Rank based on CAR
Ra
nk B
ase
d o
n F
req
ue
ncy
of
RC
Re
po
rtin
g
WBC
SGB
NAB
CBA
BOQ
BEN
ANZ
ADB
Figure 5.7. Scatter plot demonstrating the relationship between rank based on frequency
of reporting RC dimensions and rank based on CAR comparison
For sub-hypothesis 14.2, CAR analysis was used to determine if there was a
significant positive relationship between the quality of provision of RC information in the
annual reports of ABSC and the corporation’s share price.
Further to CAR analysis, a Hypothesis Rank Correlation was computed for the
hypothesis. From the above Table 5.33, with a 95 percent confidence level, the rank
correlation was found to be -0.40. The conclusion is that this is not significant.
Therefore, the hypothesis is rejected and it is concluded there is no evidence to support
the relationship between quality of reporting on RC dimensions and CAR. This can be
evidenced by the scatter plot presented in Figure 5.8.

288
876543210
8
7
6
5
4
3
2
1
0
Rank Based on CAR
Ra
nk B
ase
d o
n Q
ua
lity
of
RC
Re
po
rtin
g
WBC
SGB
NAB
CBA
BOQ
BEN
ANZ
ADB
Figure 5.8. Scatter plot demonstrating the relationship between rank based on quality of
reporting RC dimensions and rank based on CAR
5.4 Summary
This research starts from the assumption that investors are unlikely to have equal
access to corporate information regarding HRC and RC dimensions and are not always
rational in their stock transaction decisions as they may be influenced by various
psychological biases (Daniel, Hirshleifer, & Subrahmanyam, 1998, 2004). The
contention is, however, that IC information, which includes information on the HRC and
RC dimensions within a corporation, is most likely considered by shareholders when
making investment decisions (Ballow et al., 2004; Bontis & Fitz-enz, 2002; Bukh, 2003;
Chen et al., 2005; Guthrie et al., 2006; Lev, 2000; Saenz, 2005). Also, with regard to the
Australian banking sector, the public, which includes individual “mum and dad”

289
investors, is often unaware of the positive HRC and RC policy initiatives the banks carry
out in an effort to grow their business, as much of the focus of the annual reports is on the
financial performance of the banks. This therefore leaves individual investors in the dark
about information on anything other than financial data. ABSC must also consider the
potential benefit to be had from improving their disclosure practices. Corporations need
to make it easier for individual shareholders and potential investors to compare the HRC
and RC policies of their corporations. This may ease the disparity between what HRC
and RC policy information professional investors have access to and what “mum and
dad” investors have access to in making their investment decisions.
The main study was undertaken in two parts. The first was to focus on the
perceptions of individual shareholders about the importance of HRC and RC dimensions
and on the impact of their perceptions share investment decisions. The second part
focused on assessing the frequency and quality of disclosure of HRC and RC dimensions
by the ABSC to determine whether disclosure led to the benefit of a net appreciation of
share price for each of the relevant ABSC.
The four aims of the research study included: (1) to conduct an investigation into
the perceptions of individual investors regarding information concerning the IC
components of HRC and RC; (2) to provide an assessment of the relationship between the
disclosure of HRC and RC and its impact on share value, as share market volatility and
share price fluctuation remain issues impacting all investors; 3) to determine if, in the
corporate annual reports of ABSC, information on HRC and RC dimensions was
provided to investors, to those seeking an understanding of the differences in how ABSC
290
report on HRC and RC dimensions; and (4) to provide an understanding of the sources of
share investment advice individual investors turn to in their investment decisions.
To realise the aims of the research, the study undertook seven key investigations.
These included: (1) An investigation into the differences in the perceptions of individual
shareholders of the importance of HRC and RC dimensions between ownership of stocks
in the different ABSC; (2) An investigation into the differences in the perceptions of
individual shareholders of the importance of HRC and RC dimensions between
ownership of stocks in only a single Australian bank and ownership of stocks in multiple
ABSC; (3) An investigation into whether individual shareholders’ perceptions of the
importance of HRC and RC dimensions relate to their decisions to purchase ABSC
stocks; (4) An investigation into whether individual shareholders perceive HRC and RC
dimensions to differ in importance for use in the purchase, holding on to, or selling of
ABSC stocks; (5) An investigation into whether, in the ABSC stock transaction decisions
of individual shareholders, the individual shareholder’s perception of the importance of
HRC and RC dimensions is moderated by information provided by differing sources of
advice and demographic variables; (6) An investigation into how the CBA, Money
Magazine’s “Bank of the Year 2008”, compares to the other banks in the provision of
HRC and RC information in the corporate annual reports; and (7) An investigation into
whether, for ABSC, there is a significant positive relationship between the provision of
information about HRC and RC dimensions in the corporate annual reports of the ABSC
and their relevant share prices.
In support of the investigations carried out, a range of statistical tests were used for
analysis. The first part of the study, relating to shareholder perceptions and behaviours,

291
included the use of ANOVA, post hoc Bonferroni test, t-test, logistic regression, and
discriminatory analysis on the data extracted from the questionnaire. The questionnaire
used was developed as a result of the initial pilot study in which the dimensions of HRC
and RC were determined and defined, and in which the items used in measuring
perception were determined and successfully tested for validity and reliability.
The second part of the study, relating to the disclosure of information about HRC
and RC dimensions, and relating to the resultant share price performance of the ABSC
investigated, included the use of a comparative analysis on the data obtained from the
content analysis and a CAR analysis on the share prices of ABSC. The eight banks
identified for this part of the study were those listed on the ASX 200 as at the end of the
2006/2007 financial year. Both their financial year 2006/2007 corporate reports, as well
as their share price movements within the relevant reporting periods were used for
analysis. This was to determine if a link could be made between disclosure on HRC and
RC dimensions and corporate share price.
By investigating the differences in the perceptions of individual shareholders of the
importance of HRC and RC dimensions between ownership of stocks in the different
ABSC, this research finds that shareholders of NAB stocks perceive all five dimensions
of HRC to be important to their decision to purchase ABSC stocks. What this research
also finds is that shareholders of NAB stocks perceive all three RC dimensions to be
important to their decision to purchase ABSC stocks; shareholders of CBA stocks
perceive all three dimensions of RC to be important to their decision to purchase ABSC
stock; and, shareholders of WBC stocks perceive the RC dimension of supplier chain
relations to be important to their decision to purchase ABSC stocks. Additionally, this

292
research concludes that the perceptions of the importance of the RC dimensions of
customer capital and supplier chain relations are significantly different between the
shareholders of the top four ABSC stocks. It is suggested that shareholders of NAB
stocks perceive information regarding the RC dimensions of customer capital and
supplier chain relations to be significantly more important to their ABSC stock purchase
decisions than shareholders of ANZ stock perceive the information to be. The research
identifies shareholders of NAB stocks to perceive information on HRC and RC
dimensions to be higher in importance, overall, than shareholders of other ABSC
perceived them to be in the decision to purchase ABSC stocks. However, the research
also concludes that the perceptions of importance of all five HRC dimensions, as well as
of the RC dimension of competitors, are not significantly different between the
shareholders of stocks in the CBA, WBC, NAB, and ANZ.
By investigating the differences in the perceptions of individual shareholders of the
importance of HRC and RC dimensions between ownership of stocks in only a single
Australian bank and ownership of stocks in multiple ABSC, the research identifies them
as insignificant except in the instance of shareholders of solely NAB stocks. NAB
shareholders perceive information about the HRC dimensions of management and
leadership qualities and employee problem solving skills to be more important when
compared to perceptions measured for shareholders of multiple ABSC including NAB.
Also, the perceptions of importance of all three RC dimensions, including customer
capital, supplier chain relations, and competitors, are significantly different for
shareholders of solely NAB shares than shareholders of multiple ABSC shares, including
NAB shares. However, the research also concludes that the perceptions of individual

293
shareholders of the importance of the HRC dimensions of employee recruitment,
employee retention, and employee values are not significantly different for shareholders
of stocks in a sole ABSC or in multiple ABSC.
By investigating if individual shareholders’ perceptions of the importance of HRC
and RC dimensions relate to their decisions to purchase ABSC stocks, the research
identifies that the relationship between an individual shareholder’s perception of the
importance of HRC and RC dimensions of a corporation and the use of the HRC and RC
dimensions in the decision to purchase ABSC stocks is not significant. Also, by
investigating if individual shareholders perceive HRC and RC dimensions to differ in
importance for use in the purchase, holding on to, or selling of ABSC stocks, the research
questionnaire reveals no significance in the perceived importance of HRC and RC
dimensions for use by purchasers, holders, or sellers of ABSC stocks. The only
exception is that the hypothesis is accepted for the HRC dimension of employee
recruitment as a significant difference in the mean importance given to information on
employee recruitment exists among the decisions to purchase, hold on to, or sell ABSC
stocks. In the decision to purchase of ABSC stocks, the HRC dimension of employee
recruitment is perceived to be of greatest importance.
In testing for moderators on the relationship between shareholder perceptions and
shareholder decisions, the research also identifies that the shareholders’ use of HRC and
RC dimensions information, in the decision to purchase, hold on to, or sell ABSC stocks,
is not significantly impacted by moderators, including sources of advice and demographic
variables. However, the only source of advice that is an exception to this is “family and
friends”. The data suggests that the advice sought from “family and friends” is three

294
times more likely to be significant, a critical contributor, if the shareholder is deciding on
whether to hold on to ABSC shares.
By investigating how CBA, Money Magazine’s “Bank of the Year 2008”,
compares to the other banks in the provision of HRC and RC information in the corporate
annual reports, this research finds that the relationship between the CBA and information
disclosure in the corporate annual reports, vis-à-vis information on HRC and RC
dimensions, is significant. The research suggests that the CBA has obtained the best
ranking in relation to the quality of reporting. As such, the hypothesis is accepted for the
quality of information disclosure in relation to HRC and RC dimensions, and is rejected
for the frequency of information disclosure in relation to both HRC and RC dimensions.
It is concluded that there is a difference between the quality of HRC and RC dimensions
information disclosure by the CBA, Money Magazine’s Bank of the Year 2008”, and the
other seven ABSC as ranked by the focus group. However, in reference to the frequency
of reporting HRC and RC dimensions information, the research finds there is a significant
difference between the ABSC, but the CBA is not perceived to report either HRC or RC
more frequently than the others. The honours go to WBC and BOQ respectively.
Therefore, the hypothesis, in relation to CBA, is rejected. As such, there is no
significance in the relationship between being Money Magazine’s “Bank of the Year
2008” and frequency of HRC and RC dimensions reporting in the corporate annual
reports.
Finally, in testing for a positive relationship between the provision of information
on HRC and RC dimensions in the corporate annual reports and the corporation’s share
price, the research reveals that there is no evidence to support the relationship between
295
frequency and quality of reporting on HRC and RC dimensions and CAR. Therefore, it is
concluded that there is no significant relationship between corporate annual report
content, vis-à-vis information about HRC and/or RC dimensions, and respective share
prices. A discussion about the results of the data analysis, arising from the investigations
carried out is provided in Chapter Six. Chapter Six also provides information on the
limitations of the research study, as well as on the recommendations, and provides
conclusions arising from the research study.

296
Chapter Six
Discussion and Conclusions
Corporations are comprised of both tangible assets and intangible assets and are
entities in their own right. Public, listed corporations, however, have a perpetual
requirement to obtain funds from investors in order to expand, explore and otherwise
continue and improve both their operation and their profitability. These investors come
from two distinct groups. The first group is corporate investors who are, often, solely
involved in making share investments and/or recommendations for share investments,
and in keeping abreast of the changes and activities in the public corporations in which
they are likely to invest. The second group is individual investors, “mum and dad”
shareholders who invest their own money in share investments. Individual investors, like
corporate investors, seek to invest in corporations that are likely to demonstrate a
satisfactory income flow and capital growth in order to make more valuable, in the future,
shares purchased today.
This research is the first, in Australia, to investigate the perceived importance of
very specific intangible assets of a public corporation and their value when assessed by
individual “mum and dad” investors in the acquisition of the stocks in ABSC. This
research focuses on the ABSC stocks and provides an investigation of the intangible HR
based assets of the eight banks listed on the ASX 200 in the financial year 2006/2007.
These specific intangible assets, as the subcomponents of IC to which they are aligned,
include HRC dimensions and RC dimensions. These dimensions are shown in Table 6.1.

297
Table 6.1
The HRC and RC dimensions of IC
HRC
RC
Employee Recruitment
Customer Capital
Employee Retention
Supplier Chain Relations
Employee Values
Competitors
Development of
Management and Leadership
Qualities
Developing Employee
Problem Solving Skills
Findings include the significance of HRC on the decisions to buy, to hold on to or
to sell ABSC stocks made by individual investors. They also include the significance of
RC on the decisions to buy, to hold on to, or to sell ABSC stocks. The findings also
include insights into the reporting of HRC and RC, in frequency and quality of reference
by ABSC in their corporate annual reports, to shareholders and the relationship to stock
price. Based on findings from this research, conclusions are drawn and the limitations of
the research are identified. Recommendations for future research to be considered are
also presented.
6.1 Discussion
Results from this research contribute findings that are important to the current
literature. First, this study adds to the body of literature on the factors that are important
to individual share purchasers of publically traded banking sector stocks in Australia. A
comprehensive review of current literature, in both the fields of HR and IC Management,
298
measurement and reporting, reveals that IC is an umbrella over intangible assets in a
corporation (Bollen et al., 2005; Bontis, 1998, 2002; Bontis & Fitz-enz, 2002; Brooking,
1996; Edvinsson & Malone, 1997; Johanson, 2005; Lynn, 1998; Sveiby, 1989, 1997). A
review of the current literature in business management, financial investments, and
behavioural economics and finance confirmed that there is limited work that analyses the
considerations included by individual shareholders in their purchase of Australian
banking shares (Alwert, Bornemann, & Will, 2009; Ax & Marton, 2008; Petty, Ricceri, &
Guthrie, 2008; Royal & O’Donnell, 2004, 2008). More specifically, there is no published
research that addresses the perceptions of individual investors with regard for only the
HRC and RC factors as reported by the corporations in their annual reports.
This research was undertaken to investigate and analyse: (1) the perceptions of
individual investors about information concerning the IC components of HRC and RC;
(2) the sources of share investment advice individual investors turn to in their investment
decisions; (3) if, in the corporate annual reports of ABSC, information on HRC and RC
dimensions is provided to investors, seeking an understanding of the differences in how
ABSC report on HRC and RC dimensions; and (4) the relationship between the
disclosure of HRC and RC and its impact on share value, as share market volatility and
share price fluctuation are issues that impact all investors.
The focus of this research is on information regarding HRC and RC dimensions.
This research builds on the previous literature which has suggested that HRC and RC, as
dimensions of IC, are both clearly identifiable subcomponents of the IC owned by a
corporation (Bollen et al., 2005; Bontis, 1998, 2002; Bontis & Fitz-enz, 2002; Brooking,
1996; Edvinsson & Malone, 1997; Johanson, 2005; Lynn, 1998; Sveiby, 1989, 1997).

299
Furthermore, published works by Abdolmohammadi (2005), Alwert, Bornemann, and
Will (2009), Ax and Marton (2008), Petty, Ricceri, and Guthrie (2008), and Royal and
O’Donnell (2004, 2008), provide a foundation on which one can begin understanding the
importance of these intangible assets in the decisions to buy, hold on to, or sell particular
stocks. However, none addresses the work performed in this research – the investigation
of the perception of those intangible assets by individual investors of Australian banking
stocks. Also within the literature, it is evidenced that all investors, corporate and
individual, make investments with the intent to grow the value of the funds invested
(ASX, 2005, 2007; Petty, Ricceri, & Guthrie, 2008). In relation to the research aims, the
answers to each of the seven questions raised in this research were determined through
the testing of multiple hypotheses. Ten of the fourteen hypotheses presented are in
relation to the importance and use of HRC and RC dimensions, while the remaining four
hypotheses are in relation to disclosure on HRC and RC dimensions in corporate annual
reports and the relationship to share prices of ABSC. In all cases, the hypotheses were
able to be investigated and analysed. Figure 6.2 sets out the relationship between the
testing of hypotheses, the research aims, and the focus of this research.

300
Hypotheses 1 to 4
Hypotheses 5 to 8
Hypotheses 9 and 10
RELATE TO:
Investigating the perceptions about
the importance of HRC and RC
dimensions in investment
transactions among shareholders of
either single or multiple ABSC
Investigating the use of HRC and RC
dimensions in investment
transactions among shareholders of
either single or multiple ABSC
Investigating the impact of sources of
advice and demographic variables on
the relationship between shareholder
perceptions and stock investment
decisions
CONTRIBUTE
FINDINGS
REGARDING:
Importance and
use of HRC
and RC
Dimensions
Hypotheses 11 and 12
Hypotheses 13 and 14
Investigating the HRC and RC
dimensions disclosure by CBA “Bank
of the Year 2008”, in comparison to
disclosure by other ABSC
Investigating whether disclosure
about HRC and RC dimensions leads
to net appreciation of share price for
each of the relevant ABSC
Disclosure on HRC
and RC dimensions
and its relationship to
corporate recognition
and to share prices of
ABSC
Figure 6.1. Relationship between hypotheses, research aims, and research focus
Put simply, this research is about gaining an understanding about whether
individual shareholders perceive HRC and RC dimensions to be important to their stock
transaction decisions, and whether they use that information in their stock transactions. It
is about gaining an understanding about whether individual shareholders’ perception and
use of HRC and RC dimensions information is moderated by other sources of advice and
demographic variables such as age, gender, education, and income. It is about gaining an
understanding about the HRC and RC dimensions information individual shareholders

301
perceive ABSC to have disclosed in the corporate annual reports; and, in light of
behavioural economic theories and behavioural finance, it is about gaining an
understanding about whether the provision of HRC and RC dimensions information does
benefit ABSC through a positive corporate recognition and/or an appreciation in their
share prices.
This discussion of the research findings is set out in five clusters, based on the
information provided in Figure 6.1. At the end of each cluster, this chapter provides a
discussion of the research findings in light of the findings of previous studies.
6.1.1 Importance and use of HRC and RC dimensions.
This research was designed to provide a further expansion of knowledge in the field
of IC management and reporting from a HRM perspective. As distinct from other
research, this research deals only with the HR components of IC, the HRC and RC
dimensions of a corporation, deals only with the perceptions of individual “mum and
dad” investors, and deals only with the shareholders of ABSC.
Hypothesis 1 to Hypothesis 4 relate to “the perceived importance of HRC and RC
dimensions to ABSC stock transactions” (refer to Figure 6.1). Hypothesis 5 to
Hypothesis 8 relate to the “use of HRC and RC dimensions information in ABSC stock
transactions” (refer to Figure 6.1). Hypothesis 9 and Hypothesis 10 relate to the
“moderation effect on the relationship between the importance of and use of HRC and
RC dimensions information” (refer to Figure 6.1).

302
6.1.1.1 The perceptions of HRC and RC dimensions in investment transactions
among shareholders of either single or multiple ABSC.
The investigation into the perceived importance of HRC and RC dimensions finds
that shareholders of NAB stocks perceive all five dimensions of HRC and all three
dimensions of RC to be important in their decisions to buy ABSC stocks. The research
also finds that shareholders of CBA stock perceive all three dimensions of RC to be of
value to their decisions to buy ABSC stock and that shareholders of WBC stocks perceive
only the RC dimension of supplier chain relations as valuable to their decisions to buy
ABSC stocks. In relation to Hypothesis 1, however, this research finds that there are no
significant differences in shareholders’ perceptions regarding any of the five HRC
dimensions, in the decision to purchase ABSC stocks, between individual shareholders of
CBA, WBC, NAB, and ANZ. Additionally, the research identifies that, in making a
decision to buy ABSC stocks, NAB shareholders tend to value HRC dimensions
information more than shareholders of the others of the big four ABSC do.
This research also finds, for Hypothesis 2, significant differences in the perceptions
of the importance of the RC dimensions of customer capital and supplier chain relations,
in the decision to purchase ABSC stocks, between individual shareholders of CBA,
WBC, NAB, and ANZ. The suggestion is that “mum and dad” shareholders of
Australia’s four biggest banks (CBA, WBC, NAB, and ANZ) have significant differences
in perceptions of the importance of RC dimensions in the decision to purchase ABSC
stock. Quite specifically, the research identifies that “mum and dad” shareholders of
NAB stocks believe information on the RC dimensions of customer capital and supplier
chain relations, to be higher in importance than shareholders of ANZ stocks believe them
303
to be to the decision to buy ABSC stocks. The research finds, however, in the decision to
buy ABSC stocks, there is no significance in the differences between “mum and dad”
shareholders’ perceptions for the RC dimension of competitors.
Expanding on the findings of the first pair of hypotheses, the second pair of
hypotheses sought to determine if there are significant differences in the perceptions of
importance of HRC and RC dimensions in the decisions to purchase ABSC stocks, of
shareholders who have ownership in only one of the big four banks, and of shareholders
who have ownership in multiple ABSC, including one of the big four banks. Findings
from Hypothesis 3 and Hypothesis 4 suggest that the differences in the perceptions of
shareholders are not significant except in the instance of only one of the big four ABSC
investigated. Results of significance relate to responses provided by shareholders of
solely NAB stocks rather than shareholders of solely one of the other three of the big four
ABSC. This research finds that “mum and dad” shareholders of solely NAB stocks
perceive selected HRC and all RC dimensions to be more important to the decision to
purchase ABSC stocks, when compared to other shareholders, of either single or multiple
ABSC stocks. The selected HRC dimensions include management and leadership
qualities and employee problem solving skills. The RC dimensions include customer
capital, supplier chain relations, and competitors. The findings of significance suggest
that, for the specified dimensions of HRC and RC, “mum and dad” shareholders with
only NAB stocks, differ in their perceptions from those shareholders who have NAB
stocks in conjunction with other ABSC stocks.
From a practical perspective, one may surmise that shareholders of solely NAB
stocks place a greater importance on HRC and RC dimensions because of either their

304
subjective values or their subjective experiences. However, the results from the
investigation conducted in this research, into the disclosure practices of ABSC (refer to
Hypothesis 11 and Hypothesis 12), suggest that NAB is neither the best ranked in terms
of quality nor in terms of frequency of reporting about their HRC and RC dimensions. In
terms of frequency, NAB is ranked second and sixth, respectively for HRC and RC
dimensions reporting, out of the eight ABSC (refer to Table 5.31). In terms of quality,
NAB is ranked third and fifth, respectively, for HRC and RC dimensions reporting, out of
the eight ABSC (refer to Table 5.32).
This infers that “mum and dad” shareholders of NAB stock, in particular,
intuitively place a higher value on the information because the information is not
perceived to be adequately available in the NAB corporate annual report. In support of
this contention, this research refers to subjectivist theories of personal good. Subjectivist
theories suggest that something is perceived to be good, or of value to an individual,
simply because it is desired by that individual and not held (Hooker, 2007). Simply
speaking, a person desires something because that person does not have it. This is
regardless of how bizarre or uncommon the desire may be. Subjectivist theories focus on
a person’s capacity to determine whether or not a specific desire may ultimately bring
fulfilment (Hooker, 2007). As such, the “mum and dad” shareholders of NAB stocks
want information on specific HRC and RC dimensions because they don’t believe they
have the information. This is supported by the finding that NAB is neither the best
ranked in terms of quality nor in terms of frequency of reporting about their HRC and RC
dimensions (refer to Hypothesis 11 and Hypothesis 12).

305
The findings of the investigation into perceptions of “mum and dad” shareholders
have the capacity to generate even more questions for future investigation. Questions
relate to developing an understanding about why shareholders of NAB stock have higher
perceptions of importance, whether they buy NAB stocks because of their beliefs, or
whether their beliefs are influenced by having NAB stocks in the first place.
Only in the case of solely NAB shareholders, are the perceptions of the importance
of information about the specific HRC dimensions (management and leadership qualities
and employee problem solving skills) and all RC dimensions higher than those measured
for shareholders of multiple ABSC including NAB. The findings infer, as a consequence,
that those “mum and dad” shareholders who have stocks in multiple ABSC, including the
NAB, place less value on the information. The suggestion is that their needs for the HRC
and RC information are being better met; if not by NAB, by the other ABSC. This
contention is supported by transfer of learning theories which assert that a person may
transfer what he or she knows about one subject to a similar subject (Haskell, 2001).
What this research suggests is that if an individual shareholder has “known” information
about other shareholdings, WBC for example, they will apply that information to NAB
stocks without “new” knowledge being gained. However, unless shareholders apply new
learning to their old learning, they are really not transferring learning. While
shareholders may think they have the information they need, their judgments, however,
are based on similarities and are largely subjective not quantifiable.
This research, therefore, surmises that “mum and dad” shareholders of solely NAB
stocks believe the specified HRC and RC dimensions to be of value for them to consider
in the decision to purchase of ABSC stocks. They believe this is the case more so than

306
shareholders of the others of the big four banks, including those who have a combination
of ABSC stocks including NAB stocks. It is suggested as a result of testing shareholder
perceptions, that the ABSC potentially stand to benefit from a clearer understanding of
why differences between perceptions occur and whether all “mum and dad” shareholders
of ABSC have the capacity to change their perceptions through improved disclosure and
shareholder education. The findings, therefore, give rise to the development of a number
of questions that may be addressed in future research.
The investigation into the perceptions of “mum and dad” shareholders has made
some significant contributions to current literature. This research is aligned to research
conducted by Alwert, Bornemann, and Will (2009), Royal and O’Donnell (2004, 2008)
and Petty, Ricceri, and Guthrie (2008), and corresponds with they have found, that
stakeholders prefer companies to be transparent and to provide information about their IC
assets. This research also supports the research conducted by Ax and Marton (2008),
which established that if managers perceived the disclosure of information about
‘practices’ to be important, they would carry out the ‘practices’ even if they didn’t report
on them. It also subscribes to the idea of providing a link between SHRM and analysis of
information on intangibles, with a particular focus on providing stakeholders with
qualitative data necessary for interpretation and analysis. In concert with their work
(Alwert, Bornemann, & Will, 2009; Ax & Marton, 2008; Petty, Ricceri, & Guthrie, 2008;
Royal & O’Donnell, 2008), this research establishes empirically that the “mum and dad”
shareholders of ABSC stocks, and of NAB stocks in particular, have positive perceptions
relating to information about specified HRC and RC dimensions.

307
A major difference here, however, is in the sampling of the studies. The previous
research (Alwert, Bornemann, & Will, 2009; Ax & Marton, 2008; Petty, Ricceri, &
Guthrie, 2008; Royal & O’Donnell, 2008) has focused on the perceptions of professional
investors, of management, and of institutional investors, whilst this research relates to a
different user group. This research focuses on collecting information relating to “mum
and dad” investors, not professional or institutional investors. This represents a
concentration on a wider group of shareholders with many variable characteristics. This
research also differs from the research by Royal and O’Donnell (2008) in that it does not
share a focus on innovation on investment. Rather, the focus of this research is on
proving empirically, how important the specified components of the HRC and RC
dimensions to shareholders of ABSC stocks with regard for their ABSC stock
transactions. This research, therefore, supports empirically the positive perception of,
and desire for information on specific components of the IC dimensions of HRC and RC
in investment transaction decisions, not only for professional analysts and institutional
investors, as others have found (Alwert, Bornemann, & Will, 2009; Ax & Marton, 2008;
Petty, Ricceri, & Guthrie, 2008; Royal & O’Donnell, 2008), but for individual “mum and
dad” investors as well.
6.1.1.2 The use of HRC and RC dimensions in investment transactions among
shareholders of either single or multiple ABSC.
In relation to third pair of hypotheses, Hypothesis 5 and Hypothesis 6, this research
sought to determine if there is a significant relationship between an individual
shareholder’s perception of importance of HRC and RC dimensions and the use of HRC
and RC dimensions in the decision to purchase ABSC stocks. This research finds that

308
while perceptions of importance of HRC and RC dimensions differ for “mum and dad”
shareholders of ABSC, “mum and dad” shareholder do perceive specific dimensions of
HRC and RC to be valuable to their ABSC stock purchase decisions (Hypothesis 1 to
Hypothesis 4). This research, however, fails to identify a statistically significant
relationship between an individual shareholder’s perception of the importance of
information about the HRC and RC dimensions of a corporation and the use of
information about HRC and RC dimensions in the decision to purchase ABSC stocks.
In relation to the fourth pair of hypotheses, Hypothesis 7 and Hypothesis 8, this
research also sought to determine if there are significant differences in the importance
attributed to HRC and RC dimensions among the decisions to purchase, hold on to, or sell
ABSC stocks. This research reveals that there are no significant differences in the
perceived importance of HRC and RC dimensions for use by purchasers, holders, or
sellers of ABSC stocks. The only exception identified is the perceived importance for the
HRC dimension of employee recruitment. The research finds that there is a significant
difference in the importance given to information on employee recruitment in the
category of the decision to buy, hold on to, or sell ABSC stocks. The importance given
to information on the HRC dimension of employee recruitment is the highest with regard
to the decision to purchase ABSC stocks. This level of importance is attributed to the
stock purchase decision when compared to the other stock transaction decisions
considered. Previously, “mum and dad” shareholders indicated that they believe
management and leadership qualities and employee problem solving skills to be
important (refer to Hypothesis 1 to Hypothesis 4). In exploring this hypothesis, however,
“mum and dad” shareholders reveal that employee recruitment information is significant

309
in their stock “purchase” decisions, rather than in their stock “hold” or “sell” decisions.
Research suggests that there is a demand for IC disclosure because corporations are
recognised as deriving their success from intangible assets – assets that include
employees recruited for their skills base (Bukh, 2003). The function of employee
recruitment, along with employee retention, is regarded by researchers as important to
shape the organizational culture, learning, routines and entrepreneurship (Lado & Wilson,
1994). This, in turn, creates organizational competencies to enable an organization to
achieve competitive advantage through a focus on innovation, cost reduction and/or
improved productivity (Lado & Wilson, 1994). Additionally, from a SHRM perspective,
the HRM functions are classified into procurement and performance management
(McNamara, 2006). Procurement is about attracting and selecting employees and
performance management is an on-going process concerned with everything else that
follows their recruitment. This research infers that, when “mum and dad” shareholders
are probed in relation to the range of stock transactions, they indicate that information
about how a corporation selects and attracts the right people is of more value to their
decision to “buy” ABSC stocks, than information on how the performance of employees
is managed.
In summing up, this research finds that, in investigating the use of HRC and RC
dimensions by “mum and dad” shareholders, the HRC dimension of employee
recruitment is of more value to “mum and dad” shareholders in their decisions to “buy”
ABSC stocks than to “hold” on to or “sell” ABSC stocks. Conversely, no other HRC or
RC dimensions are found to differ in importance in the decisions to either “buy”, “hold”
on to, or “sell” ABSC stocks.

310
Furthermore, the findings did not demonstrate the existence of a significant
relationship between an individual shareholder’s perception of the importance of HRC
and RC dimensions and an individual’s use of HRC and RC dimensions in the decision to
buy ABSC stocks. As such, “perceptions” do not equate to “actions”. Attempting to
explain the findings, this research refers to the theory of Planned Behaviour which
explains the relationship between behavioural intentions and behaviours (Ajzen, 1991,
2002). The theory assumes that behaviour is a result of a person’s behavioural intention.
It is the mix of a person’s attitude concerning the behaviour and the subjective norms, as
well as the person’s perception regarding his/her behavioural controls, the ability to carry
out the behaviour (Ajzen, 1991, 2002). As such, behavioural intention alone is not
perceived to equate to behaviour. Put simply in the context of this research, the theory of
planned behaviour suggests that if, based on their perceptions, the intention of “mum and
dad” shareholders is to purchase ABSC stocks, then they will only do so if their attitude
is positive toward the purchase of ABSC stocks, if historically they have been likely to
purchase ABSC stocks, and if they have confidence in their ability to produce a positive
outcome from their decisions to purchase ABSC stocks. The theory of planned behaviour
provides a theoretical tool to explain the rationale for why this research study did not
establish a clear link between perceptions and behaviours, or actions, of “mum and dad”
shareholders. Another reason behind the finding may also be linked to research
conducted by Caldini (2008) who suggests that there are six fundamental principles in
applying strategies to achieve influence over others. The six principles referred to
include reciprocity, commitment and consistency, social proof, authority, liking, and
scarcity. Of the six principles, the principle of “social proof” is relevant to this research

311
finding. Caldini asserts that under conditions of uncertainty or of similarity, people often
view an action as more correct in a specific situation, to the extent to which others are
observed performing it. Realistically speaking, this theory leads to the suggestion that if
“mum and dad” shareholders are unsure about where to invest and how to invest, they
will behave as others behave. They will follow the example of people who are similar to
them and accept that they are correct in doing so. Essentially, this strategy becomes a
shortcut for them to use in making stock transaction decisions and is in no way related to
their own individual perceptions about the information a corporation provides.
Finally, another reason behind the finding may also be linked to behavioural
economic theories and the field of behavioural finance which suggests that investors may
be influenced by specific psychological biases and are not always rational in their stock
transaction decisions (Daniel, Hirshleifer, & Subrahmanyam, 1998, 2004). Cognitive
biases include biased self-attribution and overconfidence and the previous research
suggests that stock investors overreact to private information and under-react to public
information signals due to their biased self-attribution and over-confidence. This
provides some insight into instances of irrational consumer decision-making and
behaviour (Daniel, Hirshleifer, & Subrahmanyam, 1998, 2004). This, therefore, helps to
explain why, while investors say the information is important, they do not use the
information in their stock transaction decisions.
Intuitively speaking, the findings of the investigation into the use of HRC and RC
dimensions by “mum and dad” shareholders may be a result of various cognitive biases
and either the negative or positive outcomes of their past stock transaction decisions.
Perhaps “mum and dad” shareholders lack the confidence to act on their perceptions

312
based on bad experiences with buying other types of stocks. Underperforming stocks and
capital loss may be factors that impact on shareholder confidence and behaviour. As
confidence is eroded, “mum and dad” shareholders may well look to others to follow in
their stock transaction decisions. Related to this finding and in support of the inference
made, previous research suggests that the experiences of the past are shown to have a
bearing on later behaviour (Ajzen, 2002; Daniel, Hirshleifer, & Subrahmanyam, 1998,
2004). Previous research also proposes that past behaviour is lessened, when the
measures of intention and behaviour are attuned (Ajzen, 2002). The impact of past
behaviour disappears when intentions are resilient and well developed, when expectations
are reasonable, and when specific plans for the execution of intentions have been work
out (Ajzen, 2002). Additionally, to overcome the influence of past experience on later
behaviour, the research suggests that simply telling someone that the past has no bearing
on present and future decisions is not enough. To succeed in moderating the relationship
between perceptions and behaviours, for example, ABSC need to convince “mum and
dad” shareholders to change their behavioural intentions by focusing on implementing
strategies that change their attitudes, their subjective norms, and their perceived
behavioural control; this may result in improving shareholder confidence and efficacy.
This cannot be determined beyond a doubt unless further, future research is carried out to
explore the impact of capital losses and gains on the relationship between the perceptions
and the use of HRC and RC dimensions information.
This thesis and the hypotheses that support the investigation into the use of HRC
and RC dimensions by “mum and dad” shareholders have been supported to some degree
in the research conducted by Abdolmohammadi (2005), Alwert, Bornemann, and Will
313
(2009), and Petty, Ricceri, and Guthrie (2008), and corresponds with they have found,
that professional and institutional stakeholders use IC information provided to them in the
annual reports to make stock transaction decisions. They also found that information-
users prefer improved corporate transparency and the provision of IC information as part
and parcel of the annual report. Abdolmohammadi found that the needs and expectations
of information users are often not met by corporations and as a result, investors
experience difficulty in analysing and comparing the information provided to them.
Aligned with his findings, this research finds that even though a shareholder may have a
positive perception of the value of HRC and RC dimensions, this does not mean they will
use the information to make stock transaction decisions, it has not been determined why
exactly, but it may be that the information is hard to analyse and interpret, just as
Abdolmohammadi suggested. As such, this research provides an extension on his
research and establishes empirically that the “mum and dad” shareholders of ABSC
stocks and of NAB stocks in particular, have positive perceptions relating to information
about specified HRC and RC dimensions, but they generally don’t use the information in
their stock transaction decisions.
A major difference here, however, is in the sample and in the sector being
investigated. Abdolmohammadi (2005) focused on information disclosed by various
corporations and sectors and this research focuses quite specifically on the Australian
banking sector. Additionally, the previous research (Abdolmohammadi, 2005; Alwert,
Bornemann, & Will, 2009; Petty, Ricceri, & Guthrie, 2008; Royal & O’Donnell, 2008)
has focused on the perceptions of professional investors, of management, and of
institutional investors, whilst this research relates to a different user group as this research

314
focuses on information relating to “mum and dad” investors, not professional or
institutional investors. Rather, the focus of this part of the research is on proving
empirically, whether shareholders have used the HRC and RC dimensions information
they determined to be important to their ABSC stock transactions. This research, while
supporting empirically the positive perception of, and desire for information on specific
components of the IC dimensions of HRC and RC in investment transaction decisions,
finds a single significant relationship, in stock transaction decisions, between perceptions
of importance and use of HRC and RC dimensions by “mum and dad” shareholders of
ABSC.
6.1.1.3 The impact of sources of advice and demographic variables on the
relationship between shareholder perceptions and stock transaction decisions
The next pair of hypotheses, Hypothesis 9 and Hypothesis 10, provides an
expansion on the findings from Hypothesis 7 and Hypothesis 8. The hypotheses sought
to determine if differing sources of advice, and demographic variables, have a significant
moderating effect on the relationship between the individual shareholder’s perceptions of
the importance of HRC and RC dimensions and the individual shareholder’s use of HRC
and RC dimensions in ABSC stock transactions. The differing sources of advice
investigated include “media”, “family and friends” and “professional investment
advisors”. The demographic variables investigated include gender, age, and level of
education of shareholders. This research finds that the relationship between the
perceptions and use of HRC and RC dimensions information, by “mum and dad”
shareholders, in the decisions to purchase, hold on to, or sell ABSC stocks, is not
significantly impacted by moderators, including sources of advice and demographic

315
variables. It is noted, however, that the only source of advice that represents an exception
to this is that to which the researcher referred as “family and friends” (this includes
friends, family, and work colleagues). This research finds that the likelihood of “mum
and dad” shareholders using information on HRC dimensions in deciding whether to hold
on to ABSC stocks is three times more than the likelihood of not using information on
HRC dimensions, when more importance is attributed to “family and friends” as a source
of share investment advice. Since “family and friends” was identified in the studies
carried out by the ASX (2005, 2007) as one of the main sources of advice on shares for
Australian shareholders, these research findings, therefore, establish empirically that
“mum and dad” shareholders turn to family members, friends, and colleagues for
investment advice when they are deciding whether to hold on to their ABSC stocks. The
research findings represents a confirmation and an extension on the information provided
by the ASX studies regarding the influence of “family and friends” in investment
transaction decisions.
This research attempts to explain the findings of the investigation into the
relationship between the perceptions and use of HRC and RC dimensions information, by
“mum and dad” shareholders from a practical perspective. The “mum and dad”
shareholders investigated in this research are similar to each other in that the relationship
between their perceptions and their use of HRC and RC is unaffected by their age,
gender, or education, and, on the most part, unaffected by sources of stock investment
advice. In considering the influences on their perceptions and stock transaction
decisions, however, this research suggests that perhaps “mum and dad” shareholders are
not influenced by these moderating variables because the impact of previous experiences
316
of the past may be stronger than the power of any other influence on behaviour (Ajzen,
2002). As previously discussed, past behaviour is only lessened, when the measures of
intention and behaviour are attuned. What this infers is that sources of advice, for
example, are not strong enough to successfully ensure that the measures of intention and
behaviour become attuned, and the impact of past behaviour still exists (Ajzen, 2002).
The influence of past experience on later behaviour is not overcome simply by telling
someone that the past has no bearing on present and future decisions. Explained simply,
it is not enough for “media”, “family and friends” and “professional investment advisors”
to tell “mum and dad” shareholders that an investment is good, bad, or without merit,
they have to successfully change their perceptions and behaviour intentions to be
successful. This inference is supported by another perspective presented for the findings
presented here, one that asserts that sources of advice need to consider the mindset of
investors generally to effect an influence on the relationship between perceptions and
behaviours of shareholders. Professional investors, for example, typically behave as
stock traders, with the mindset of making immediate gains for their clients. The “mum
and dad” investors, however, typically “invest” in corporations with the aim of growing
their long term wealth (ASX, 2007). Regardless of how valuable corporations perceive
themselves to be to investors, it is how “mum and dad” investors perceive them to be that
is important to their attempts to increase the value of their intangible corporate assets
(reflected in market-to-book value ratios) (Ulrich & Smallwood, 2011). Researchers
have found, for example, that the perceptions and expectations of external corporate
stakeholders, such as customers and investors, affect intangible assets including
employees (Ulrich & Smallwood, 2011). As such, the onus is on corporations to

317
influence the relationship between the perceptions and stock transactions of “mum and
dad” shareholders. Corporations are encouraged to develop a shared corporate mindset
that moves away from being interested in what executives say is important, to being
interested in what their customers and specifically their investors demonstrate is
important by way of their actions. A shared corporate mindset influences “mum and dad”
investors because investors are likely to already have a way of thinking that defines a
corporation generally. Furthermore, “mum and dad” shareholders are likely attracted to
corporations with positive identities and are detracted from those with negative
reputations, and may also be influenced by the extent to which employees have a shared
mindset with the corporation, how human resources share corporate identity (Ulrich &
Smallwood, 2011). Hence, rather than sources of financial advice and demographic
variables, the greatest influence on the relationship between shareholder perceptions and
stock transaction decisions of “mum and dad” shareholders may also be explained by
how well a corporation communicates a shared mindset with its stakeholders. Since
investor behaviour and the increase of value on corporate intangible assets may be
influenced by subjective investor perceptions about a corporation (Ulrich & Smallwood,
2011), this research suggests that the potential exists for a corporation to be involved in
moderating the relationship through changing the perceptions of shareholders and
prospective investors, perhaps through improved corporate communication and
shareholder education. The evolution of this concept, based on the ability of a
corporation to influence investor actions, can only happen if there is further research,
with a focus on the moderating effect of corporate mindset on the relationship between
perceptions and behaviours of “mum and dad” shareholders.

318
This research draws on and extends the ASX studies in that it utilises, in its
investigation, the list of sources of investment advice referred to in the studies. In line
with the findings of the ASX (2005, 2007), this research proves empirically that “family
and friends” is a moderator on the relationship between perceptions and actions only
when “mum and dad” shareholders decide on whether to hold on to their ABSC stocks.
However, no other variables proved to be moderators on the relationship. Additionally,
while both ASX studies provide insight into the investment choices of Australian
shareholders and highlight share investment trends, this research is different in that it
provides information into the perceptions of “mum and dad” investors, with a specific
focus on their HRC and RC information expectations and needs, on how important they
perceive the IC information provided in corporate annual reports to be to their ABSC
stock transactions. Therefore, this research extends the knowledge to better fill gaps in
the literature.
6.1.2 Disclosure on HRC and RC dimensions and its relationship to corporate
recognition and to share prices of ABSC.
Significant and extensive research has been produced that investigates and
discusses the importance of including IC among the assets inventoried and valued when
determining the net worth of an organization (Bontis, 1998, 2002; Bontis & Fitz-enz,
2002; Edvinsson & Malone, 1997; Johanson, 2005). Researchers agree that the implicit
nature of IC makes it hard to measure and report, however, they also agree that
understanding and communicating the value of IC is critical to organizational
performance (Bontis, 1998, 2002; Bontis & Fitz-enz, 2002; Edvinsson & Malone, 1997;
Johanson, 2005; Lev, 2001).

319
The review of literature highlights a deficiency of disclosure on strategically
important organizational resources and activities (Bontis, 2002; Guthrie et al., 2005;
Holland, 2000; Rimmel, 2003). It is concluded that private information not included in
the annual reports represents 25 to 50 percent of the relevant information used by fund
managers in corporate valuations. The literature also suggests that the lack of disclosure
on non-financial indicators, important for organizations within a knowledge economy, is
leading to a decline in the relevant value of the information in annual reports (Bontis,
2002; Mouritsen et al., 2004; Saenz, 2005). As such, researchers argue that the
traditional financial statements fail to provide relevant information for managers or
investors to determine how resources, many of which are intangible, create future value
and, for external stakeholder communication, additional kinds of reporting are deemed to
be required (Mouritsen et al., 2004).
Though investigated and discussed academically, the calculation of the values of
intangible assets and their inclusion in annual reports, within the Australian banking
sector, is limited, to be generous. While this research seeks to complement the work
completed by others in the fields of finance and business (Bontis, 2002; Guthrie & Petty,
2000; Guthrie, Petty, & Ricceri, 2006; Petty, Ricceri, & Guthrie, 2008; Royal and
O’Donnell, 2008), it also seeks to provide industry a broader perspective on assets
currently under-reported and, potentially, undervalued. Notably, what is missing from
prior research is information about what individual investors want, with regard to HRC
and RC disclosure within the annual reports. This research, for the first time, identifies
the perceptions of “mum and dad” investors regarding the HRC and RC information they

320
perceive to be included in the corporate annual reports of the eight ABSC under
investigation.
6.1.2.1 HRC and RC dimensions disclosure by CBA, “Bank of the Year 2008”, in
comparison to disclosure by other ABSC.
In relation to the sixth pair of hypotheses, Hypothesis 11 and Hypothesis 12, this
research sought to determine if there are significant differences between the CBA,
recognised as Money Magazine’s “Bank of the Year 2008”, and the other ABSC in the
provision of information about HRC and RC dimensions in their corporate annual reports.
This research finds that there is a significant difference in the quality of HRC and RC
dimensions information disclosure between the eight ABSC, as ranked by the focus
group. This research finds that, when investigating the relationship between the CBA and
information disclosure in the corporate annual reports, vis-à-vis information on both HRC
and RC dimensions, the CBA has obtained the best ranking in relation to the quality of
reporting. Of the eight ABSC studied, however, WBC is found to report most frequently
on the HRC dimensions and that BOQ reports most frequently on the RC dimensions.
Hence, it is surmised that disclosure of HRC and RC dimensions information is varied
between ABSC but the hypotheses are not supported; the CBA, recognised as Money
Magazine’s “Bank of the year 2008” has the best quality of disclosure rather than
quantity (frequency) of disclosure. As such, it is suggested that quantity (frequency) of
information disclosure about HRC and RC dimensions does not equate to quality of
information disclosure about HRC and RC dimensions.
This research has established that “mum and dad” shareholders of NAB stock, in
particular, intuitively place a higher value on information about specific HRC and RC

321
(Hypothesis 1 to Hypothesis 4). In testing for significant differences in HRC and RC
dimensions disclosure between ABSC, this research finds that, of the eight ABSC, NAB
is ranked second for frequency of reporting and sixth for quality of reporting on HRC and
RC dimensions (refer to Table 5.32). This research suggests that this is because the
information is not perceived to be adequately available in the NAB corporate annual
report as the results from the investigation into the disclosure practices of ABSC suggest
that NAB is neither the best ranked in terms of quality nor in terms of frequency of
reporting on their HRC and RC dimensions. In support of this contention, it is noted that
in year 2010, 250 investors of NAB stocks filed a legal action against NAB for failing to
keep the market informed, and hence, investors properly informed about problems with
“risk” exposure of investments in collateralised debt obligations (CDOs), as a result of
corporate policies and practices related to the corporations tolerance for high risk
investments (Lannin, 2010). The CDOs slumped in year 2007, in line with the Global
Financial Crisis (GFC), and failed in year 2008 (Lannin, 2010). The claimants allege that
capital losses in NAB stocks are the result of the corporation’s failure to disclose the
necessary information. Simply speaking, they believe that NAB failed its investors. The
claimants expressed their dissatisfaction with the disclosure of corporate information
regarding risk exposure, suggesting that the information failed to be accurate.
Information on the exposure to risk in this case is not of a financial loss realised (which
would be included in the financial reports), but rather, it was of the potential risk related
to corporate policies regarding its supplier base, its supplier chain relations. Claimants
expressed that investors, both professional and individual, rely on the information to
make informed decisions, and that if this was not possible, it would undermine the
322
confidence of investors (Lannin, 2010). The question that arises from this, however,
relates to whether investors would have been concerned about having the information had
they not experienced capital losses as a result. Is it only when “mum and dad” investors
experience monetary losses when they question the degree of corporate disclosure, or do
they desire the information regardless of the economic circumstances? This research
encourages future research that has the potential to investigate shareholder perceptions in
a range of economic contexts, whether a “bull” or “bear” market, in times of inflation and
in times of recession, to get a better understanding about the influence of shareholder
perceptions.
The findings, on the disclosure of HRC and RC dimensions in corporate annual
reports of the ABSC, have been illustrated through similar research studies referred to in
the current literature. Previous research by Guthrie and Petty (2000) found that
Australian firms lagged behind Scandinavian firms in reporting IC information in
corporate annual reports and found a lack of a standardized reporting model for
corporations for their intangible assets, concluding that corporate managers link IC
development with internal management practices, not as an external concern worthy of
inclusion in corporate annual reports. Bontis (2002) also studied the extent of IC
disclosures of Canadian companies in the annual reports of ten thousand Canadian
companies and found that most IC terms were disclosed only once in the annual reports.
Bontis found that IC disclosure to be very much in academic discussions and generally
ignored in corporate reporting. He concluded that the companies that voluntarily
disclosed more information were from the “new economy” and that there was no
statistically significant difference between the companies that disclosed IC information

323
and the rest of the population with regard to employee size or shareholder equity.
Guthrie, Petty, and Ricceri (2006) also found that levels of IC disclosure were low in
qualitative rather than quantitative form in both Australia and Hong Kong, and that in
every instance of IC reporting by Australian corporations, no clear attempt was made to
translate IC reporting rhetoric into benchmark measures. They called for a common
accepted framework for IC reporting to ensure corporate stakeholders get all the
information they require. Petty, Ricceri, and Guthrie (2008) also found that a sample
group of CPA members was addressing their IC information needs through private
information channels, and regarded the publicly provided information as not well suited
to their needs. They found a need exists for greater regulatory control to ensure that the
information that is being communicated privately also enters the public domain in a
timely fashion. The findings of this research support and expand on, the conclusions
made by previous researchers and confirm that information on the IC components of
HRC and RC are reported in the corporate annual reports in neither a standardised nor
prescribed manner (Bontis, 2002; Guthrie & Petty, 2000; Guthrie, Petty, & Ricceri, 2006;
Petty, Ricceri, & Guthrie, 2008; Royal & O’Donnell, 2008). The findings confirm,
empirically, that reporting about HRC and RC is varied in terms of frequency and quality
within the annual reports of ABSC. Though the CBA was perceived to have the best
quality of disclosure, it was not perceived to have the highest frequency of disclosure in
relation to HRC and RC dimensions. These findings extend the work of Royal and
O’Donnell (2008) and confirm that quality of disclosure is not linked to quantity of
disclosure for information to be of benefit; it needs to be concise, relevant, and timely.
Major differences here, however, between this research and previous research, include

324
the sample group, the corporations, and the tool used in the investigation. Previous
research has focused on research from the perspective of professional and institutional
investors (Guthrie & Petty, 2000; Guthrie, Petty, & Ricceri, 2006; Petty, Ricceri, &
Guthrie, 2008; Royal & O’Donnell, 2008), this research focuses on research from the
perspective of “mum and dad” shareholders. Previous research has focused on the annual
reports of a variety of corporations in various sectors in Australia and abroad (Bontis,
2002; Guthrie & Petty, 2000; Guthrie, Petty & Ricceri, 2006; Petty, Ricceri, & Guthrie,
2008; Royal & O’Donnell, 2008), this research focuses on the corporate annual reports of
only ABSC. Finally, rather than rely on the IC framework developed by Sveiby (1997),
as other researchers have done (Guthrie & Petty, 2000; Guthrie, Petty, & Ricceri, 2006),
this research takes a broader perspective into the investigation of HRC and RC
dimensions. This research applies the components of HRC and RC drawn from the
works of a number of researchers (Bollen et al., 2005; Bontis, 1998, 2002; Bontis & Fitz-
enz, 2002; Brooking, 1996; Edvinsson & Malone, 1997; Johanson, 2005; Lynn, 1998;
Sveiby, 1989, 1997) and focuses on the corporate annual reports of the eight ABSC.
6.1.2.2 HRC and RC dimensions and the share prices of ABSC.
In relation to the seventh pair of hypotheses, Hypothesis 13 and Hypothesis 14, the
research sought to determine if there is a significant positive relationship between the
provision of information on HRC and RC dimensions in the corporate annual reports and
the corporation’s share price. This research finds that there is no evidence to support the
significance of the relationship between frequency and quality of reporting on HRC and
RC dimensions and a cumulative abnormal return (CAR) on the share prices of the eight
specific ABSC.

325
The research finds that CBA has the best quality of information disclosure about
HRC and RC dimensions in their corporate annual report (Hypothesis 11 and Hypothesis
12). The research also finds that BOQ and WBC have the highest frequency of
disclosure about HRC and RC dimensions information (Hypothesis 11 and Hypothesis
12). However, in testing for a significant positive relationship between the provision of
information on HRC and RC dimensions in the corporate annual reports and the
corporation’s share price, the research fails to find a significant positive relationship
between the quality and frequency of disclosure and share prices of ABSC. The CBA,
BOQ, and WBC did not have a higher CAR value as a result of their disclosures.
Furthermore, even NAB, whose shareholders perceive the importance of HRC and RC
dimensions to be most important to their ABSC stock purchase decisions overall,
achieved cumulative returns on stock price within normal parameters of distribution.
This supports what is concluded for Hypotheses 5 and 6, that perceptions are not
manifested in behaviours. Although perceptions of importance of HRC and RC are
perceived to be significant, to the ABSC stock purchase decisions of “mum and dad”
shareholders, this is not reflected in shareholder behaviours; although HRC and RC
dimensions disclosure is perceived to be significantly different for CBA, in terms of
quality, it is not reflected in the CBAs share price; finally, regardless of shareholder
perceptions and behaviours, this research finds no positive abnormal returns on share
prices of any of the ABSC perceived to be the “best” in quality and frequency of
disclosure about HRC and RC dimensions.
Efficient market hypothesis (EMH) is a capital market theory that states the
investors cannot out-predict the market because the share prices of stocks include and

326
reflect all relevant information available (Malkiel, 2003; Van Bergen, 2004). It argues
that shares of listed stocks are always being traded on their fair values on stock markets.
The theory suggests it is impossible to purchase undervalued shares or to sell shares for
more than what they are worth. EMH, therefore, concludes that the only way for an
investor to make higher returns is through buying riskier stock investments. In making
bigger returns on investment, no value is attributed to the effect of shareholder
expectations derived from information that is only available to some stakeholders. The
theory assumes corporate information is available to all, equally.
There are, however, behavioural theorists that suggest that the EMH is flawed
because it does not account for psychological and behavioural components of share price
determination (Malkiel, 2003). These components may, for example, include the
“irrational exuberance” of investors and the impact of a “bandwagon effect” (Malkiel,
2003). Hence, this research is driven by ideas aligned to behavioural economic theories
and the field of behavioural finance. Behavioural economic theories recognize that
investors may not have equal access to corporate information, outside of what all
investors are made aware of in the corporate annual reports. With specific regard for
HRC and RC dimensions, it is also suggested that investors, including “mum and dad”
shareholders, are subject to various psychological and behavioural biases and are not
always rational in their stock transaction decisions (Daniel, Hirshleifer, &
Subrahmanyam, 1998, 2004). Furthermore, the researchers contend that stock investors
overreact to private information and under-react to public information signals due to their
individual biases. The research finding seems to support that theory and the suggestion
that investors do under-react to public information signals, and lends merit to the theory

327
of behavioural economics. This infers that biased self-attribution and over-confidence,
and that behavioural economics are a complement to rational economic theories by
providing insight into instances of irrational consumer decision-making and behaviour.
As this research finds no positive statistical relationship between disclosure about
HRC and RC dimensions in the corporate annual returns of ABSC and share price
appreciation for the relevant ABSC stocks, the results suggest that behavioural economic
theories are supported and serve to explain the implications of the findings in this study.
This research proposes to support the view that investors may be influenced by their
subjective psychological and behavioural biases and that they may lack the confidence to
act on public corporate information regarding HRC and RC dimensions, even despite
their perceptions about the value of such information.
Cumulative returns were found to be normal in the reporting periods investigated.
Furthermore, risk and return is homogenous for the risk-conservative Australian banking
sector. This research, as a result, suggests that while researchers and practitioners claim
that components of IC are important to improved share values, these views are not
supported through their behaviour or through the research findings. While this research
cannot conclude, definitively, the reasons for the findings, the research recognises that
investor expectations are not perceived to be influenced by IC information relating to
HRC and RC dimensions, in ABSC stock transactions. This research backs the potential
for future research to determine the influence of cognitive biases on the relationship
between the perceptions and the behaviours of “mum and dad” shareholders.
Furthermore, future research is encouraged to determine if the outcome of this research
study is able to be duplicated in different contexts, in relation to shareholders of stocks in

328
other sectors of the ASX, in other markets globally, for various cultures, and for times of
economic prosperity.
This part of the research, which investigates the relationship between corporate
disclosure on HRC and RC dimensions and the share prices of ABSC, has been similarly
researched and reported in current literature. Saenz (2005) studied four Spanish banking
sector companies, with respect to their human capital indicators, and successfully
demonstrated a positive relationship between human capital indicators and market-to-
book value (MBR), in considering a time span of one year between disclosure and MBR
assessment. As such, he surmised that a corporations IC equates to the difference
between its market and book values. He found, however, almost no relationship between
human capital indicators and banks’ efficiency and financial return. Similarly, this
research uses the output of the content analysis of the annual reports of ABSC and CAR
analysis of their share prices to assess the impact of HRC and RC disclosure on share
prices. This research provides empirical evidence to support and extend the findings of
Saenz; this research finds no significance in the relationship between HRC and RC
dimensions disclosure and share price appreciation. Saenz’ research and this research use
various correlation tests to investigate, empirically, the hypotheses presented. A
difference between this research and that of Saenz’ is that Saenz studied a smaller sample
of banks within the Spanish market and a time lag of one year between disclosure and
reaction. This research is unique in that it offers insight into twice as many banks within
the context of the Australian market place, and insight into the more immediate reactions
within the market. The findings from this research are contrary, however, to the findings
of other researchers who suggest that information on intellectual assets, that is provided

329
to investors, has a positive effect on company performance (Brookings Institution, 2004;
Chen et al., 2005; Daum, 2002; Lev, 2001), that there is a generally accepted association
between disclosure of IC elements and the CAR of a company’s share price
(Abdolmohammadi, 2005; Desai, 2000; Dumay & Tull, 2007).
Other researchers (Abdolmohammadi, 2005; Desai, 2000; Dumay & Tull, 2007)
conducted similar research but did not focus on banking sector stocks and did not focus
only on information extracted from the corporate annual reports. While this research uses
similar methods to test hypotheses (content analysis and CAR analysis), the results are
different, as are the corporations investigated. Dumay and Tull (2007), for example,
investigated the impact of IC announcements on the relevant share prices of a variety of
Australian corporations. Stock price changes were measured and the CAR for each stock
and each announcement was analysed by its comparison to the different market indices.
The company shares chosen for analysis, were based on the ASX20 and ASX200,
representing the top 20 and top 200 stocks, respectively, with regard to market
capitalization in Australia. Dumay and Tull were able to conclude that price-sensitive
disclosures to the market containing IC elements have a marginal effect on subsequent
market valuation of an organization beyond conventional financial reports and external
intellectual capital reports. Their research contends that companies should examine how
they manage and report on their IC, as, in doing so, both performance and competitive
benefits may be realized. The evidence supports the view their stakeholders respond
favourably to regular IC disclosures. Unlike Dumay and Tull, the focus of this research
is purely on ABSC, on their HRC and RC disclosure within their corporate annual
reports, and on the share price behaviour for the event window +5 to -3 days of the

330
corporate reporting period. The results are aligned to and support the findings of Saenz
(2005) in that they suggest no significant relationship between information disclosure and
CAR on share price (financial performance of company stocks). This research and
research conducted by Saenz fail to provide the empirical evidence to link IC disclosure
in the corporate annual reports of banking sector corporations and share price
performance of these specific stocks.
6.2 Limitations
There are a number of limitations that should be considered in the review of this
research. The first limitation is that the research was undertaken on the eve of the
slowing world economy and global financial crisis (GFC), recognised as one of the most
significant financial disasters experienced internationally (CIA, 2010). A second
limitation is that the research was performed during an Australian federal government
changeover, moving from a strong, long-term Liberal powerhouse to a new and relatively
inexperienced Labour government. Finally, a third limitation is that the sample size may
be considered smaller-than-desired by researchers; however, with participants (N = 117),
the participation rate was 53 percent, a value acknowledged as being statistically viable
for the drawings of conclusions (Rubio et al., 2001).
These limitations, however, do not diminish the value of this research. This
research was completed and confirms that information on HRC and RC dimensions, in
fact, does have some perceived value to buyers of ABSC stocks in the Australian market.
Additionally, this research provides a focus on the CBA as Money Magazine’s “Bank of
the Year 2008”. The celebrated Money Magazine awards are judged by a team of experts
who assess thousands of products provided by banks, building societies and credit unions

331
across Australia (Commonwealth Bank of Australia, 2010). This research reveals that the
CBA, as well as being Money Magazine’s “Bank of the Year 2008”, also provides
prospective shareholders with the best quality data to inform them as to the value of the
HRC and RC assets held by the bank, within the corporate annual report. This research is
focused specifically on “mum and dad” shareholders, specifically on HRC and RC
components of IC, and specifically on transactions relating to ABSC. The strict nature of
this research may be regarded as a limitation in itself, however, the precise focus of the
research adds value to the detailed investigation of an important, under-explored section
of the stock market; this, therefore, represents an opportunity to future researchers rather
than a limitation on this current research.
6.3 Practical Implications
Individual “mum and dad” investors, SHRM practitioners and academics, ABSC,
and government legislators are all well-placed to benefit from the results of this research.
This research contributes insight into the perceptions of individual investors regarding the
disclosure of SHRM policy information, information relating to the HRC and RC
dimensions of ABSC. The benefit to the field of SHRM is apparent in the building on
current knowledge, adding to what is known, especially about what is being practiced and
what is desired in both a theoretical and commercial context.
This research has successfully identified the key information disclosure
requirements of investors by providing insight into their perceptions and behaviours.
This is beneficial to “mum and dad” investors because it places the onus on publicly
listed corporations, and quite specifically ABSC, to make the desired HRC and RC
dimensions information known to meet the specific needs of their current and prospective

332
investors. In raising awareness of the information needs of individual investors, this
research offers new insight into whether shareholders of Australia’s four biggest banks,
have significant differences in perception of the importance of the HRC and RC
information in deciding to purchase ABSC stocks. The research also identifies the
significance of differences in perceptions of importance of the HRC and RC dimensions
in the ABSC stock transaction decisions of shareholders who have ownership in only a
single bank (of the big four banks) and of shareholders who have ownership in multiple
banks (including one of the big four banks). Before this research was performed, there
was a gap in the research in terms of having an understanding about the perceptions of
individual “mum and dad” investors.
This research provides the identification of significant positive perceptions of
“mum and dad” shareholders in relation to the importance of specific HRC and RC
dimensions information to their decisions to purchase ABSC stocks. Determining the
HRC and RC dimensions information “mum and dad” shareholders find important in
their investment decisions, with specific regard to stocks in ABSC, is research that has
not been previously conducted. This study provides insight into whether individual
shareholders perceive HRC and RC information to differ in importance for the use in the
purchase, holding on to, or selling ABSC stocks. This represents an expansion on
previous research, of benefit to academia in its contribution to the knowledge base in the
field of SHRM and IC measurement, management, and reporting. This research has also
made, based on its findings, various recommendations for future research to further
expand the literature and knowledge base.

333
The eight ABSC investigated were assessed in relation to the provision of HRC and
RC dimensions information in their corporate annual reports by reporting on the
perceived frequency and quality of the information provided. The relationship between
HRC and RC dimensions disclosure and share price was also tested. The data provides
ABSC with a better understanding of the gap between the information they disclose and
the information investors desire to have prior to making ABSC stock purchase decisions.
For ABSC, this is beneficial as it represents the potential for an improvement in their
capacity to use the information on HRC and RC dimensions, not only to manage, but also
to communicate the value of a company to potential and current individual stakeholders.
ABSC may use the information to develop campaigns, information packs, and channels
of communication to make investors aware of what they are doing in the realm of the
HRC and RC policy.
Past research finds that public legislation in Australia, as in most countries, does
not mandate the disclosure of IC information, including information relating to HRC and
RC, in corporate annual reports, leading to deficiencies of disclosure on strategically
important organizational assets (Guthrie, Boedker, & Cuganesan, 2005). This research
contributes findings, based on empirical evidence, which may be useful to government
legislators to set guidelines for the disclosure of HRC and RC dimensions information
necessary to the share investment decisions of “mum and dad” shareholders. Providing a
level playing field for all investors is, in itself, a challenge for business and government.
However, legislation may be able to direct corporate reporting guidelines. Future
research may be performed to identify a range of HRC and RC dimensions important to
considering stock purchase of a range of knowledge-based industries, not just ABSC.

334
Such research may also provide the basis for improved legislation regarding HRC and RC
information disclosure.
This research is significant in that it establishes the level of importance of HRC and
RC dimensions to “mum and dad” shareholders of ABSC. This research provides
academics, and corporations alike, information, based on empirical investigation, about
the perceived value of their intangible HRC and RC assets when communicating with
both current and prospective shareholders. This research encourages continued research
to further expand on its findings and inspire critical thinking about how a range of
information users and corporate stakeholders may benefit from the research. Of potential
interest to contemporary researchers may be the potential to further investigate the
perceptions of “mum and dad” shareholders, regarding HRC and RC dimensions, in light
of behavioural economic theories and with a focus on the application of philosophies
linked to the field of behavioural finance. Notably, what may be concluded from this
research is that the most important contribution this research makes to the literature, to
academia, and to the industry is that there has been a starting point established from
which public corporations can move to improve their communication about the real value
of their corporations to current and prospective “mum and dad” shareholders.
6.4 Recommendations for Future Research
Recommendations for future research are based on discoveries from both the pilot
study and the main study performed in this research. They are included with the proviso
that businesses that can benefit from future research about HRC and RC dimensions and
their value to an organization; an organization may also benefit from showcasing those
assets and establishing and communicating those financial values in the marketplace.

335
The investigation into the differences between shareholder perceptions of
importance of HRC and RC dimensions resulted in an important recommendation for
future research. The findings support the idea of developing of a number of questions
that may be addressed in future research. These questions relate to, among other things,
understanding why shareholders of solely NAB stocks attribute greater value to HRC and
RC information in their stock investment decisions, whether they buy only NAB stocks
because of their beliefs, or whether their beliefs are influenced by having only NAB
stocks in the first place. The research findings suggest that “mum and dad” shareholders
of NAB stock, in particular, intuitively place a higher value on the information because
the information is not perceived to be adequately available in the NAB corporate annual
report (refer to Hypothesis 11 and Hypothesis 12). Again, the suggestion is that the HRC
and RC information requirements of NAB shareholders are not sufficiently met. Future
research is encouraged to investigate, not only “what”, but also “why” the differences in
shareholder perceptions occur and whether “mum and dad” shareholders of ABSC have
the capacity to change their perceptions through improvements in corporate disclosure
and greater shareholder education.
The investigation into shareholder use of HRC and RC dimensions in stock
transactions also resulted in three specific recommendations for future research. The first
was to encourage the investigation into the impact of experiences of capital losses and
capital gains on the relationship between the perceptions of importance and use of HRC
and RC dimensions in stock transactions. The second was to investigate the moderating
influence of shareholder confidence on the relationship between the perceptions of
importance and use of HRC and RC dimensions in stock transactions. The third

336
recommendation was for an investigation into the perceptions of importance “mum and
dad” shareholders with regard to HRC and RC dimensions in the decision to purchase a
portfolio of stocks, not just ABSC stocks.
The investigation into the moderating influence of sources of stock investment
advice and demographic variables also resulted in a recommendation for future research.
From an institutional perspective, the research suggests that an investigation may be
conducted, into the moderating effect of the corporate mindset in the relationship between
the perceptions of importance and use of HRC and RC dimensions by “mum and dad”
shareholders in stock transactions.
The investigation into the disclosure of information regarding the HRC and RC
dimensions of ABSC within the corporate annual reports also resulted in a
recommendation for future research. The suggestion is that future researchers may
investigate shareholder perceptions regarding the HRC and RC dimensions in a number
of different contexts. This includes a range of economic situations including “bull” and
“bear” markets and “inflation” and “recession”. Similar work, within the banking sector,
performed during stable financial times may also provide significantly different results,
helping researchers and corporate leaders, as well, better understand the impact of the eve
of the GFC on prospective shareholders.
Finally, the investigation into the relationship between disclosure of HRC and RC
dimensions and share price also resulted in a recommendation for future research. With a
focus on varying variables including shareholder characteristics, institutional
perspectives, and contexts, this research suggests that an investigation may be conducted
to determine whether shareholder expectations are influenced by the IC information about

337
HRC and RC dimensions in differing situations including in other sectors of the ASX, in
other markets globally, for various cultures, and in times of economic prosperity. Similar
research may be conducted in the communications sector, the utilities sector, the
education sector, the construction sector, the agriculture sector and other industry sectors.
Additionally, the perception of shareholders in other markets has not been investigated
for all facets of HRC and RC dimensions and stock purchases.
It may also be valuable for future research to be performed to determine if
information about intangible assets, confirmed in this research to be conspicuous by its
absence in the corporate annual reports, is provided by corporations elsewhere. Research
into the disclosure of HRC and RC information in corporate websites, industry
conferences, and other communication tools and events would be a valuable contribution
to the current literature. Such research has the potential to provide insight into where
banks announce their most accurate HRC and RC asset listings.
Finally, the research did identify that friends, family and work colleagues do
influence investors when they are deciding whether to hold on to ABSC stocks. Further
research may provide insight into why this is so; it may also determine whether the
decision is calculated and reasoned or whether the decision is emotional. The investment
behaviours of individual “mum and dad” investors, with specific focus on purchasing
stocks in knowledge-based corporations, represent the potential for future research to
determine how those behaviours are further influenced by other potential moderators such
as economic climate, a longer timeframe, and culture. Future research may include the
testing of how much information on HRC and RC dimensions is enough information and
how much information is too much information.

338
In summary, the investigation into the differences between shareholder perceptions
of importance of HRC and RC dimensions resulted in an important recommendation for
future research. Future research is encouraged to investigate, not only “what”, but also
“why” the differences in shareholder perceptions occur and whether “mum and dad”
shareholders of ABSC have the capacity to change their perceptions through
improvements in corporate disclosure and greater shareholder education. The
investigation into shareholder use of HRC and RC dimensions in stock transactions also
resulted in three specific recommendations for future research. The first was to
encourage the investigation into the impact of experiences of capital losses and capital
gains on the relationship between the perceptions of importance and use of HRC and RC
dimensions in stock transactions. The second was to investigate the moderating influence
of shareholder confidence moderates the relationship between the perceptions of
importance and use of HRC and RC dimensions in stock transactions. The third
recommendation was for an investigation into the perceptions of importance “mum and
dad” shareholders hold, with regard to HRC and RC dimensions, in the decision to
purchase a portfolio of stocks, not just ABSC stocks. The investigation into the
moderating influence of sources of stock investment advice and demographic variables
also resulted in a recommendation for future research. The research suggests that an
investigation may be conducted, into the moderating effect of the corporate mindset in
the relationship between the perceptions of importance and use of HRC and RC
dimensions by “mum and dad” shareholders in stock transactions. The investigation into
the disclosure of information regarding the HRC and RC dimensions of ABSC within the
corporate annual reports also resulted in a recommendation for future research. The

339
suggestion is that future researchers may investigate shareholder perceptions regarding
the HRC and RC dimensions in a range of economic situations including “bull” and
“bear” markets and “inflation” and “recession”. Finally, the investigation into the
relationship between disclosure of HRC and RC dimensions and share price also resulted
in a recommendation for future research. This research suggests that an investigation
may be conducted to determine whether shareholder expectations are influenced by the
IC information about HRC and RC dimensions in differing situations including in other
sectors of the ASX, in other markets globally, for various cultures, and in times of
economic prosperity.
6.5 Conclusion
This research was conducted in two stages. These stages involved an initial pilot
study and a two-part main study. The pilot study involved both quantitative and
qualitative analysis and was designed to validate a tool to measure the perceptions of
individual ABSC shareholders, regarding how relevant HRC and RC dimensions
information is to their decisions regarding purchasing ABSC stocks. As such, there were
three parts to completing the pilot study. These involved: (1) the use of a focus group to
develop operational definitions of the key constructs of HRC and RC and of their
dimensions; (2) the use of a pilot questionnaire to determine the relevance of HRC and
RC policy information to corresponding HRC and RC dimensions; (3) the use of a final
questionnaire to test the statistical validity and reliability of items for use in the
questionnaire for the main study.
The result of the pilot study was that CFA was used to successfully validate 40
policy statement items within the final questionnaire. This ensured the items within the

340
final questionnaire could be used to properly measure the five dimensions of HRC and
three dimensions of RC, when measuring perceptions of individual, ABSC shareholders,
in relation to how relevant HRC and RC policy information is to their decisions to
purchase ABSC stocks. The completion of the pilot study represented the foundation for
the main study; items within the final questionnaire were determined to be reliable and
valid and retained for use in the main study.
It is important to acknowledge that this research did not investigate stock traders or
analysts, securities managers, or portfolio managers investigating transaction options for
major funds or corporate investments. This research was performed on “mum and dad”
investors of ABSC stocks in Australia. It identified the importance of HRC and RC
dimensions information to stock investment decisions.
The main research study provides a thorough investigation into the importance, to
individual shareholders of ABSC, of the five key components of HRC dimensions. These
components, together, comprise the construct of HRC. They include employee
recruitment, employee retention, employee values, development of management and
leadership qualities, and developing employee problem solving skills. This research also
provides a thorough investigation into the importance, to the individual shareholders of
ABSC, of the three key components of RC dimensions. These components, together,
comprise the construct of RC. They include customer capital, supplier chain relations,
and competitors.
Prior to this research being conducted, there was a gap in research in terms of
having an understanding about the perceptions of “mum and dad” shareholders. This
research uses empirical analysis to identify the key information disclosure requirements

341
of investors by providing insight into their perceptions and behaviours. This is of benefit
to “mum and dad” investors because it places the onus on publicly listed corporations to
make the desired HRC and RC dimensions information known to meet the specified
requirements of current and prospective shareholders.
This research establishes, empirically, that “mum and dad” shareholders of NAB
stocks attribute more value to the RC dimensions of customer capital and supplier chain
relations than shareholders of ANZ stocks do. Additionally, it is suggested that, for
shareholders of the top four ABSC, in deciding to buy ABSC stocks, there is no
significant difference between “mum and dad” shareholders’ perceptions for all five HRC
dimensions and for the RC dimension of competitors. This research finds, however, that
NAB shareholders tend to value all HRC and RC dimensions information more than
shareholders of the others of the big four ABSC do (based on calculated mean). “Mum
and dad” shareholders of solely NAB stocks also believe information on the HRC
dimensions of management and leadership qualities and employee problem solving skills,
and on all RC dimensions , to be higher in importance than shareholders of CBA, WBC,
and ANZ stocks (either singular or multiple) believe them to be to the decision to buy
ABSC stocks. The research also finds “mum and dad” shareholders of solely NAB stock
intuitively place a higher value on the information because the information is not
perceived to be adequately available in the NAB corporate annual report, and those who
have stocks in multiple ABSC, including the NAB, place less value on the information.
These findings are explained, to some extent, through subjectivist theories of personal
good, inferring that NAB shareholders perceived the information to be important, or of
value, simply because it is desired and not held, and transfer of learning theories,

342
inferring that NAB shareholders may transfer knowledge about their other ABSC stocks
to their NAB stocks. These findings may make an important contribution to ABSC in
raising their awareness of why differences between perceptions occur and help them to
develop effective HRC and RC communication policies and improved disclosure
practices that educate and encourage “mum and dad” shareholders to change their
perceptions. The findings also give rise to the development of a number of questions,
discussed as recommendations for future research.
This research also identifies, in studying the use of HRC and RC dimensions, by
“mum and dad” shareholders, that the HRC dimension of employee recruitment is of
significantly more value to their decisions to “buy” than to “hold” on to or “sell” ABSC
stocks. No other HRC or RC dimensions are found to differ in importance in the
decisions to either “buy”, “hold” on to, or “sell” ABSC stocks. Additionally, the findings
suggest there is no significant relationship between an individual shareholder’s
perception of the importance of HRC and RC dimensions and an individual’s use of HRC
and RC dimensions in the decision to buy ABSC stocks. These findings are explained
through a number of theories. The theory of planned behaviour, for example, infers that
if, based on their perceptions, the intention of “mum and dad” shareholders is to purchase
ABSC stocks, then they will only do so if their attitude is positive toward the purchase of
ABSC stocks, if historically they have been likely to purchase ABSC stocks, and if they
are confident about their ability to produce a positive outcome from their decisions to
purchase ABSC stocks. This explains why the research did not establish a clear link
between perceptions and behaviours, or actions, of “mum and dad” shareholders.
Caldini’s theory relating to six principles of influence (2008) also suggests that if “mum

343
and dad” shareholders are unsure about where to invest and how to invest, they will
behave as others behave, following the example of people who are similar to them and
accept that they are correct in doing so. Furthermore, behavioural economic theories
suggest that investors do not have equal access to corporate information, that investors do
not always make rational decisions and that various psychological and behavioural biases
(cognitive biases such as self-attribution and overconfidence) impact on the decisions of
investors. Theory suggests that investors are also likely to overreact to private
information and under-react to publicly available information. This serves to explain
why investors did not react to HRC and RC information disclosure, providing insight into
why investors say specific information is important to their investment decisions and then
fail to use such information in their investment decisions.
Notably, a further suggestion of the proposed theories and of this research study is
that results of either the negative or positive outcomes of past stock transaction decisions
impact on the “mum and dad” shareholders confidence to act on their perceptions. As
confidence is eroded, “mum and dad” shareholders follow others in their stock
transaction decisions. The inference is that to succeed in moderating the relationship
between perceptions and behaviours, for example, ABSC must convince “mum and dad”
shareholders to change their behavioural intentions by focusing on implementing
strategies that change their attitudes, their subjective norms, and their perceived
behavioural control. For ABSC to succeed in doing so, future research is encouraged,
which would be of benefit to “mum and dad” shareholders and ABSC alike, to explore
the impact of capital losses and gains on the relationship between the perceptions and the
use of HRC and RC.

344
The research identifies that the relationship between the perceptions and use of
HRC and RC dimensions information, by “mum and dad” shareholders, in deciding
whether or not to hold on to ABSC stocks, is significantly impacted by the advice of
“family and friends” (this includes friends, family, and work colleagues). This finding
makes a contribution to the literature in that it represents a confirmation and an extension
on the information provided by the ASX studies regarding the influence of “family and
friends” in share transaction decision. This research also identified that no other sources
of advice or demographic variables had an influence on the relationship between
perceptions and use of HRC and RC dimensions. This research suggests that perhaps
“mum and dad” shareholders are not influenced by these moderating variables because
the impact of previous experiences of the past may be stronger than the power of any
other influence on behaviour. It is suggested that “media”, “family and friends” and
“professional investment advisors” need to do more than just tell “mum and dad”
shareholders that an investment is good, bad, or without merit, they have to successfully
change their perceptions and behaviour intentions to be successful. This inference is
supported by the contention that shared corporate mindset also influences “mum and dad”
investors because “mum and dad” shareholders are likely attracted to corporations with
positive identities and are detracted from those with negative reputations, and may also
be influenced by the extent to which employees share corporate identity. Hence, it is
inferred that, rather than sources of financial advice and demographic variables, the
greatest influence on the relationship between shareholder perceptions and stock
transaction decisions of “mum and dad” shareholders may also be explained by how well
a corporation communicates a shared mindset with its stakeholders. From a practical

345
perspective, this research suggests that corporations must be involved in changing the
perceptions of shareholders and prospective investors by improving their corporate
communication and shareholder education, better influencing investor actions. Further
research, with a focus on the moderating effect of corporate mindset on the relationship
between perceptions and behaviours of “mum and dad” shareholders, is of benefit to
academics and practitioners of SHRM, and certainly important to corporations to provide
them with the knowledge necessary to influence their stakeholders and improve on their
competitive position. “Mum and dad” investors also stand to benefit from the improved
corporate communication and shareholder education strategies.
This research contributes findings that suggest that the disclosure of HRC and RC
dimensions information is significantly varied between ABSC, and that CBA, recognised
as Money Magazine’s “Bank of the year 2008” has the best quality of disclosure rather
than quantity (frequency) of disclosure. This research suggests that quantity (frequency)
of information disclosure about HRC and RC dimensions does not equate to quality of
information disclosure about HRC and RC dimensions. These findings contribute to and
extend current literature that finds information on intangible assets needs to be clear,
concise and timely to be of value to users. This research is of value in that it establishes
that ABSC lack a standardised reporting template for their HRC and RC dimensions
information. The inference is that quality reporting is associated with positive industry
recognition (Money Magazine’s Bank of the Year). As such, this research contributes
findings that may be used to help set government guidelines for the disclosure of HRC
and RC dimensions information necessary to the share investment decisions of “mum and
dad” shareholders. Providing a level playing field for all investors is, in itself, a
346
challenge for business and government. However, legislation may be able to direct
corporate reporting guidelines.
This research contributes valuable insight into the relationship between the
provision of information on HRC and RC dimensions in the corporate annual reports and
the corporation’s share price. This research suggests that although perceptions of
importance of HRC and RC are perceived to be significant, to the ABSC stock purchase
decisions of “mum and dad” shareholders, this is not reflected in shareholder behaviours.
Additionally, although HRC and RC dimensions disclosure is perceived to be
significantly better for CBA, in terms of quality, it is not reflected in the CBAs share
price. Finally, regardless of shareholder perceptions and behaviours, this research finds
no positive abnormal returns on share prices of any of the ABSC perceived to be the
“best” in quality and frequency of disclosure about HRC and RC dimensions.
The inference of this finding is that while researchers and practitioners claim that
components of IC are important to improved share values, these views are not supported
through this research. Investor expectations are not influenced by IC information relating
to HRC and RC dimensions, in relation to transactions in ABSC stocks. It is not possible
at this stage to make a definitive statement about the reasons why disclosure is not
reflected in share price changes. Behavioural economic theories are again used to explain
the results of this research. Investors do not always make rational decisions due to their
various psychological and behavioural biases, and, they are likely to under-react to
publicly available information. This may explain why investors did not react to HRC and
RC information disclosure and did not influence a share price appreciation for the
relevant ABSC. This research, therefore, backs the potential for future research to

347
determine the impact of cognitive biases on stock investment decisions. This research
also encourages research to determine if the outcome is the same in different contexts, in
relation to shareholders of stocks in other sectors of the ASX, in other markets globally,
for various cultures and for times of economic prosperity. Also of interest, is future
research focused on the influence of strategies to improve corporate communications and
strategies to educate shareholders, in an attempt to change shareholder perceptions about
the unseen value of corporations. Research in this area has the potential to benefit all
stakeholders.
This research is significant in that it establishes the level of importance of HRC and
RC dimensions to individual “mum and dad” shareholders of ABSC. This research
provides public corporations with information about the perceived value of their
intangible HRC and RC assets when communicating with both current and prospective
shareholders. The most important contribution this research makes to the literature, to
academia, and to the industry is that it has created a starting point from which publicly
listed corporations can move to improve their communication about the true value of their
organizations to both current and prospective shareholders.
While a variety of research has been completed in this field, this research is the first
to address the perceptions and needs of “mum and dad” investors. What was missing
from previous research was information about what individual investors are looking for
with regard to HRC and RC disclosure within the annual reports, how important the
information was perceived to be and what information could influence the relationship
between shareholder perceptions about the importance of HRC and RC dimensions and
shareholder actions based on the information.

348
The objectives of this research have been achieved successfully. Individual “mum
and dad” investors, SHRM practitioners and academics, ABSC, and government
legislators may all potentially benefit from the results of this research. This research
contributes insight into the perceptions of investors regarding the disclosure of SHRM
policy information, information about the HRC and RC dimensions of ABSC. The
benefit to the field of SHRM is apparent in the building on current knowledge, adding to
what is known, especially about what is being practiced and what is desired in both a
theoretical and commercial context.
This research has resulted in a variety of findings. Most importantly, however, it
has expanded the accepted wisdom and produced a list of research questions that may be
dealt with by other researchers in an effort to improve and refine the literature in the area
of HRC and RC measurement, reporting and disclosure practices and its relationship to
shareholder perceptions and share prices of listed stocks.

349
Appendix A – Components of IC
Overview of the components of intellectual capital (Bollen et al., 2005, p.1165)

350
Appendix A – Components of IC
Overview of the components of intellectual capital (Bollen et al., 2005, p. 1166)

351
Appendix B - Academic Definitions of HRC & RC as Presented to Focus
Group A and Input of Respondents
Definitions related to the Concept of Human Resource Capital (HRC)
Human Resource Capital – Academic Definition
For the organization, its people are its human resources (HR). Therefore, human capital
(HC) is human resource capital (HRC), the collective attitudes, skills and abilities of
human resources contributing to organizational performance and productivity (Stockley,
2005).
What Respondents Have Said
1. What people or individuals contribute to improving the overall performance of an
organization.
2. Anything that is valuable about one’s self that they bring with them to an
organization, contributing to its performance.
3. The combined workforce of an organization using their skills and abilities for the
organization’s success.
4. People in an organization can be considered a resource for that organization, a
human resource. Therefore, human capital is human resource capital. HRC = an
organization’s performance and productivity brought about by human resources.
5. The physical and intellectual abilities of people are their contribution to an
organization.
Human Resource Capital – Operational Definition
Human resource capital is the collective physical and intellectual skills and abilities of
employees that they bring with them to an organization in order to contribute to its
overall performance and success.
Innate Human Capabilities – Academic Definition (a factor of HRC)
Innate human capabilities may be defined as those undeveloped faculties people have to
use that are existing from birth; those faculties inherent rather than learned. They include
intelligence, learning capability and talent.
What Respondents Have Said
1. The natural ability and skill of an individual which has not been taught, but
instead, they are born with it.
2. Those qualities existing from birth.
3. Natural ability in terms of behaviour, based on what a person is born with.

352
4. Innate human capabilities are the capabilities that a person is born with, not
learned.
5. People are born with certain skills inherited from their parents. Through time
their talents are developed and performed according to the requirements of
society.
Innate Human Capabilities – Operational Definition
Innate human capabilities are the natural abilities and qualities a person is born with that,
with time and through experience, may develop as behaviours, skills and talents.
Learned Abilities – Academic Definition (a factor of HRC)
Learned abilities are those faculties or capacities resulting from the knowledge gained by
theoretical and/or practical study. They include knowledge, skills, education from
learning from each other, education from learning from training, experience, ability and
expertise.
What Respondents Have Said
1. The ability of an individual to understand, as they have been taught to understand.
2. Knowledge gained through learning.
3. Knowledge and skills that are taught rather than inherited.
4. Learned abilities are those abilities which are gained from reading about it,
writing about it, or actually seeing and doing it.
5. People are able to learn certain skills from others via formal education from
institutions or by watching others via television, family, friends, sportspeople.
Learned Abilities– Operational Definition
Learned abilities are the knowledge and skills that are taught, through formal and
informal education and practice, rather than inherited.
Management & Leadership Qualities – Academic Definition (a factor
of HRC)
Management & leadership qualities may be defined as the nature, kind, character, or
manner of those individuals and groups who use a set of processes that ensure that
complicated systems of people and technology flow smoothly to produce organizations in
the first place or to adjust them to changing situations.
What Respondents Have Said

353
1. Traits which assist in leading and representing the overall performance of a
company.
2. Qualities helping a manager to better control and guide the resources of a
company.
3. Management and leadership qualities are qualities that define a person’s character
in terms of how they would run an organization. Different incentives apply.
4. * respondent would comfortably use the academic definition*
5. The leadership of an institution can control the behaviour of its employees via
rewards or consequences.
Management & Leadership Qualities – Operational Definition
Management & leadership qualities are those traits and qualities that refer to a person’s
character in terms of how they would control and guide the overall resources and
performance of an organization. Leaders will use incentives such as rewards and
consequences to control the behaviour of employees. Incentives may or may not include
money.
Employee Values – Academic Definition (a factor of HRC)
Employee values are all the beliefs held by an employee in terms of principles, values
and judgments of what is important, true and relevant to the role of work of that
individual employee. Employee values decide the attitudes and behaviours employees
make use of in their commitment to achieving organizational success by the company’s
employees.
What Respondents Have Said
1. The ethics and morals of individuals which influence the company’s employees.
2. What the employees of a company consider to be important.
3. All an employee regards as important and true in terms of principles, standards
and judgments.
4. Employee values are those principles, standards and judgments of what is
important, just and righteous (usually a trait brought about by birth, upbringing
and experience).
5. A worker’s values are based on what’s important to him/her at work.
Employee Values – Operational Definition
Employee values are all those beliefs about what is important, in terms of principles,
values and judgments, that an employee believes to be true and is influenced by in his/her
role at work.

354
Problem Solving Capabilities – Academic Definition (a factor of HRC)
Problem solving capabilities refer to an employee’s ability to identify problems, the
ability of the employee to adapt and the ability of the employee to change
What Respondents Have Said
1. The ability of an individual or groups to solve problems in difficult situations.
2. The employee’s ability to find solutions to difficult problems or situations.
3. An employee’s ability to identify a problematic situation and to rectify the
problem.
4. Problem solving capabilities are an employee’s ability to work through difficult
problems for a solution. As with Bollen et al., this includes an employee’s
adapting and changing skills.
5. Employees have difficulties problem solving at work. Therefore, leadership
teams guide employees to find solutions.
Problem Solving Capabilities – Operational Definition
Problem solving capabilities are the abilities of employees to identify and solve difficult
problems or situations at work, usually through the ability to adapt and change. This may
be done at an individual or at a group level.
Definitions related to the Concept of Relational Capital (RC)
Relational Capital - Academic Definition
Relational capital (RC) includes contacts between economic needed to acquire inputs and
to sell outputs; a directly productive aspect of social capital (Bezemer, Dulleck and
Frijters, 2003). RC refers to the productive contacts that individuals use in achieving sold
output. In some essential features, RC will not differ from other forms of capital, such as
money and machinery (cf. Robison et al, 2002). These contacts form the individual
aspect of social capital that is directly productive (Woolcock & Narayan, 2000, cited in
Bezemer et al., 2003).
What Respondents Have Said
1. The relationship between overall resources to acquire inputs, conversion to
outputs, irrespective of the form of capital.
2. Productive business contacts used for company turnover. Such contacts are as
essential as money & machinery and form the individual aspect of social capital.
3. The economics of the relationship needed to buy and sell, to be productive.
4. RC, like that of money & machinery, is productive contacts that individuals use in
achieving solid output. This is how all the resources work together to attain the
output.
5. Must have consideration for all aspects of market forces.

355
Relational Capital - Operational Definition Relational capital is the economic value of the working relationships between all kinds of
resources needed for an organization to be productive.
Customer Capital - Academic Definition (factor of RC)
Customer capital includes items such as:
Knowledge of marketing channel
Knowledge of customer relationships
Customer orientation (accessibility of customer feedback)
Customer orientation (image of the company)
Customers (amount of customers)
Customers (strong relationships)
Customers (satisfaction of products and services)
What Respondents Have Said
1. The knowledge of a company’s target market in order to satisfy customers’ needs
and wants, and creating a strong rapport with customers.
2. Knowledge of different ways to access the market; knowledge of how to deal with
customers; devise ways to obtain customer feedback; customers’ image of the
company.
3. * respondent would comfortably use the academic definition*
4. * respondent would comfortably use the academic definition*
5. Companies must understand how customers think and what motivates them.
Customer Capital - Operational Definition
Customer capital is any and all items that provide a company with a good knowledge of
its target market, in order to meet the market’s needs and wants and to build a strong
relationship with its customers. Customer capital includes the ability to access the
market, to deal productively with customers by knowing what motivates them, to find
ways to get feedback from customers, and to build and improve the image of the
company within the market.
Supplier Chain Relations - Academic Definition (factor of RC)
Supplier chain relations include items such as:
Employees’ knowledge of customer relations
Number of customers

356
What Respondents Have Said
1. Employees aware of customers’ demand curve and total willingness to pay in the
entire market.
2. How employees are able to converse with customers so that the feedback of
customers is positive.
3. Employees’ awareness of and interaction with customers.
4. Items relating to supplier relations include employee knowledge of customer
policies and number of customers.
5. Must know/predict how many customers will buy certain goods.
Supplier Chain Relations - Operational Definition
Supplier chain relations refer to the awareness employees have about their customers,
including knowledge about the number of customers and what their feedback about the
company is. Positive feedback is dependent on the relationship between employees of
the company and their customers.
Competitors - Academic Definition (factor of RC)
Competitors include items such as:
Relationships with other organizations
Competitor orientation
What Respondents Have Said
1. Prisoners’ Dilemma, whereby there is either cooperation or competition. The
position of a competitor respective of the organization.
2. What the competitors’ position is in the relevant market. Their target market,
their strengths & weaknesses.
3. Knowing your competitive market and knowing your place within that market.
4. Competitor position and factors in the industry.
5. Networking with other companies and being in competition with other companies.
Competitors - Operational Definition
Competitors refers to the cooperative or competitive relationships a company has with its
competitors in its relevant market. This takes into account its position in the market
relative to its competition, its networking ability and its competitive strengths and
weaknesses.
General Aspects to be accounted for when engaging in Relationships -
Academic Definition (factor of RC)

357
Items relating to general aspects to be accounted for when engaging in relationships
include:
Long term focus related to customer and supplier relations
Profit objective related to customer and supplier relations.
What Respondents Have Said
1. The relationship of the customer and supplier on a grand scale, necessary to meet
the profit objective.
2. Building relationships with suppliers in order for the best prices and flexibility
when needed. Customer relationship in order for long-term loyalty and positive
feedback to company.
3. Strategic objective – Where your company wants to be and how much you want
to make.
4. Dealing with customers and suppliers in the long term. Pricing and discounting
based on individual customers and suppliers for profit objectives.
5. Ensuring that short term customers become long term customers leading to profit.
General Aspects to be accounted for when engaging in Relationships -
Operational Definition
General aspects to be accounted for when engaging in relationships refers to a company
being able to achieve its strategic goals and to make good profits in the long run based on
building strong relationships with both customers and suppliers. By nurturing productive
relationships, customers and suppliers will provide the company with positive feedback,
long term loyalty and flexibility.

358
HREC Approval

359
Appendix D - Pilot Questionnaire to Determine Relevance RESPONDENT NUMBER: _________
CONFIDENTIAL QUESTIONNAIRE
The Perceptions of Stock Analysts, Brokers and Shareholders of the Importance of
Human Resource and Relational Capital Information in Stock Purchase Decisions
RESPONDENT’S NAME: _____________________________________ POST CODE: _________________
PLEASE TICK THE RELEVANT RESPONSES FOR THE FOLLOWING QUESTIONS:
What is your gender?
Male __ Female __
What is your age?
25 or under __ 26-35 __ 36-45 __ 46-55 __ 56-65 __ 66 and over __
What level of education have you achieved?
Primary __ Secondary __ TAFE __ University __
What is your occupation?
Professional/Manager/Administrator/Consultant/Clerical __
Tradesperson/Contractor/Labourer __
Other (i.e. home duties/student/unemployed) __
What is your income range?
Up to $40,000 __ $40,001 to $80,000 __ $80,001 to $120,000 __ $120,001 or more __
Do you have, or have you had, banking sector shares?
Yes __ No __
If you responded “yes” to having banking sector shares, in what banks do you have shares?
ADB (Adelaide Bank Ltd) __ ANZ (Australia & New Zealand Banking Group Ltd) __
BEN (Bendigo Bank Ltd) __ BOQ (Bank of Queensland Ltd) __
CBA (Commonwealth Bank of Australia)__ NAB (National Australia Bank) __
SGB (St. George Bank Ltd) __ WBC (Westpac Banking Corporation) __
Other banks (please specify which) ___________________________________________________ __
If you responded “no” to having banking sector shares, you are no longer required to proceed with
the questionnaire. Thank you for your time and effort.
The definitions below are provided for your convenience, to help clarify what this questionnaire is
trying to explore.
Human resource capital (HRC) is the collective physical and intellectual skills and abilities of employees
that they bring with them to an organization in order to contribute to its overall performance and success.
Factors of HRC include learned abilities, management & leadership qualities, employee values and
problem-solving capabilities.
Relational capital (RC) is the economic value of the working relationships between stakeholders, including
shareholders, management, staff, suppliers, customers, competitors, etc., needed for an organization to be
productive. Generally, and for the purpose of this study, both short and long term aspects of customer
capital, supplier chain relations and competitors make up the RC of a firm.

360
Have you used HRC and/or RC policy information to decide on which banking sector shares to buy?
Yes __ No __
If you responded “yes”, please tick which HRC and/or RC policy information you used in your
decision to buy shares.
Employee recruitment process __ Employee retention __
Development of Management & leadership qualities __ Employee values __
Developing employee problem-solving skills __ Customer capital __
Supplier chain relations __ Competitors __
Have you used HRC and/or RC policy information to decide on which banking sector shares to hold
on to?
Yes __ No __
If you responded “yes”, please tick which HRC and/or RC policy information you used in your
decision to hold on to shares.
Employee recruitment process __ Employee retention __
Development of Management & leadership qualities __ Employee values __
Developing employee problem-solving skills __ Customer capital __
Supplier chain relations __ Competitors __
Have you used HRC and/or RC policy information to decide on which banking sector shares to sell?
Yes __ No __
If you responded “yes”, please tick which HRC and/or RC policy information you used in your
decision to sell shares.
Employee recruitment process __ Employee retention __
Development of Management & leadership qualities __ Employee values __
Developing employee problem-solving skills __ Customer capital __
Supplier chain relations __ Competitors __
Do you think the HRC and/or RC policy information used should be different for “buying”, “holding
on to”, or “selling” banking shares?
Yes __ No __
If you responded “yes”, please rank the importance of HRC and/or RC policy information from
1(most important) to 8(least important) in the decision to buy banking shares.
Employee recruitment process __ Employee retention __
Development of Management & leadership qualities __ Employee values __
Developing employee problem-solving skills __ Customer capital __
Supplier chain relations __ Competitors __
If you responded “yes”, please rank the importance of HRC and/or RC policy information from
1(most important) to 8(least important) in the decision to hold on to banking shares.
Employee recruitment process __ Employee retention __
Development of Management & leadership qualities __ Employee values __
Developing employee problem-solving skills __ Customer capital __
Supplier chain relations __ Competitors __

361
If you responded “yes”, please rank the importance of HRC and/or RC policy information from
1(most important) to 8(least important) in the decision to sell banking shares.
Employee recruitment process __ Employee retention __
Development of Management & leadership qualities __ Employee values __
Developing employee problem-solving skills __ Customer capital __
Supplier chain relations __ Competitors __
Instructions
You are provided with a range of items/statements relating to the HRC and RC of a
company. You are required to indicate how relevant you perceive these items are to
the HRC or RC factors indicated in each section. Please read each statement and
indicate the perceived level of relevance by circling the appropriate response. There
are no right or wrong answers.
How do you perceive the relevance of each of the following statements to the HR factor of employee recruitment?
1. The company attracts valuable employees, with industry-specific
knowledge, from competitor firms NOT
RELEVANT
UNSURE
RELEVANT
2. The company offers higher starting salaries than the industry
average NOT
RELEVANT
UNSURE
RELEVANT
3. The company hires the best trained graduates in the field NOT
RELEVANT
UNSURE
RELEVANT
4. Graduate recruits are fast-tracked to a management position
quickly in the company compared to competitor firms NOT
RELEVANT
UNSURE
RELEVANT
5. The company uses targeted marketing campaigns to potential
recruits to show it values the individual achievements of its
current star performers
NOT
RELEVANT
UNSURE
RELEVANT
6. The company uses in-house employee recruitment officers, with
complete knowledge of the firm’s business, to match appropriate
recruits to available roles
NOT
RELEVANT
UNSURE
RELEVANT
How do you perceive the relevance of each of the following statements to the HR factor of employee retention?
1. The company encourages current employees with good
performance results to nominate themselves for future
management positions
NOT
RELEVANT
UNSURE
RELEVANT
2. The company is committed to retaining employees by making the
job interesting for them NOT
RELEVANT
UNSURE
RELEVANT
3. The company uses training and development to improve
interpersonal communication and teamwork NOT
RELEVANT
UNSURE
RELEVANT
4. The company facilitates workplace diversity and workplace
harmony by employing females, mature-aged staff, and those from
multi-cultural backgrounds
NOT
RELEVANT
UNSURE
RELEVANT
5. Specialist external firms provide training to employees with
specialized product knowledge/skills NOT
RELEVANT
UNSURE
RELEVANT
6. The careers of junior employees are developed through the formal
mentoring by experienced staff NOT
RELEVANT
UNSURE
RELEVANT
7. A formal performance appraisal program provides employees with
constructive feedback and remedial intervention NOT
RELEVANT
UNSURE
RELEVANT

362
How do you perceive the relevance of each of the following statements to the HR factor of management &
leadership qualities of managers?
1. Training and development is used to improve the leadership
qualities and styles of company managers NOT
RELEVANT
UNSURE
RELEVANT
2. Managers are allowed to use flexibility with leave and other time
allowances to control and encourage employee behaviour NOT
RELEVANT
UNSURE
RELEVANT
3. Providing managers with technical skills to decide on the level of
training required to reduce employee skills gaps NOT
RELEVANT
UNSURE
RELEVANT
4. Managers are empowered to motivate subordinates by offering
employee salaries above the industry average NOT
RELEVANT
UNSURE
RELEVANT
5. Providing managers with share options and other bonuses directly
linked to the output levels of their departments and of their direct
subordinates
NOT
RELEVANT
UNSURE
RELEVANT
How do you perceive the relevance of each of the following statements to the HR factor of employee values?
1. Managers build corporate trust & goodwill with their subordinates
by negotiating difficult situations in an open environment NOT
RELEVANT
UNSURE
RELEVANT
2. Organizational synergy, which improves company output, is a
result of a decentralized decision-making process NOT
RELEVANT
UNSURE
RELEVANT
3. The company motivates less competitive employees by linking
output to a highly competitive reward system NOT
RELEVANT
UNSURE
RELEVANT
4. The company uses weekly statistical analysis of staff productivity
to encourage employees to reset goals & targets NOT
RELEVANT
UNSURE
RELEVANT
5. Weekend workshops are used to improve employee productivity
by encouraging them to broaden their perspective in relation to
their work roles
NOT
RELEVANT
UNSURE
RELEVANT
How do you perceive the relevance of each of the following statements to the HR factor of the problem-solving skills
of employees?
1. Managers facilitate the creation of an organizational culture based
on work-groups and teams in the pursuit of creating new products
and services
NOT
RELEVANT
UNSURE
RELEVANT
2. Managers are encouraged to facilitate employees who are proven
and successful risk-takers NOT
RELEVANT
UNSURE
RELEVANT
3. Managers readily encourage staff to practice self-confidence and
to demonstrate authority as a result of their own successful
management styles
NOT
RELEVANT
UNSURE
RELEVANT
4. Managers are empowered to select, as mentors and role models,
employees who are creative and can make their own decisions
without the help of others
NOT
RELEVANT
UNSURE
RELEVANT
5. Managers select, as supervisors, employees that demonstrate the
ability to use their imagination to develop original ideas for their
market
NOT
RELEVANT
UNSURE
RELEVANT
How do you perceive the relevance of each of the following statements to the RC factor of customer capital?
1. Structured training programs improve sales staff responsiveness
and levels of customer courtesy NOT
RELEVANT
UNSURE
RELEVANT
2. Company obligations to corporate customers are met in a timely
and individualized manner NOT
RELEVANT
UNSURE
RELEVANT

363
3. Innovative practices are used to actively and consistently increase
market share NOT
RELEVANT
UNSURE
RELEVANT
4. The company’s reputation with its current customers has
facilitated the potential to grow its customer base NOT
RELEVANT
UNSURE
RELEVANT
5. Whether the company has negotiated long term contracts with
customers NOT
RELEVANT
UNSURE
RELEVANT
How do you perceive the relevance of each of the following statements to the RC factor of supplier chain relations?
1. The company’s high customer retention is due to the specialized
work of their customer relationship managers NOT
RELEVANT
UNSURE
RELEVANT
2. When surveyed for feedback, the degree of customer satisfaction
reported on the service the company provides in response to their
contemporary needs
NOT
RELEVANT
UNSURE
RELEVANT
3. Whether the company has negotiated long term contracts with
suppliers NOT
RELEVANT
UNSURE
RELEVANT
4. Customer feedback is encouraged through the promptness of
employees responding to feedback NOT
RELEVANT
UNSURE
RELEVANT
5. Management and staff at all levels understand the size of their
share of the market. NOT
RELEVANT
UNSURE
RELEVANT
6. Employees know how their customers want to be treated
NOT
RELEVANT
UNSURE
RELEVANT
7. Whether corporate stakeholders are aware of where the company
wants to be in 3 to 5 years – strategic objective NOT
RELEVANT
UNSURE
RELEVANT
How do you perceive the relevance of each of the following statements to the RC factor of competitors?
1. Information about the awareness of a company’s positioning
within its market NOT
RELEVANT
UNSURE
RELEVANT
2. Relative to itself, an awareness of the positioning of its
competitors in the market NOT
RELEVANT
UNSURE
RELEVANT
3. Information on how management actively tests its performance
against its best competitors to improve the company’s
performance and overall position in the market
NOT
RELEVANT
UNSURE
RELEVANT
4. Knowledge about how the company works together with its
competitors to further develop its markets (joint
ventures/alliances)
NOT
RELEVANT
UNSURE
RELEVANT
5. Information on how the company seeks to predict market trends NOT
RELEVANT
UNSURE
RELEVANT
6. Information on how the company uses market intelligence
increase its market share NOT
RELEVANT
UNSURE
RELEVANT
7. Knowledge about the potential for a company to add value
through product and/or business diversification NOT
RELEVANT
UNSURE
RELEVANT

364
Appendix E – Expression of Interest Letter \
Australian Catholic University Limited ABN 15 050 192 660 Melbourne Campus (St Patrick's) 115 Victoria Parade Fitzroy VIC 3065 Locked Bag 4115 Fitzroy MDC VIC 3065 Telephone 613 9953 3000 Facsimile 613 9953 3005 www.acu.edu.au
EXPRESSION OF INTEREST LETTER TO PARTICIPANTS
(Respondents to the questionnaire)
RESEARCH PROJECT TITLE:
The Perceptions of Shareholders of the Importance of Human Resource and Relational
Capital Information in Stock Purchase Decisions
Name of Research Student: Ms. ALMA S KAIROUZ
Name of Supervisor: Dr. SUGUMAR MARIAPPANADAR
Dear Participant,
I am currently conducting research to explore the perception of importance of human
resource and relational capital information by individual shareholders. The focus of the
research paper is on the importance of human resource and relational capital information
in making investment decisions relating to purchasing equity in organizations within the
knowledge-based banking industry within the Australian environment. Specifically, this
study will provide an assessment of the perceived importance of human resource and
relational capital information disclosure by corporations within Australia’s banking sector
and the impact of those perceptions on the purchase of shares within that sector.
I am requesting your participation in the study by asking you to respond to the range of
questions in the questionnaire. Completion of the questionnaire will take approximately
10 to 15 minutes. Your responses to the questions will clarify the perceptions of
importance of items relating to the human resource and relational factors of the banking
industry firms. Your responses will also help to test the reliability and validity of the
research findings up to this stage.
I assure you that the data collected from you will be maintained in strict confidence. The
questionnaires will be securely stored for at least five years, as prescribed by the
university regulations. The questions you will be asked about yourself are only to allow

365
me to group the data in various ways, such as by gender, age, and education and only
aggregated group information will be used for analysis and publication. There is no way
that you can be personally identified in a report. You may withdraw from the study at
any time and are not required to provide a reason.
If you have any queries or would like to be informed of the aggregate research findings,
please contact the research supervisor as follows:
Dr. Sugumar Mariappanadar
Supervisor
HRM/Management
Tel: 03 9953 3167
School of Business & Informatics
115 Victoria Parade,
Fitzroy, VIC 3065
The Human Research Ethics Committee at Australian Catholic University has approved
this study. In the event that you have any complaint or concern about the way you have
been treated during the study, or if you have any query that the researcher has not been
able to satisfy, you may write to the Chair of the Human Research Ethics Committee as
follows:
Chair, HREC
c/- Research Services
Australian Catholic University
Melbourne Campus
Locked Bag 4115,
Fitzroy, VIC 3065
Tel: 03 9953 3157
Fax: 03 9953 3315
Any complaint or concern will be treated in confidence and fully investigated. The
participant will be informed of the outcome.
If you agree to participate in this research project, you should sign both copies of the
Consent Form, retain one copy for your records and return the other copy to the student
researcher.
Regards,
Alma S Kairouz Sugumar Mariappanadar
Student Researcher Supervisor

366
Appendix F – Participant Consent Form \
Australian Catholic University Limited ABN 15 050 192 660 Melbourne Campus (St Patrick's) 115 Victoria Parade Fitzroy VIC 3065 Locked Bag 4115 Fitzroy MDC VIC 3065 Telephone 613 9953 3000 Facsimile 613 9953 3005 www.acu.edu.au
PARTICIPANT CONSENT FORM
RESEARCH PROJECT TITLE:
The Perceptions of Shareholders of the Importance of Human Resource and
Relational Capital Information in Stock Purchase Decisions
Name of Research Student: Ms ALMA S KAIROUZ
Name of Supervisor: Dr. SUGUMAR MARIAPPANADAR
I ……………………………………………………………. (the participant) have read
and understood the information provided in the Letter to Participants. Any questions I
have asked have been answered to my satisfaction. I agree to participate in the research
study by providing responses to questions asked in the questionnaire. I realize that I may
be required to respond to subsequent questionnaires and that I may choose to withdraw
from the study at any time. I agree that the research data collected for the study may be
published or may be provided to other researchers in a form that does not identify me in
any way.
NAME OF PARTICIPANT: …………………………..……………………(block letters)
SIGNATURE:……………………………………………… DATE:…………………….
SIGNATURE OF RESEARCH STUDENT:………………………………………………
DATE:………………………
SIGNATURE OF SUPERVISOR:…………………………………………………………
DATE:………………………….. Researcher’s copy CRICOS registered provider:
00004G, 00112C, 00873F, 00885B

367
Appendix G – Final Pilot Study Questionnaire for Validity and
Reliability Tests
CONFIDENTIAL QUESTIONNAIRE
The Perceptions of Individual Shareholders of the Importance of
Human Resource and Relational Capital Information in Stock Purchase
Decisions
PLEASE TICK ( ) THE RELEVANT RESPONSES FOR THE FOLLOWING
QUESTIONS:
Gender Male __ Female __
Age 25 or under __ 26-35 __ 36-45 __ 46-55 __ 56-65 __
66 or over __
Level of education Primary __ Secondary __ TAFE __ University __
Do you have, or have you had, Australian banking sector shares? Yes __ No __
If you responded “yes” to having banking sector shares, in what banks do you have
shares? ADB (Adelaide Bank Ltd) __ ANZ (Australia & New Zealand Banking Group Ltd) __
BEN (Bendigo Bank Ltd) __ BOQ (Bank of Queensland Ltd) __
CBA (Commonwealth Bank of Australia) __ NAB (National Australia Bank) __
SGB (St. George Bank Ltd) __ WBC (Westpac Banking Corporation) __
Other banks (please specify which) ______________________________________________________ __
If you responded “no” to having banking sector shares, you are no longer required
to proceed with the questionnaire. Thank you for your time and effort.
The definitions below are provided for your convenience, to help clarify what this
questionnaire is trying to explore.
Human resource capital (HRC) is the collective physical and intellectual skills and
abilities of employees that they bring with them to an organization in order to contribute
to its overall performance and success. Factors of HRC include learned abilities,
management & leadership qualities, employee values and problem-solving capabilities.
Relational capital (RC) is the economic value of the working relationships between
stakeholders, including shareholders, management, staff, suppliers, customers,
competitors, etc., needed for an organization to be productive. Generally, and for the
purpose of this study, both short and long term aspects of customer capital, supplier chain
relations and competitors make up the RC of a firm.

368
Instructions
You are provided with a range of statements relating to the HRC and RC of a company.
You are required to indicate how important you perceive these items are to your decision
to purchase banking sector shares. Please read each statement and, by placing a tick ( )
for the appropriate response, indicate the perceived importance of each in accordance
with the scale provided below. There are no right or wrong answers.
Scale: 1 =“Not Important”, 2 =“Less Important”, 3 =“Unsure”, 4 =“Important” and 5
=“Very Important”
1. The company attracts valuable employees, with industry-specific knowledge,
from competitor firms
1 2 3 4 5
2. The company encourages current employees with good performance results to
nominate themselves for future management positions
1 2 3 4 5
3. Training and development is used to improve the leadership qualities and styles
of company managers
1 2 3 4 5
4. Managers build corporate trust & goodwill with their subordinates by
negotiating difficult situations in an open environment
1 2 3 4 5
5. Managers facilitate the creation of an organizational culture based on work-
groups and teams in the pursuit of creating new products and services
1 2 3 4 5
6. Structured training programs improve sales staff responsiveness and levels of
customer courtesy
1 2 3 4 5
7. The company’s high customer retention is due to the specialized work of their
customer relationship managers
1 2 3 4 5
8. Company obligations to corporate customers are met in a timely and
individualized manner
1 2 3 4 5
9. Managers are allowed to use flexibility with leave and other time allowances to
control and encourage employee behaviour
1 2 3 4 5
10. Relative to itself, an awareness of the positioning of its competitors in the
market
1 2 3 4 5
11. The company offers higher starting salaries than the industry average 1 2 3 4 5
12. The company uses training and development to improve interpersonal
communication and teamwork
1 2 3 4 5
13. Providing managers with technical skills to decide on the level of training
required to reduce employee skills gaps
1 2 3 4 5
14. The careers of junior employees are developed through the formal mentoring
by experienced staff
1 2 3 4 5
15. Information on how management actively tests its performance against its best
competitors to improve the company’s performance and overall position in the
market
1 2 3 4 5
16. Managers readily encourage staff to practice self-confidence and to
demonstrate authority as a result of their own successful management styles
1 2 3 4 5
17. The company hires the best trained graduates in the field 1 2 3 4 5
18. Innovative practices are used to actively and consistently increase market
share
1 2 3 4 5

369
19. Employees know how their customers want to be treated 1 2 3 4 5
20. Knowledge about the potential for a company to add value through product
and/or business diversification
1 2 3 4 5
21. The company uses targeted marketing campaigns to potential recruits to show
it values the individual achievements of its current star performers
1 2 3 4 5
22. Managers are encouraged to facilitate employees who are proven and
successful risk-takers
1 2 3 4 5
23. The company’s reputation with its current customers has facilitated the
potential to grow its customer base
1 2 3 4 5
24. The company uses in-house employee recruitment officers, with complete
knowledge of the firm’s business, to match appropriate recruits to available roles
1 2 3 4 5
25. Managers are empowered to select, as mentors and role models, employees
who are creative and can make their own decisions without the help of others
1 2 3 4 5
26. The company motivates less competitive employees by linking output to a
highly competitive reward system
1 2 3 4 5
27. Information on how the company uses market intelligence increase its market
share
1 2 3 4 5
28. Managers are empowered to motivate subordinates by offering employee
salaries above the industry average
1 2 3 4 5
29. Specialist external firms provide training to employees with specialized
product knowledge/skills
1 2 3 4 5
30. Whether the company has negotiated long term contracts with customers 1 2 3 4 5
31. Providing managers with share options and other bonuses directly linked to the
output levels of their departments and of their direct subordinates
1 2 3 4 5
32. Organizational synergy, which improves company output, is a result of a
decentralized decision-making process
1 2 3 4 5
33. When surveyed for feedback, the degree of customer satisfaction reported on
the service the company provides in response to their contemporary needs
1 2 3 4 5
34. Weekend workshops are used to improve employee productivity by
encouraging them to broaden their perspective in relation to their work roles
1 2 3 4 5
35. A formal performance appraisal program provides employees with
constructive feedback and remedial intervention
1 2 3 4 5
36. Whether the company has negotiated long term contracts with suppliers 1 2 3 4 5
37. Managers select, as supervisors, employees that demonstrate the ability to use
their imagination to develop original ideas for their market
1 2 3 4 5
38. Whether corporate stakeholders are aware of where the company wants to be
in 3 to 5 years – strategic objective
1 2 3 4 5
39. Information on how the company seeks to predict market trends 1 2 3 4 5
40. The company uses weekly statistical analysis of staff productivity to
encourage employees to reset goals & targets
1 2 3 4 5
Scale: 1 =“Not Important”, 2 =“Less Important”, 3 =“Unsure”, 4 =“Important” and 5 =“Very Important”

370
Appendix H – Main Study Questionnaire
CONFIDENTIAL QUESTIONNAIRE
The Perceptions of Individual Shareholders of the Importance of Human Resource
and Relational Capital Information in Stock Purchase Decisions
PLEASE TICK ( ) THE RELEVANT RESPONSES FOR THE FOLLOWING QUESTIONS:
Gender Male __ Female __
Age 25 or under __ 26-35 __ 36-45 __ 46-55 __ 56-65 __ 66 or over __
Level of education Primary __ Secondary __ TAFE __ University __
Do you have, or have you had, Australian banking sector shares?
Yes __ No __
If you responded “yes” to having banking sector shares, in what banks do you have shares?
ADB (Adelaide Bank Ltd) __ ANZ (Australia & New Zealand Banking Group Ltd __
BEN (Bendigo Bank Ltd) __ BOQ (Bank of Queensland Ltd) __
CBA (Commonwealth Bank of Australia)__ NAB (National Australia Bank) __
SGB (St. George Bank Ltd) __ WBC (Westpac Banking Corporation) __
Other banks (please specify which) __________________________________________________ __
If you responded “no” to having banking sector shares, you are no longer required to proceed
with the questionnaire. Thank you for your time and effort.
The definitions below are provided for your convenience, to help clarify what this
questionnaire is trying to explore.
Human resource capital (HRC) is the collective physical and intellectual skills and abilities of
employees that they bring with them to an organization in order to contribute to its overall
performance and success. Factors of HRC include learned abilities, management & leadership
qualities, employee values and problem-solving capabilities.
Relational capital (RC) is the economic value of the working relationships between stakeholders,
including shareholders, management, staff, suppliers, customers, competitors, etc., needed for an
organization to be productive. Generally, and for the purpose of this study, both short and long term
aspects of customer capital, supplier chain relations and competitors make up the RC of a firm.

371
1. Indicate with a tick ( ) if you have used Human Resource Capital (HRC) and/or Relational
Capital (RC) policy information to decide on which Australian banking sector shares to buy, hold on
to, or sell? (please refer to the definitions provided above)
HRC YES NO RC YES NO
To buy shares To buy shares
To hold on to Shares
To hold on to shares
To sell shares
To sell shares
2. Indicate the importance of the sources of advice below as either 1 – not important; 2 – important;
or 3 - most important, in providing HRC and/or RC information. Place a tick ( ) in the box
representing the appropriate response.
HRC RC
Newspapers 1 2 3 Newspapers 1 2 3
Family & Friends 1 2 3 Family & Friends 1 2 3
Financial Planner / Advisor 1 2 3 Financial Planner / Advisor 1 2 3
Stock Broker 1 2 3 Stock Broker 1 2 3
Internet 1 2 3 Internet 1 2 3
Investment Newsletters 1 2 3 Investment Newsletters 1 2 3
Accountant 1 2 3 Accountant 1 2 3
Work Colleague 1 2 3 Work Colleague 1 2 3
Magazines 1 2 3 Magazines 1 2 3
Radio 1 2 3 Radio 1 2 3
Other Source of Advice
(please
specify)_____________
1 2 3 Other Source of Advice
(please
specify)_______________
1 2 3
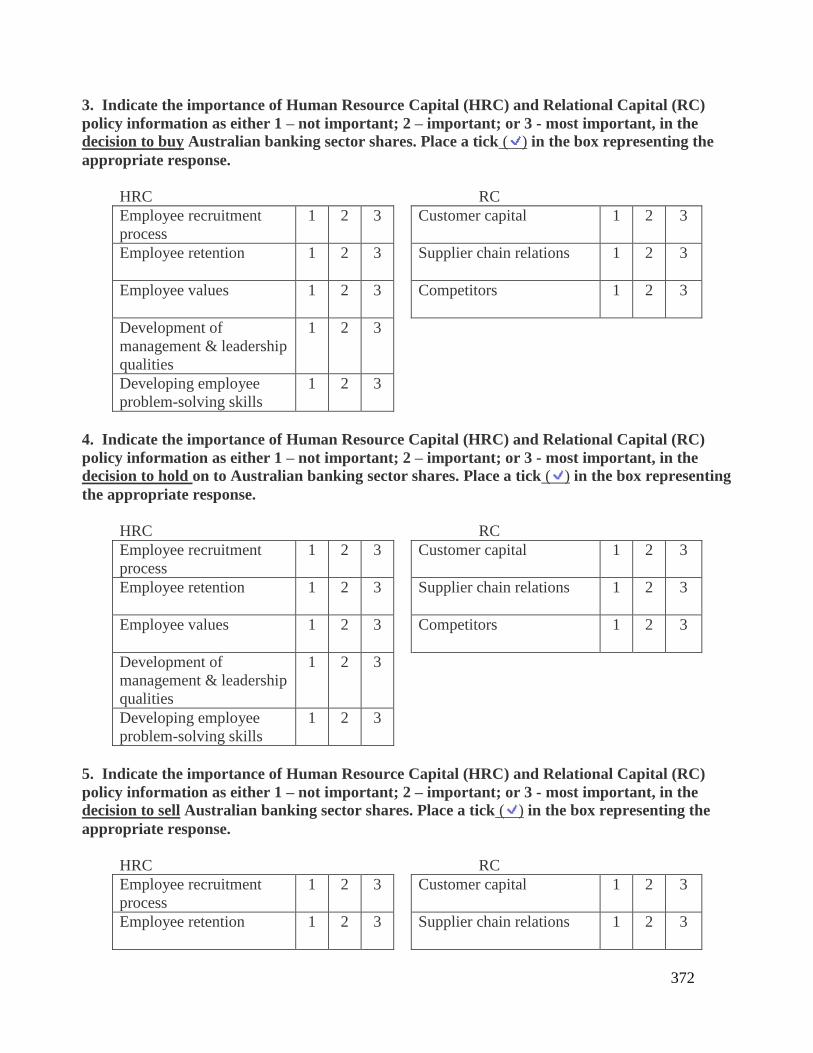
372
3. Indicate the importance of Human Resource Capital (HRC) and Relational Capital (RC)
policy information as either 1 – not important; 2 – important; or 3 - most important, in the
decision to buy Australian banking sector shares. Place a tick ( ) in the box representing the
appropriate response.
HRC RC
Employee recruitment
process
1 2 3
Customer capital 1 2 3
Employee retention 1 2 3
Supplier chain relations 1 2 3
Employee values 1 2 3
Competitors 1 2 3
Development of
management & leadership
qualities
1 2 3
Developing employee
problem-solving skills
1 2 3
4. Indicate the importance of Human Resource Capital (HRC) and Relational Capital (RC)
policy information as either 1 – not important; 2 – important; or 3 - most important, in the
decision to hold on to Australian banking sector shares. Place a tick ( ) in the box representing
the appropriate response.
HRC RC
Employee recruitment
process
1 2 3
Customer capital 1 2 3
Employee retention 1 2 3
Supplier chain relations 1 2 3
Employee values 1 2 3
Competitors 1 2 3
Development of
management & leadership
qualities
1 2 3
Developing employee
problem-solving skills
1 2 3
5. Indicate the importance of Human Resource Capital (HRC) and Relational Capital (RC)
policy information as either 1 – not important; 2 – important; or 3 - most important, in the
decision to sell Australian banking sector shares. Place a tick ( ) in the box representing the
appropriate response.
HRC RC
Employee recruitment
process
1 2 3
Customer capital 1 2 3
Employee retention 1 2 3
Supplier chain relations 1 2 3

373
Employee values 1 2 3
Competitors 1 2 3
Development of
management & leadership
qualities
1 2 3
Developing employee
problem-solving skills
1 2 3
6. Instructions
You are provided with a range of statements relating to the HRC and RC of a company. You are required
to indicate how important you perceive these items are to your decision to purchase banking sector shares.
Please read each statement and, by placing a tick ( ) for the appropriate response, indicate the perceived
importance of each in accordance with the scale provided below. There are no right or wrong answers.
Scale: 1 =“Not Important”, 2 =“Less Important”, 3 =“Unsure”, 4 =“Important” and 5 =“Very Important”
1. The company attracts valuable employees, with industry-specific knowledge,
from competitor firms
1 2 3 4 5
2. The company encourages current employees with good performance results to
nominate themselves for future management positions
1 2 3 4 5
3. Training and development is used to improve the leadership qualities and styles
of company managers
1 2 3 4 5
4. Managers build corporate trust & goodwill with their subordinates by
negotiating difficult situations in an open environment
1 2 3 4 5
5. Managers facilitate the creation of an organizational culture based on work-
groups and teams in the pursuit of creating new products and services
1 2 3 4 5
6. Structured training programs improve sales staff responsiveness and levels of
customer courtesy
1 2 3 4 5
7. The company’s high customer retention is due to the specialized work of their
customer relationship managers
1 2 3 4 5
8. Company obligations to corporate customers are met in a timely and
individualized manner
1 2 3 4 5
9. Managers are allowed to use flexibility with leave and other time allowances to
control and encourage employee behaviour
1 2 3 4 5
10. Relative to itself, an awareness of the positioning of its competitors in the
market
1 2 3 4 5
11. The company offers higher starting salaries than the industry average 1 2 3 4 5
12. The company uses training and development to improve interpersonal
communication and teamwork
1 2 3 4 5
13. Providing managers with technical skills to decide on the level of training
required to reduce employee skills gaps
1 2 3 4 5
14. The careers of junior employees are developed through the formal mentoring
by experienced staff
1 2 3 4 5
15. Information on how management actively tests its performance against its best
competitors to improve the company’s performance and overall position in the
market
1 2 3 4 5

374
16. Managers readily encourage staff to practice self-confidence and to
demonstrate authority as a result of their own successful management styles
1 2 3 4 5
17. The company hires the best trained graduates in the field 1 2 3 4 5
18. Innovative practices are used to actively and consistently increase market
share
1 2 3 4 5
19. Employees know how their customers want to be treated 1 2 3 4 5
20. Knowledge about the potential for a company to add value through product
and/or business diversification
1 2 3 4 5
21. The company uses targeted marketing campaigns to potential recruits to show
it values the individual achievements of its current star performers
1 2 3 4 5
22. Managers are encouraged to facilitate employees who are proven and
successful risk-takers
1 2 3 4 5
23. The company’s reputation with its current customers has facilitated the
potential to grow its customer base
1 2 3 4 5
24. The company uses in-house employee recruitment officers, with complete
knowledge of the firm’s business, to match appropriate recruits to available roles
1 2 3 4 5
25. Managers are empowered to select, as mentors and role models, employees
who are creative and can make their own decisions without the help of others
1 2 3 4 5
26. The company motivates less competitive employees by linking output to a
highly competitive reward system
1 2 3 4 5
27. Information on how the company uses market intelligence increase its market
share
1 2 3 4 5
28. Managers are empowered to motivate subordinates by offering employee
salaries above the industry average
1 2 3 4 5
29. Specialist external firms provide training to employees with specialized
product knowledge/skills
1 2 3 4 5
30. Whether the company has negotiated long term contracts with customers 1 2 3 4 5
31. Providing managers with share options and other bonuses directly linked to the
output levels of their departments and of their direct subordinates
1 2 3 4 5
32. Organizational synergy, which improves company output, is a result of a
decentralized decision-making process
1 2 3 4 5
33. When surveyed for feedback, the degree of customer satisfaction reported on
the service the company provides in response to their contemporary needs
1 2 3 4 5
34. Weekend workshops are used to improve employee productivity by
encouraging them to broaden their perspective in relation to their work roles
1 2 3 4 5
35. A formal performance appraisal program provides employees with
constructive feedback and remedial intervention
1 2 3 4 5
36. Whether the company has negotiated long term contracts with suppliers 1 2 3 4 5
37. Managers select, as supervisors, employees that demonstrate the ability to use
their imagination to develop original ideas for their market
1 2 3 4 5
38. Whether corporate stakeholders are aware of where the company wants to be
in 3 to 5 years – strategic objective
1 2 3 4 5
39. Information on how the company seeks to predict market trends 1 2 3 4 5
40. The company uses weekly statistical analysis of staff productivity to
encourage employees to reset goals & targets
1 2 3 4 5
Scale: 1 =“Not Important”, 2 =“Less Important”, 3 =“Unsure”, 4 =“Important” and 5 =“Very Important”

375
References
Abdolmohammadi, M. J. (2005). Intellectual market disclosures and market. Journal of
Intellectual Capital, 6(3), 397-416.
Abdul, R., Md, Z., Sambasivan, M., & Johari, J. (2003). The influence of corporate
culture. Journal of Management Development, 22(8), 708-728.
Abeysekera, I., & Guthrie, J. (2004). Human capital reporting in a developing nation: an
analysis of practice. Paper presented at the meeting of the IPA Conference, Madrid,
Spain.
Adelaide Bank Ltd. (2007). 2007 Annual Report. Retrieved April 30, 2008, from
http://www.adelaidebank.com.au/im_a_shareholder/pdfs/Annual_Report_2007.pdf
Agresti, A. & Franklin, C. A. (2009). Statistics – The art and science of learning from
data (2nd ed.). New York, NY: Pearson Prentice Hall.
Ahire, S. L. (1996). Development and Validation of TQM implementation Constructs.
Decision Sciences, 27(1), 23-56.
Alwert, K., Bornemann, M., & Will, M. (2009). Does intellectual capital reporting matter.
Journal of Intellectual Capital, 10(3), 354-368.
Australia New Zealand Banking Group. (2007). ANZ 2007 Annual Report. Retrieved
April 30, 2008, from
http://www.anz.com.au/Documents/AU/Investor/agm/2007/ANZ4588_Annual%
20Report081107_FA2.pdf
Australia, The Treasury. (1999). Making transparency transparent: an Australian
assessment. The Department of Treasury. Australian Government, Treasury.
Canberra.
Australian Stock Exchange. (2005). 2004 The Australian share ownership study. Taking
Stock, 22, 1-2.
Australian Stock Exchange. (2005). Who are the top 200 companies and how to find them.
Retrieved February 24, 2009, from
http://www.asx.com.au/resources/newsletters/taking_stock/20050817_top_200.htm.
Australian Stock Exchange. (2007). 2006 Australian share ownership study. Retrieved
October 3, 2008, from
http://www.shareownership_study_2006_presentation_170507
Ax, C., & Marton, J. (2008). Human capital disclosures and management practices.
Journal of Intellectual Capital, 9(3), 433-455.

376
Bagozzi, R. P., & Phillips, L. W. (1982). Administrative Science Quarterly, 27, 459-489.
Baird, L., & Meshoulam, I. (1988). Managing two fits of strategic human resource.
Academy of Management Review, 13(1), 116-128.
Ballow, J. J., Burhman, R., & Molnar, M. J. (2004). Managing for shareholder value,
future. The Journal of Business Strategy, 25(3), 26-34.
Bank of Queensland Ltd. (2007). Bank of Queensland 2007 Annual Report. Retrieved
April 30, 2008, from http://www.boq.com.au/shareholder_annual_report.htm
Bart, C. K., Bontis, N., & Taggar, S. (2001). A model of the impact of mission statements
on firm performance. Management Decision, 39(1), 19-35.
Becker, G.S. (2005). Human capital. The Concise Encyclopedia of Economics. Retrieved
June 21, 2005, from http://www.econlib.org/library/Enc/HumanCapital.html
Bendigo Bank. (2007). Bendigo Bank Annual Report 2007. Retrieved June 30, 2008, from
http://www.bendigobank.com.au/public/about_us/pdf/Bendigo_Bank_Annual_Revie
w_2007.pdf
Bezemer, D., Dulleck, U., & Frijters, P. (2004). Social capital, creative destruction and
economic growth. London, England: Department of Economics, Imperial College,
University of London.
Blanpain, R. (Ed.). (2007). Comparative Labour Law and Industrial Relations in
Industrialized Market Economies. (9th ed.) The Netherlands: Kluwer Law
International BV.
Bollen, L., Vergauwen, P., & Schnieders, S. (2005). Linking intellectual capital and
intellectual property to company performance. Management Decision, 43(9), 1161-
1185.
Bontis, N. (1998). Intellectual capital: An exploratory study that develops measures and
models. Management Decision, 36(2), 63-76.
Bontis, N. (2002). Intellectual capital disclosure in Canadian corporations. Retrieved
April 11, 2003, from http://www.business.mcmaster.ca/mktg/nbontos/research.htm
Bontis, N., & Fitz-enz, J. (2002). Intellectual capital ROI: A causal map of human capital.
Journal of Intellectual Capital, 3(3), 223-247.
Bozzolan, S., Favotto, F., & Ricceri, F. (2003). Italian annual intellectual capital
disclosure: an empirical analysis. Journal of Intellectual Capital, 4(4), 543-558.
377
Brennan, N. (2001). Reporting intellectual capital in annual reports: evidence from
Ireland. Accounting, Auditing & Accountability Journal, 14(4), 423-436.
Brooking, A. (1996). Intellectual capital: Core assets for the third millennium enterprise.
London, England: Thomson Business Press.
Brown, T. A. (2006). Confirmatory factor analysis for applied research. New York, NY:
Guilford Press.
Bukh, P. N. (2003). The relevance of intellectual capital disclosure: a paradox?
Accounting, Auditing & Accountability Journal, 16(1), 49-56.
Bukowitz, W. R., Chaminade, C., Jensen, H., Roberts, H., & Williams, R. L. (2003). How
to develop and monitor your company’s intellectual capital: tools and actions for the
competency-based organization. Norway, Sweden: Nordic Industrial Fund.
Burgman, R. & Roos, G. (2004, September). The new economy – a new paradigm for
managing for shareholder value. Paper presented at the International IC Congress at
Hanken Business School, Helsinki, Finland.
Burns, R. B., & Burns, R. A. (2008). Business research methods and statistics using SPSS.
London, England: Sage Publications Ltd.
Burstein, F., Zyngier, S., & Rateb, Z. (2002, September). Knowledge Management in the
Financial Services Sector: Understandings and Trends in Australia. Paper presented
at the meeting of the 3rd European Conference on Knowledge Management, Trinity
College Dublin, Ireland.
Byrne, B. M. (2006). Structural equation modeling with EQS: Basic concepts,
applications, and programming (2nd ed.), London, England: Routledge.
Chaminade, C. & Roberts, H. (2003). What it means and what it does: a comparative
analysis of implementing intellectual capital in Norway and Spain. European
Accounting Review, 12(4), 733-751.
Chen, M., Cheng, S., & Hwang, Y. (2005). An empirical investigation of the relationship
between intellectual capital and the firm's market value and financial performance.
Journal of Intellectual Capital, 6(2), 159-176.
CIA. (2010). The World Fact Book. Retrieved November 22, 2010, from
https://www.cia.gov/library/publications/the-world-factbook/geos/as.html
Commonwealth Bank of Australia. (2007). Commonwealth Bank Annual Report 2007.
Retrieved April 30, 2008, from
http://shareholders.commbank.com.au/GAC_File_Metafile/
0,1687,17570%255F2007%252520annual%252520report%252520final,00.pdf

378
Commonwealth Bank of Australia. (2010). Commonwealth Bank Overview. Abstract
retrieved February 10, 2010, from http://www.commbank.com.au/about-us/our-
company/overview
Cortina, L. J. (1993). What is Coefficient alpha? An examination of theory and
applications. Journal of Applied Psychology, 78(1), 98-104.
Daniel, K., Hirshleifer, D., & Subrahmanyam, A. (December, 1998). Investor psychology
and security market under- and overreactions. Journal of Finance, 53(6), 1839-
1885.
Daniel, K., Hirshleifer, D., & Subrahmanyam, A. (2004). Theory of overconfidence, self-
attribution, and security market under- and over-reactions, A. Retrieved February
15, 2011, from http://ideas.repec.org/p/wpa/wuwpfi/0412006.html
Daum, J. H. (2001). How accounting gets more radical in measuring what really matters to
investors [Juergen Daum's Intellectual Capital Accounts]. The New Economy Analyst
report [Electronic version]. Retrieved August 17, 2004, from
http://www.efs.dk/publikationer/rapporter/engvidenregn/kap03001.html
Deloitte & Touche. (2002). Human capital ROI study: Creating shareholder value
through people [The Human Capital Survey Results]. Retrieved September 10, 2005,
from http://www.deloitte.com/dtt/cda/doc/content/HC%20ROI%20Report.pdf.
Deloitte & Touche. (2003). Study confirms blindly latest HR fads can destroy shareholder
value. Retrieved May 1, 2006, from
http://www.deloitte.com/dtt/press_release/0,2309,sid=3566&cid=7247,00.html
Dundon, E. (2002). Seeds of innovation: Cultivating the synergy that fosters new ideas.
New York, NY: American Management Association.
Edvinsson, L., & Malone, M. S. (1997). Intellectual capital: Realising your company’s
true value by finding its hidden brainpower. New York, NY: Harper Collins.
Fernandez, P. (2003). Valuation methods and shareholder value creation. San Diego, CA:
Academic Press.
Fink, E. L., & Monge, P. R. (1985). An exploration of confirmatory factor analysis. In B.
Dervin, & M. J. Voigt (Eds.), Progress in Communication Sciences, 6, 167-197.
Flamholtz, E. G., Bullen, M. L., & Hua, W. (2002). Human resource accounting: a
historical perspective and future implications. Management Decision, 40(10), 947-
954.
Flamholtz, E. G., Searfoss, D. G., & Coff, R. (1998). Developing human resource
379
accounting as a human resource decision support system. Accounting Horizons, 2(3),
1.
Flippo, E. B. (2007). Personnel Management (6th ed.), New York, NY: McGraw-Hill.
Gagné, P., & Hancock, G. R. (2006). Measurement model quality, sample, size, and
solution propriety in confirmatory factor models. Multivariate Behavioral Research,
4(1), 65-83.
Gary, D. (2003). Human Resource Management (9th ed.), China: Prentice Hall.
Gerbing, D. W., & Anderson, J. C. (1988). An updated paradigm for scale development
incorporating unidimensionality and its assessment. Journal of Marketing Research,
25, 186-192.
Gettler, L. (2009, May). When the only way is up. HR Monthly, 12-15.
Goldenberg, K. L. (1996). Using cognitive testing in the design of a business survey. In
Bureau of Labor Statistic. Salt Lake City, UT: American Association for Public
Opinion Research.
Greenbaum, T. L. (1998). The handbook for focus group research (2nd ed.) Thousand
Oaks, CA: Sage Publications Inc.
Grojer, J., & Johanson, U. (1998). Current development in human resource costing and
accounting: Reality present, researchers absent? Accounting, Auditing &
Accountability Journal, 11(4), 495-505.
Gunnigle, P., & Moore, S. (1994). Linking business strategy and human resource
management: Issues and implications. Personnel Review, 23(1), 63-84.
Guthrie, J., Boedker, C., & Cuganesan, S. (2005). The strategic significance of intellectual
capital information in annual reporting. Macquarie Graduate School of Management
Working Papers in Management 2005, 3.
Guthrie, J., Johanson, U., Bukh, P. N., & Sanchez, P. (2003). Intangibles and the
transparent enterprise: New strands of knowledge. Journal of Intellectual Capital,
4(4), 429-440.
Guthrie, J., Petty, R., & Ricceri, F. (2006). The voluntary reporting of intellectual capital:
comparing evidence from Hong Kong and Australia. Journal of Intellectual Capital,
5(2), 254-271.
Guthrie, J., Petty, R., & Ricceri, F. (2000). Intellectual capital: Australian annual reporting
practices. Journal of Intellectual Capital, 1(3), 241-251.

380
Holland, J. (2003). Intellectual capital and the capital market – organisation and
competence. Accounting, Auditing & Accountability Journal, 16(1), 39 – 48.
Holliday, K. K. (1994, August). Annual reports as marketing tools. Bank Marketing.
Retrieved May 17, 2007 from http://www.allbusiness.com/finance/455245-1.html
Horwitz, F. M. (1999). The emergence of strategic training and development: The current
state of play. Journal of European Industrial Training, 23(4/5), 180-190.
Howe, M. J., Davidson, J. W., & Sloboda, J. A. (1998). Innate gifts and talents: Reality or
myth? Behavioral and Brain Sciences, 21, 399-442.
Hunter, J. E., & Gerbing, D. W. (1982). Unidimensional measurement, second order
factor analysis, and causal models. Research in Organizational Behaviour, 4, 267-
320.
Huselid, M. A., Jackson, S. E., & Schuler, R. S. (1997). Technical and strategic human
resource management effectiveness as determinants of firm performance. Academy
of Management Journal, 40(1), 171-189.
Investorwords.com. (2009). Institutional investor – definition. Retrieved May 19, 2009,
from http://www.investorwords.com/2504/institutional_investor.html
ITS. (2010). Psychology Dictionary and Glossary for Students. Retrieved 13 May 2010,
from http://www.tuition.com.hk/psychology/
Jarrard, B. (2007). Innovation: Does it really pay? Mindwerx International. Retrieved May
21, 2007, from http://mindwerx.com/portal/images/stories/innovation_-
_does_it_really_pay.pdf
Johanson, U. (2005). A human resource perspective on intellectual capital. Perspectives
on Intellectual Capital: Multidisciplinary insights into management, measurement,
and reporting, Marr, B. (Ed.), Elsevier Butterworth-Heinemann Ltd. USA: Boston,
MA.
Joreskog, K. G. & Sorbom, D. (1984). Advances in factor analysis and structural equation
models. Lanham, MD: University Press of America.
Kaplan, R. S., & Norton, D. P. (2004). Strategy maps: Converting intangible assets into
tangible outcomes. Boston, MA: Harvard Business School Publishing Corporation.
Kaplan, R. S., & Norton, D. P. (1993, September-October). Putting the balanced scorecard
to work. Harvard Business Review, 71(5), 134-147.
Kaplan, R. S., & Norton, D. P. (1992). The balanced scorecard- Measures that drives
performance. Harvard Business Review, 70(1), 71-79.

381
Kaplan, R. S., & Sucuzzo, D. P. (1993). Psychological Testing: Principles, Applications
and Issues. Pacific Grove, CA: Brookes Cole.
Keane, A. (2008). Tips for mum and dad investors. Adelaide Now. Retrieved December
14, 2008, from
http://www.news.com.au/adelaidenow/money/story/0,26907,24802999-
5017247,00.html
Kelly, G. A. (1955). The Psychology of Personal Constructs. New York, NY: Norton.
Kirn, S. P., Rucci, A. J., Huselid, M. A., & Becker, B. E. (1999). Strategic human
resource management at Sears. Human Resource Management Journal, 38(4), 329-
335.
Kotter, J. P. (1996). Leading Change. Boston, MA: Harvard Business School Press.
Koutsoukis, J. (2007). Coonan the barbarian. The Age Newspaper. Retrieved October 7,
2007, from http://www.theage.com.au/news/opinion/coonan-the-
barbarian/2007/10/06/1191091423691.html
Krueger, R. A., & Casey, M. A. (2000). Focus groups: a practical guide to applied
research (3rd ed.) Thousand Oaks, CA: Sage Publications Inc.
Lado, A. A., & Wilson, M. C. (1994). Human resource systems and sustained competitive
advantage: A competency-based perspective. The Academy of Management Review,
19(4), 699-727.
Lang, M., & Lundholm, R. (1993). Human resource systems and sustained competitive
advantage: A competency-based perspective. Journal of Accounting Research, 31(2),
246-271.
Lev, B. (2001). Intangibles. Management, Measurements and Reporting. Washington,
DC: Brookings Institute.
Lev, B., & Daum, J. H. (2004). The dominance of intangible assets: Consequences for
enterprise management and corporate reporting. Measuring Business Excellence,
8(1), 6-17.
Lin, N., Cook, K. S., & Burt, R. S. (2001). Social capital: theory and research. New Brunswick,
NJ: Transaction Publishers.
Luoma, M. (2000). Developing people for business success: Capability-driven HRD in
practice. Management Decision, 28(3), 145-153.
Lynn, B. E. (1998). Performance evaluation in the new economy: bringing the
measurement and evaluation of intellectual capital into the management planning
and control system. International Journal of Technology Management, 16(1-3), 162-

382
176.
Malkiel, B. G. (2003). The efficient market hypothesis and its critics. Journal of Economic
Perspectives, 17(1), 59-82.
Manville, B. (2003). Making sense of human capital economics. Chief Learning Officer.
Retrieved April 12, 2006, from
http://www.clomedia.com/content/templates/clo_feature_hc.asp?articleid=298&zone
id=56
Marschan-Piekkari, R., & Welch, C. (2004). Handbook of qualitative research methods
for international business. Cheltenham, UK: Edward Elgar Publishing Limited.
Montana, P., & Charnov, B. (2008). Management (4th ed.) Hauppauge, NY: Barrons
Educational Series.
Morgan, G. (1997). Images of organization. Thousand Oaks, CA: Sage Publications.
Mouritsen, J., Bukh, P.N., & Barr, B. (2004). Reporting on intellectual capital: why, what
and how. Measuring Business Excellence. 8(1), 46-54.
Naidu, S. (2008). Mum and dad index. Future Nest Egg. Retrieved July 9, 2008, from
http://www.futurenestegg.com/mum-and-dad-index/
National Australia Bank Ltd. (2007). National Australia Bank 2007 Annual Financial
Report. Retrieved April 30, 2008, from
http://www.nabgroup.com/vgnmedia/downld/NAB2007AFR.pdf
Nunnally, J. (1998). Psychometric Theory. New York, NY: McGraw-Hill.
Olsson, B. (2001). Annual reporting practices: information about human resources in
corporate annual reports in major Swedish companies. Journal of Human Resource
Costing and Accounting, 6(1), 39-52.
Organization for Economic Co-operation and Development (OECD). (2007). OECD
Science, Technology and Industry Scoreboard 2007. Retrieved January 22, 2009,
from http://www.oecd.org/dataoecd/42/34/2087188.pdf
Oxford University Press (1989). Oxford English Dictionary (2nd ed.). Retrieved
October 30, 2006, from http://dictionary.oed.com.ezproxy1.acu.edu.au
Petty, R., & Cuganesan, S. (2005). Voluntary disclosure of intellectual capital by Hong
Kong companies: Examining size, industry, and growth effects over time. Australian
Accounting Review, 15(36), 40-50.
Petty, R., & Guthrie, J. (2000). Intellectual capital literature review: measurement,

383
reporting and management. Journal of Intellectual Capital, 1(2), 155-176.
Petty, R., Ricceri, F., & Guthrie, J. (2008). Intellectual capital: A user’s perspective.
Management Research News, 13(6), 434-447.
Raykov, T. (1998). On the use of confirmatory factor analysis in personality research.
Personality and Individual Differences, 24(2), 291-293.
RBC Royal Bank. (2001). Knowledge-based industries. Retrieved August 7, 2004, from
http://www.royalbank.com/kbi/index.html
Reserve Bank of Australia. (February, 2007). Statement on Monetary Policy – February,
2007. Retrieved January 24, 2009, from
http://www.rba.gov.au/PublicationsAndResearch/StatementsOnMonetaryPolicy/Feb
2007/international_fx_markets.html
Rimmel, G. (2003). Human resource disclosures: A comparative study of annual
reporting practice about information, providers and users in two Corporations.
Goteborg: Sweden: Gunnar Rimmel.
Robison, L., Schmid, A., & Siles, M. (2002). Is social capital really capital? Review of
Social Economy. 60(1), 1-21.
Roos, G., & Roos, J. (1997). Measuring your company's intellectual performance. Long
Range Planning, 30(3), 413-426.
Roth, M. (2008, June). Sydney Morning Herald. Retrieved July 2, 2008, from
http://www.smh.com.au/news/investment/parental-
supervisionrequired/2008/06/30/1214677
Royal, C., & O'Donnell, L. (2008). Differentiation in financial markets: the human capital
approach. Journal of Intellectual Capital, 9(4), 668-683.
Royal, C., & O'Donnell, L. (2004). Rating the human factor: Why it matters in the
investment process. Journal of Banking and Financial Services, 118(3), 14-16.
Rubio, D. M., Berg-Weger, M., & Tebb, S. S. (2001). Using structural equation modeling
to test for multidimensionality. Structural Equation Modeling: A Multidisciplinary
Journal, 8(4), 613-626.
Sáenz, J. (2005). Human capital indicators, business performance and market-to-book
ratio. Journal of Intellectual Capital, 6(3), 374-384.
Schuler, R. S., & Jackson, S. E. (1987). Linking competitive strategies with human
resource management practices. Academy of Management Executive, 1(3), 207-219.

384
Sonnenberg, F. K. (1994). Managing with a conscience. Sydney, NSW: McGraw-Hill.
St.George Bank Limited and its Controlled Entities (2007). St.George Bank Limited and
its Controlled Entities Annual Report for the year ended 30 September 2007.
Retrieved April 30, 2008, from
http://202.66.146.82/listco/au/stgeorge/final/2007/ar2007.pdf
Stockley, D. (2005). Human capital concept – definition and explanation. Retrieved
February 1, 2007 from http://derekstockley.com.au/newsletters-05/018-human-
capital.html
Sveiby, K. E. (1998). Intellectual capital: Thinking ahead. Australian CPA, 68(5), 18-21.
Sveiby, K. E. (1997). The new organizational wealth: Managing and measuring
knowledge based assets. San Francisco, CA: Berret-Koehler.
Sveiby, K. E. (1989). The invisible balance sheet. Stockholm, Sweden:
Affarsvarlden/Ledarskap.
Tanaka, J. S., & Huba, G. J. (1985). A fit index for covariance structure models under
arbitrary GLS estimation. British Journal for Mathematical and Statistical
Psychology, 38(2), 197-201.
Van Bergen, J. (2004). Working through the Efficient Market Hypothesis. Retrieved 13
February, 2010 from http://www.investopedia.com/articles/basics/04/022004.asp
Venkatraman, N., & Grant, J. H. (1986). Construct Management in Strategy Research: A
Critique and Proposal. Academy of Management Review, 11(1), 71-86.
Verreault, D. A., & Hyland, M. (2005). Evidence for increasing the focus on strategic risk
in HRM audits. Managerial Accounting Journal, 20(5), 524-543.
Wei, L. Q. (2006). Strategic human resource management: Determinants of fit. Research
and Practice in Human Resource Management, 14(2), 49-60.
Westpac (2007). Westpac 2007 Annual Report. Retrieved April 30, 2008, from
http://www.westpac.com.au/manage/pdf.nsf/219440A569DE3FB6CA25738D0018A
60D/$File/WAR2007_AnnualReport.pdf?OpenElement
Wright, P. M., & McMahan, G. C. (1992). Theoretical perspectives for strategic human
resource management. Journal of Management, 18(2), 295-320.