Embed Size (px)
Citation preview

Fourteenth International Water Technology Conference, IWTC 14 2010, Cairo, Egypt
221
HUMAN IMPACTS ON NILE RIVER MORPHOLOGY
Yasser Raslan
Assistant Professor, Nile Research Institute, National Water Research Center, Egypt E-mail: [email protected]
ABSTRACT This paper shows the impacts of human interference on Nile River morphology. A roadway culvert was constructed to connect an island on Nile River to the eastern bank of the Nile had altered river morphology in the vicinity of the island. The paper focuses on, 1) the efficiency of the roadway culvert to pass the normal flow, and 2) the impact of the roadway culvert on river morphology. A one-dimension mathematical model was applied to estimate the flow characteristics and the efficiency of the roadway culvert. It was found that the culvert passes 4% of the flow that would had passed through the eastern branch if the culvert were not existed. As a result, the flow rate in the western channel had increased. Analysis of data indicated changes in river morphology in terms of erosion and sedimentation. In order to restore the efficiency of the eastern channel and to eliminate the side effects of the roadway culvert, a bridge is proposed to replace the roadway culvert. In this case, model results indicated improvements in the hydraulic conditions. Keywords: Islands, Morphology, Nile River 1. INTRODUCTION Natural rivers and alluvial canals are sensitive to human interference which may change rate of sediment transport and flow rate. Human interference may take several forms. Among these forms are; bank protection, dredging for navigation, bridge crossing, and barrages. Side effects of man-induced development can be avoided or alleviated if these structures were properly designed and executed. Man-induced channel changes had been addressed in numerous research papers. Simons et al. [1] studied the changes in the Platte Rivers which include South Platte, North Platte, and Platte River due to the construction of numerous bridges and other structures since 1800s. They found out that the Platte Rivers had been significantly narrowed over the nineteenth and twentieth century. As far as the reduction in flow discharge is concerned, Leopold et al. [2] addressed the relationship between channel size and the bankfull discharge. The reduction in the bankfull discharge reduced the channel size. Zhou et al. [3] investigated development in the Lower Yellow River. The Yellow River is known for its high sediment transport rate. It was observed that levees construction led to the development of the elevated channel above the riparian lands outside levees. Since the river had a high rate of sediment transport, the amplitude of

Fourteenth International Water Technology Conference, IWTC 14 2010, Cairo, Egypt 222
channel adjustment was very large compared with other rivers. Billi et al. [4] studied the human impacts on sediment yield in the Arno River in Italy. Man-made structures reduced sediment yield, as a result, degradation of river bed took place. Liriano et al. [5], conducted laboratory experiment to study scour at culvert outlet. They concluded that flow in the scour holes downstream culvert was similar to flow downstream of dunes found in open-channel flow and down-stream of a backward facing step. Impacts of water resources project on Nile River morphology was also addressed by Elmoattassem [6]. This paper addresses the impacts of roadway culvert on Nile River morphology. Field observations indicated that roadway culverts exist at several locations along the Nile. The roadway culvert under investigation herein is located at Sannour Island which is located at a distance between 124.23 kilometer and 127.65 kilometer from the upstream of Elrodah gage. This structure was constructed to connect Sannour Island to the eastern bank of the Nile River (Map 1). Observations indicated a rise in the water level upstream the roadway culvert, in addition, stagnant flow was observed in the downstream of the culvert. Field investigation along with available data which include bathymetric charts, and hydrology data were used in the investigation. A one-dimensional mathematical model was applied to analyze the flow in the eastern and western branches of Sannour Islands. Based on the comparison of bathymetric data of 1982 and 2003, the morphological changes in the study reach were assessed.
Map (1) Study Area
2. HYDROLOGICAL CONDITIONS AT SANNOUR ISLAND In order to estimate the maximum flow rate in the study reach, hydrology of the Nile River in the fourth reach which extends between Assiut and Delta Barrage was under investigation. Flow rate in the fourth reach is measured at Assiut Barrage which is located 248 kilometer upstream Sannour Island. Figure 1 shows the flow rate variation with time for the period between 1995 and 2007. The figure indicates that flow rate topped 180 million m3/day four times during this period. Table 1 and Figure 2 show

Fourteenth International Water Technology Conference, IWTC 14 2010, Cairo, Egypt
223
flow duration. From Figure 2 the exceeding probability for flow rate of 180 million m3/day is 1.4%, while, the maximum flow rate occurred during this period was 183 million m3/day. The flow in this reach is characterized by gain in the discharge. These gains are attributed to agriculture drains and ground water inflow to the fourth reach. As reported in River Regime of the Nile in Egypt [7], the net gain in the fourth reach is 1.8% of total flow rate during the maximum flow for the period between 1969 and 1988. In this paper, maximum flow rate of 185 million m3/day at Sannour Island was considered in the analysis.
Table 1 Discharge Exceeding Probability
Discharge (million m3/day) Exceeding Probability 167.25 10%
151 25% 99.52 50% 76.9 75% 59 90%
Figure (1) Variation of Flow Rate with Time Downstream Assiut Barrage
Figure (2) Flow Duration Downstream Assiut Barrage
Fourteenth International Water Technology Conference, IWTC 14 2010, Cairo, Egypt 224
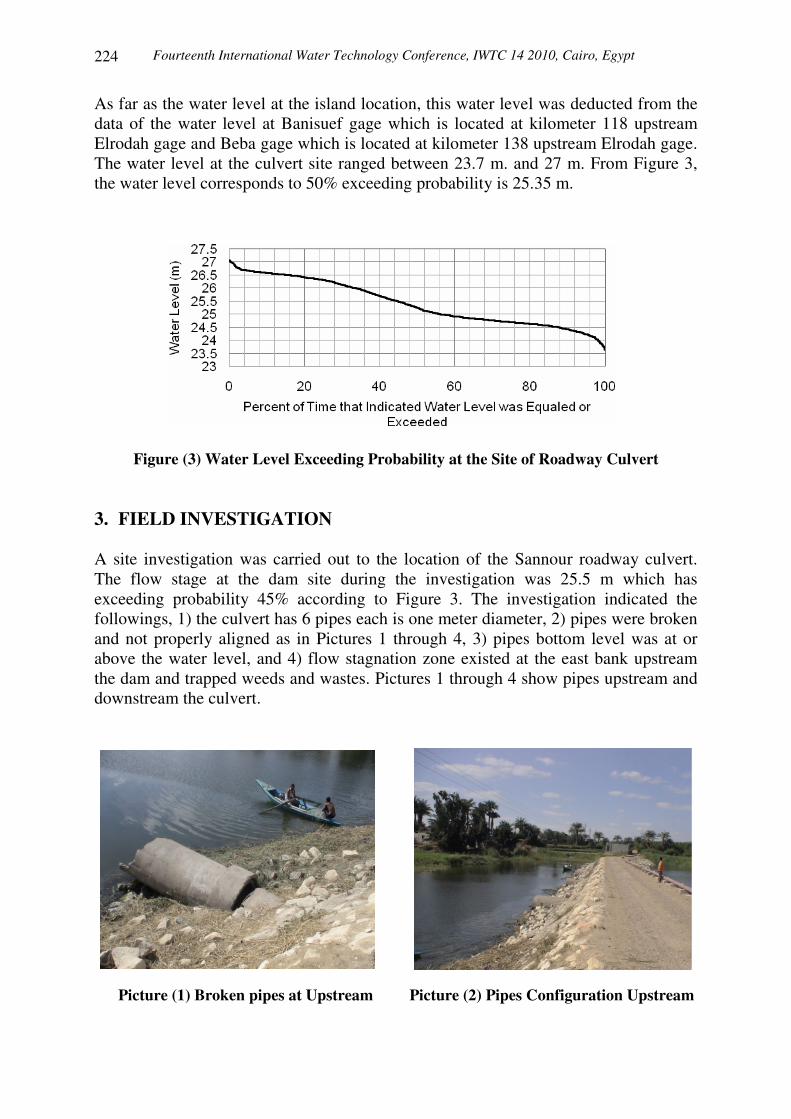
As far as the water level at the island location, this water level was deducted from the data of the water level at Banisuef gage which is located at kilometer 118 upstream Elrodah gage and Beba gage which is located at kilometer 138 upstream Elrodah gage. The water level at the culvert site ranged between 23.7 m. and 27 m. From Figure 3, the water level corresponds to 50% exceeding probability is 25.35 m.
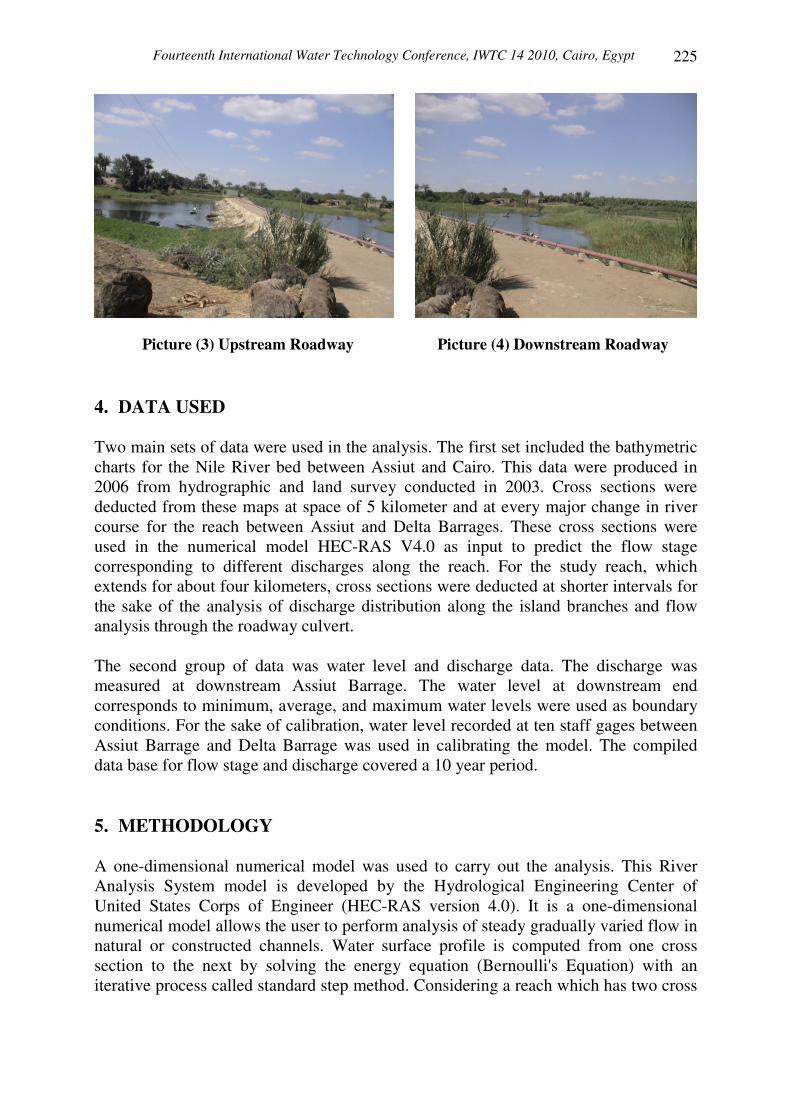
Figure (3) Water Level Exceeding Probability at the Site of Roadway Culvert 3. FIELD INVESTIGATION A site investigation was carried out to the location of the Sannour roadway culvert. The flow stage at the dam site during the investigation was 25.5 m which has exceeding probability 45% according to Figure 3. The investigation indicated the followings, 1) the culvert has 6 pipes each is one meter diameter, 2) pipes were broken and not properly aligned as in Pictures 1 through 4, 3) pipes bottom level was at or above the water level, and 4) flow stagnation zone existed at the east bank upstream the dam and trapped weeds and wastes. Pictures 1 through 4 show pipes upstream and downstream the culvert.
Picture (1) Broken pipes at Upstream Picture (2) Pipes Configuration Upstream
Fourteenth International Water Technology Conference, IWTC 14 2010, Cairo, Egypt
225
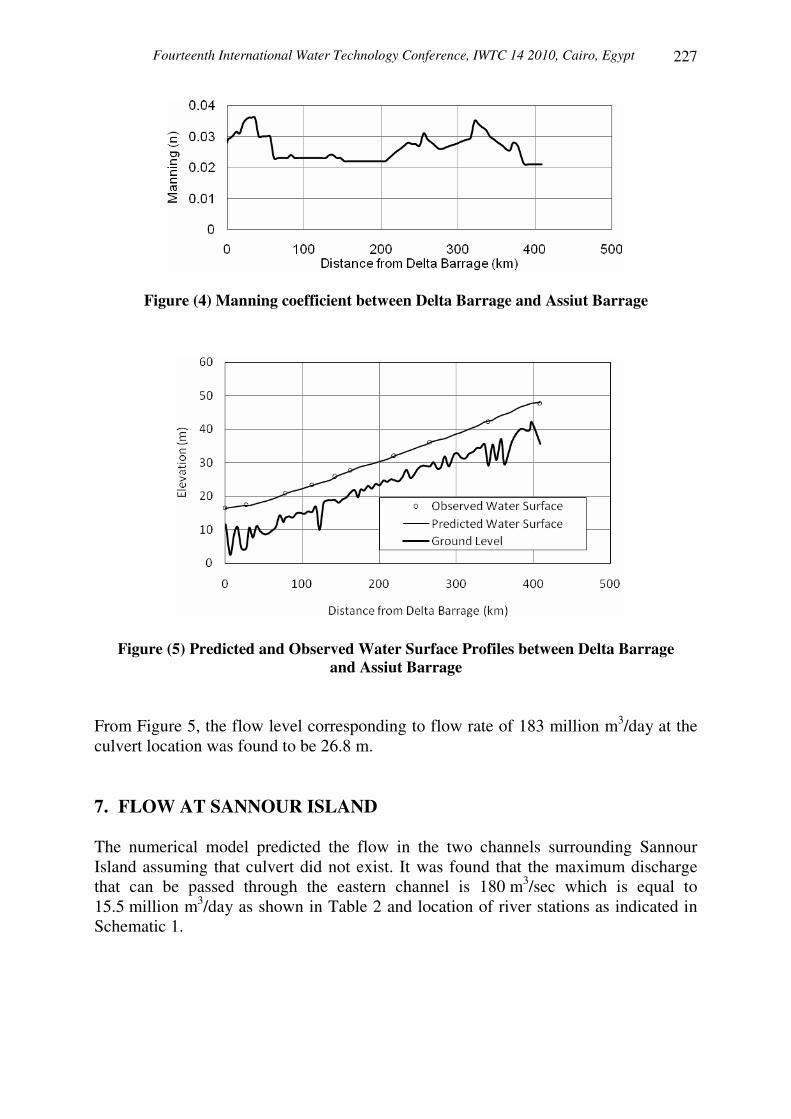
Picture (3) Upstream Roadway Picture (4) Downstream Roadway 4. DATA USED Two main sets of data were used in the analysis. The first set included the bathymetric charts for the Nile River bed between Assiut and Cairo. This data were produced in 2006 from hydrographic and land survey conducted in 2003. Cross sections were deducted from these maps at space of 5 kilometer and at every major change in river course for the reach between Assiut and Delta Barrages. These cross sections were used in the numerical model HEC-RAS V4.0 as input to predict the flow stage corresponding to different discharges along the reach. For the study reach, which extends for about four kilometers, cross sections were deducted at shorter intervals for the sake of the analysis of discharge distribution along the island branches and flow analysis through the roadway culvert. The second group of data was water level and discharge data. The discharge was measured at downstream Assiut Barrage. The water level at downstream end corresponds to minimum, average, and maximum water levels were used as boundary conditions. For the sake of calibration, water level recorded at ten staff gages between Assiut Barrage and Delta Barrage was used in calibrating the model. The compiled data base for flow stage and discharge covered a 10 year period. 5. METHODOLOGY A one-dimensional numerical model was used to carry out the analysis. This River Analysis System model is developed by the Hydrological Engineering Center of United States Corps of Engineer (HEC-RAS version 4.0). It is a one-dimensional numerical model allows the user to perform analysis of steady gradually varied flow in natural or constructed channels. Water surface profile is computed from one cross section to the next by solving the energy equation (Bernoulli's Equation) with an iterative process called standard step method. Considering a reach which has two cross

Fourteenth International Water Technology Conference, IWTC 14 2010, Cairo, Egypt 226
sections 1 in the upstream and 2 in the downstream, the energy equation is written as follows:
ehgVa
YZgVa
YZ +++=++22
211
11
222
22 (1)
where: Z1, Z2 are elevation of the main channel inverts at cross section 1 and 2
Y1, Y2 are the depths of water at cross sections 1 and 2 V1, V2 are the average velocities (total discharge/total flow area) at cross
sections 1 and 2 a1, a2 are the energy coefficients at cross sections 1 and 2 g is the gravitational acceleration, and he is the energy loss
The model inputs were, 1) cross sections deducted from contour maps of 2003 which were produced by the Nile Research Institute, and 2) discharges at the upstream end and water level at the downstream end of the studied reach. The model was calibrated against real data which were available from gages at a number of locations. First, the model was applied to predict the flow stage between Assiut Barrage and Delta Barrage. Then, the same model was applied again to investigate the hydrological conditions of Sannour island reach which extends for 8 kilometers between kilometer 122 and kilometer 130 upstream Elrodah staff gage. This reach included Sannour Island which stretches between kilometer 124.23 and kilometer 127.65 upstream Elrodah gage. The third stage in the analysis was to use the program to find out the discharge that would have been passed through the eastern branch if the culvert were not existed. Finally, the model was applied to predict the flow that passes through the currently designed culvert. 6. PREDICTED WATER SURFACE BETWEEN ASSIUT AND CAIRO Calibration was carried out at ten staff gages along the reach. Manning coefficient (n) was adjusted at every cross section to match the predicted water surface profile with the observed water surface profile. The Manning coefficient (n) corresponding to the calibrated water surface profile ranged between 0.021 and 0.036 as shown in Figure 4. Figure 5 shows the plot of water surface profile as predicted by the model between Assiut and Delta Barrages and the observed water surface (OWS) at the ten staff gages.
Fourteenth International Water Technology Conference, IWTC 14 2010, Cairo, Egypt
227
Figure (4) Manning coefficient between Delta Barrage and Assiut Barrage
Figure (5) Predicted and Observed Water Surface Profiles between Delta Barrage and Assiut Barrage
From Figure 5, the flow level corresponding to flow rate of 183 million m3/day at the culvert location was found to be 26.8 m. 7. FLOW AT SANNOUR ISLAND The numerical model predicted the flow in the two channels surrounding Sannour Island assuming that culvert did not exist. It was found that the maximum discharge that can be passed through the eastern channel is 180 m3/sec which is equal to 15.5 million m3/day as shown in Table 2 and location of river stations as indicated in Schematic 1.
Fourteenth International Water Technology Conference, IWTC 14 2010, Cairo, Egypt 228
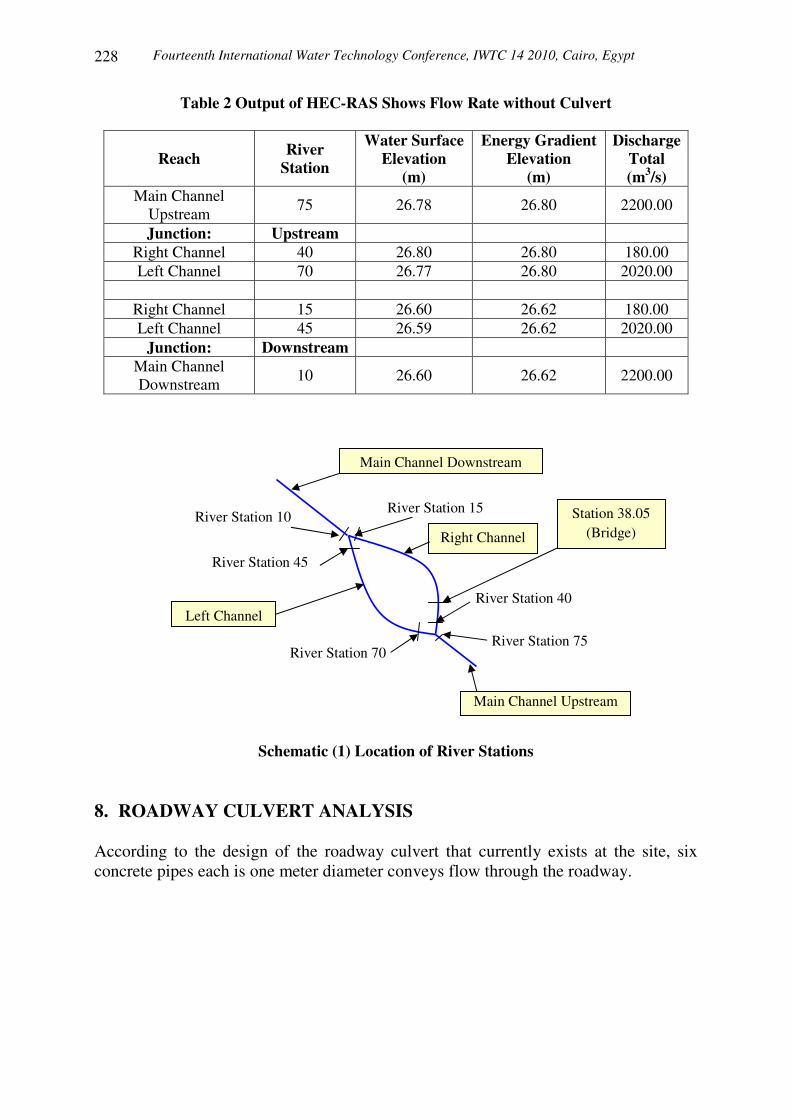
Table 2 Output of HEC-RAS Shows Flow Rate without Culvert
Reach River Station
Water Surface Elevation
(m)
Energy Gradient Elevation
(m)
Discharge Total (m3/s)
Main Channel Upstream 75 26.78 26.80 2200.00
Junction: Upstream Right Channel 40 26.80 26.80 180.00 Left Channel 70 26.77 26.80 2020.00
Right Channel 15 26.60 26.62 180.00 Left Channel 45 26.59 26.62 2020.00
Junction: Downstream Main Channel Downstream 10 26.60 26.62 2200.00
Schematic (1) Location of River Stations 8. ROADWAY CULVERT ANALYSIS According to the design of the roadway culvert that currently exists at the site, six concrete pipes each is one meter diameter conveys flow through the roadway.
Main Channel Upstream
Main Channel Downstream
Right Channel
Left Channel
River Station 75 River Station 70
River Station 40
River Station 10
River Station 45
River Station 15 Station 38.05 (Bridge)

Fourteenth International Water Technology Conference, IWTC 14 2010, Cairo, Egypt
229
Figure (6) Flow Analyses in Case of Culvert as Predicted from the Mathematical Model The analysis using the numerical model indicated that current configuration of culvert allows only a discharge of 7 m3/sec which is equivalent to 0.6 million m3/day. Water surface profile and energy gradient is as shown in Figure 6. Also, heading up of 19 cm occurred upstream the culvert as shown Table 3.
Table 3 Output of HEC-RAS Shows Flow Rate in the Existing Culvert
Reach River Station
Water Surface Elevation
(m)
Energy Gradient Elevation
(m)
Discharge Total (m3/s)
Main Channel Upstream 75 26.81 26.83 2200.00
Junction: Upstream Right Channel 40 26.81 26.81 7.00 Left Channel 70 26.80 26.83 2193.00
Right Channel 15 26.62 26.62 7.00 Left Channel 45 26.59 26.62 2193.00
Junction: Downstream Main Channel Downstream 10 26.60 26.62 2200.00
The maximum number of pipes that can be added to fit the cross section is 12 pipes each is 2 meters diameter. This configuration had been used to run the model. The model showed that the maximum flow that can pass through the culvert is 45 m3/sec (3.9 million m3/day), which is far less than the flow that can be passed through the eastern branch as shown in Table 4.

Fourteenth International Water Technology Conference, IWTC 14 2010, Cairo, Egypt 230
Table 4 Output of HEC-RAS Shows Flow Rate in Case of 12 Pipes Culvert
Reach River Station
Water Surface Elevation
(m)
Energy Gradient Elevation
(m)
Discharge Total (m3/s)
Main Channel Upstream
75 26.81 26.82 2200.00
Junction: Upstream Right Channel 40 26.75 26.75 45.00 Left Channel 70 26.79 26.82 2155.00
Right Channel 15 26.62 26.62 45.00 Left Channel 45 26.59 26.62 2155.00
Junction: Downstream Main Channel Downstream 10 26.60 26.62 2200.00
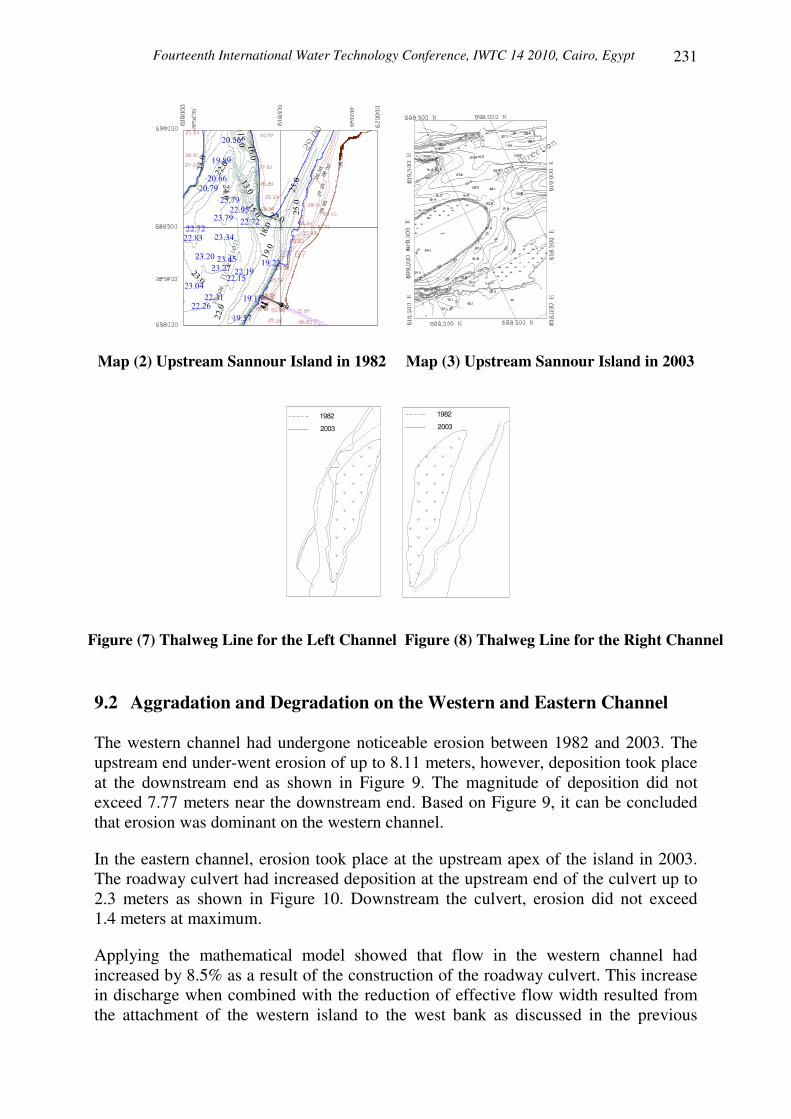
9. CHANGE IN CHANNEL MORPHOLOGY Two sets of data were used for comparing the situation before and after the construction of the Sannour roadway culvert. The first set was the data available from bathymetric charts of 1982 at scale 1:5000 and were produced for the Nile Research Institute. The second set was the recent hydrographic survey carried out by Nile Research Institute at scale 1:5000 in 2003 and published in 2006. Cross sections and thalweg line were deducted from the bathymetric charts and used in the analysis. 9.1 Thalweg Line The most significant changes in river morphology took place in the western bank at the upstream end of the study reach (Maps 2 and 3). An island existed in 1982 in the western channel was attached to the western bank at its upstream end in 2003. That is, the effective flow width had dropped significantly. The attachment of island can be in part attributed to channel adjustments in this region, since upstream the study reach the river tends to follow a straight path. Disappearance of the island and the reduction of flow in the eastern branch of Sannour island had increased the flow in the western channel and had changed the location of the thalweg line in the western channel. The thalweg line follows a path very close to the eastern bank. Then, shifts towards the western bank towards the downstream of the island length, Figure 7. The thalweg line location had not changed significantly in the eastern channel. The location of the thalweg line of 2003 coincided with that of 1982 except at the middle of the channel where the thalweg line of 1982 was close to the eastern bank as shown in Figure 8.
Fourteenth International Water Technology Conference, IWTC 14 2010, Cairo, Egypt
231
Map (2) Upstream Sannour Island in 1982 Map (3) Upstream Sannour Island in 2003
1982
2003
1982
2003
Figure (7) Thalweg Line for the Left Channel Figure (8) Thalweg Line for the Right Channel 9.2 Aggradation and Degradation on the Western and Eastern Channel The western channel had undergone noticeable erosion between 1982 and 2003. The upstream end under-went erosion of up to 8.11 meters, however, deposition took place at the downstream end as shown in Figure 9. The magnitude of deposition did not exceed 7.77 meters near the downstream end. Based on Figure 9, it can be concluded that erosion was dominant on the western channel. In the eastern channel, erosion took place at the upstream apex of the island in 2003. The roadway culvert had increased deposition at the upstream end of the culvert up to 2.3 meters as shown in Figure 10. Downstream the culvert, erosion did not exceed 1.4 meters at maximum. Applying the mathematical model showed that flow in the western channel had increased by 8.5% as a result of the construction of the roadway culvert. This increase in discharge when combined with the reduction of effective flow width resulted from the attachment of the western island to the west bank as discussed in the previous

Fourteenth International Water Technology Conference, IWTC 14 2010, Cairo, Egypt 232
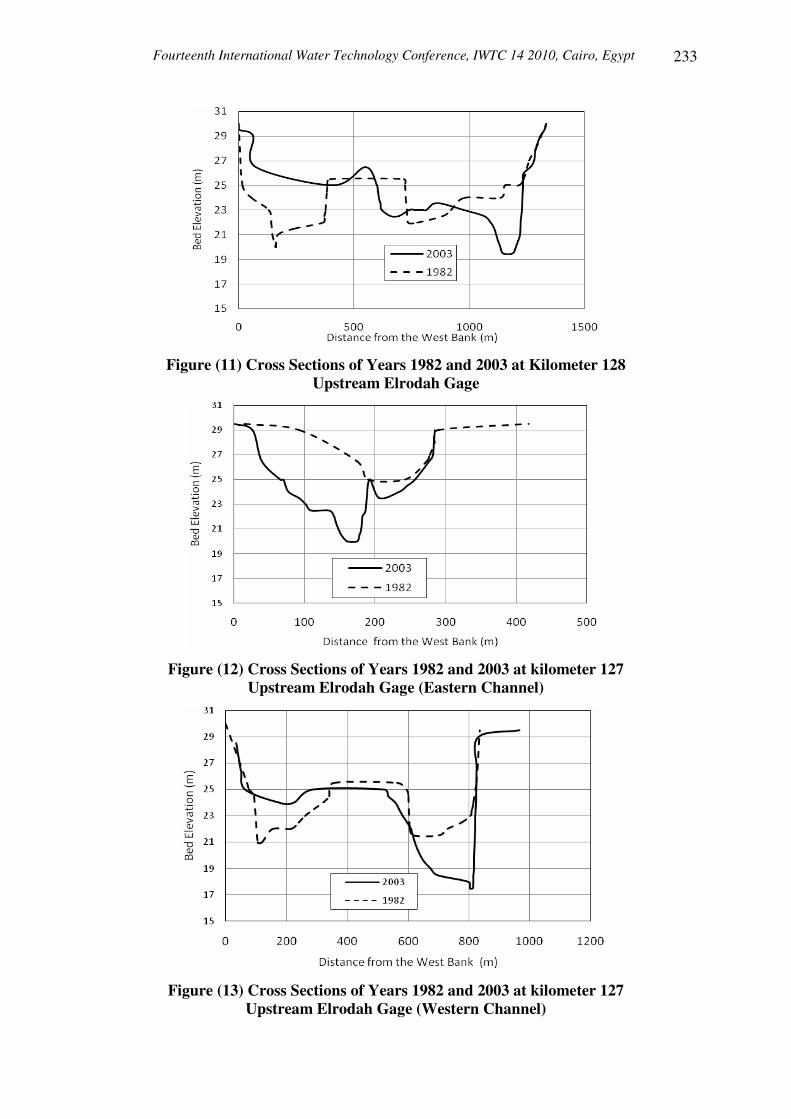
section, resulted in the increase in bed particles mobility and bed erosion in the western channel. Aggradation in the west bank of the western channel had forced the flow to change its course towards the east bank and increased the incision near the east bank as in Figure 9. It can be concluded that the existing of roadway culvert and extensive deposition on the west bank of the main channel (Figure 11) had accelerated the erosion in the west channel of Sannour Island. The flow in the western channel was in the process to accommodate a new location for the thalweg line towards the east bank, thus, possible future erosion in the east bank. Despite the erosion in the east channel, flow in the east channel was stagnant and weeds can be observed covering wide area in the east bank. The roadway caused significant deposition in the upstream of the roadway. The presence of weeds may trap sediment in the future which may lead to the clogging of the branch. Figures 11 through 13 show cross sections of years 1982 and 2003 at kilometers 127 and 128 upstream Elrodah gage. Locations of these cross sections are identified in Map 1.
Figure (9) Thalweg Lines of Years 1982 and 2003 for the Western Branch at Sannour Island
Figure (10) Thalweg Lines of Years 1982 and 2003 for the Eastern Branch at Sannour Island
Fourteenth International Water Technology Conference, IWTC 14 2010, Cairo, Egypt
233
Figure (11) Cross Sections of Years 1982 and 2003 at Kilometer 128 Upstream Elrodah Gage
Figure (12) Cross Sections of Years 1982 and 2003 at kilometer 127 Upstream Elrodah Gage (Eastern Channel)
Figure (13) Cross Sections of Years 1982 and 2003 at kilometer 127 Upstream Elrodah Gage (Western Channel)

Fourteenth International Water Technology Conference, IWTC 14 2010, Cairo, Egypt 234
10. ALTERNATIVE SOLUTION Modification of the existing culvert by increasing the pipes to 12 pipes and increasing the diameter to 2 meters did not significantly increase the flow to the eastern channel. Therefore, replacing the culvert by bridge might be considered as an alternative solution. The HEC-RAS model is used to test this alternative. The proposed bridge has a width of 9 meters, two piers, and two abutments. This configuration will create three bridge openings (Figure 14) at station 38.05 which is located as indicated in Schematic 1. The model results showed that present configuration can handle the maximum flow of 180 m3/sec. Figure 15 shows that the heading-up during the maximum flow will not exceed 10 cm as a result of the bridge as shown in Table 5.
Table 5 Output of HEC-RAS Shows Flow Rate and Heading-up (Delta EG)
Reach River Station
Min Elevation Pressure
(m)
Bridge Open Area (m2)
Total Discharge
(m3/s)
Min Elevation Weir Flow
(m)
Discharge Weir (m3/s)
Delta Energy
Gradient (m)
Right Channel 38.05 26.88 28.00 373.50 180.00 28.98 0.01
1000 1050 1100 1150 1200 1250 13002324252627282930
RS=38.05 Upstream (Bridge)
Ele
vatio
n (m
)
Legend
Ground
Ineff
Bank Sta
1000 1050 1100 1150 1200 1250 13002324252627282930
RS=38.05 Dow nstream (Br idge)
Station (m)
Ele
vatio
n (m
)
Figure (14) Cross Sections of the Proposed Bridge
RS is the River Station, Ineff is the Ineffective Flow Area, and Bank Sta is the Bank Station
Fourteenth International Water Technology Conference, IWTC 14 2010, Cairo, Egypt
235
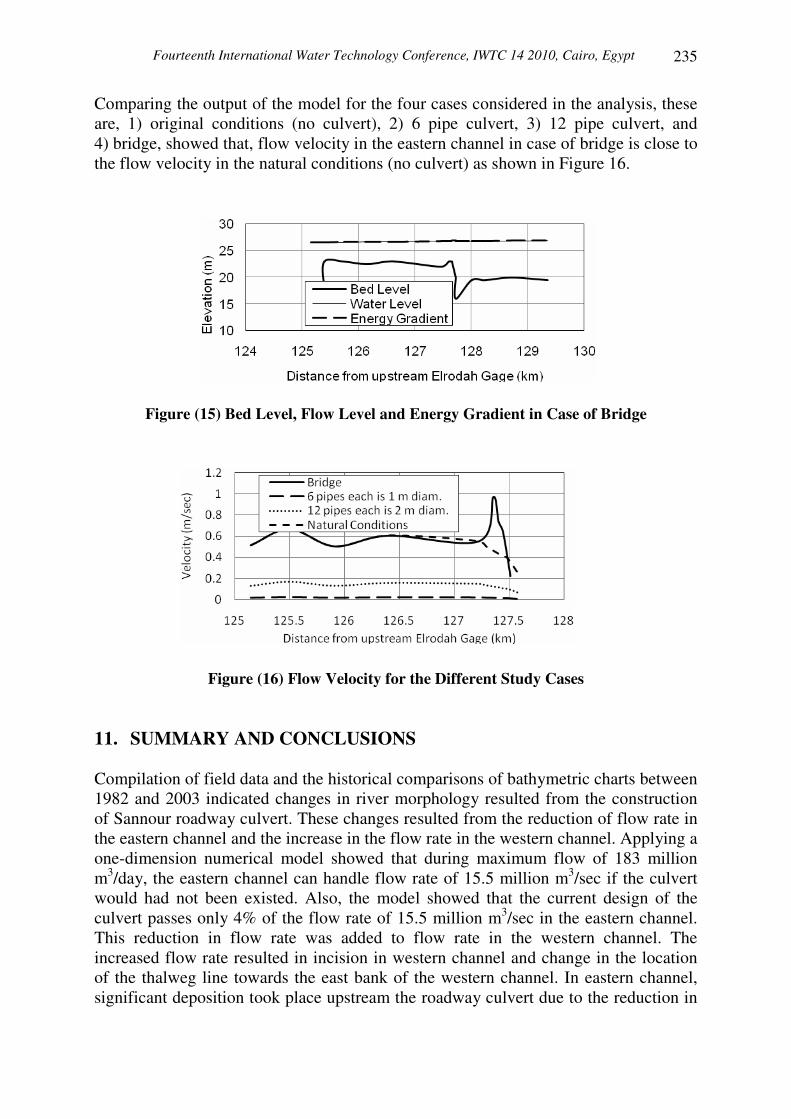
Comparing the output of the model for the four cases considered in the analysis, these are, 1) original conditions (no culvert), 2) 6 pipe culvert, 3) 12 pipe culvert, and 4) bridge, showed that, flow velocity in the eastern channel in case of bridge is close to the flow velocity in the natural conditions (no culvert) as shown in Figure 16.
Figure (15) Bed Level, Flow Level and Energy Gradient in Case of Bridge
Figure (16) Flow Velocity for the Different Study Cases 11. SUMMARY AND CONCLUSIONS Compilation of field data and the historical comparisons of bathymetric charts between 1982 and 2003 indicated changes in river morphology resulted from the construction of Sannour roadway culvert. These changes resulted from the reduction of flow rate in the eastern channel and the increase in the flow rate in the western channel. Applying a one-dimension numerical model showed that during maximum flow of 183 million m3/day, the eastern channel can handle flow rate of 15.5 million m3/sec if the culvert would had not been existed. Also, the model showed that the current design of the culvert passes only 4% of the flow rate of 15.5 million m3/sec in the eastern channel. This reduction in flow rate was added to flow rate in the western channel. The increased flow rate resulted in incision in western channel and change in the location of the thalweg line towards the east bank of the western channel. In eastern channel, significant deposition took place upstream the roadway culvert due to the reduction in
Fourteenth International Water Technology Conference, IWTC 14 2010, Cairo, Egypt 236
flow velocity. Deflecting flow towards the western channel had caused severe erosion at the island apex. It is proposed replacing the existing culvert by a bridge. In this case, flow rate will increase in the eastern channel, thus, avoiding clogging of the channel. REFERENCES [1] Simons, R.K., and Simons, D.B., An Analysis of Platte River Channel Changes,
The Variability of Large Alluvial Rivers, edited by Schumm, A. and Winkley, B., Pub. ASCE, pp. 341-361, 1994.
[2] Leopold, L.B., Wolman, M.G., and Miller J.P., Fluvial Processes in Geomorphology, W.H. Freeman and Company, San Francisco, California, pp. 522, 1964.
[3] Zhou, Z., and Pan, X., Lower Yellow River, The Variability of Large Alluvial Rivers, Edited by Schumm, A. and Winkley, B., Pub. ASCE, pp. 363-393, 1994.
[4] Billi, P. and Rinaldi, M., Human Impact on Sediment Yield and Channel Dynamics in the Arno River Basin (central Italy), Human Impact on Erosion and Sedimentation, Proceeding of Rabat Symposium S6, April 1997, IAHS Publ. No. 245, 1997.
[5] Liriano, S.L., Day, R.A., and White, W.R., Scour at Culvert Outlets as Influenced by the Turbulent Flow Structure, Journal of Hydraulic Research, Vol. 40, No. 3, pp. 367-376, 2002.
[6] River Nile Protection and Development Project, Impact of Water Resources Projects on the Nile in Egypt, Editor-in-Chief, Mohamed Elmoattassem, pp. 3.1–3.30, Nile Research Institute, Elqanatir, Egypt, July, 1992.
[7] River Nile Protection and Development Project, River Regime of the Nile in Egypt, Editor-in-Chief, Mohamed Rafiq Abdelbary, pp. 2.1-2.39, Nile Research Institute, Elqanatir, Egypt, June, 1992.
[8] Chang, H., Fluvial Processes in River Engineering, Wiley-Interscience, USA, pp. 432, 1987.
[9] Knighton, D., Fluvial Forms and Processes, Pub. Edward Arnold, USA, pp. 218, 1984.
[10] Lagasse, P.F., Variable Response of Rio Grande to Dam Construction, The Variability of Large Alluvial Rivers, Edited by Schumm, A. and Winkley, B., Pub. ASCE, pp. 395-420, 1994.
[11] Sedimentation Engineer, ASCE Manual and Reports on Engineering Practice No. 54, pp. 745, 1975.