Embed Size (px)
Citation preview
i
Human-feline oral microbiome cross-species transmission and its association with idiopathic tooth resorption.
by Katherine Yerex
A Thesis submitted to the Faculty of Graduate Studies of The University of Manitoba in partial fulfilment of the requirements of the degree of
MASTER OF SCIENCE
Department of Oral Biology University of Manitoba Winnipeg
Copyright © 2021 by Katherine Yerex
ii
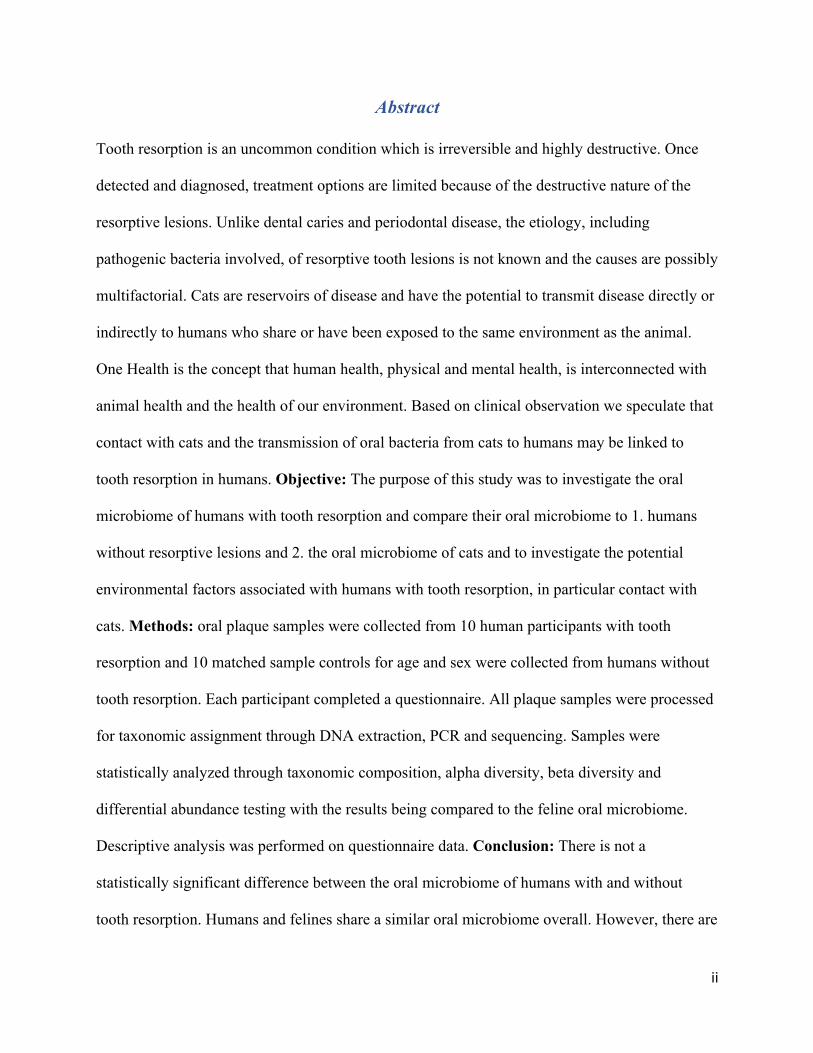
Abstract Tooth resorption is an uncommon condition which is irreversible and highly destructive. Once
detected and diagnosed, treatment options are limited because of the destructive nature of the
resorptive lesions. Unlike dental caries and periodontal disease, the etiology, including
pathogenic bacteria involved, of resorptive tooth lesions is not known and the causes are possibly
multifactorial. Cats are reservoirs of disease and have the potential to transmit disease directly or
indirectly to humans who share or have been exposed to the same environment as the animal.
One Health is the concept that human health, physical and mental health, is interconnected with
animal health and the health of our environment. Based on clinical observation we speculate that
contact with cats and the transmission of oral bacteria from cats to humans may be linked to
tooth resorption in humans. Objective: The purpose of this study was to investigate the oral
microbiome of humans with tooth resorption and compare their oral microbiome to 1. humans
without resorptive lesions and 2. the oral microbiome of cats and to investigate the potential
environmental factors associated with humans with tooth resorption, in particular contact with
cats. Methods: oral plaque samples were collected from 10 human participants with tooth
resorption and 10 matched sample controls for age and sex were collected from humans without
tooth resorption. Each participant completed a questionnaire. All plaque samples were processed
for taxonomic assignment through DNA extraction, PCR and sequencing. Samples were
statistically analyzed through taxonomic composition, alpha diversity, beta diversity and
differential abundance testing with the results being compared to the feline oral microbiome.
Descriptive analysis was performed on questionnaire data. Conclusion: There is not a
statistically significant difference between the oral microbiome of humans with and without
tooth resorption. Humans and felines share a similar oral microbiome overall. However, there are
iii
three bacterial genera (Alysiella, Prevotella and Rothia) that appear to be in common between
the human oral microbiome and the oral microbiome of felines with resorptive lesions. There is
no statistically significant association between tooth resorption and contact with cats based on
descriptive data.
Keywords: external tooth resorption, internal tooth resorption, oral microbiome, feline oral
microbiome, cats

iv
Acknowledgements
This research would not have been possible without my advisor Dr. Kangmin Duan and my
committee members Dr. James Elliott Scott and Dr. Eraldo Batista. Many thanks to my
colleagues at the School of Dental Hygiene, dental specialists, dentists, and dental hygienists
who supported my research efforts. Thank you to all students, staff, and faculty members I have
studied and worked with in the department of Oral Biology – your kindness, assistance and
support have made this project possible.
v
Dedication
My efforts to complete my thesis would not have been possible without the support from my
family and friends. I dedicate this to my husband Robert who has made many sacrifices to
support me through my studies and has kept me grounded through this process, my children
Bruno and Beatrice who inspire me to be a better person, my parents Jim and Eleanor who raised
me to never stop believing in myself, to my sister Christina for always encouraging me and my
friends who support me mentally, emotionally, and spiritually every day. Maarsii.
vi
Table of Contents
Abstract ........................................................................................................................................... ii
Acknowledgements ........................................................................................................................ iv
Dedication ........................................................................................................................................ v
Table of Contents .......................................................................................................................... vi
List of Tables ............................................................................................................................... viii List of Figures ............................................................................................................................... ix
Chapter 1. Introduction ................................................................................................................. 1
Research Assumptions .......................................................................................................................... 6
Research Objectives .............................................................................................................................. 6
Chapter 2. Materials & Methods ................................................................................................... 7 2.1. Ethics ................................................................................................................................................ 7
2.2. Study population .............................................................................................................................. 7
2.3 Sample collection .............................................................................................................................. 8
2.4 Microbial analyses ............................................................................................................................ 8
2.4.1.DNA extraction, PCR, sequencing, and sequence processing .................................................. 8
2.4.2 Quality Control .......................................................................................................................... 8
2.4.3 Statistical analysis of oral microbiome results .......................................................................... 9
2.5 Statistical analysis comparing human oral microbiome to feline oral microbiome ..................... 10
2.6 Methodology for descriptive data ................................................................................................... 11
2.6.1 Questionnaire ........................................................................................................................... 11
2.6.2 Statistical analysis of descriptive data ..................................................................................... 11
Chapter 3. Results ........................................................................................................................ 12
3.1 Investigation of the oral microbiome of humans with and without tooth resorption ................... 13
3.1.1 Sequence Curation & Metrics ................................................................................................. 13
3.1.2 Taxonomic Composition .......................................................................................................... 15
3.1.3 Alpha Diversity ......................................................................................................................... 22
3.1.4 Beta Diversity ........................................................................................................................... 24
3.1.5 Differential Abundance Testing .............................................................................................. 27
3.2 Comparison of oral microbiome of humans with resorptive lesions to oral microbiome of felines ............................................................................................................................................................... 27
3.2.1 Feline oral microbiome ............................................................................................................ 27
vii
3.2.2 Comparison of feline and human oral microbiome ................................................................ 29
3.3 Variables of interest that influence the opportunity for cross-species transmission of oral bacteria between humans and felines .................................................................................................. 33
3.3.1 Study participant characteristics ............................................................................................. 33
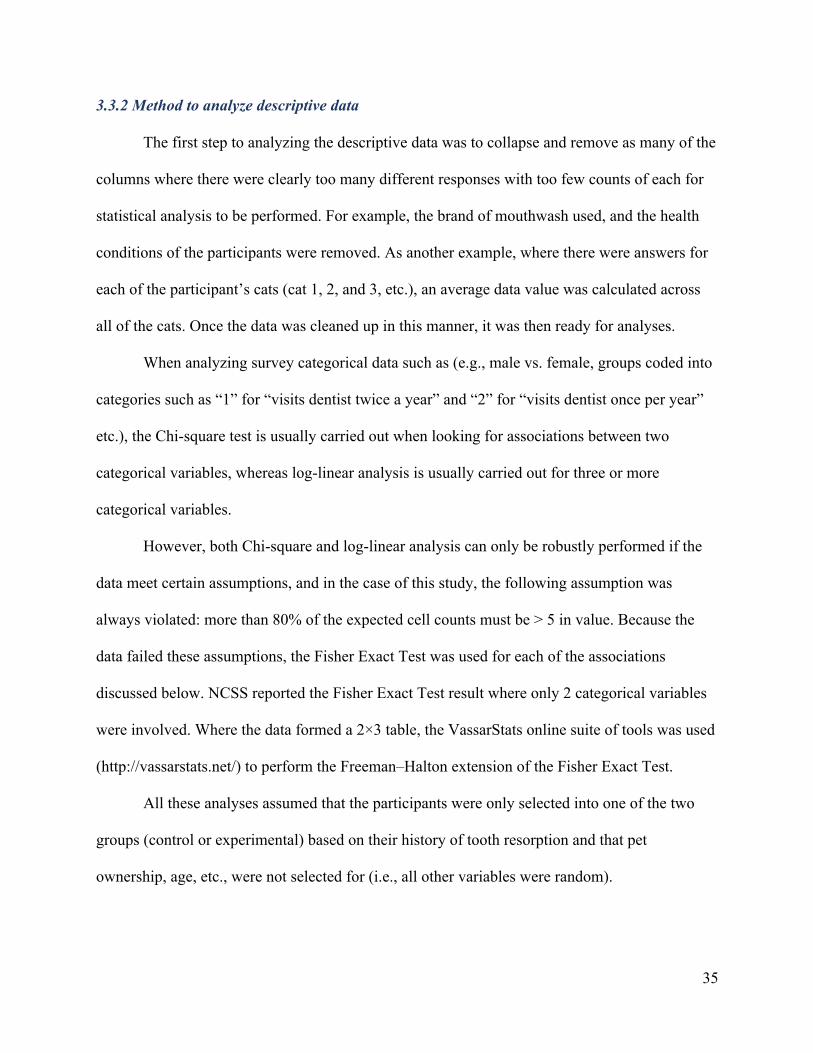
3.3.2 Method to analyze descriptive data .......................................................................................... 35
3.3.3 Relevant questions from the descriptive data .......................................................................... 36
Chapter 4. Discussion .................................................................................................................. 40
4.1 Study Implications .......................................................................................................................... 40
4.2 Study Limitations & Future Directions .......................................................................................... 44
References .................................................................................................................................... 47
Appendix A: Participant Questionnaire ...................................................................................... 50
viii
List of Tables
Table 1: Age, Sex & tooth resorption demographics of participants…………………………...…12 Table 2: Summary of the total number of quality filtered reads per sample………………….....15 Table 3: Mean Genera abundancies, standard deviation and coefficient of variance for experimental and control groups…………………………………………………………………...20-21 Table 4: Shannon diversity summary statistics……………………………………………………....23 Table 5: ANOVA results for Shannon diversity…………………………………………..…….….23 Table 6: PERMOANOVA analysis of beta diversity………………………………………...……26 Table 7: Feline oral microbiome genera unique of cats who are orally healthy and who have FORL……………………………………………………………………………….….29 Table 8: Top phyla for oral microbiome and feline oral microbiome…………………………30 Table 9: Common genera between human oral microbiome and all feline oral microbiome………………………………………………………………………………….31-32 Table 10: Study participant characteristics…………………………………………………..….34
ix
List of Figures
Figure 1: A & B: Clinical presentation of ERL. C & D: radiographic presentation of ERL....2 Figure 2: A: Clinical presentation of IRL. B: Radiographic presentation of IRL………...…...3 Figure 3: Analytical flowchart of statistical interpretations of data……………………….….10 Figure 4: Box-and-whisker plot total number of quality filtered reads per sample……..…..14 Figure 5: Illustration of the mean and standard error of the relative abundances of the 5 most abundant genus-level taxa within the 4 most abundant phyla......16 Figure 6: Per-sample taxonomic composition of Phylum……………………………………....17 Figure 7: Per-sample taxonomic composition of Class…………………………………………18 Figure 8: Per-sample composition of Order……………………………………………………..18 Figure 9: Per-sample taxonomic composition of Family…………………………………….…19 Figure 10: Per-sample taxonomic composition of Genus………………………………………19 Figure 11: Shannon index showing measure of richness and evenness in each sample…….23 Figure 12: Ordination of microbiome composition for all specimens according to Bray-Curtis dissimilarities…………………………………………………………...25 Figure 13: Freeman–Halton extension of the Fisher Exact Test; Association between pets and lesions…………………………………………………………..…..37 Figure 14: Freeman–Halton extension of the Fisher Exact Test; Association between age and lesions……………………………………...………………………..38 Figure 15: Freeman–Halton extension of the Fisher Exact Test; Association between sex and lesions…………………………………………………………….….39
1
Chapter 1. Introduction
Oral disease, in the form of cavities and periodontal disease, has been studied
extensively. The risk factors, risk indicators, etiology, prevention, treatment, and pathogenic
bacteria associated with cavities and periodontal disease are well known. Many options are
available to prevent and arrest decay and prevent and treat periodontal disease before tooth loss
occurs. Much less is known about the etiology and prevention of another type of highly
destructive, irreversible oral disease known as tooth resorption (1–11). Tooth resorption is an
uncommon, not well understood condition with an estimated prevalence of 0.1%-10% (1–11).
The pathogenic bacteria associated with resorptive lesions are unknown. Once tooth resorption is
detected and diagnosed, treatment options are limited because most of the tooth destruction
occurs before clinical or radiographic signs are visible (1–11). Often times tooth extraction is the
only option leaving the patient seeking tooth replacement options (1–11).
The potential causes of resorptive tooth lesions are multifactorial and may include:
history of trauma, orthodontic treatment, endodontic treatment, intracoronal bleaching, viral
infection, genetics and idiopathic including contact with cats (12). It is not clear how and why
these lesions start in patients with tooth resorption; a knowledge gap exists in this area of oral
health.
Tooth resorptive lesions are sometimes mistaken for cavities, but they are
distinguishingly different. Cavities are the result of passive inorganic demineralization of enamel
initiated by known cariogenic pathogens (13). Resorptive lesions occur through active
progressive destruction of dental tissue cells by clastic cells (odontoclasts) eventually resulting in
granulation tissue (2,9). Tooth resorptive lesions are further classified into external and internal
2
resorptive lesions (2,9). External resorptive lesions (ERL) occur on the external surface of the
root – the periodontium (2). Internal resorptive lesions (IRL) occur on the wall of the root canal,
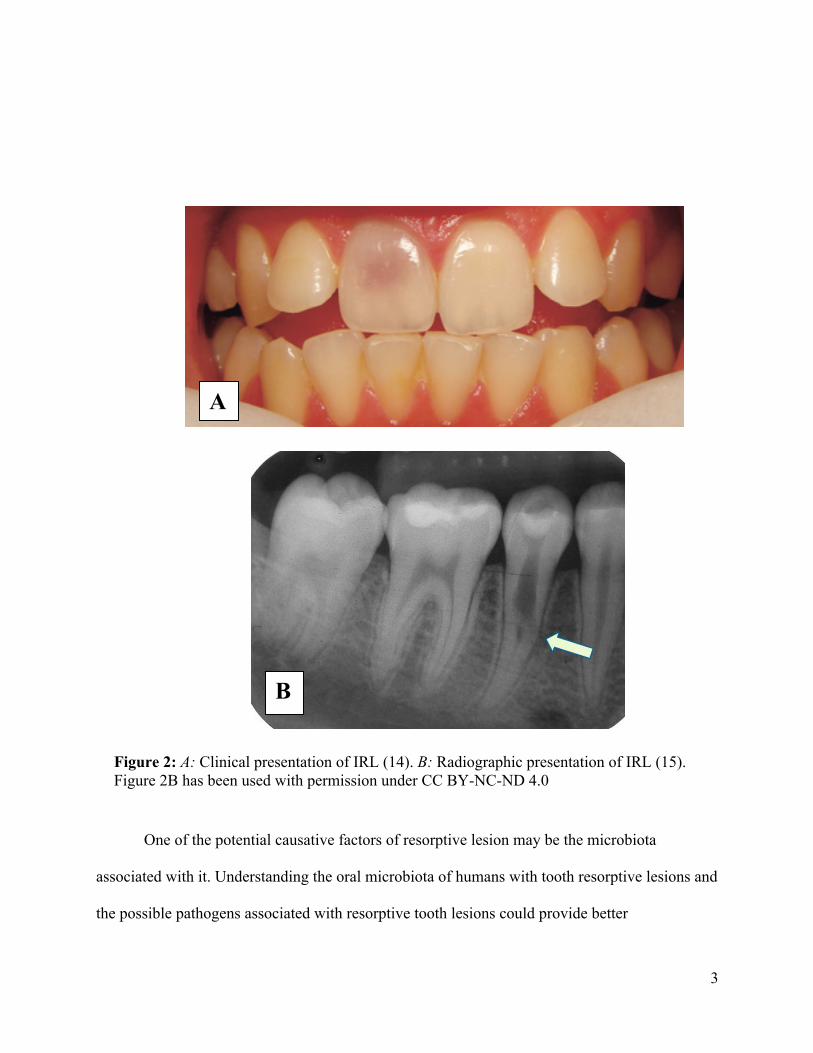
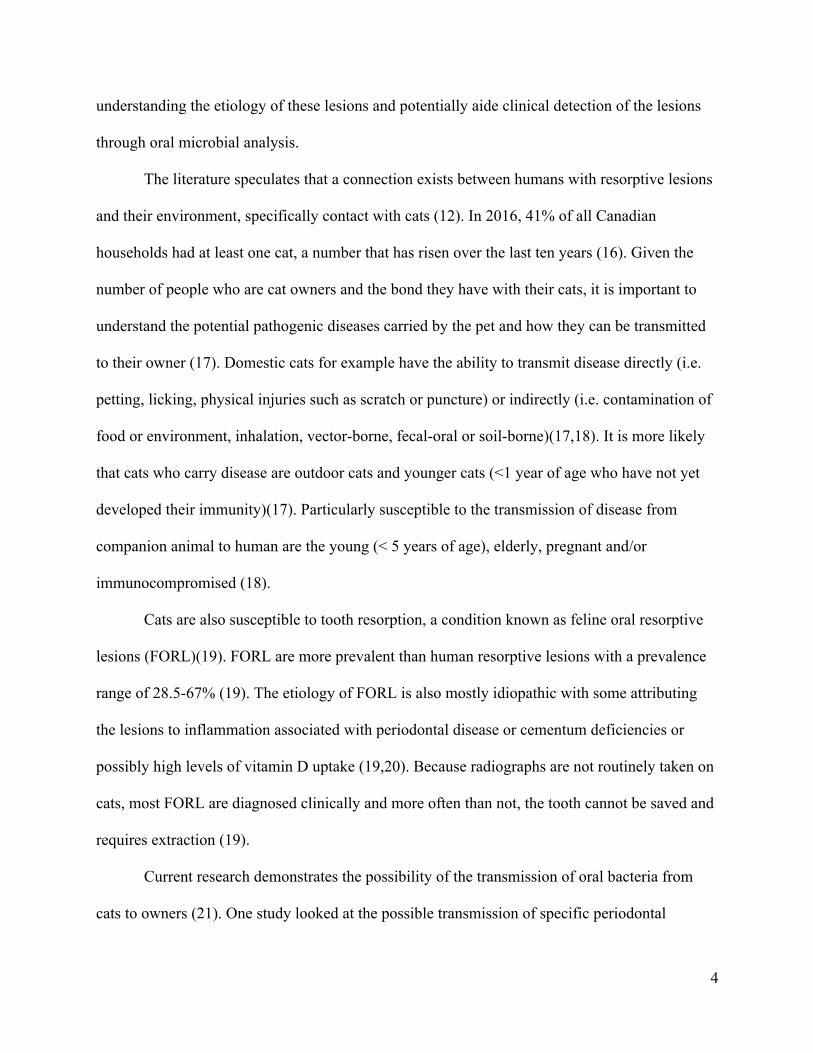
extend outward (pupal into dentin) and are usually a consequence of pupal inflammation (9). The
tooth may appear pink in its advanced stages due to the accumulation of granulation tissue in the
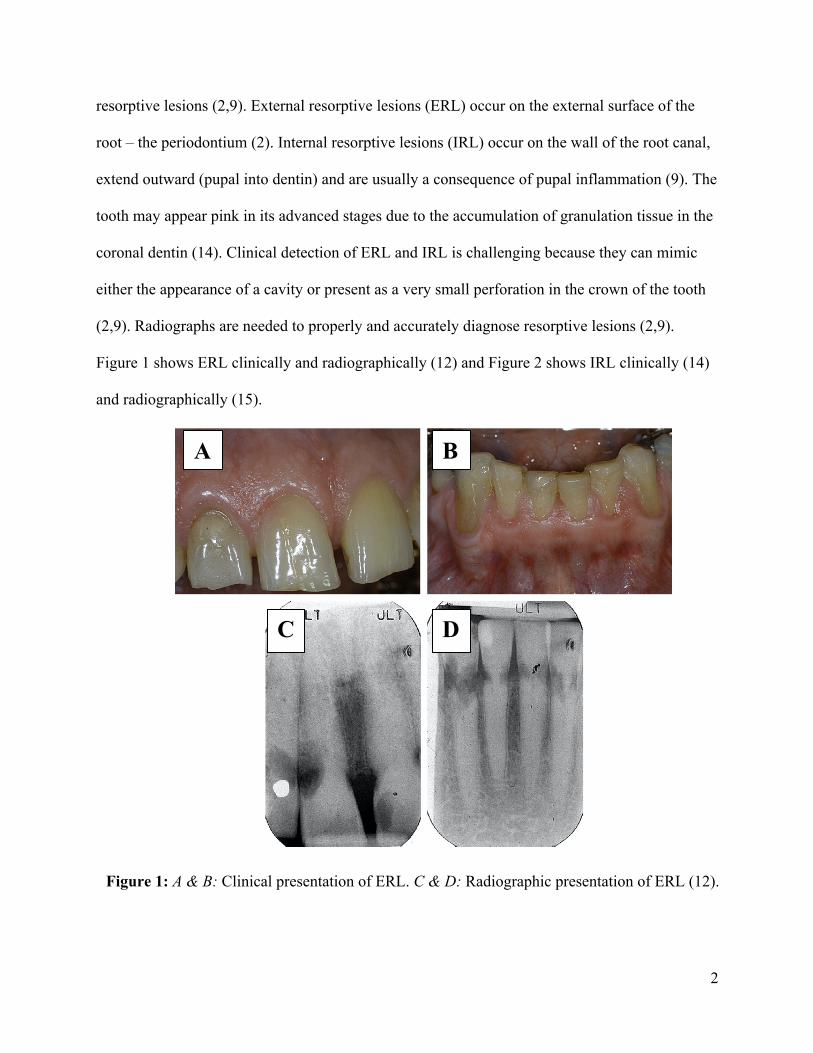
coronal dentin (14). Clinical detection of ERL and IRL is challenging because they can mimic
either the appearance of a cavity or present as a very small perforation in the crown of the tooth
(2,9). Radiographs are needed to properly and accurately diagnose resorptive lesions (2,9).
Figure 1 shows ERL clinically and radiographically (12) and Figure 2 shows IRL clinically (14)
and radiographically (15).
Figure 1: A & B: Clinical presentation of ERL. C & D: Radiographic presentation of ERL (12).
A B
D C
3
One of the potential causative factors of resorptive lesion may be the microbiota
associated with it. Understanding the oral microbiota of humans with tooth resorptive lesions and
the possible pathogens associated with resorptive tooth lesions could provide better
Figure 2: A: Clinical presentation of IRL (14). B: Radiographic presentation of IRL (15). Figure 2B has been used with permission under CC BY-NC-ND 4.0
A
B
4
understanding the etiology of these lesions and potentially aide clinical detection of the lesions
through oral microbial analysis.
The literature speculates that a connection exists between humans with resorptive lesions
and their environment, specifically contact with cats (12). In 2016, 41% of all Canadian
households had at least one cat, a number that has risen over the last ten years (16). Given the
number of people who are cat owners and the bond they have with their cats, it is important to
understand the potential pathogenic diseases carried by the pet and how they can be transmitted
to their owner (17). Domestic cats for example have the ability to transmit disease directly (i.e.
petting, licking, physical injuries such as scratch or puncture) or indirectly (i.e. contamination of
food or environment, inhalation, vector-borne, fecal-oral or soil-borne)(17,18). It is more likely
that cats who carry disease are outdoor cats and younger cats (<1 year of age who have not yet
developed their immunity)(17). Particularly susceptible to the transmission of disease from
companion animal to human are the young (< 5 years of age), elderly, pregnant and/or
immunocompromised (18).
Cats are also susceptible to tooth resorption, a condition known as feline oral resorptive
lesions (FORL)(19). FORL are more prevalent than human resorptive lesions with a prevalence
range of 28.5-67% (19). The etiology of FORL is also mostly idiopathic with some attributing
the lesions to inflammation associated with periodontal disease or cementum deficiencies or
possibly high levels of vitamin D uptake (19,20). Because radiographs are not routinely taken on
cats, most FORL are diagnosed clinically and more often than not, the tooth cannot be saved and
requires extraction (19).
Current research demonstrates the possibility of the transmission of oral bacteria from
cats to owners (21). One study looked at the possible transmission of specific periodontal
5
pathogens and found the exact same species of T. forsythia in both cats and humans (21). It is
possible that cats could transmit bacteria to their owners, but this is dependent on a number of
factors including: survival of the microorganism in the environment, genetic factors of the
microorganism, number of microorganisms that are shed, source and route of infection and
frequency of contact (contact = cats licking face, eating from plates owner eats from, sharing
food with cat, sleeping on the same pillow, etc)(21). Another study looking at the
characterization of microbiota of healthy cats found that cats within the same household shared a
similar microbiota which could indicate that animals and humans who cohabitate have the
potential to share oral microbiota including those associated with infectious oral diseases (22).
There is one study looking at the microbiota of cats with FORL (23), but no studies exist looking
at the oral microbiome connection between humans with tooth resorption and cats.
One Health is the public health concept that human physical and mental health is
interconnected with animal health and the health of our environment (24). One Health
encourages all health and environmental professionals to work together to improve the lives of
all species and one way in doing so is looking at cross-species disease transmission (24). Future
steps in human health care, including oral health, need to look at the animals and the
environment we all share.
By identifying the oral microbiota of humans with resorptive tooth lesions this pilot
project will first identify the key human tooth resorptive-associated species. Second, the project
will adopt a One Health approach and compare the oral microbiome of humans with resorptive
lesions (obtained through sample collection) to the oral microbiome of felines (obtained through
a database) to investigate a cross-species transmission of oral bacteria between felines and
humans in one’s environment. Thirdly the project will look at possible variables that may
6
influence the chances of cross-species transmission and alter the oral microbiota of humans with
tooth resorption. The project has potential to encourage more research in this area.
Research Assumption
People with tooth resorption have a unique oral microbiome and may share bacterial
species commonly found in cats. Increased contact with cats may increase the number of shared
oral bacteria.
Research Objectives
1. To investigate the oral microbiome of humans with resorptive tooth lesions and compare
it to the oral microbiome of humans without resorptive lesions.
2. To compare the oral bacterial species specific to humans with resorptive lesions with the
oral microbiome of felines (from a database) to identify similar oral bacteria between the
two species.
3. To investigate the variables which might influence or increase the opportunity for cross-
species transmission of oral bacteria between humans and felines.
7
Chapter 2. Materials & Methods
2.1. Ethics
The research project underwent full Health Research Ethics Board (HREB) review from
the University of Manitoba HREB board and received approval {HS22888 (H2019:220)}.
2.2. Study population
Adults with diagnosed resorptive tooth lesions confirmed by a dentist or dental specialist
with radiographs were enrolled in the study from general practice dental clinics and specialty
practices (endodontics, periodontics, orthodontics, prosthodontic & oral surgery). Participants
were recruited through the above listed dental clinics. The dental clinics were sent information
about the study through email, social media, presentations and by word of mouth about what
participation in the study would involve. Potential participants were informed about the study
from the dental provider and if interested in participating in the study, the dental provider asked
if the investigator could contact the patient. The investigator provided the participant with all
study information and invited the patient to participate. Consent was obtained from each
participant. Adults without resorptive lesions but matched for age and gender (control group)
were enrolled in the study in the same manner as explained above.
Inclusion Criteria: Adults 18 years of age and older, current or history of oral resorptive lesion
(external or internal), single or multiple resorptive lesions, no resorptive lesions (control).
Exclusion Criteria: Use of antibiotics in previous 6 months, pregnant, current tobacco user,
current orthodontic treatment, current endodontic treatment.
A total of 20 samples were collected: 10 case samples and 10 control samples.
8
2.3 Sample collection
Using an interdental brush, plaque was collected from all available supra gingival tooth
surfaces. To disperse the plaque from the interdental brush, the brush was submerged into a
collection tube with Qiagen RNA Protect reagent and then twirled for 5 seconds before
discarding the interdental brush. The procedure was repeated with a new interdental brush and
the plaque was dispersed in the same tube. Samples were stored at -80°C until ready to be
processed. Samples were then sent to Microbiome Insights for DNA extraction, PCR, sequencing
and sequence processing.
2.4 Microbial analyses 2.4.1.DNA extraction, PCR, sequencing, and sequence processing
Deep sequencing of the small ribosomal rRNA subunit (16S rRNA) gene was utilized to
survey the bacterial community and gain insights on the population dynamics. This was achieved
by taking thousands of copy variants of the 16S rRNA gene and clustering the sequence data into
count data in the form of Operational Taxonomic Units (OTUs).
Specimens were placed into a MoBio PowerMag Soil DNA Isolation Bead Plate. DNA
was extracted following MoBio’s instructions on a KingFisher robot. Bacterial 16S rRNA genes
were PCR-amplified with dual-barcoded primers targeting the V4 region (515F 5’-
GTGCCAGCMGCCGCGGTAA-3’, and 806R 5’-GGACTACHVGGGTWTCTAAT-3’)(25).
Amplicons were sequenced with an Illumina MiSeq using the 300-bp paired-end kit (v.3).
Sequences were denoised, taxonomically classified using Silva (v. 138) as the reference
database, and clustered into 97%-similarity operational taxonomic units (OTUs) with the mothur
software package (v. 1.44.1)(26), following the recommended procedure (27).
2.4.2 Quality Control
9
The potential for contamination was addressed by co-sequencing DNA amplified from
specimens and from template-free controls (negative control) and extraction kit reagents
processed the same way as the specimens. A positive control from ‘S00Z1-’ samples consisting
of cloned SUP05 DNA, was also included. Operational taxonomic units were considered putative
contaminants (and were removed) if their mean abundance in controls reached or exceeded 25%
of their mean abundance in specimens.
2.4.3 Statistical analysis of oral microbiome results
Alpha diversity was estimated with the Shannon index on raw OTU abundance tables
after filtering out contaminants. The significance of diversity differences was tested with
ANOVA or linear mixed model depending on the study design.
Beta diversity is a measure of how similar or dissimilar the samples are and is usually
represented by a distance matrix which is then used to do Principal Coordinates Analysis
(PCoA)(28). The result of this is an ordination plot of multiple dimensions, where each sample is
a point and the distance between the points represents the similarity of those samples (closer
together = more similar)(28). Differences in microbial abundances between two samples (e.g., at
species level) values are from 0 to 1; 0 means both samples share the same species at exact the
same abundances & 1 means both samples have completely different species abundances.(29)
To estimate beta diversity across samples, OTUs occurring with a count of less than 3 in at least
10 % of the samples were excluded and then Bray-Curtis indices were computed. Beta diversity,
emphasizing differences across samples, was visualized using Principal Coordinate Analysis
(PCoA) ordination. Variation in community structure was assessed with permutational
multivariate analyses of variance (PERMANOVA) with the case group as the main fixed factor
10
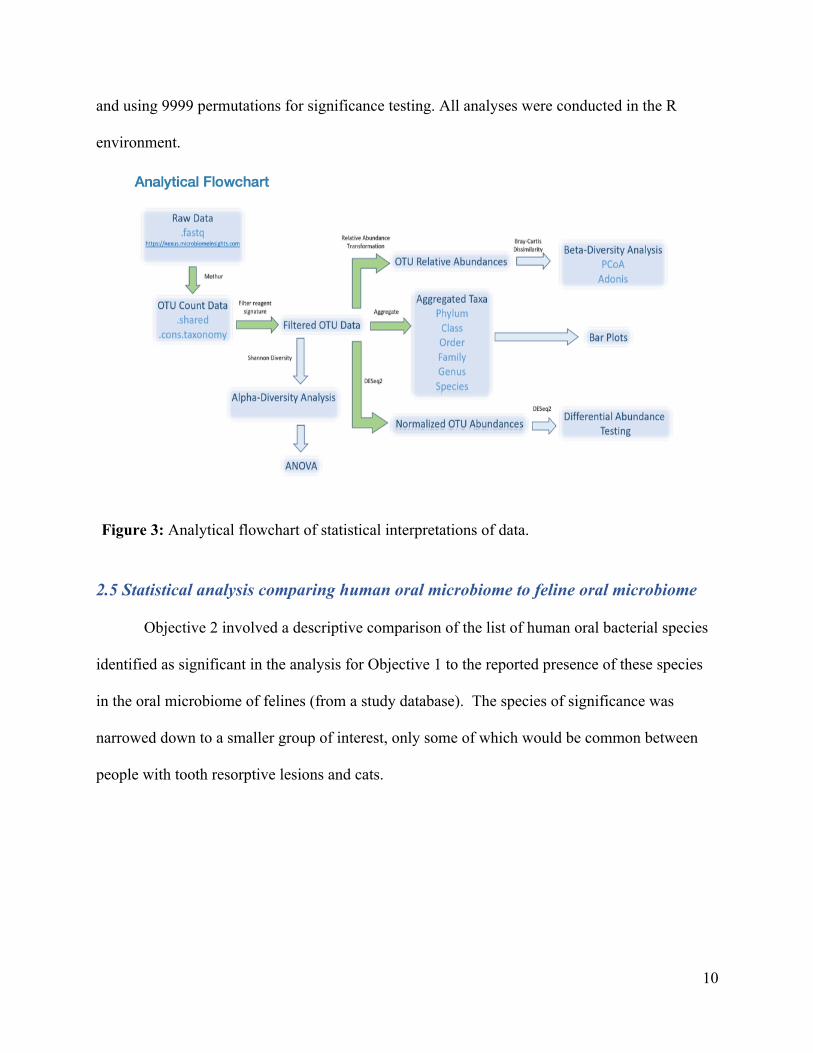
and using 9999 permutations for significance testing. All analyses were conducted in the R
environment.
2.5 Statistical analysis comparing human oral microbiome to feline oral microbiome
Objective 2 involved a descriptive comparison of the list of human oral bacterial species
identified as significant in the analysis for Objective 1 to the reported presence of these species
in the oral microbiome of felines (from a study database). The species of significance was
narrowed down to a smaller group of interest, only some of which would be common between
people with tooth resorptive lesions and cats.
Figure 3: Analytical flowchart of statistical interpretations of data.
11
2.6 Methodology for descriptive data 2.6.1 Questionnaire
At the time of sample collection, participants with and without resorptive lesions
completed a questionnaire. The questions are to assist in identifying any human factors
influencing a change in tooth resorptive oral microbiota and the factors that may influence the
oral microbiota of felines and cross-species transmission. Questions were a combination of
dichotomous, multiple choice (single answer and multiple answers), Likert scale and open ended.
See Appendix for copy of questionnaire.
2.6.2 Statistical analysis of descriptive data
For objective 3, Chi-square, Fisher Exact Test and T-test analyses were attempted to
identify clinical or environmental variables which might be modify the observed association
between the presence or absence tooth resorption between the experimental and control groups.
Data analysis was performed using NCSS 2020 Statistical Software (Kaysville, Utah) and
Vasserstats (R.Lowry, VassarStats: Website for Statistical Computation, http://vassarstats.net).
In general, p-values less than 0.05 were considered as significant, but without correction for
multiple inference in this exploratory pilot study. Any findings will be considered reported as
hypothesis generating rather than confirmatory.
12
Chapter 3. Results
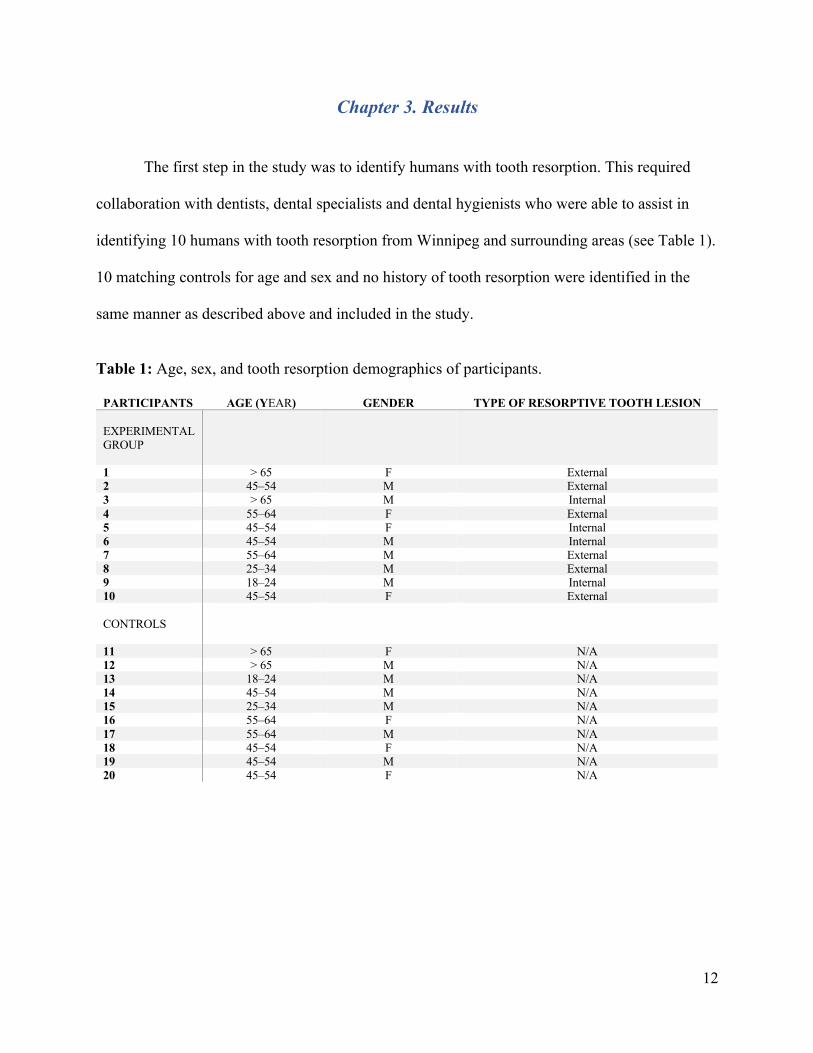
The first step in the study was to identify humans with tooth resorption. This required
collaboration with dentists, dental specialists and dental hygienists who were able to assist in
identifying 10 humans with tooth resorption from Winnipeg and surrounding areas (see Table 1).
10 matching controls for age and sex and no history of tooth resorption were identified in the
same manner as described above and included in the study.
Table 1: Age, sex, and tooth resorption demographics of participants.
PARTICIPANTS AGE (YEAR) GENDER TYPE OF RESORPTIVE TOOTH LESION EXPERIMENTAL GROUP
1 > 65 F External 2 45–54 M External 3 > 65 M Internal 4 55–64 F External 5 45–54 F Internal 6 45–54 M Internal 7 55–64 M External 8 25–34 M External 9 18–24 M Internal 10 45–54 F External CONTROLS
11 > 65 F N/A 12 > 65 M N/A 13 18–24 M N/A 14 45–54 M N/A 15 25–34 M N/A 16 55–64 F N/A 17 55–64 M N/A 18 45–54 F N/A 19 45–54 M N/A 20 45–54 F N/A
13
Plaque samples were collected from each participant and participants completed a
questionnaire. Plaque sample analysis and participant questionnaire analysis were completed to
fulfill all three study objectives.
3.1 Investigation of the oral microbiome of humans with and without tooth resorption
Each experimental group and control group oral sample was frozen at -80°C in RNA Protect
immediately after collection until all 20 oral samples (10 experimental and 10 control) were
collected and ready to be sent to Microbiome Insights Laboratory for further analysis.
3.1.1 Sequence Curation & Metrics
Microbiome Insights performed deep sequencing of the 16S rRNA genes of bacteria
within the oral microbiome of all samples. To perform sequencing, amplicons were first
generated. Reverse-transcription-PCR was performed on the oral microbiome samples. The
resulting PCR fragments, termed amplicons, were then sequenced. During data analysis, the
resulting sequencing reads were aligned to each other and those sufficiently similar in sequence
above a certain threshold (97% sequence similarity was used for the samples) were grouped
together and counted. These groups are termed operational taxonomic units (OTUs). When using
the 97% threshold, each OTU is loosely representative of a bacterial species (note that a lower
similarity threshold would be used for an OTU representing a bacterial genus). These OTUs
were then compared between the two oral microbiomes.
The resulting dataset had 3352 OTUs (including those occurring once with a count of 1).
An average of 10971 quality-filtered reads were generated per sample. For the control group, the
minimum to maximum read count ranged from 1,000 reads to one with 18,000 reads with a
median read count of ~8,000, while for the experimental group, the read count ranged from
14
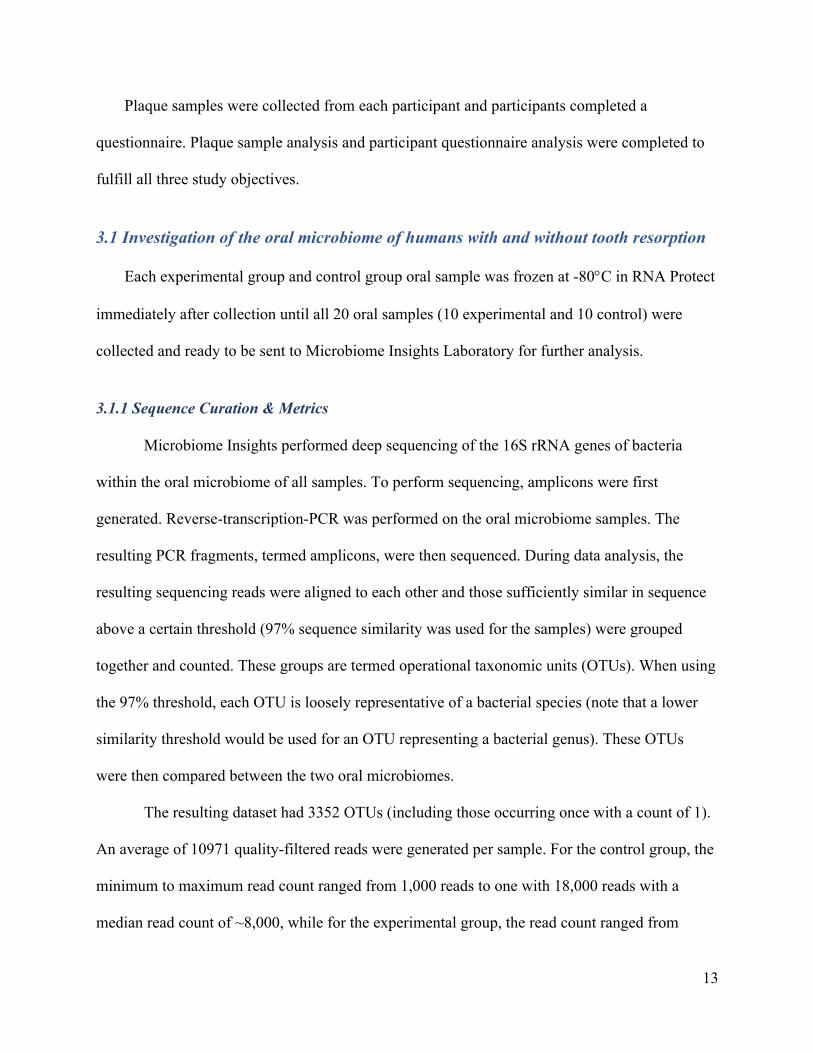
1,000 reads to one with 25,000 reads with a median read count of ~10,000. Sequencing quality
for R1 and R2 was determined using FastQC 0.11.5, and visualized below in Figure 4.
Three samples were dropped from the analysis due to low read counts; 1 from the
experimental group and 2 from the case group reducing the total sample size from 20 to 17 (see
Table 2).
Figure 4: The following box-and-whisker plot illustrates the total number of quality filtered reads per sample. These reads reflect the total number of high-quality sequences that align with 16Sv4, clustered into OTUs and were assigned taxonomic classification. Any ambiguous or low-quality data were discarded from the subsequent analyses.
15
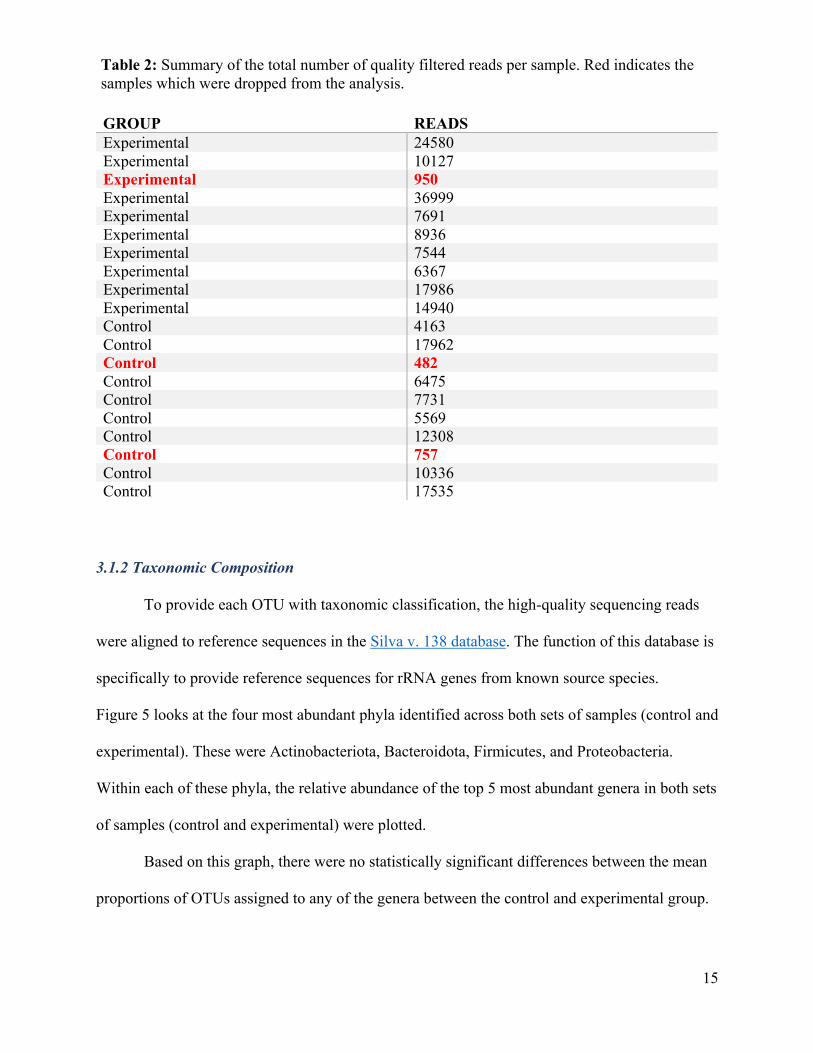
GROUP READS Experimental 24580 Experimental 10127 Experimental 950 Experimental 36999 Experimental 7691 Experimental 8936 Experimental 7544 Experimental 6367 Experimental 17986 Experimental 14940 Control 4163 Control 17962 Control 482 Control 6475 Control 7731 Control 5569 Control 12308 Control 757 Control 10336 Control 17535
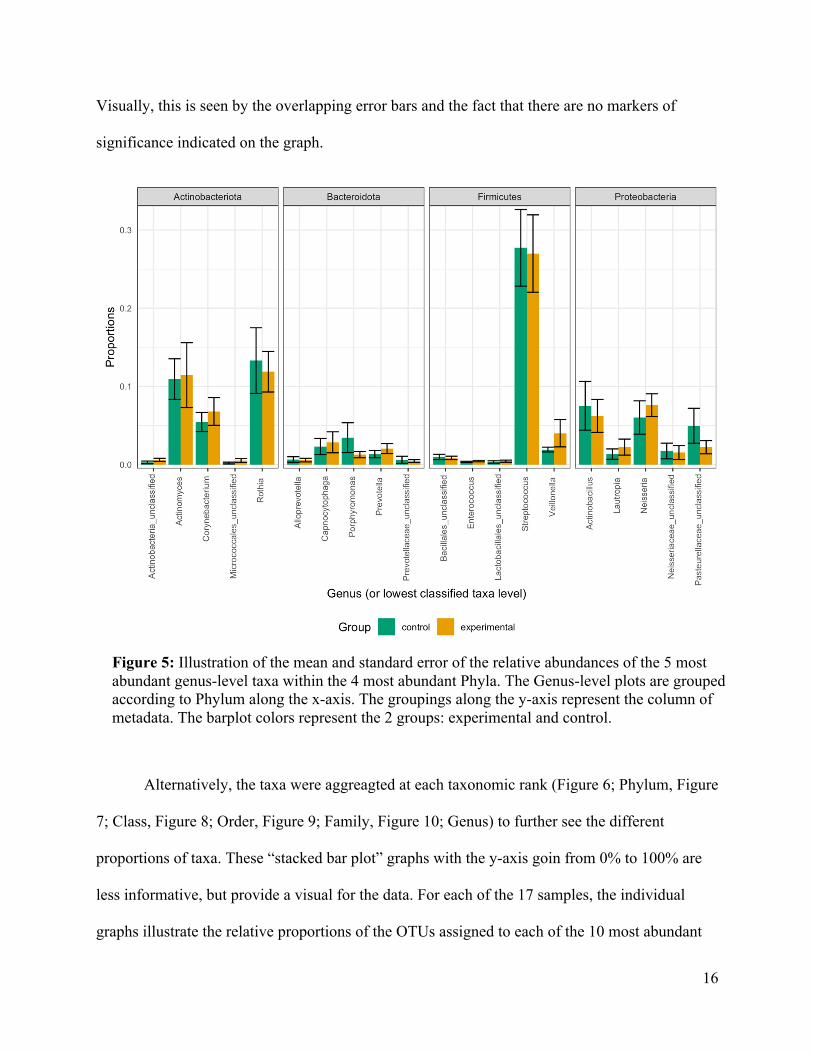
3.1.2 Taxonomic Composition
To provide each OTU with taxonomic classification, the high-quality sequencing reads
were aligned to reference sequences in the Silva v. 138 database. The function of this database is
specifically to provide reference sequences for rRNA genes from known source species.
Figure 5 looks at the four most abundant phyla identified across both sets of samples (control and
experimental). These were Actinobacteriota, Bacteroidota, Firmicutes, and Proteobacteria.
Within each of these phyla, the relative abundance of the top 5 most abundant genera in both sets
of samples (control and experimental) were plotted.
Based on this graph, there were no statistically significant differences between the mean
proportions of OTUs assigned to any of the genera between the control and experimental group.
Table 2: Summary of the total number of quality filtered reads per sample. Red indicates the samples which were dropped from the analysis.
16
Visually, this is seen by the overlapping error bars and the fact that there are no markers of
significance indicated on the graph.
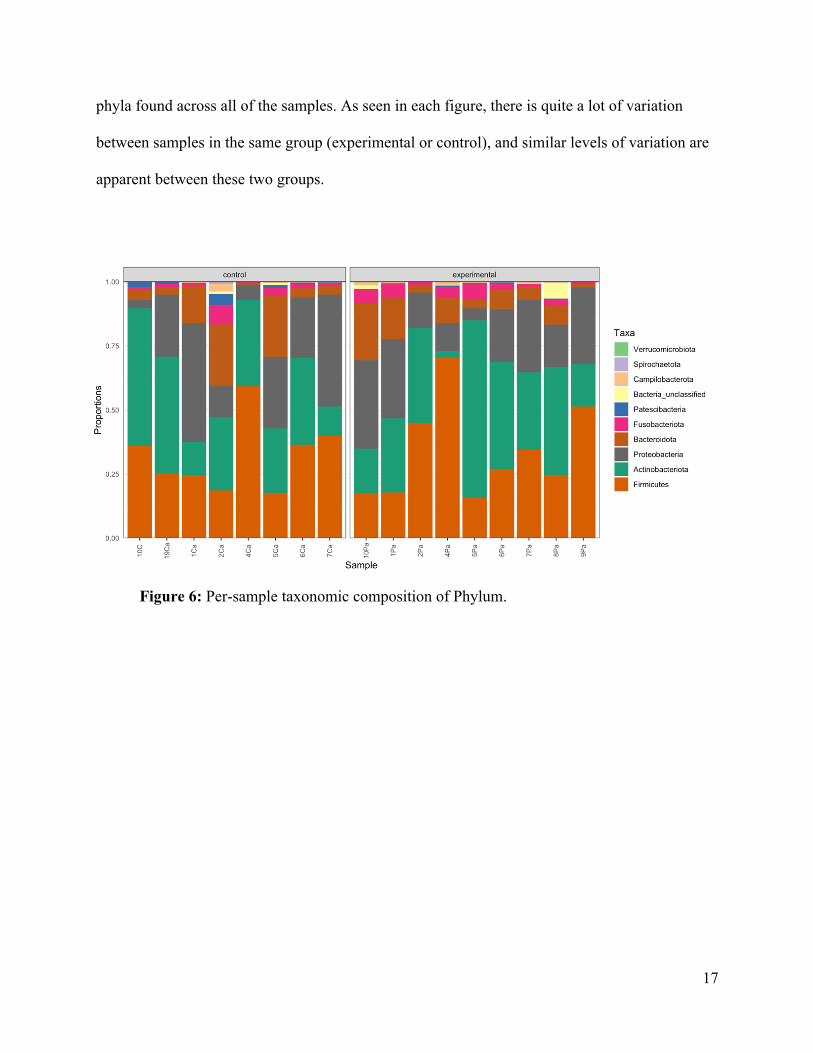
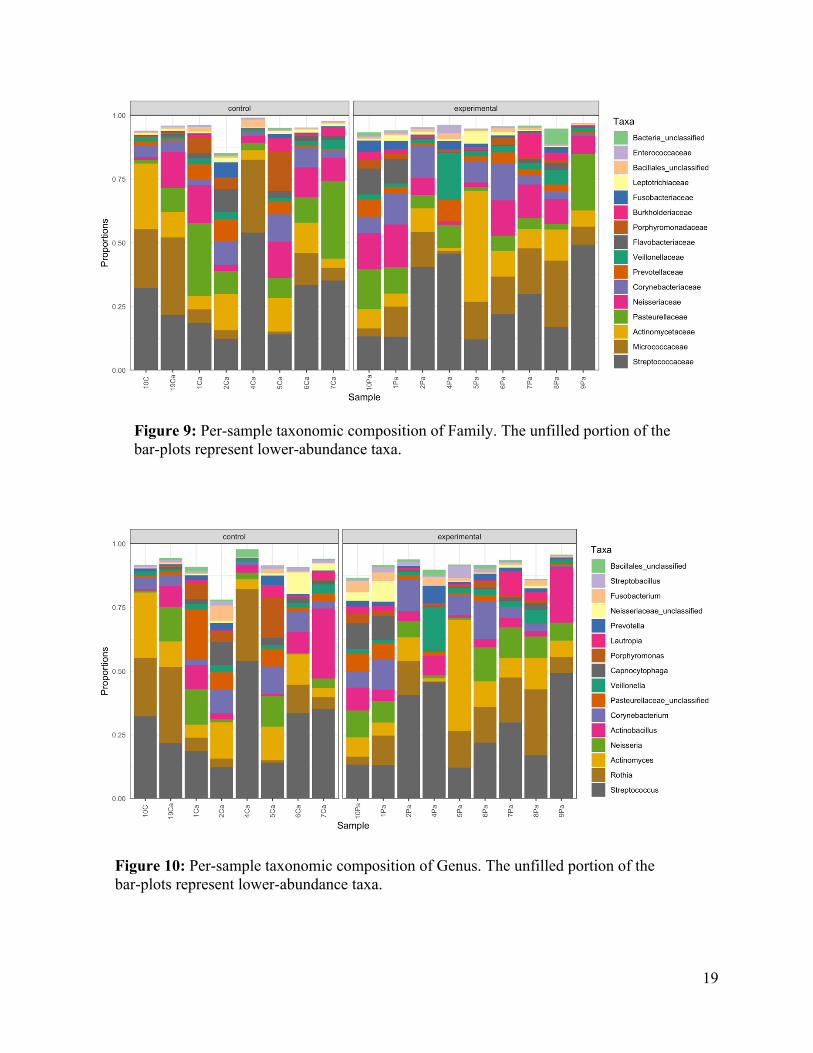
Alternatively, the taxa were aggreagted at each taxonomic rank (Figure 6; Phylum, Figure
7; Class, Figure 8; Order, Figure 9; Family, Figure 10; Genus) to further see the different
proportions of taxa. These “stacked bar plot” graphs with the y-axis goin from 0% to 100% are
less informative, but provide a visual for the data. For each of the 17 samples, the individual
graphs illustrate the relative proportions of the OTUs assigned to each of the 10 most abundant
Figure 5: Illustration of the mean and standard error of the relative abundances of the 5 most abundant genus-level taxa within the 4 most abundant Phyla. The Genus-level plots are grouped according to Phylum along the x-axis. The groupings along the y-axis represent the column of metadata. The barplot colors represent the 2 groups: experimental and control.
17
phyla found across all of the samples. As seen in each figure, there is quite a lot of variation
between samples in the same group (experimental or control), and similar levels of variation are
apparent between these two groups.
Figure 6: Per-sample taxonomic composition of Phylum.
18
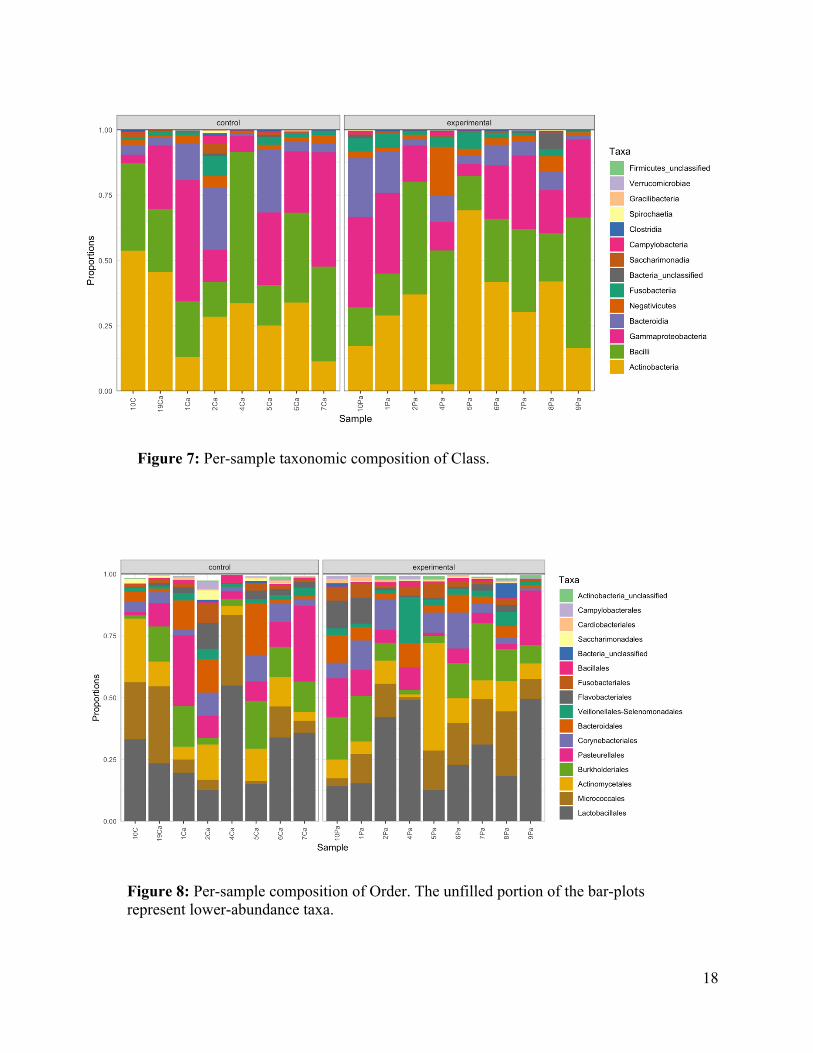
Figure 7: Per-sample taxonomic composition of Class.
Figure 8: Per-sample composition of Order. The unfilled portion of the bar-plots represent lower-abundance taxa.
19
Figure 9: Per-sample taxonomic composition of Family. The unfilled portion of the bar-plots represent lower-abundance taxa.
Figure 10: Per-sample taxonomic composition of Genus. The unfilled portion of the bar-plots represent lower-abundance taxa.
20
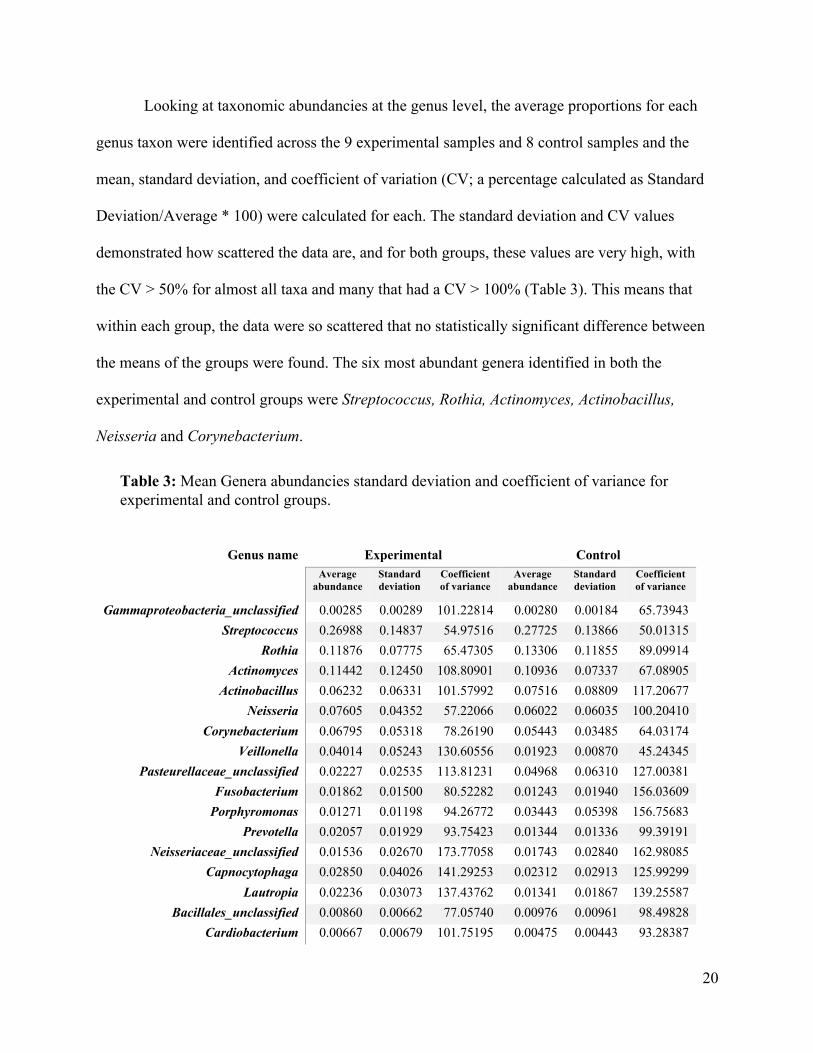
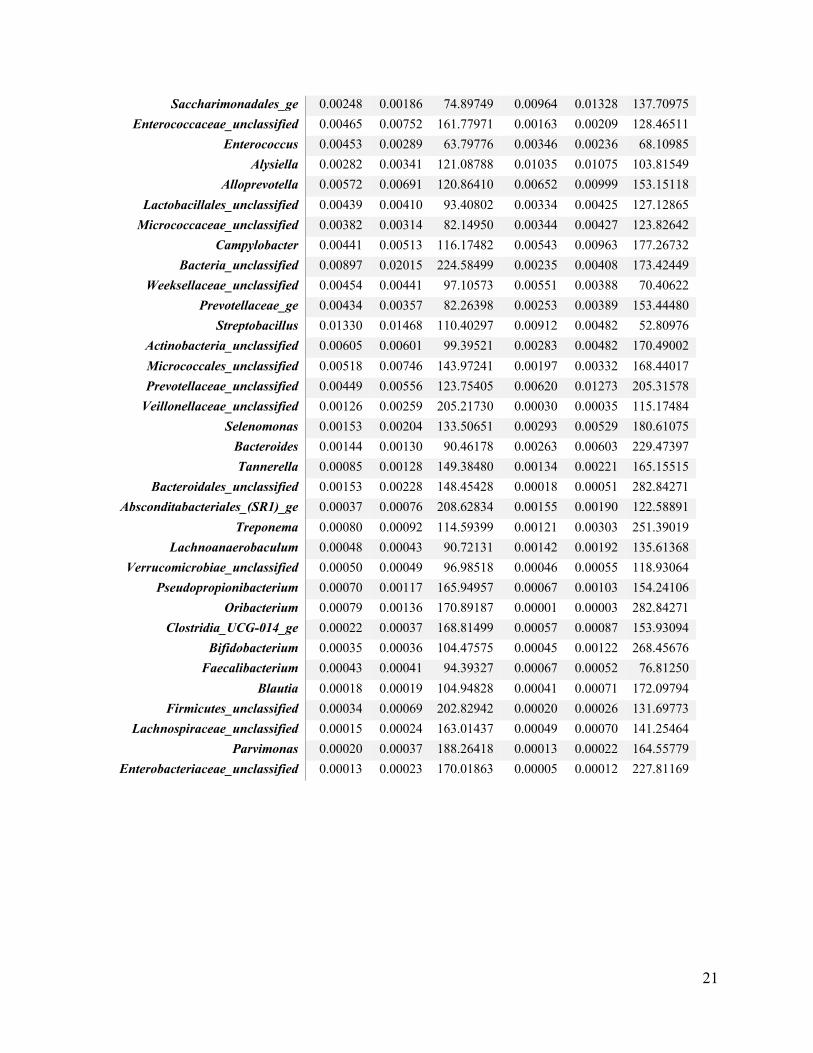
Looking at taxonomic abundancies at the genus level, the average proportions for each
genus taxon were identified across the 9 experimental samples and 8 control samples and the
mean, standard deviation, and coefficient of variation (CV; a percentage calculated as Standard
Deviation/Average * 100) were calculated for each. The standard deviation and CV values
demonstrated how scattered the data are, and for both groups, these values are very high, with
the CV > 50% for almost all taxa and many that had a CV > 100% (Table 3). This means that
within each group, the data were so scattered that no statistically significant difference between
the means of the groups were found. The six most abundant genera identified in both the
experimental and control groups were Streptococcus, Rothia, Actinomyces, Actinobacillus,
Neisseria and Corynebacterium.
Genus name Experimental Control Average
abundance Standard deviation
Coefficient of variance
Average abundance
Standard deviation
Coefficient of variance
Gammaproteobacteria_unclassified 0.00285 0.00289 101.22814 0.00280 0.00184 65.73943 Streptococcus 0.26988 0.14837 54.97516 0.27725 0.13866 50.01315
Rothia 0.11876 0.07775 65.47305 0.13306 0.11855 89.09914 Actinomyces 0.11442 0.12450 108.80901 0.10936 0.07337 67.08905
Actinobacillus 0.06232 0.06331 101.57992 0.07516 0.08809 117.20677 Neisseria 0.07605 0.04352 57.22066 0.06022 0.06035 100.20410
Corynebacterium 0.06795 0.05318 78.26190 0.05443 0.03485 64.03174 Veillonella 0.04014 0.05243 130.60556 0.01923 0.00870 45.24345
Pasteurellaceae_unclassified 0.02227 0.02535 113.81231 0.04968 0.06310 127.00381 Fusobacterium 0.01862 0.01500 80.52282 0.01243 0.01940 156.03609
Porphyromonas 0.01271 0.01198 94.26772 0.03443 0.05398 156.75683 Prevotella 0.02057 0.01929 93.75423 0.01344 0.01336 99.39191
Neisseriaceae_unclassified 0.01536 0.02670 173.77058 0.01743 0.02840 162.98085 Capnocytophaga 0.02850 0.04026 141.29253 0.02312 0.02913 125.99299
Lautropia 0.02236 0.03073 137.43762 0.01341 0.01867 139.25587 Bacillales_unclassified 0.00860 0.00662 77.05740 0.00976 0.00961 98.49828
Cardiobacterium 0.00667 0.00679 101.75195 0.00475 0.00443 93.28387
Table 3: Mean Genera abundancies standard deviation and coefficient of variance for experimental and control groups.
21
Saccharimonadales_ge 0.00248 0.00186 74.89749 0.00964 0.01328 137.70975 Enterococcaceae_unclassified 0.00465 0.00752 161.77971 0.00163 0.00209 128.46511
Enterococcus 0.00453 0.00289 63.79776 0.00346 0.00236 68.10985 Alysiella 0.00282 0.00341 121.08788 0.01035 0.01075 103.81549
Alloprevotella 0.00572 0.00691 120.86410 0.00652 0.00999 153.15118 Lactobacillales_unclassified 0.00439 0.00410 93.40802 0.00334 0.00425 127.12865
Micrococcaceae_unclassified 0.00382 0.00314 82.14950 0.00344 0.00427 123.82642 Campylobacter 0.00441 0.00513 116.17482 0.00543 0.00963 177.26732
Bacteria_unclassified 0.00897 0.02015 224.58499 0.00235 0.00408 173.42449 Weeksellaceae_unclassified 0.00454 0.00441 97.10573 0.00551 0.00388 70.40622
Prevotellaceae_ge 0.00434 0.00357 82.26398 0.00253 0.00389 153.44480 Streptobacillus 0.01330 0.01468 110.40297 0.00912 0.00482 52.80976
Actinobacteria_unclassified 0.00605 0.00601 99.39521 0.00283 0.00482 170.49002 Micrococcales_unclassified 0.00518 0.00746 143.97241 0.00197 0.00332 168.44017 Prevotellaceae_unclassified 0.00449 0.00556 123.75405 0.00620 0.01273 205.31578
Veillonellaceae_unclassified 0.00126 0.00259 205.21730 0.00030 0.00035 115.17484 Selenomonas 0.00153 0.00204 133.50651 0.00293 0.00529 180.61075
Bacteroides 0.00144 0.00130 90.46178 0.00263 0.00603 229.47397 Tannerella 0.00085 0.00128 149.38480 0.00134 0.00221 165.15515
Bacteroidales_unclassified 0.00153 0.00228 148.45428 0.00018 0.00051 282.84271 Absconditabacteriales_(SR1)_ge 0.00037 0.00076 208.62834 0.00155 0.00190 122.58891
Treponema 0.00080 0.00092 114.59399 0.00121 0.00303 251.39019 Lachnoanaerobaculum 0.00048 0.00043 90.72131 0.00142 0.00192 135.61368
Verrucomicrobiae_unclassified 0.00050 0.00049 96.98518 0.00046 0.00055 118.93064 Pseudopropionibacterium 0.00070 0.00117 165.94957 0.00067 0.00103 154.24106
Oribacterium 0.00079 0.00136 170.89187 0.00001 0.00003 282.84271 Clostridia_UCG-014_ge 0.00022 0.00037 168.81499 0.00057 0.00087 153.93094
Bifidobacterium 0.00035 0.00036 104.47575 0.00045 0.00122 268.45676 Faecalibacterium 0.00043 0.00041 94.39327 0.00067 0.00052 76.81250
Blautia 0.00018 0.00019 104.94828 0.00041 0.00071 172.09794 Firmicutes_unclassified 0.00034 0.00069 202.82942 0.00020 0.00026 131.69773
Lachnospiraceae_unclassified 0.00015 0.00024 163.01437 0.00049 0.00070 141.25464 Parvimonas 0.00020 0.00037 188.26418 0.00013 0.00022 164.55779
Enterobacteriaceae_unclassified 0.00013 0.00023 170.01863 0.00005 0.00012 227.81169
22
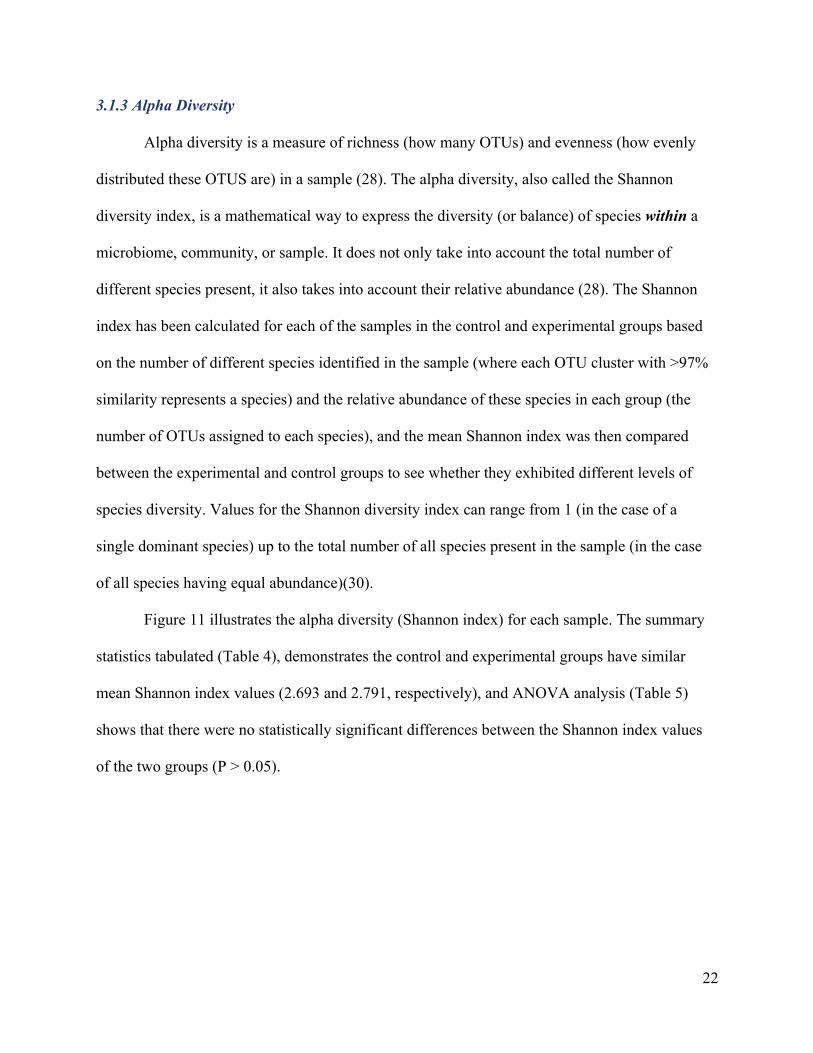
3.1.3 Alpha Diversity
Alpha diversity is a measure of richness (how many OTUs) and evenness (how evenly
distributed these OTUS are) in a sample (28). The alpha diversity, also called the Shannon
diversity index, is a mathematical way to express the diversity (or balance) of species within a
microbiome, community, or sample. It does not only take into account the total number of
different species present, it also takes into account their relative abundance (28). The Shannon
index has been calculated for each of the samples in the control and experimental groups based
on the number of different species identified in the sample (where each OTU cluster with >97%
similarity represents a species) and the relative abundance of these species in each group (the
number of OTUs assigned to each species), and the mean Shannon index was then compared
between the experimental and control groups to see whether they exhibited different levels of
species diversity. Values for the Shannon diversity index can range from 1 (in the case of a
single dominant species) up to the total number of all species present in the sample (in the case
of all species having equal abundance)(30).
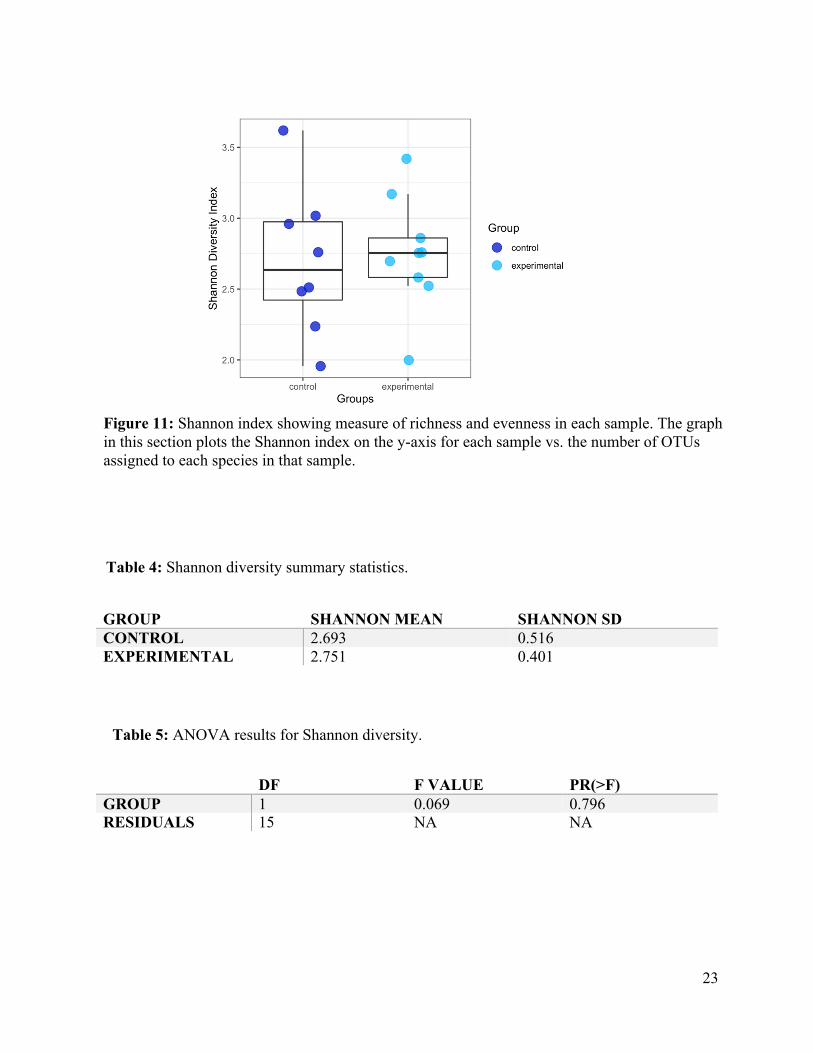
Figure 11 illustrates the alpha diversity (Shannon index) for each sample. The summary
statistics tabulated (Table 4), demonstrates the control and experimental groups have similar
mean Shannon index values (2.693 and 2.791, respectively), and ANOVA analysis (Table 5)
shows that there were no statistically significant differences between the Shannon index values
of the two groups (P > 0.05).
23
GROUP SHANNON MEAN SHANNON SD CONTROL 2.693 0.516 EXPERIMENTAL 2.751 0.401
DF F VALUE PR(>F) GROUP 1 0.069 0.796 RESIDUALS 15 NA NA
Figure 11: Shannon index showing measure of richness and evenness in each sample. The graph in this section plots the Shannon index on the y-axis for each sample vs. the number of OTUs assigned to each species in that sample.
Table 5: ANOVA results for Shannon diversity.
Table 4: Shannon diversity summary statistics.
24
These results indicate there is the same level of diversity in each set of samples with no
significant difference. Therefore, the experimental and control groups showed similar
microbiome diversity at the genus level.
3.1.4 Beta Diversity
Beta diversity is a mathematical method for comparing the diversity (or balance) of
species between microbiomes, communities, or samples (28). The values for beta diversity range
from 0 to 1: a value of 0 indicates that the two groups share the same species at the same
abundances, while a value of 1 indicates that the groups contain completely different species
(29). There are different ways to calculate beta diversity. In this study, the Bray–Curtis
dissimilarity method was applied. This method also considers both the total number of different
species present and their relative abundance. All profiles were inter-compared in a pair-wise
fashion to determine a dissimilarity score and store it in a distance dissimilarity matrix. Distance
functions produced low dissimilarity scores when comparing similar samples. Abundance-
weighted sample pair-wise differences were calculated using the Bray-Curtis dissimilarity. Bray-
Curtis dissimilarity is calculated by the ratio of the summed absolute differences in counts to the
sum of abundances in the two samples (31).
To obtain a graphical representation of microbiome composition similarity among
samples, OTU abundances were summarized into Bray-Curtis dissimilarities and a Principal
Coordinate Analysis ordination (PCoA) was performed. PCoA provides a way to visualize
similarities or dissimilarities between samples (29). With the Bray–Curtis method, we are
looking at dissimilarities. This conclusion may be correct since this measure is one of species
diversity.
25
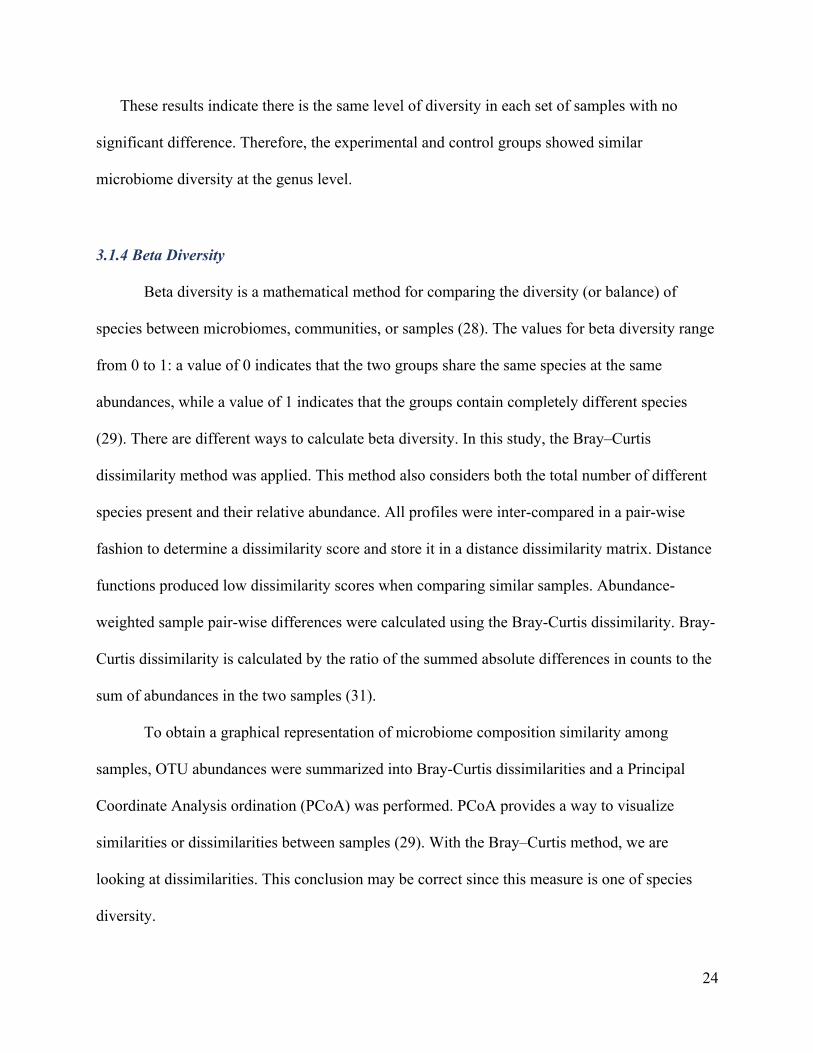
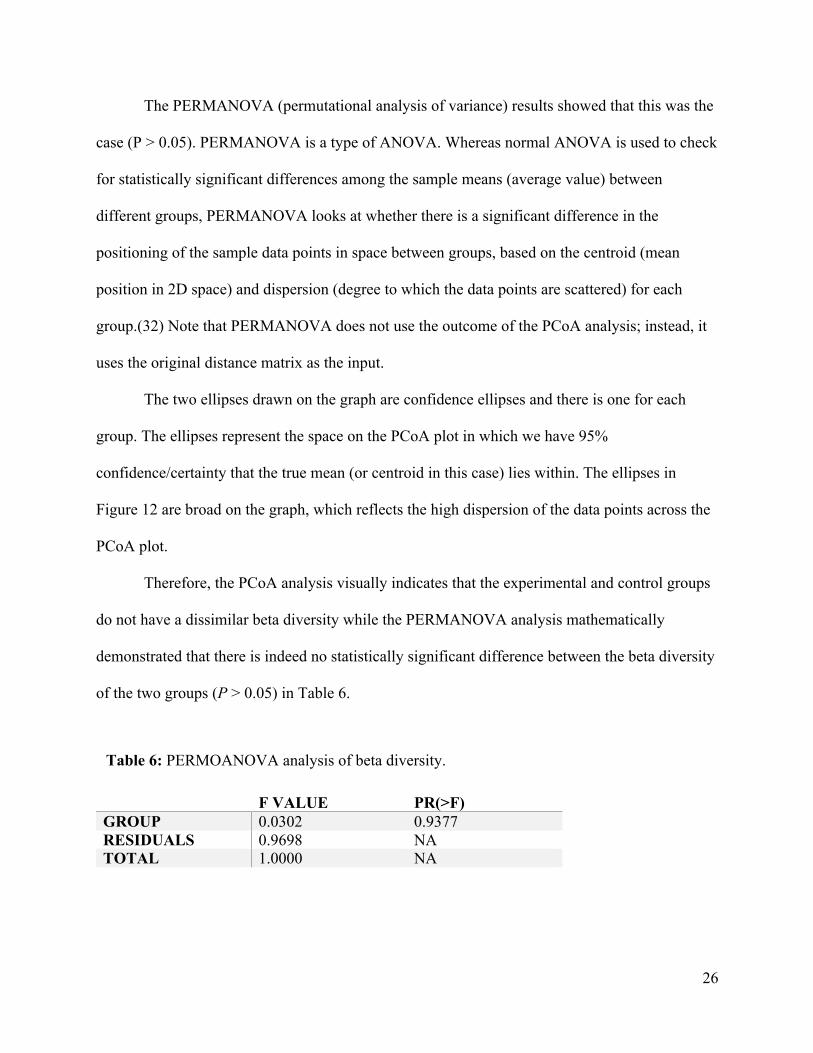
To do a PCoA, a matrix was first generated of the differences (or “distances”) between each
of the pairwise comparisons for each of the 17 samples. This matrix is called the Bray–Curtis
dissimilarity matrix. PCoA then mathematically transforms the dissimilarity matrix into a smaller
number of variables called the principal coordinates. The process of mathematical transformation
assigned each of the values in the matrix to a position in low-dimensional space. Figure 12
shows the data reduced to two dimensions as there are two principal coordinates, PCoA 1 and
PCoA2. The samples in neither the experimental group nor the control group showed any
clustering on the PCoA graph. Instead, the samples are scattered in position across the graph.
Therefore, just looking at the PCoA graph, it can be inferred that the beta diversity among the
two groups was similar.
Figure 12: Ordination of microbiome composition for all specimens according to Bray-Curtis dissimilarities.
26
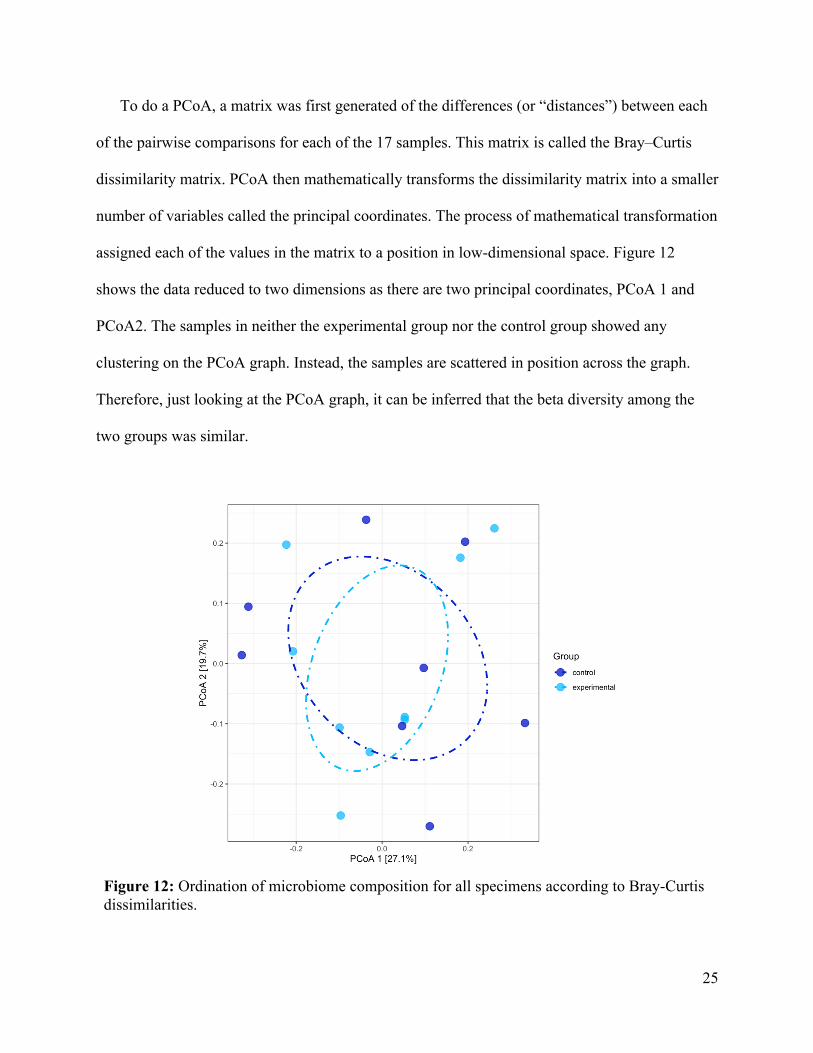
The PERMANOVA (permutational analysis of variance) results showed that this was the
case (P > 0.05). PERMANOVA is a type of ANOVA. Whereas normal ANOVA is used to check
for statistically significant differences among the sample means (average value) between
different groups, PERMANOVA looks at whether there is a significant difference in the
positioning of the sample data points in space between groups, based on the centroid (mean
position in 2D space) and dispersion (degree to which the data points are scattered) for each
group.(32) Note that PERMANOVA does not use the outcome of the PCoA analysis; instead, it
uses the original distance matrix as the input.
The two ellipses drawn on the graph are confidence ellipses and there is one for each
group. The ellipses represent the space on the PCoA plot in which we have 95%
confidence/certainty that the true mean (or centroid in this case) lies within. The ellipses in
Figure 12 are broad on the graph, which reflects the high dispersion of the data points across the
PCoA plot.
Therefore, the PCoA analysis visually indicates that the experimental and control groups
do not have a dissimilar beta diversity while the PERMANOVA analysis mathematically
demonstrated that there is indeed no statistically significant difference between the beta diversity
of the two groups (P > 0.05) in Table 6.
F VALUE PR(>F) GROUP 0.0302 0.9377 RESIDUALS 0.9698 NA TOTAL 1.0000 NA
Table 6: PERMOANOVA analysis of beta diversity.
27
3.1.5 Differential Abundance Testing
Differential abundance testing was used to detect differences in species abundance (based
on the OTU counts) between the experimental and control groups. There are three main steps in
this type of analysis: taxonomic classification (performed when the OTUs are generated),
counting the number of OTUs identified per taxonomic unit, and performing statistical analyses
on these data to determine whether there are any significant differences between the groups.
For the statistical analysis step in differential abundance testing, it was performed with
the R package, DESeq2, using negative binomial distribution and the likelihood-ratio test. The
result is that there are no OTUs that have a significantly different abundance between the
experimental and control groups. In other words, there are no significant differences in the
species abundance between the two groups.
3.2 Comparison of oral microbiome of humans with resorptive lesions to oral microbiome of felines
To investigate the possibility of similar oral bacteria between humans with tooth resorption
and felines, the oral microbiome results from objective 1 were compared with the oral
microbiome of felines from two studies which characterized the oral bacteria of felines (23,33).
3.2.1 Feline oral microbiome
A 2015 study by Dewhirst et al. identified the feline oral bacterial species present and
generated a list of reference sequences for future next generation sequencing studies (33). In this
study by Dewhirst et al., they identified 246 full-length 16S rRNA sequences representing a total
of 171 different bacterial taxa, but not the abundancies of each species (33). These oral bacteria
were isolated from 20 cats aged between one and seven years old. Ten of the cats were
periodontally healthy and ten had periodontitis (33). Samples taken from different sub gingival
28
areas of the mouth cavity were pooled for individual cats, and the samples from the two groups
were then pooled in turn (33). This resulted in two DNA pools, one from the ten periodontally
healthy cats and one from the ten periodontally diseased cats. Each DNA pool was amplified to
make clone libraries using primers toward 16S rRNA (33).
Feline oral taxa in 11 phyla were identified in this study: Firmicutes, 72; Proteobacteria,
38; Bacteroidetes, 26; Spirochaetes, 16; Actinobacteria, 10; Synergistetes, 4; Chlorobi, 1;
Chloroflexi, 1; Fusobacteria, 1; SR1, 1; and TM7, 1 (33). The results from the Dewhirst et al
study suggest that the “feline oral microbiota are largely conserved between cats at the phylum
level, and that the population is highly diverse, rich and even. A strong core microbiome was
evident among all cats, yet significant differences in oral bacterial populations were observed
across cats in each household.” (33)
A 2021 study by Thomas et al is the first of its kind to compare the feline oral
microbiome of healthy cats to the microbiome of cats with FORL (23). Supra gingival oral
plaque samples were taken from 25 healthy cats and 40 cats with FORL (23). DNA was
extracted, the V4 region of the 16S rRNA gene was amplified by PCR and the amplicons were
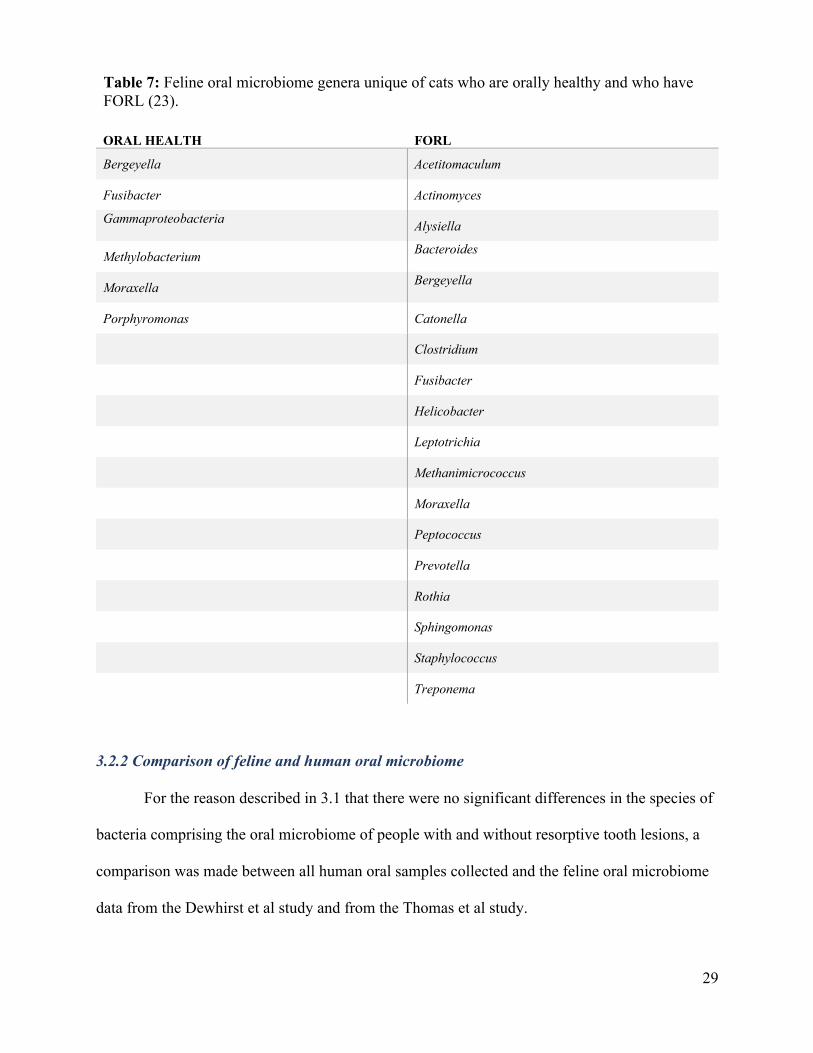
sequenced (23). The study identified six genera unique to the oral microbiome of healthy cats
and 18 genera unique to the oral microbiome of cats with FORL (Table 7)(23). The study found
no association between any specific bacterial species and FORL and further to that there were no
oral microbiome species differences between orally healthy cats and cats with FORL (23). No
abundancies or complete data sets were available from the study.
29
ORAL HEALTH FORL
Bergeyella Acetitomaculum
Fusibacter Actinomyces
Gammaproteobacteria Alysiella
Methylobacterium Bacteroides
Moraxella Bergeyella
Porphyromonas Catonella
Clostridium
Fusibacter
Helicobacter
Leptotrichia
Methanimicrococcus
Moraxella
Peptococcus
Prevotella
Rothia
Sphingomonas
Staphylococcus
Treponema
3.2.2 Comparison of feline and human oral microbiome
For the reason described in 3.1 that there were no significant differences in the species of
bacteria comprising the oral microbiome of people with and without resorptive tooth lesions, a
comparison was made between all human oral samples collected and the feline oral microbiome
data from the Dewhirst et al study and from the Thomas et al study.
Table 7: Feline oral microbiome genera unique of cats who are orally healthy and who have FORL (23).
30
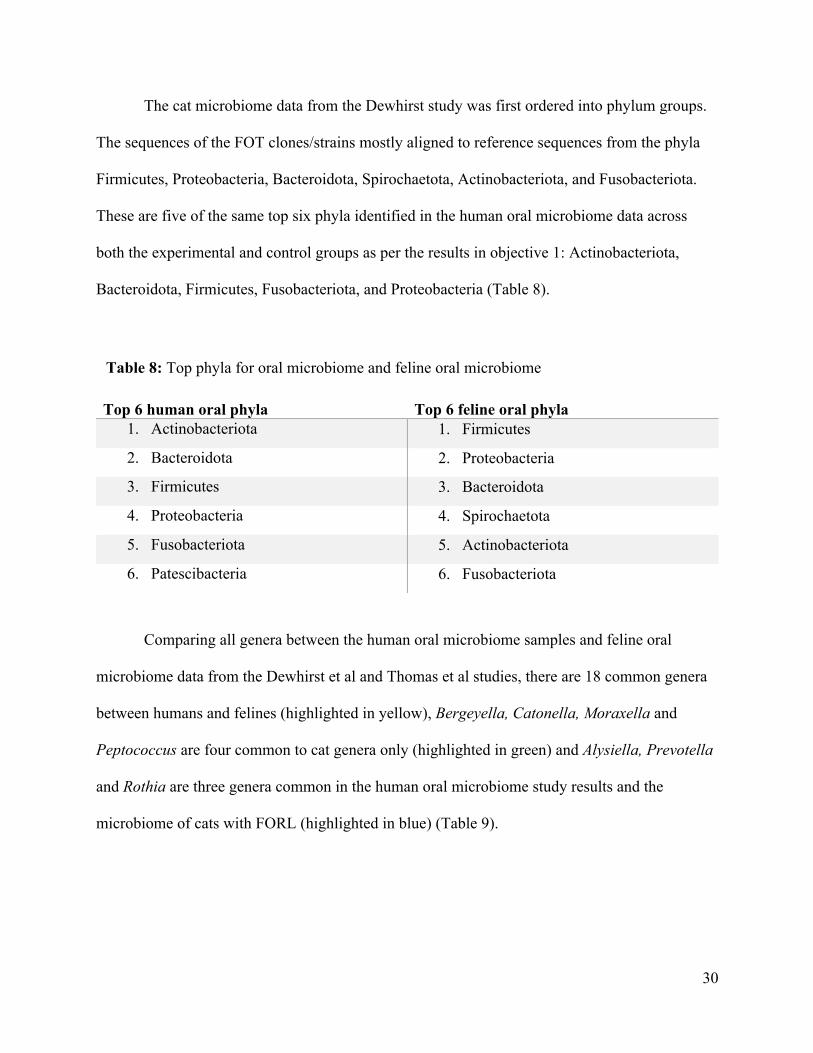
The cat microbiome data from the Dewhirst study was first ordered into phylum groups.
The sequences of the FOT clones/strains mostly aligned to reference sequences from the phyla
Firmicutes, Proteobacteria, Bacteroidota, Spirochaetota, Actinobacteriota, and Fusobacteriota.
These are five of the same top six phyla identified in the human oral microbiome data across
both the experimental and control groups as per the results in objective 1: Actinobacteriota,
Bacteroidota, Firmicutes, Fusobacteriota, and Proteobacteria (Table 8).
Top 6 human oral phyla Top 6 feline oral phyla 1. Actinobacteriota 1. Firmicutes
2. Bacteroidota 2. Proteobacteria
3. Firmicutes 3. Bacteroidota
4. Proteobacteria 4. Spirochaetota
5. Fusobacteriota 5. Actinobacteriota
6. Patescibacteria 6. Fusobacteriota
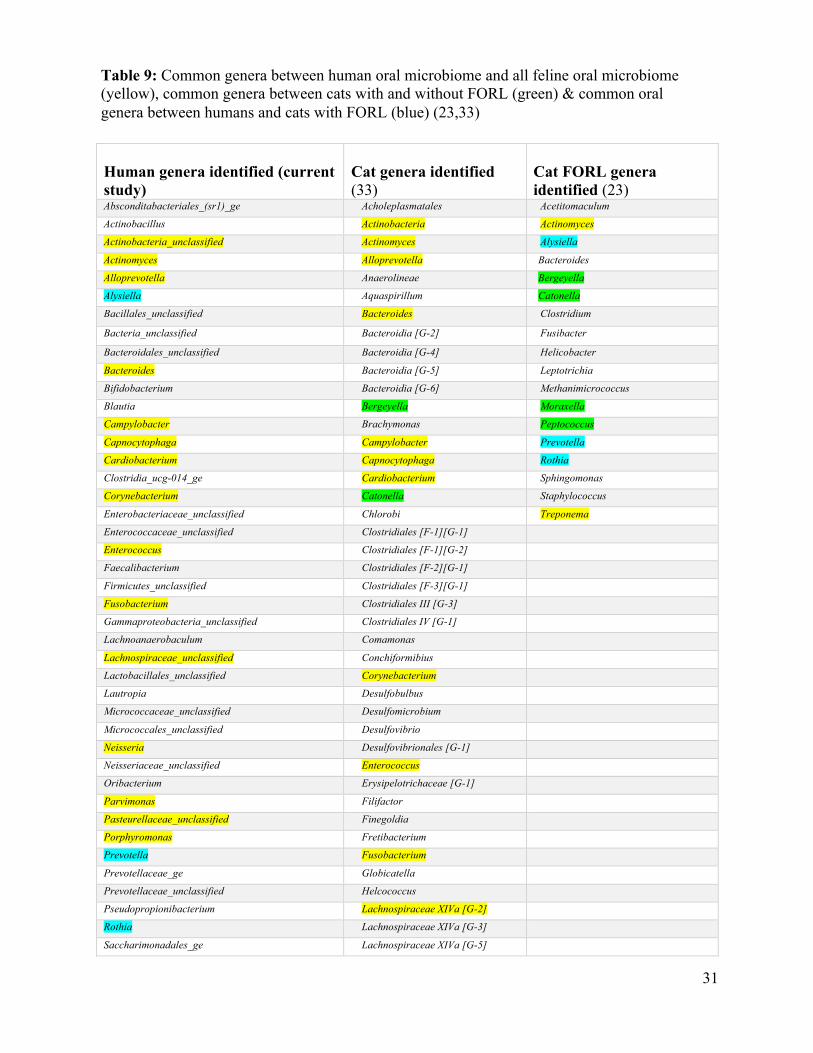
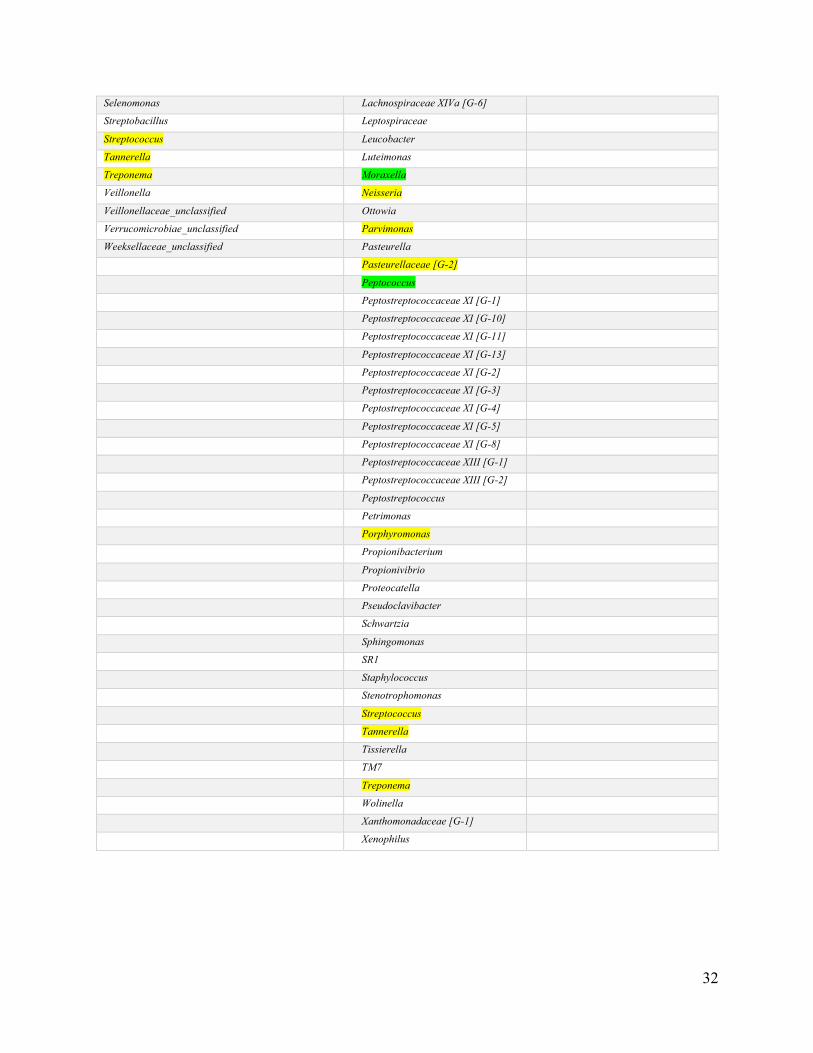
Comparing all genera between the human oral microbiome samples and feline oral
microbiome data from the Dewhirst et al and Thomas et al studies, there are 18 common genera
between humans and felines (highlighted in yellow), Bergeyella, Catonella, Moraxella and
Peptococcus are four common to cat genera only (highlighted in green) and Alysiella, Prevotella
and Rothia are three genera common in the human oral microbiome study results and the
microbiome of cats with FORL (highlighted in blue) (Table 9).
Table 8: Top phyla for oral microbiome and feline oral microbiome
31
Human genera identified (current study)
Cat genera identified (33)
Cat FORL genera identified (23)
Absconditabacteriales_(sr1)_ge Acholeplasmatales Acetitomaculum
Actinobacillus Actinobacteria Actinomyces
Actinobacteria_unclassified Actinomyces Alysiella
Actinomyces Alloprevotella Bacteroides
Alloprevotella Anaerolineae Bergeyella
Alysiella Aquaspirillum Catonella
Bacillales_unclassified Bacteroides Clostridium
Bacteria_unclassified Bacteroidia [G-2] Fusibacter
Bacteroidales_unclassified Bacteroidia [G-4] Helicobacter
Bacteroides Bacteroidia [G-5] Leptotrichia
Bifidobacterium Bacteroidia [G-6] Methanimicrococcus
Blautia Bergeyella Moraxella
Campylobacter Brachymonas Peptococcus
Capnocytophaga Campylobacter Prevotella
Cardiobacterium Capnocytophaga Rothia
Clostridia_ucg-014_ge Cardiobacterium Sphingomonas
Corynebacterium Catonella Staphylococcus
Enterobacteriaceae_unclassified Chlorobi Treponema
Enterococcaceae_unclassified Clostridiales [F-1][G-1]
Enterococcus Clostridiales [F-1][G-2]
Faecalibacterium Clostridiales [F-2][G-1]
Firmicutes_unclassified Clostridiales [F-3][G-1]
Fusobacterium Clostridiales III [G-3]
Gammaproteobacteria_unclassified Clostridiales IV [G-1]
Lachnoanaerobaculum Comamonas
Lachnospiraceae_unclassified Conchiformibius
Lactobacillales_unclassified Corynebacterium
Lautropia Desulfobulbus
Micrococcaceae_unclassified Desulfomicrobium
Micrococcales_unclassified Desulfovibrio
Neisseria Desulfovibrionales [G-1]
Neisseriaceae_unclassified Enterococcus
Oribacterium Erysipelotrichaceae [G-1]
Parvimonas Filifactor
Pasteurellaceae_unclassified Finegoldia
Porphyromonas Fretibacterium
Prevotella Fusobacterium
Prevotellaceae_ge Globicatella
Prevotellaceae_unclassified Helcococcus
Pseudopropionibacterium Lachnospiraceae XIVa [G-2]
Rothia Lachnospiraceae XIVa [G-3]
Saccharimonadales_ge Lachnospiraceae XIVa [G-5]
Table 9: Common genera between human oral microbiome and all feline oral microbiome (yellow), common genera between cats with and without FORL (green) & common oral genera between humans and cats with FORL (blue) (23,33)
32
Selenomonas Lachnospiraceae XIVa [G-6]
Streptobacillus Leptospiraceae
Streptococcus Leucobacter
Tannerella Luteimonas
Treponema Moraxella
Veillonella Neisseria
Veillonellaceae_unclassified Ottowia
Verrucomicrobiae_unclassified Parvimonas
Weeksellaceae_unclassified Pasteurella
Pasteurellaceae [G-2]
Peptococcus
Peptostreptococcaceae XI [G-1]
Peptostreptococcaceae XI [G-10]
Peptostreptococcaceae XI [G-11]
Peptostreptococcaceae XI [G-13]
Peptostreptococcaceae XI [G-2]
Peptostreptococcaceae XI [G-3]
Peptostreptococcaceae XI [G-4]
Peptostreptococcaceae XI [G-5]
Peptostreptococcaceae XI [G-8]
Peptostreptococcaceae XIII [G-1]
Peptostreptococcaceae XIII [G-2]
Peptostreptococcus
Petrimonas
Porphyromonas
Propionibacterium
Propionivibrio
Proteocatella
Pseudoclavibacter
Schwartzia
Sphingomonas
SR1
Staphylococcus
Stenotrophomonas
Streptococcus
Tannerella
Tissierella
TM7
Treponema
Wolinella
Xanthomonadaceae [G-1]
Xenophilus
33
3.3 Variables of interest that influence the opportunity for cross-species transmission of oral bacteria between humans and felines
Initially 20 participants were enrolled in the study. Each participant completed a
questionnaire (Appendix A) and the descriptive analysis of the results from the questionnaire
was based on all 20 responses. Unlike the need to exclude three participants from data analysis in
objectives 1 and 2 due to low samples collection, all 20 completed questionnaires were assessed.
The questionnaire questions were a combination of dichotomous, multiple choice (single answer
and multiple answers), Likert scale and open-ended questions to assist in identifying any human
factors potentially influencing the oral microbiota and the factors that may influence the oral
cross-species transmission between humans and felines.
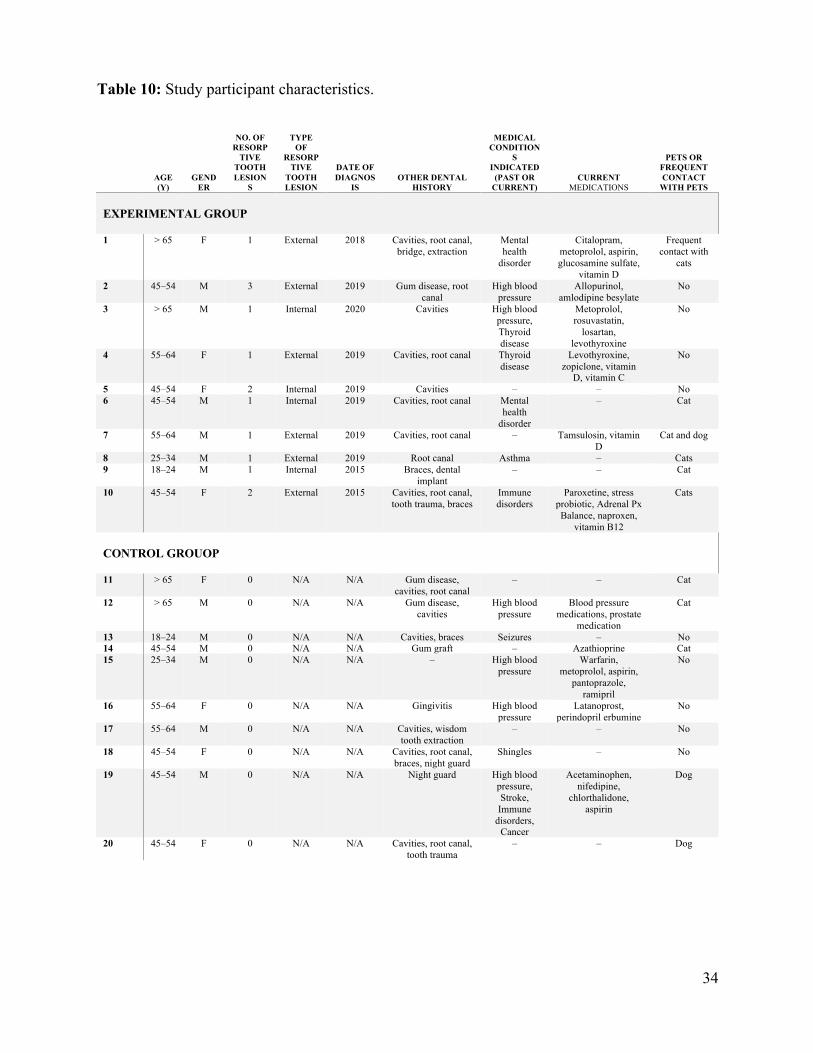
3.3.1 Study participant characteristics
Table 10 summarizes the characteristics of each participant based on age, gender,
presence of tooth resorption, type of tooth resorption, number of tooth resorptions, date of
diagnoses of tooth resorption, health and dental history, current medications and contact with
cats and/or other animals.
34
AGE (Y)
GENDER
NO. OF RESORP
TIVE TOOTH LESION
S
TYPE OF
RESORPTIVE
TOOTH LESION
DATE OF DIAGNOS
IS OTHER DENTAL
HISTORY
MEDICAL CONDITION
S INDICATED
(PAST OR CURRENT)
CURRENT MEDICATIONS
PETS OR FREQUENT CONTACT
WITH PETS EXPERIMENTAL GROUP
1 > 65 F 1 External 2018 Cavities, root canal,
bridge, extraction Mental health
disorder
Citalopram, metoprolol, aspirin, glucosamine sulfate,
vitamin D
Frequent contact with
cats
2 45–54 M 3 External 2019 Gum disease, root canal
High blood pressure
Allopurinol, amlodipine besylate
No
3 > 65 M 1 Internal 2020 Cavities High blood pressure, Thyroid disease
Metoprolol, rosuvastatin,
losartan, levothyroxine
No
4 55–64 F 1 External 2019 Cavities, root canal Thyroid disease
Levothyroxine, zopiclone, vitamin
D, vitamin C
No
5 45–54 F 2 Internal 2019 Cavities – – No 6 45–54 M 1 Internal 2019 Cavities, root canal Mental
health disorder
– Cat
7 55–64 M 1 External 2019 Cavities, root canal – Tamsulosin, vitamin D
Cat and dog
8 25–34 M 1 External 2019 Root canal Asthma – Cats 9 18–24 M 1 Internal 2015 Braces, dental
implant – – Cat
10 45–54 F 2 External 2015 Cavities, root canal, tooth trauma, braces
Immune disorders
Paroxetine, stress probiotic, Adrenal Px Balance, naproxen,
vitamin B12
Cats
CONTROL GROUOP
11 > 65 F 0 N/A N/A Gum disease,
cavities, root canal – – Cat
12 > 65 M 0 N/A N/A Gum disease, cavities
High blood pressure
Blood pressure medications, prostate
medication
Cat
13 18–24 M 0 N/A N/A Cavities, braces Seizures – No 14 45–54 M 0 N/A N/A Gum graft – Azathioprine Cat 15 25–34 M 0 N/A N/A – High blood
pressure Warfarin,
metoprolol, aspirin, pantoprazole,
ramipril
No
16 55–64 F 0 N/A N/A Gingivitis High blood pressure
Latanoprost, perindopril erbumine
No
17 55–64 M 0 N/A N/A Cavities, wisdom tooth extraction
– – No
18 45–54 F 0 N/A N/A Cavities, root canal, braces, night guard
Shingles – No
19 45–54 M 0 N/A N/A Night guard High blood pressure, Stroke, Immune
disorders, Cancer
Acetaminophen, nifedipine,
chlorthalidone, aspirin
Dog
20 45–54 F 0 N/A N/A Cavities, root canal, tooth trauma
– – Dog
Table 10: Study participant characteristics.
35
3.3.2 Method to analyze descriptive data
The first step to analyzing the descriptive data was to collapse and remove as many of the
columns where there were clearly too many different responses with too few counts of each for
statistical analysis to be performed. For example, the brand of mouthwash used, and the health
conditions of the participants were removed. As another example, where there were answers for
each of the participant’s cats (cat 1, 2, and 3, etc.), an average data value was calculated across
all of the cats. Once the data was cleaned up in this manner, it was then ready for analyses.
When analyzing survey categorical data such as (e.g., male vs. female, groups coded into
categories such as “1” for “visits dentist twice a year” and “2” for “visits dentist once per year”
etc.), the Chi-square test is usually carried out when looking for associations between two
categorical variables, whereas log-linear analysis is usually carried out for three or more
categorical variables.
However, both Chi-square and log-linear analysis can only be robustly performed if the
data meet certain assumptions, and in the case of this study, the following assumption was
always violated: more than 80% of the expected cell counts must be > 5 in value. Because the
data failed these assumptions, the Fisher Exact Test was used for each of the associations
discussed below. NCSS reported the Fisher Exact Test result where only 2 categorical variables
were involved. Where the data formed a 2×3 table, the VassarStats online suite of tools was used
(http://vassarstats.net/) to perform the Freeman–Halton extension of the Fisher Exact Test.
All these analyses assumed that the participants were only selected into one of the two
groups (control or experimental) based on their history of tooth resorption and that pet
ownership, age, etc., were not selected for (i.e., all other variables were random).
36
3.3.3 Relevant questions from the descriptive data
Looking at the cleaned up descriptive data, the following questions seemed most relevant:
1. Is there any association between the number of tooth lesions and whether the study
participant has a cat or frequent contact with cats? Or perhaps pets in general?
2. Is there any association between the number of tooth lesions and participant age?
3. Is there any association between the number of tooth lesions and participant sex?
4. Do humans with tooth resorption (experimental group) have worse oral hygiene than
those without tooth resorption (control group)?
3.3.3.1 Question 1: Is there any association between the number of tooth lesions and whether the study participant has a cat or frequent contact with cats? Or perhaps pets in general?
This question was analyzed in several ways. First, any association between having a cat
as a pet and the participant groups (control vs. experimental) was checked. This is confirming the
assumption that the participants were chosen randomly with respect to whether they had cats or
not. There was no significant association (Fisher Exact P > 0.05).
Second, any association between having a cat as a pet and/or frequent contact with cats
and the participant groups (control vs. experimental) was checked. Again, this is confirming the
assumption that the participants were chosen randomly with respect to whether they had cats or
not. There was no significant association (Fisher Exact P > 0.05).
Third, any association between having a cat and/or dog as a pet and/or frequent contact
with cats and the participant groups (control vs. experimental) was checked. Again, this is
confirming the assumption that the participants were chosen randomly with respect to whether
they had pets or not. There was no significant association (Fisher Exact P > 0.05).
37
Fourth, the association between the experimental group, individuals with ERL or IRL,
and having a cat was checked. There was no significant association (Fisher Exact Test P > 0.05).
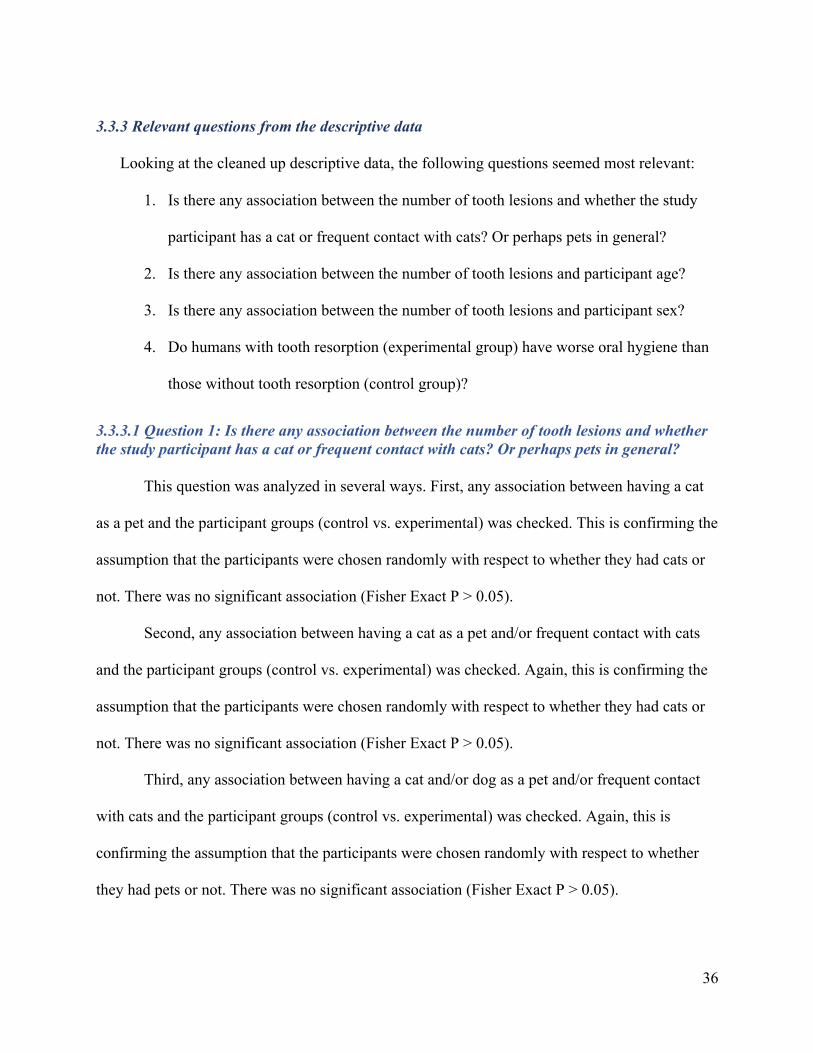
Fifth, instead of dividing the data into control vs. experimental, it was divided into the
number of lesions present: 0 lesions, 1 lesion, 2+ lesions. The association between having a cat
and/or dogs as a pet and/or frequent contact with cats and the number of lesions was checked.
There was no significant association (Figure 13 Freeman–Halton extension of the Fisher Exact
Test P > 0.05).
Figure 13: Freeman–Halton extension of the Fisher Exact Test P > 0.05 Association between pets and lesions: C1 = no lesions, C2 = 1 lesion, C3 = 2 or more lesions R1 = No cats or dogs or frequent contact with cats R2 = Have cats or dogs or frequent contact with cats
38
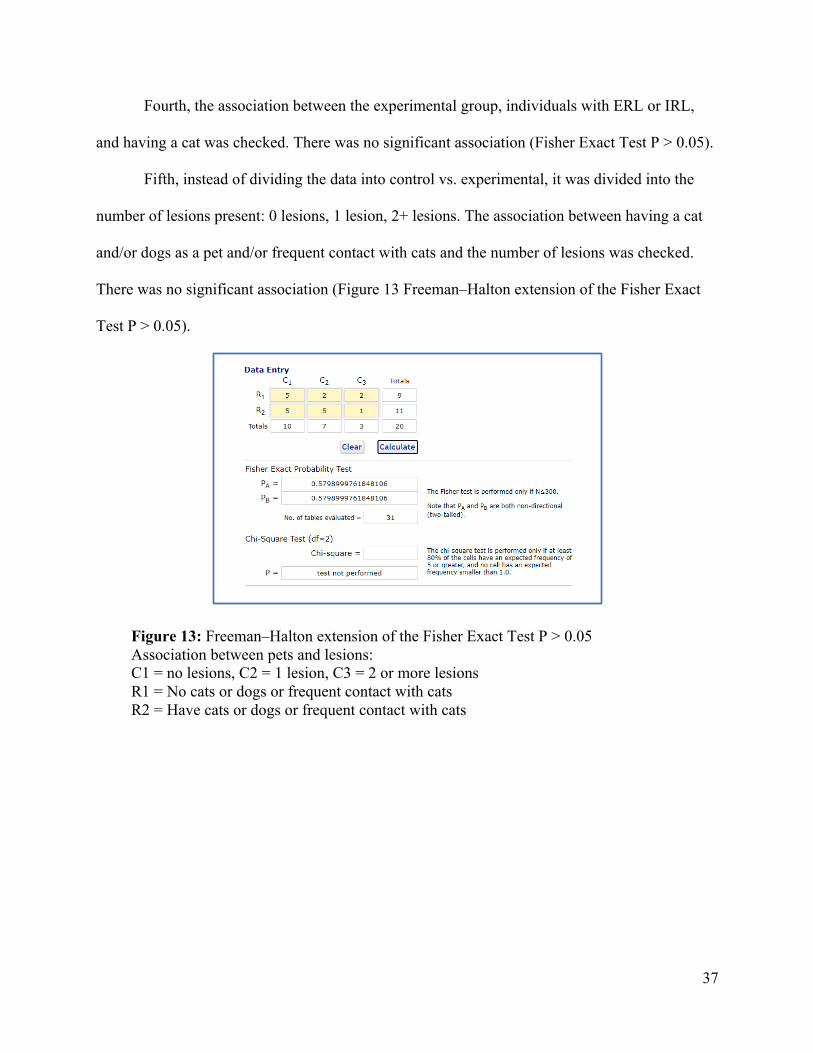
3.3.3.2 Question 2: Is there any association between the number of tooth lesions and participant age?
Using the data divided into the number of lesions present, any association between
participant age and the number of lesions was checked. There was no significant association
P>0.05 (Figure 14).
Figure 14: Freeman–Halton extension of the Fisher Exact Test P > 0.05 Association between age and lesions: C1 = no lesions, C2 = 1 lesion, C3 = 2 or more lesions R1 = Younger study participants (Coded age groups 1 to 4) R2 = Older study participants (Coded age groups 5 and 6)
39
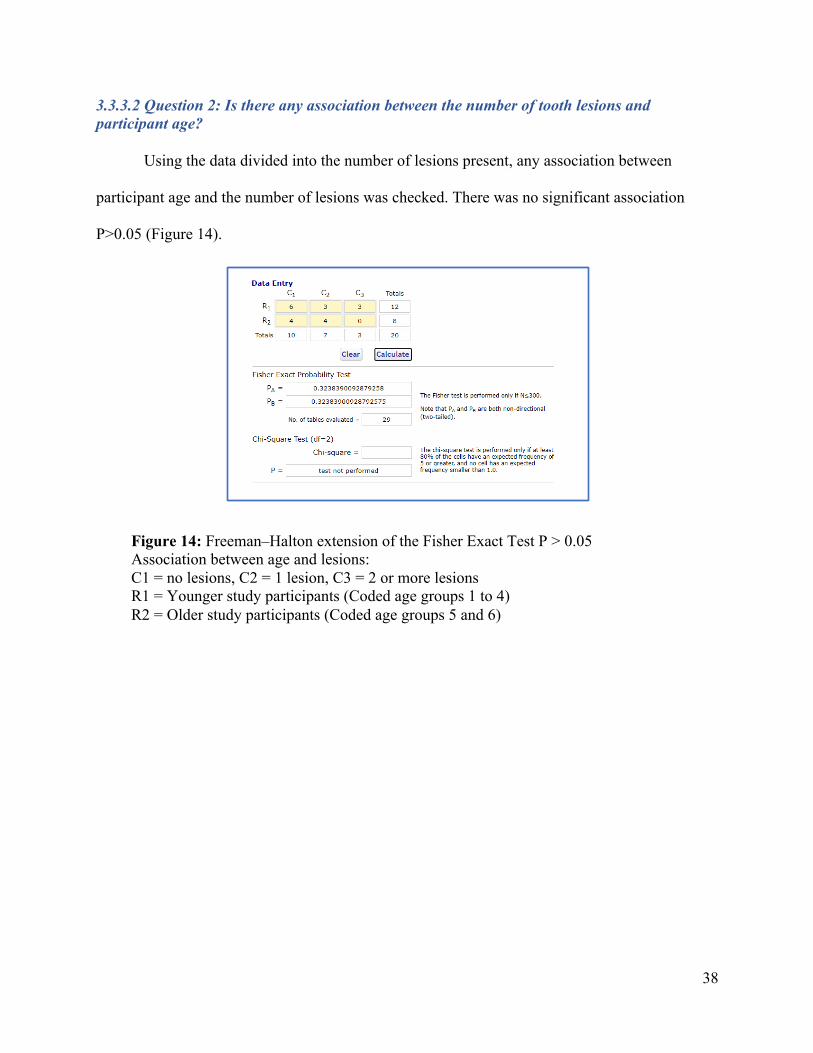
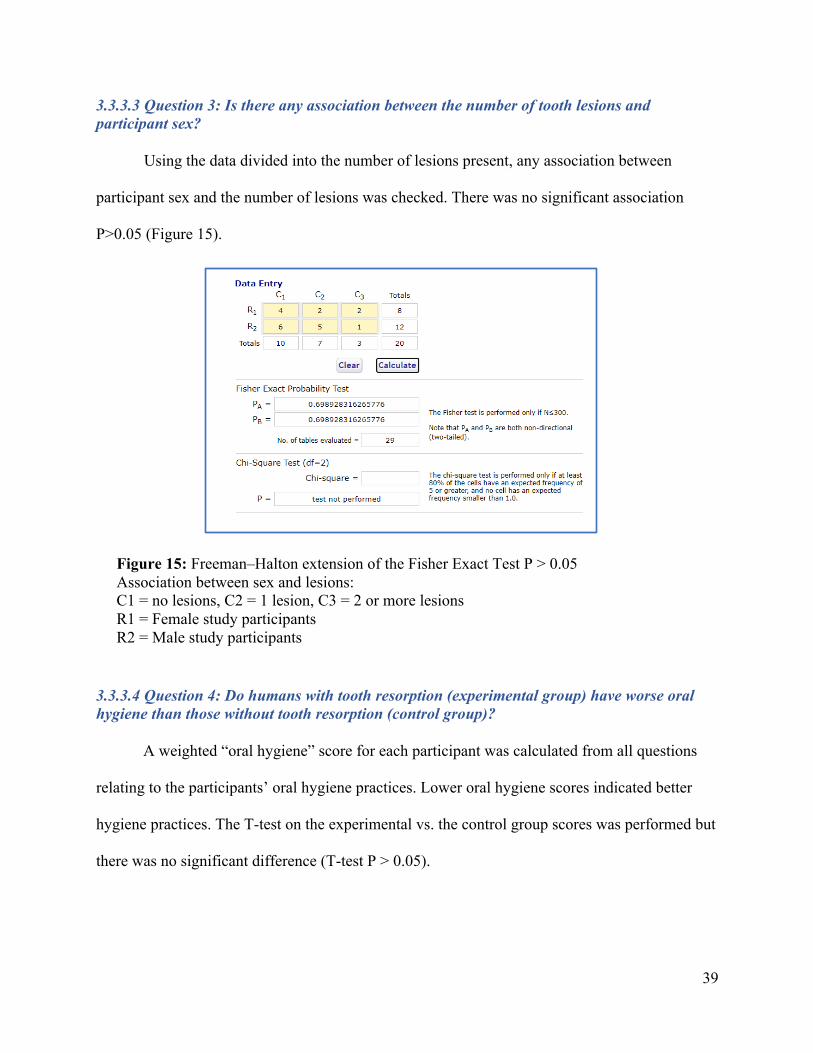
3.3.3.3 Question 3: Is there any association between the number of tooth lesions and participant sex?
Using the data divided into the number of lesions present, any association between
participant sex and the number of lesions was checked. There was no significant association
P>0.05 (Figure 15).
3.3.3.4 Question 4: Do humans with tooth resorption (experimental group) have worse oral hygiene than those without tooth resorption (control group)?
A weighted “oral hygiene” score for each participant was calculated from all questions
relating to the participants’ oral hygiene practices. Lower oral hygiene scores indicated better
hygiene practices. The T-test on the experimental vs. the control group scores was performed but
there was no significant difference (T-test P > 0.05).
Figure 15: Freeman–Halton extension of the Fisher Exact Test P > 0.05 Association between sex and lesions: C1 = no lesions, C2 = 1 lesion, C3 = 2 or more lesions R1 = Female study participants R2 = Male study participants
40
Chapter 4. Discussion
This mixed method case control study assessed: 1. the oral microbiome of humans with tooth
resorption and compared it to the oral microbiome of humans without tooth resorption, 2. the
oral microbiome of humans with tooth resorption and compared it to the feline oral microbiome
and 3. the association between human tooth resorption and contact with felines. To the best of
my knowledge this is the first study investigating the oral microbiome of humans with tooth
resorption and contact with felines. The overall results of the study indicate that there is no
significant difference in the oral microbiome of humans with and without tooth resorption; the
human oral microbiome and the microbiome of cats with and without tooth resorption is highly
similar with three bacterial genera being similar in the human oral microbiome and the oral
microbiome of felines with tooth resorption (Alysiella, Prevotella and Rothia); and there are no
significant differences between the association of tooth resorption and contact with felines.
4.1 Study Implications
When comparing the oral microbiome of humans with resorptive tooth lesions to matched
controls for approximate age and gender without resorptive tooth lesions, taxonomic
composition, differential abundance testing, alpha diversity and beta diversity results all
demonstrated that there were no significant differences between the two groups.
A healthy oral microbiome is in a state of equilibrium however when oral disease is present,
we see a shift in the balance of oral bacteria (34,35). Pathogenic bacteria become dominant
species in the presence of oral disease and the microbial shift to oral disease is known as oral
dysbiosis (35). The oral microbiome of humans with periodontal disease and caries has been well
studied and it has been shown that there are specific bacteria associated with each of the fore
mentioned oral diseases (34,35). There is also evidence to suggest that it is the alpha diversity,
41
relative number and abundance of species, which can influence disease (35). This is information
that has come from years of research and studying these oral diseases. The widespread
prevalence of these oral diseases makes studying them less complicated (35–37). With no
previous oral microbiome research on tooth resorption in humans and the low prevalence of
these lesions, this pilot study has attempted to fill that gap. With a small sample size though, it is
difficult to achieve statistically significant results (p > 0.05), but inferences can be made using
what we know about oral microbiome dysbiosis that further research might show a more
pronounced shift in the oral microbiome of humans with ERL and IRL.
With ERL and IRL, there are very few clinical signs or symptoms that would be visible to the
patient or clinician which make them difficult to diagnosis (2,9). By the time tooth resorptive
lesions are either clinically or radiographically visible, there is usually extensive damage to the
tooth (2,9). At that point the tooth is often unrestorable and requires extraction or extensive,
expensive dental treatment and long-term, the tooth remains compromised (2,9). With
periodontal disease and caries however, there are clinical signs and symptoms which can be
assessed to make a diagnosis including oral bacterial testing (37). Often those clinical
assessments can be done early and before the chance for the disease to progress (37). The results
of this study do not reveal a unique oral microbiome for humans with ERL or IRL. Not knowing
if there are bacterial species or species abundance differences in the oral microbiome of people
with tooth resorption, prevents the possibility of an earlier diagnosis at a less damaging stage.
Due to the lack of statistical significance between the oral microbiome of the controls and
experimental groups, a comparison was done between all human oral microbiome study samples
and the feline oral microbiome results from the Thomas et al and the Dewhirst et al studies
(23,33). Overall, it was found that humans and felines share a similar oral microbiome. There
42
were 18 common oral microbiome genera between humans and felines; pathogenic and non-
pathogenic. These findings support the theory that it may not be the differences in the oral
microbiomes between humans and felines that influence the develop of resorptive tooth lesions,
but the similarities.
Even though cats have a higher prevalence of FORL than humans (19), the Thomas study is
the first of its kind looking at the oral microbiome of cats with FORL (23). The Thomas et al
study did not find any specific bacteria associated with FORL but did identify one subgroup of
cats with FORL who had an altered microbiota in comparison to the orally healthy cats and
compared to a second subgroup of cats with FORL suggesting that a shift in feline microbiome
may be enough trigger virulence and inflammation and result in the development of FORL in
susceptible cats (23).
When comparing the human oral microbiome study results to the oral microbiome of cats
with FORL from the Thomas et al study, three common genera were identified: Alysiella,
Prevotella and Rothia (23). The average abundances of these genera in the cases and controls of
the current study were very similar with Rothia being the second most abundant genus in both
humans with and without tooth resorption (11.9% and 13.3% respectively). Rothia is a
facultative anaerobic gram positive rod found in healthy and diseased mouths and the R
dentocariosa species has been linked to infective endocarditis in immunocompromised patients
with poor oral hygiene (38,39). The study survey results from the ten cases are not able to
provide statistically significant results to imply that an individual with poor oral hygiene and
who is medically compromised is more likely to develop tooth resorption. It is interesting to note
though that out of the ten study cases with tooth resorption, four reported being affected by at
least one systemic disease and one had an immune disorder. The study participant with an
43
immune disorder had two resorptive tooth lesions and was a cat owner. As a common and more
abundant species in humans and cats with FORL and its association with other oral diseases and
systemic infections, it is possible that the presence of Rothia may be involved in the virulence
and development of tooth resorption in humans and felines (23,38,39).
The number of samples in each group was very low, which limited the descriptive statistical
analyses that could be performed. There was no statistically significant association between the
presence or number of the participants’ tooth lesions and having cats (and/or dogs or frequent
contact with cats). Similarly, there was no significant association between the number of the
participants’ tooth lesions and their age or sex. Finally, a weighted oral hygiene score was
calculated for all study participants, but no statistically significant difference was found in this
score between the experimental and control groups. These descriptive results loosely imply that
any individual at any age, of any gender, with poor or good oral hygiene habits and with or
without contact with cats or other animals may be at risk for ERL or IRL.
Because the oral microbiomes of humans with tooth resorption and cats with tooth resorption
have not been well studied, there is no previous research to make direct comparisons to the
current study. The current study implies there are no connections between human tooth
resorption and cat ownership or contact with cats. However, research has shown that people who
have pets share a similar oral microbiome to their owners (22,40). Research has also reported the
transmission bacterial pathogen associated with dental caries, from caregiver to child (vertical)
or from the environment (horizontal)(36). It is sensible to infer then that the opportunities for the
transmission of oral bacteria between pets and humans exist and pathogenic oral bacteria
typically found in pets, could initiate a shift in the oral microbiome of humans to a state of
dysbiosis and the triggering of a disease response.
44
One Health speaks to this very idea that human health is influenced by the health of our
environment and the health of the animals we share our environment with (41,42). Medical
issues are becoming more complex, are multifactorial and involve species of non-human origin
(41,42). Looking at health concerns collaboratively through medical, veterinary, and ecological
science lenses, may fill existing knowledge gaps and improve health for all (41,42).
4.2 Study Limitations & Future Directions
The study’s biggest limitation was the small sample size. With no previous research in this
area, it was challenging to determine the parameters necessary for a sample size calculation
(43,44). However, pragmatic considerations and logistics (time to recruit, costs, etc.) suggested
that a sample size of 15 cases (patients with resorptive lesions) and 15 controls (patients selected
to match approximately for age and sex) would both be practicable and provide adequate
information to inform future research in this area (43,44). Because this study was interrupted by
COVID19, the sample size was further reduced to ten cases and ten controls. The small sample
size numbers may have greatly impacted the results as there were no significant results in this
study from the quantitative or qualitative data. Continuing to study the oral microbiome of
people with tooth resorption to identify a specific oral microbiome and increasing the sample
size would hopefully decrease margins of error and improve power to get a statistically
significant result.
Ownership and/or significant contact with cats was not an inclusion criterion for study
participants (cases or controls) because of the low prevalence of resorptive lesions and including
cat ownership and/or cat contact would have further decreased the sample size. The participant
questionnaire identified cat ownership and/or contact with cats however a future study
45
consideration would be to only include participants with tooth resorption who have cats. Oral
samples could then be taken from both the human participant with tooth resorption and their cat
to make a comparison between the two. Further collaboration with a veterinarian to diagnosis the
oral health of the participants’ cat and confirm the presence of FORL would have beneficial
outcomes for identifying bacteria associated with tooth resorption.
The oral samples taken for the experimental and control groups were from supra gingival
areas of the teeth. Studies looking at the oral microbiome have shown differences in detectable
species when taking saliva samples, supra gingival and sub gingival plaque samples (34,45,46).
This type of sampling could have impacted study results as more diversity could have been
found between the control and experimental groups with sub gingival sampling.
The feline oral microbiome database from the Dewhirst study took plaque samples from the
sub gingival area (33). The current study took supra gingival plaque samples. Comparing the
human supra plaque samples to the sub gingival feline oral samples creates an obvious
discrepancy.
Tooth resorption can be stimulated by dental procedures such as endodontic treatment,
orthodontic treatment, intracoronal bleaching (non-vital tooth bleaching), periodontal treatment
and trauma (2,7,12). One study looking at the factors associated with external cervical tooth
resorption found the majority of cases with tooth resorption were multifactorial (7). This study
also reported associations of poor oral health, parafunctional habits (eg bruxism & nail biting),
systemic health and viral infections with tooth resorption (7). The fact that some case
participants indicated they had previous orthodontic or endodontic treatment may have been an
influential factor to the development of their tooth resorptive lesions. A more detailed
46
investigation into the medical and dental histories of individuals with tooth resorption in the
future studies is necessary, as to prevent any confounding effects on the results.
Overall, more studies are needed in this underdeveloped area of research looking at both the
oral microbiome of humans ERL and IRL and cats with FORL. Once specific pathogenic tooth
resorptive lesion bacteria are identified, the next step would be the look at the mechanisms of
action and how the pathogenic bacteria or shift in taxonomic composition of bacteria trigger the
initiation of a tooth resorption lesion.
4.3 Conclusion
In conclusion, this study suggests that humans with tooth resorption do not have a unique
oral microbiome in abundancies or species. Given the fact that there is such high interindividual
variation in both the human and cat oral microbiomes, with conservation at the phylum rather
than species level, it would be unlikely to observe a significant difference in the oral
microbiomes between humans (with or without tooth resorption) and felines. There is no
evidence to suggest that owning a cat or pet influences the probability of developing tooth
resorptive lesions. The study limitations do indicate that further research is needed in this area as
the implications to better understanding the oral microbiome of people with tooth resorption may
help diagnose this oral disease earlier preventing more destructive damage. Further exploration is
needed on the area of oral health and its connection to the transmission of oral bacteria from
household pets. The health of our environment and the health of the people and animals we share
our environment with may provide us with answers to our unanswered oral health questions and
concerns (41,42).
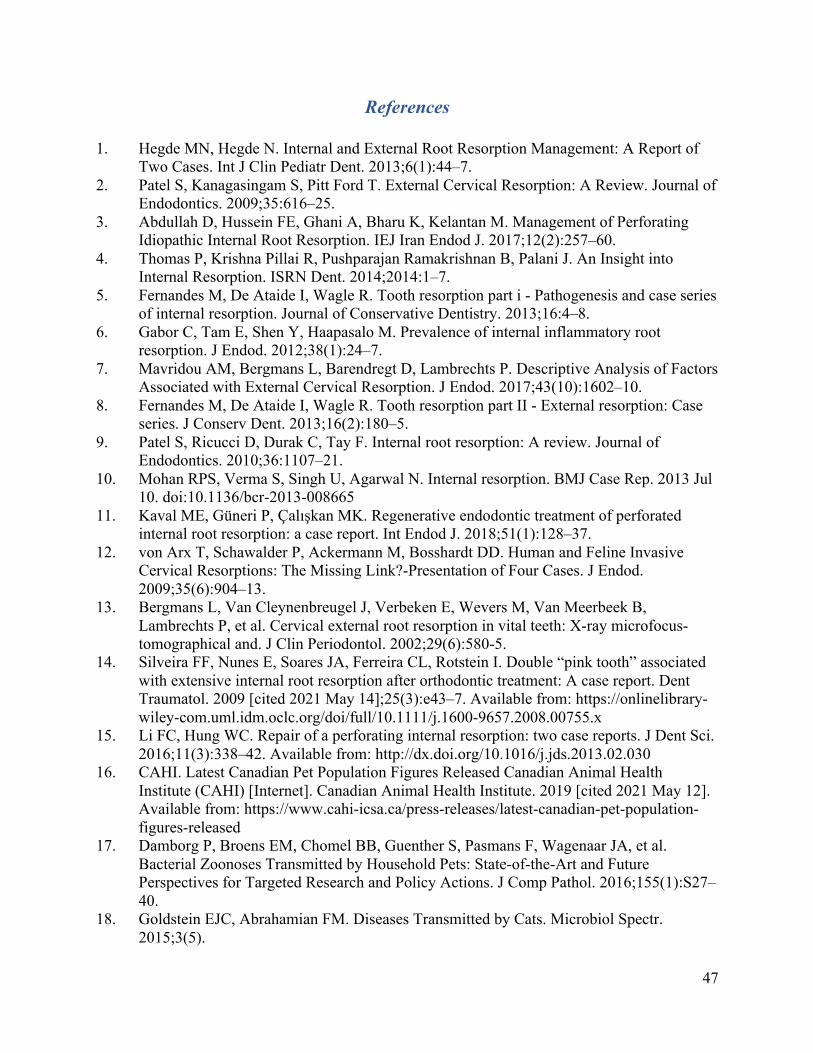
47
References 1. Hegde MN, Hegde N. Internal and External Root Resorption Management: A Report of
Two Cases. Int J Clin Pediatr Dent. 2013;6(1):44–7. 2. Patel S, Kanagasingam S, Pitt Ford T. External Cervical Resorption: A Review. Journal of
Endodontics. 2009;35:616–25. 3. Abdullah D, Hussein FE, Ghani A, Bharu K, Kelantan M. Management of Perforating
Idiopathic Internal Root Resorption. IEJ Iran Endod J. 2017;12(2):257–60. 4. Thomas P, Krishna Pillai R, Pushparajan Ramakrishnan B, Palani J. An Insight into
Internal Resorption. ISRN Dent. 2014;2014:1–7. 5. Fernandes M, De Ataide I, Wagle R. Tooth resorption part i - Pathogenesis and case series
of internal resorption. Journal of Conservative Dentistry. 2013;16:4–8. 6. Gabor C, Tam E, Shen Y, Haapasalo M. Prevalence of internal inflammatory root
resorption. J Endod. 2012;38(1):24–7. 7. Mavridou AM, Bergmans L, Barendregt D, Lambrechts P. Descriptive Analysis of Factors
Associated with External Cervical Resorption. J Endod. 2017;43(10):1602–10. 8. Fernandes M, De Ataide I, Wagle R. Tooth resorption part II - External resorption: Case
series. J Conserv Dent. 2013;16(2):180–5. 9. Patel S, Ricucci D, Durak C, Tay F. Internal root resorption: A review. Journal of
Endodontics. 2010;36:1107–21. 10. Mohan RPS, Verma S, Singh U, Agarwal N. Internal resorption. BMJ Case Rep. 2013 Jul
10. doi:10.1136/bcr-2013-008665 11. Kaval ME, Güneri P, Çalışkan MK. Regenerative endodontic treatment of perforated
internal root resorption: a case report. Int Endod J. 2018;51(1):128–37. 12. von Arx T, Schawalder P, Ackermann M, Bosshardt DD. Human and Feline Invasive
Cervical Resorptions: The Missing Link?-Presentation of Four Cases. J Endod. 2009;35(6):904–13.
13. Bergmans L, Van Cleynenbreugel J, Verbeken E, Wevers M, Van Meerbeek B, Lambrechts P, et al. Cervical external root resorption in vital teeth: X-ray microfocus-tomographical and. J Clin Periodontol. 2002;29(6):580-5.
14. Silveira FF, Nunes E, Soares JA, Ferreira CL, Rotstein I. Double “pink tooth” associated with extensive internal root resorption after orthodontic treatment: A case report. Dent Traumatol. 2009 [cited 2021 May 14];25(3):e43–7. Available from: https://onlinelibrary-wiley-com.uml.idm.oclc.org/doi/full/10.1111/j.1600-9657.2008.00755.x
15. Li FC, Hung WC. Repair of a perforating internal resorption: two case reports. J Dent Sci. 2016;11(3):338–42. Available from: http://dx.doi.org/10.1016/j.jds.2013.02.030
16. CAHI. Latest Canadian Pet Population Figures Released Canadian Animal Health Institute (CAHI) [Internet]. Canadian Animal Health Institute. 2019 [cited 2021 May 12]. Available from: https://www.cahi-icsa.ca/press-releases/latest-canadian-pet-population-figures-released
17. Damborg P, Broens EM, Chomel BB, Guenther S, Pasmans F, Wagenaar JA, et al. Bacterial Zoonoses Transmitted by Household Pets: State-of-the-Art and Future Perspectives for Targeted Research and Policy Actions. J Comp Pathol. 2016;155(1):S27–40.
18. Goldstein EJC, Abrahamian FM. Diseases Transmitted by Cats. Microbiol Spectr. 2015;3(5).
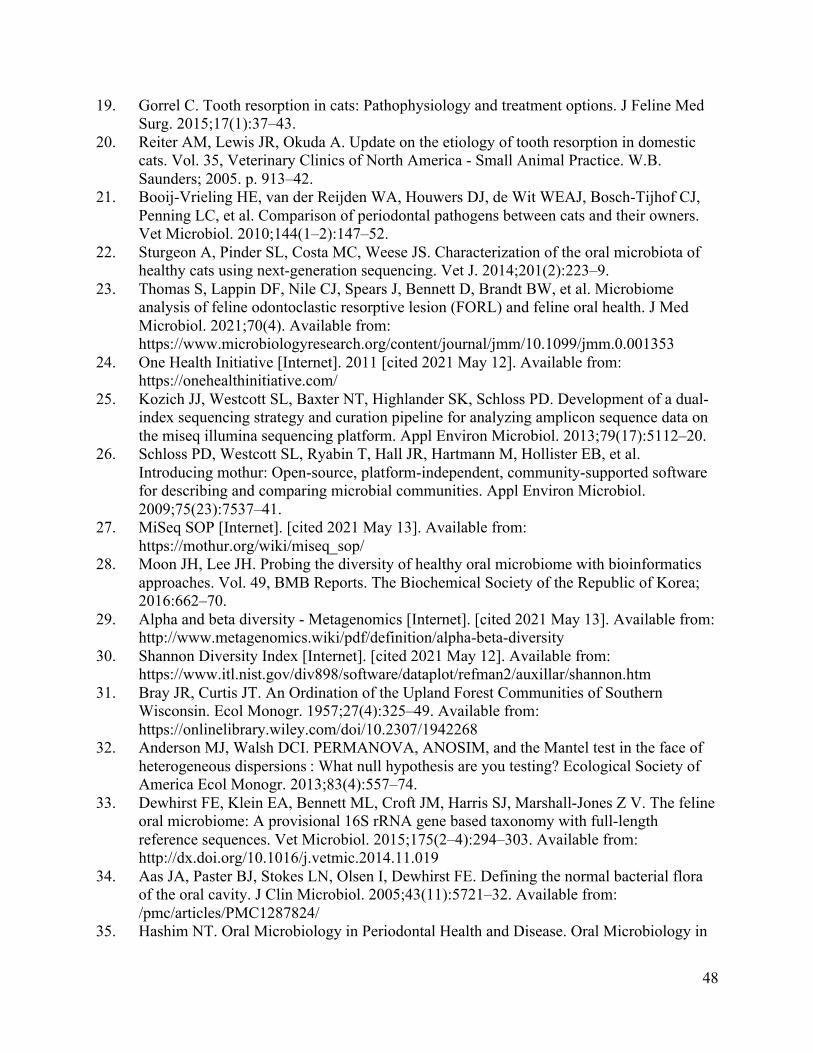
48
19. Gorrel C. Tooth resorption in cats: Pathophysiology and treatment options. J Feline Med Surg. 2015;17(1):37–43.
20. Reiter AM, Lewis JR, Okuda A. Update on the etiology of tooth resorption in domestic cats. Vol. 35, Veterinary Clinics of North America - Small Animal Practice. W.B. Saunders; 2005. p. 913–42.
21. Booij-Vrieling HE, van der Reijden WA, Houwers DJ, de Wit WEAJ, Bosch-Tijhof CJ, Penning LC, et al. Comparison of periodontal pathogens between cats and their owners. Vet Microbiol. 2010;144(1–2):147–52.
22. Sturgeon A, Pinder SL, Costa MC, Weese JS. Characterization of the oral microbiota of healthy cats using next-generation sequencing. Vet J. 2014;201(2):223–9.
23. Thomas S, Lappin DF, Nile CJ, Spears J, Bennett D, Brandt BW, et al. Microbiome analysis of feline odontoclastic resorptive lesion (FORL) and feline oral health. J Med Microbiol. 2021;70(4). Available from: https://www.microbiologyresearch.org/content/journal/jmm/10.1099/jmm.0.001353
24. One Health Initiative [Internet]. 2011 [cited 2021 May 12]. Available from: https://onehealthinitiative.com/
25. Kozich JJ, Westcott SL, Baxter NT, Highlander SK, Schloss PD. Development of a dual-index sequencing strategy and curation pipeline for analyzing amplicon sequence data on the miseq illumina sequencing platform. Appl Environ Microbiol. 2013;79(17):5112–20.
26. Schloss PD, Westcott SL, Ryabin T, Hall JR, Hartmann M, Hollister EB, et al. Introducing mothur: Open-source, platform-independent, community-supported software for describing and comparing microbial communities. Appl Environ Microbiol. 2009;75(23):7537–41.
27. MiSeq SOP [Internet]. [cited 2021 May 13]. Available from: https://mothur.org/wiki/miseq_sop/
28. Moon JH, Lee JH. Probing the diversity of healthy oral microbiome with bioinformatics approaches. Vol. 49, BMB Reports. The Biochemical Society of the Republic of Korea; 2016:662–70.
29. Alpha and beta diversity - Metagenomics [Internet]. [cited 2021 May 13]. Available from: http://www.metagenomics.wiki/pdf/definition/alpha-beta-diversity
30. Shannon Diversity Index [Internet]. [cited 2021 May 12]. Available from: https://www.itl.nist.gov/div898/software/dataplot/refman2/auxillar/shannon.htm
31. Bray JR, Curtis JT. An Ordination of the Upland Forest Communities of Southern Wisconsin. Ecol Monogr. 1957;27(4):325–49. Available from: https://onlinelibrary.wiley.com/doi/10.2307/1942268
32. Anderson MJ, Walsh DCI. PERMANOVA, ANOSIM, and the Mantel test in the face of heterogeneous dispersions : What null hypothesis are you testing? Ecological Society of America Ecol Monogr. 2013;83(4):557–74.
33. Dewhirst FE, Klein EA, Bennett ML, Croft JM, Harris SJ, Marshall-Jones Z V. The feline oral microbiome: A provisional 16S rRNA gene based taxonomy with full-length reference sequences. Vet Microbiol. 2015;175(2–4):294–303. Available from: http://dx.doi.org/10.1016/j.vetmic.2014.11.019
34. Aas JA, Paster BJ, Stokes LN, Olsen I, Dewhirst FE. Defining the normal bacterial flora of the oral cavity. J Clin Microbiol. 2005;43(11):5721–32. Available from: /pmc/articles/PMC1287824/
35. Hashim NT. Oral Microbiology in Periodontal Health and Disease. Oral Microbiology in
49
Periodontitis. 2018. Available from: http://dx.doi.org/10.5772/intechopen.75709 36. Struzycka I. The oral microbiome in dental caries. Polish journal of microbiology.
2014;63(2):127-135. 37. Huang Y-K, Lee W-F, Wang M-J, Chang Y-HS, Tchaou W-S. Chair-Side Quantitative
Oral-Microflora Screening for Assessing Familial Correlation of Periodontal Status and Caries Prevalence. PLoS One. 2014;9(1):87100. Available from: www.plosone.org
38. Willner S, Imam Z, Hader I. Rothia dentocariosa Endocarditis in an Unsuspecting Host: A Case Report and Literature Review . Case Reports Cardiol. 2019;2019:1–3.
39. Yang CY, Hsueh PR, Lu CY, Tsai HY, Lee PI, Shao PL, et al. Rothia dentocariosa bacteremia in children: report of two cases and review of the literature. J Formos Med Assoc. 2007;106(3 Suppl).
40. Yamasaki Y, Nomura R, Nakano K, Naka S, Matsumoto-Nakano M, Asai F, et al. Distribution of periodontopathic bacterial species in dogs and their owners. Arch Oral Biol. 2012;57(9):1183–8.
41. Rock M, Buntain BJ, Hatfield JM, Hallgrímsson B. Animal-human connections, “one health,” and the syndemic approach to prevention. Soc Sci Med. 2009;68(6):991–5.
42. Shrestha K, Acharya KP, Shrestha S. One health: The interface between veterinary and human health. International Journal of One Health. Veterinary World. 2018;4:8–14.
43. Viechtbauer W, Smits L, Kotz D, Budé L, Spigt M, Serroyen J, et al. A simple formula for the calculation of sample size in pilot studies. J Clin Epidemiol. 2015;68(11):1375–9. Available from: https://pubmed.ncbi.nlm.nih.gov/26146089/
44. Hertzog MA. Considerations in determining sample size for pilot studies. Res Nurs Heal. 2008;31(2):180–91. Available from: https://pubmed.ncbi.nlm.nih.gov/18183564/
45. Deo PN, Deshmukh R. Oral microbiome: Unveiling the fundamentals. Journal of Oral and Maxillofacial Pathology. 2019;23:122–8. Available from: /pmc/articles/PMC6503789/
46. Sara Z, Nihel KK, Ilhem B, Amina H, Nadia A, Fatima N, et al. Oral microflora of supragingival and subgingival biofilms in Algerian healthy adults. African J Microbiol Res. 2015;9(23):1548–57.
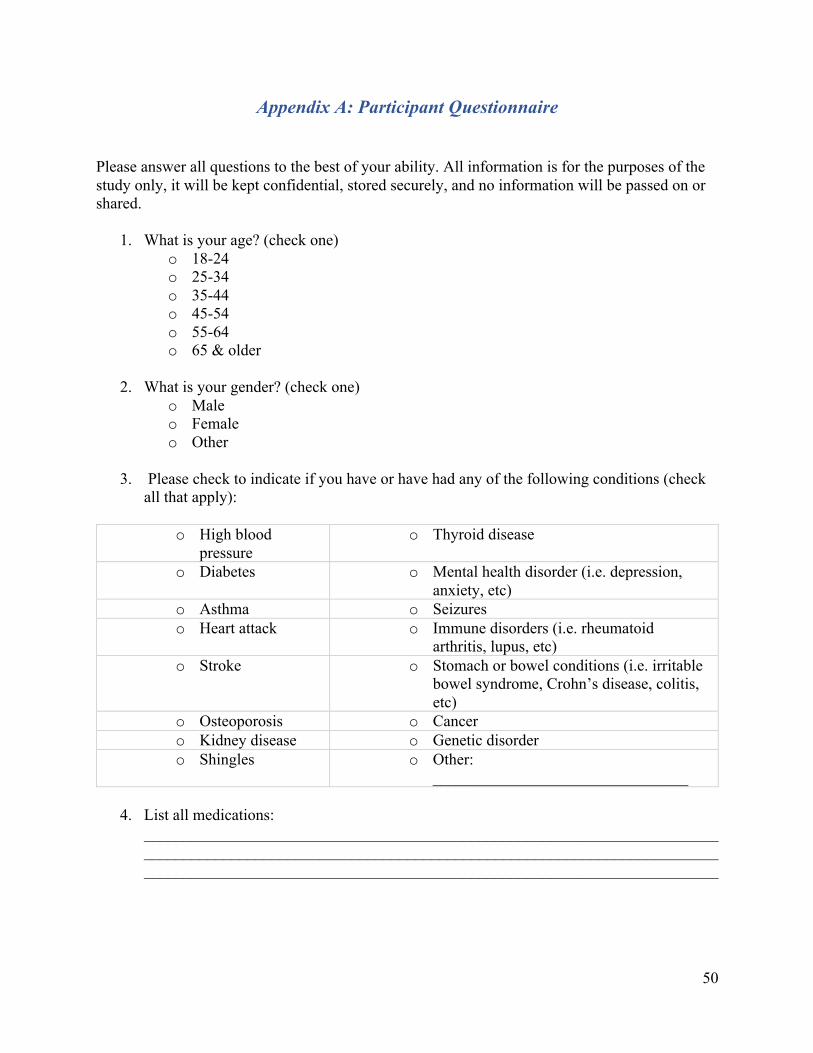
50
Appendix A: Participant Questionnaire
Please answer all questions to the best of your ability. All information is for the purposes of the study only, it will be kept confidential, stored securely, and no information will be passed on or shared.
1. What is your age? (check one) o 18-24 o 25-34 o 35-44 o 45-54 o 55-64 o 65 & older
2. What is your gender? (check one)
o Male o Female o Other
3. Please check to indicate if you have or have had any of the following conditions (check
all that apply):
o High blood pressure
o Thyroid disease
o Diabetes o Mental health disorder (i.e. depression, anxiety, etc)
o Asthma o Seizures o Heart attack o Immune disorders (i.e. rheumatoid
arthritis, lupus, etc) o Stroke o Stomach or bowel conditions (i.e. irritable
bowel syndrome, Crohn’s disease, colitis, etc)
o Osteoporosis o Cancer o Kidney disease o Genetic disorder o Shingles o Other:
________________________________
4. List all medications: ________________________________________________________________________________________________________________________________________________________________________________________________________________________
51
5. How often do you have dental check-ups? (check one) o Less than once per year o Once a year o Twice a year o More than twice a year o Other: ____________
6. How often do you have dental hygiene cleanings? (check one)
o Less than once per year o Once a year o Twice a year o More than twice a year o Other: ____________
7. What is your daily routine for taking care of your teeth:
a. Do you brush your teeth?
o Yes o No
§ If yes to question 7a, how often do you brush your teeth? (circle answer)
2 times/day once/day 2-5 times/week once/week less than once/week
§ If yes to question 7a, do you use brush with toothpaste with fluoride? (circle
answer)
Yes No Don’t Know
§ If yes to question 7a, do you brush with a sensitivity toothpaste? (circle answer)
Yes No Don’t Know
b. Do you clean in between your teeth? (ex. Flossing, toothpicks, proxabrushes, etc)
o Yes o No
§ If yes to question 7b, how often do you clean in between your teeth? (circle
answer)
2 times/day once/day 2-5 times/week once/week less than once/week
52
c. Do you rinse with mouthwash?
o Yes o No
§ If yes to question 7c, how often do you rinse your mouth? (circle answer)
2 times/day once/day 2-5 times/week once/week less than once/week
§ If yes to question 7c, what brand of mouth rinse do you use? (check all that apply) o Listerine o Crest ProHealth o Colgate o Scope o Prescription o Other: _______________
8. Do you have or have you had any of the following dental conditions or treatments? (check all that apply)
o Gingivitis o Gum disease o Cavities o Root canal o Tooth trauma or accident o Braces o Night guard o Other: ______________________
9. How many resorptive tooth lesions do you have? (check one)
o 1 o 2 o 3 o 5 or more o Don’t know
10. Have you been diagnosed with a resorptive tooth lesion before? (check one)
o Yes o No
11. Do you have a cat in your home? (check one)
o Yes - continue with question 12 o No - go to question 25
53
12. How many cats do you have? (check one) o 1 o 2 o 3 o 4 o 5 or more
13. How long has the cat(s) lived in your home? (circle one answer for each cat in the home)
Cat 1: less than 1 year 1-5 years 5-10 years over 10 years Cat 2: less than 1 year 1-5 years 5-10 years over 10 years Cat 3: less than 1 year 1-5 years 5-10 years over 10 years Cat 4: less than 1 year 1-5 years 5-10 years over 10 years
14. What is the age of the cat(s)? (circle one answer for each cat in the home)
Cat 1: 0-1 years old 1-5 years old 5-10 years old over 10 years old Cat 2: 0-1 years old 1-5 years old 5-10 years old over 10 years old Cat 3: 0-1 years old 1-5 years old 5-10 years old over 10 years old Cat 4: 0-1 years old 1-5 years old 5-10 years old over 10 years old
15. Is the cat an indoor cat, outdoor cat(s) or both? (circle one answer for each cat in the
home)
Cat 1: indoor outdoor both Cat 2: indoor outdoor both Cat 3: indoor outdoor both Cat 4: indoor outdoor both 16. Does the cat(s) eat wet food, dry food or both? (circle one answer for each cat in the
home)
Cat 1: wet food dry food both Cat 2: wet food dry food both Cat 3: wet food dry food both Cat 4: wet food dry food both
54
1 very poor health 10 very healthy
17. On a scale of 1-10 with 1 being very poor and 10 being very healthy, how to you rate the overall health of your cat(s)? (circle one number for each cat in the home)
Cat 1: 1 2 3 4 5 6 7 8 9 10 Cat 2: 1 2 3 4 5 6 7 8 9 10 Cat 3: 1 2 3 4 5 6 7 8 9 10 Cat 4: 1 2 3 4 5 6 7 8 9 10
18. How often does the cat go for veterinary care? (circle one answer for each cat in the home)
Cat 1: Less than 1x/year 1x/year 2x/year More than 2x/year Cat 2: Less than 1x/year 1x/year 2x/year More than 2x/year Cat 3: Less than 1x/year 1x/year 2x/year More than 2x/year Cat 4: Less than 1x/year 1x/year 2x/year More than 2x/year 19. Are the cat’s immunizations up to date? (circle one answer for each cat in the home)
Cat 1: Yes No Cat 2: Yes No Cat 3: Yes No Cat 4: Yes No 20. Has your cat been diagnosed with any medical conditions? (circle one answer for each cat
in the home) If yes, list for each cat in the home:
Cat 1: Yes No If yes, list:______________________________________ Cat 2: Yes No If yes, list:______________________________________ Cat 3: Yes No If yes, list:______________________________________ Cat 4: Yes No If yes, list:______________________________________
21. Do you brush your cat’s teeth? (circle one answer for each cat in the home)
Cat 1: Yes No Cat 2: Yes No Cat 3: Yes No Cat 4: Yes No

55
22. Has your cat been diagnosed with any dental conditions? If yes, circle all that apply for each cat in the home:
Cat 1: gingivitis gum disease tooth loss tooth resorption other: __________ Cat 2: gingivitis gum disease tooth loss tooth resorption other: __________ Cat 3: gingivitis gum disease tooth loss tooth resorption other: __________ Cat 4: gingivitis gum disease tooth loss tooth resorption other: __________ 23. What type of contact do you have with cat? (Check all that apply for each cat in the
home) Cat 1:
o petting cat o cat sharing your food
o washing cats eating or drinking bowl with your dishes
o cat licking you o cat sleeping with you
o cat drinking from bathroom or kitchen sink
o cat scratches you o nuzzling with cat o cat eating or drinking off dishes or utensils used by you
Cat 2: o petting cat o cat sharing your
food o washing cats eating or drinking
bowl with your dishes o cat licking you o cat sleeping with
you o cat drinking from bathroom or
kitchen sink o cat scratches you o nuzzling with cat o cat eating or drinking off
dishes or utensils used by you Cat 3:
o petting cat o cat sharing your food
o washing cats eating or drinking bowl with your dishes
o cat licking you o cat sleeping with you
o cat drinking from bathroom or kitchen sink
o cat scratches you o nuzzling with cat o cat eating or drinking off dishes or utensils used by you
Cat 4: o petting cat o cat sharing your
food o washing cats eating or drinking
bowl with your dishes o cat licking you o cat sleeping with
you o cat drinking from bathroom or
kitchen sink o cat scratches you o nuzzling with cat o cat eating or drinking off
dishes or utensils used by you
56
24. How often do you have the above contact with the cat? (circle one answer for each cat in the home)
Cat 1: Almost Always Sometimes Every once in a while Rarely Never Cat 2: Almost Always Sometimes Every once in a while Rarely Never Cat 3: Almost Always Sometimes Every once in a while Rarely Never Cat 4: Almost Always Sometimes Every once in a while Rarely Never
25. If you don’t own a cat, do you have contact with cats outside of your home? (check one)
o Yes o No § If yes, how often is the contact? (circle one answer)
Almost Always Sometimes Every once in a while Rarely Never
26. Do you have any other pets? (Check all that apply) o Dog o Bird o Hamster o Rabbit o Other: _______________________________
Thank you. This is the end of the questionnaire.


![The Gut Microbiome Alterations and Inflammation-Driven ......to maintain host health [21]. The body sites colonized by microbiome include the oral cavity, skin, and gastrointestinal](https://img.pdfslide.us/doc/110x75/603952c23e69fe6cd3006f4b/the-gut-microbiome-alterations-and-inflammation-driven-to-maintain-host.jpg)