Embed Size (px)
Citation preview

DOT/FAA/TC-08/01 Federal Aviation Administration William J. Hughes Technical Center Atlantic City International Airport, NJ 08405
Human Factors Requirements for En Route Controller Weather Displays Ulf Ahlstrom, Ph.D., Human Factors Team – Atlantic City, ATO-P March 2008 Technical Report
This document is available to the public through the National Technical Information Service (NTIS), Springfield, VA 22161. A copy is retained for reference at the William J. Hughes Technical Center Library.
U.S. Department of Transportation Federal Aviation Administration
NOTICE
This document is disseminated under the sponsorship of the U.S. Department
of Transportation in the interest of information exchange. The United States
Government assumes no liability for the contents or use thereof. The United
States Government does not endorse products or manufacturers. Trade or
manufacturers’ names appear herein solely because they are considered
essential to the objective of this report. This document does not constitute
Federal Aviation Administration (FAA) certification policy. Consult your
local FAA aircraft certification office as to its use.
This report is available at the FAA William J. Hughes Technical Center’s full-
text Technical Reports Web site: http://actlibrary.tc.faa.gov in Adobe®
Acrobat® portable document format (PDF).

Technical Report Documentation Page 1. Report No.
DOT/FAA/TC-08/01
2. Government Accession No. 3. Recipient’s Catalog No.
4. Title and Subtitle
Human Factors Requirements for En Route Controller Weather Displays
5. Report Date
March 2008
6. Performing Organization Code
AJP-6110
7. Author(s)
Ulf Ahlstrom, Ph.D., Human Factors Team – Atlantic City, ATO-P
8. Performing Organization Report No.
DOT/FAA/TC-08/01
10. Work Unit No. (TRAIS)
9. Performing Organization Name and Address
Federal Aviation Administration
Human Factors Team – Atlantic City, ATO-P
William J. Hughes Technical Center
Atlantic City International Airport, NJ 08405
11. Contract or Grant No.
13. Type of Report and Period Covered
Technical Report
12. Sponsoring Agency Name and Address
Federal Aviation Administration
Human Factors Research and Engineering Group
800 Independence Avenue, S.W.
Washington, DC 20591
14. Sponsoring Agency Code
ATO-P
15. Supplementary Notes
16. Abstract
Adverse weather conditions affect flight operations, overall, but are especially hazardous to general aviation (GA) aircraft. The
primary weather hazards are icing, convective activity (i.e., thunderstorms), and reductions in ceiling/visibility. Because of
information shortcomings in current en route operations, this research proposes weather display concepts for convective activity,
ceiling/visibility, and icing information that meet controller needs. Our weather displays do this by providing operationally useful
information that effectively enables the controller to transfer hazard information to the pilot. In addition to the weather displays, our
concept involves an automated support system that tracks GA aircraft and hazardous weather areas. When the automated system
detects a future conflict with an aircraft and a hazardous weather region (i.e., no-go area), the system alerts the controller about the
aircraft and the hazard. Once alerted, the controller can either inform the pilot about the location and extent of the hazard (thereby
enhancing cockpit decision making) or the controller can execute necessary weather avoidance actions. Taken together, the weather
displays and automation support tool could work towards a reduction in weather-related GA accidents and provide information that
enhances cockpit decision making.
17. Key Words
En Route Controller
General Aviation
Weather Avoidance
Weather Displays
18. Distribution Statement
This document is available to the public through the
National Technical Information Service, Springfield,
Virginia, 22161. A copy is retained for reference at
the William J. Hughes Technical Center Library.
19. Security Classification (of this report) Unclassified
20. Security Classification (of this page)
Unclassified 21. No. of Pages
27 22. Price
Form DOT F 1700.7 (8-72) Reproduction of completed page authorized

iii
Table of Contents
Page
Acknowledgments ........................................................................................................................ v
Executive Summary.................................................................................................................... vii
1. INTRODUCTION.................................................................................................................... 1
1.1 Purpose ............................................................................................................................... 2
2. METHOD ................................................................................................................................. 2
2.1 Working Group................................................................................................................... 2
2.2 Procedure ............................................................................................................................ 2
2.3 Weather Data ...................................................................................................................... 3
3. EN ROUTE WEATHER DISPLAY CONCEPTS................................................................... 4
3.1 Automated Weather Avoidance Support Tool ................................................................... 5
3.2 Precipitation Display .......................................................................................................... 6
3.2.1 Phraseology Example................................................................................................. 7
3.2.2 Research Requirements for the Precipitation Display ............................................... 7
3.3 Ceiling Display ................................................................................................................... 8
3.3.1 Phraseology Example................................................................................................. 8
3.3.2 Research Requirements for the Ceiling Display........................................................ 9
3.4 Visibility Display................................................................................................................ 9
3.4.1 Phraseology Example............................................................................................... 10
3.4.2 Research Requirements for the Visibility Display................................................... 10
3.5 Flight Category Display.................................................................................................... 10
3.5.1 Phraseology Example............................................................................................... 11
3.5.2 Research Requirements for the Flight Category Display ........................................ 11
3.6 Icing Probability Display.................................................................................................. 11
3.6.1 Phraseology Example............................................................................................... 12
3.6.2 Research Requirements for the Icing Probability Display....................................... 12
3.7 Icing Severity Display ...................................................................................................... 12
3.7.1 Phraseology Example............................................................................................... 13
3.7.2 Research Requirements for the Icing Severity Display ........................................... 13
4. DISCUSSION......................................................................................................................... 13
5. SUMMARY OF RESEARCH REQUIREMENTS................................................................ 15
References .................................................................................................................................. 17
Acronyms ................................................................................................................................... 19
iv
List of Illustrations
Figures Page
Figure 1. Precipitation Display. ...................................................................................................... 6
Figure 2. Ceiling Display................................................................................................................ 8
Figure 3. Visibility Display............................................................................................................. 9
Figure 4. Flight Category Display. ............................................................................................... 10
Figure 5. Icing Probability Display............................................................................................... 11
Figure 6. Icing Severity Display. .................................................................................................. 12

v
Acknowledgments
The author would like to thank researchers from the Research Applications Laboratory at the
University Center for Atmospheric Research (UCAR) for providing weather data and technical
support. The author is solely responsible for the display concept development and views
expressed in this report. This report does not reflect the views of the UCAR researchers.

vi
vii
Executive Summary
Adverse weather conditions affect flight operations, overall, but are especially hazardous to small
and light aircraft operations. Because small and light aircraft have limitations in maximum speed,
altitude, and range, these pilots have a disadvantage when trying to avoid adverse weather
conditions. The primary weather hazards for general aviation (GA) aircraft are icing, convective
activity (i.e., thunderstorms), and inadvertent Visual Flight Rules flights into Instrument
Meteorological Conditions. Although en route air traffic controllers can help pilots with weather
requests, they are limited in the information available. The controllers often lack detailed and
specific information regarding convective activity, icing, and ceiling/visibility conditions.
To address this shortcoming, we developed en route controller weather display concepts for
convective activity, ceiling/visibility, and icing information that meet controller needs. They
do this by providing operationally useful information that effectively enables the controller to
transfer hazard information to the pilot. In addition to the weather displays, our concept involves
an automated support system that tracks GA aircraft and hazardous weather areas. When the
automated system detects a future conflict with an aircraft and a hazardous weather region (i.e.,
no-go area), the system alerts the controller about the aircraft and the hazard. Once alerted, the
controller can either inform the pilot about the location and extent of the hazard, thereby
enhancing cockpit decision making, or the controller can execute necessary weather avoidance
actions.
Pertinent and sufficient data sources exist today that could meet controller requirements for
severe weather avoidance and, when relayed to pilots, could enhance decision making in the
cockpit. We do not yet have the capability to display these data sources graphically at the
controller workstation. To initiate this development process, we include research requirements
for each weather display. These will serve as input to the weather research program for the
development of the displays. Once developed, these weather products will provide information
that enhances cockpit decision making and works to reduce weather-related GA accidents.
1
1. INTRODUCTION
Adverse weather conditions affect flight operations, in general, but are especially hazardous to
small and light aircraft operations. Because small and light aircraft have limitations in maximum
speed, altitude, and range, these pilots have a disadvantage when trying to avoid adverse weather
conditions. Although weather is not the only cause of crashes and accidents in general aviation
(GA), adverse weather contributes to a significant share of these incidents (Groff & Price, 2006;
Li & Baker, 2007; National Transportation Safety Board [NTSB], 2005; Wong, Pitfield, Caves, &
Appleyard, 2006). For example, during 2004, 25% of all fatal weather accidents involved pilot
encounters with thunderstorms (Aircraft Owners and Pilots Association [AOPA], 2006a, 2006b;
NTSB, 2006b). Likewise, many fatal incidents have occurred as a consequence of aircraft icing
(AOPA, 2002; Maynard & Sand, 1999; Politovich & Bernstein, 2006).
One way to illustrate the hazardous impact of weather is to review the GA accident statistics
from the National Transportation Safety Board (NTSB, 2006a). Overall, NTSB cited weather
conditions in 357 (21%) of the total number of GA accidents during 2003. During 2003, there
were 1,628 accidents and 280 fatalities during Visual Meteorological Conditions (VMC). In
the same year during Instrument Meteorological Conditions (IMC) when visibility, cloud
distance, and ceiling are less than the minima for VMC, there were 100 accidents that resulted
in 66 fatalities. This illustrates the impact of weather on GA in that only 17% of VMC
accidents resulted in fatalities, whereas 66% of all IMC accidents were fatal. For all of these
fatal GA accidents, the most frequently cited weather factors relate to conditions that create
reduced visibility.
The visibility concept pertains to the farthest distance at which a pilot can discern an object. The
ceiling concept encompasses the altitude to the nearest layer of clouds that obscures more than
half the sky. Taken together, there are multiple factors that contribute to a ceiling and visibility
problem (Herzegh et al., 2006; NTSB, 2006a). For example, fog, clouds, and obscurations all
contribute to reduced visibility. Similarly, other phenomena such as haze, smoke, sand, dust, and
sun glare can also be contributing factors. GA accidents caused by low ceiling and visibility can
occur if pilots inadvertently encounter these conditions during flight. However, inexperienced
Instrument Flight Rules (IFR) pilots who suddenly encounter reduced ceiling and visibility
conditions are also at risk (Lenz, 2004). Commonly, these encounters result in a loss of control
of the aircraft, or controlled flight into terrain.
Because adverse weather conditions can develop quickly and are somewhat unpredictable, it is
vital for GA pilots to consider available weather information. Many sources are available for
their pre-flight planning (Parson et al., 2005), such as the Internet (Carpenter & Brusda, 2006),
automated flight service stations (Prinzo, Hendrix, & Hendrix, 2007), and various other weather
information providers (Knecht, 2007). It is also important for pilots to monitor weather conditions
while in flight (Knecht). For in-flight weather information, pilots can contact air traffic control
(ATC) and request pertinent weather information and guidance (Ahlstrom, 2003).
Although air traffic controllers can help pilots with weather requests, they are limited in the
information available. They often lack detailed and specific information for convective activity,
icing, and ceiling/visibility conditions. For example, both en route and terminal controllers have
text-based information for icing, ceiling, and visibility but no detailed graphical representation at
2
their workstation. In the en route domain, supervisors can display this information graphically
on an Enhanced Status Information System (ESIS) in each area of specialization. Controllers
can access this information, but it is very general in nature, lacks important details, and may not
be adequate to accommodate all pilot requests (Ahlstrom, 2007). Furthermore, the ESIS display
is located on the end wall, in the area of specialization, some distance away from the controllers.
When controllers use this display, they have to integrate information from the ESIS display
(which can be 20 or more feet away) with information on their situation display. Although the
ESIS display can be set up to provide useful information, it does not fulfill the human factors
requirement for controller weather displays. In the terminal domain, advanced weather
information displays are available at the supervisor workstation. However, the availability of
these weather sources and the possibility for controllers to access this information varies from
one terminal facility to the other (Ahlstrom, 2004). More detailed weather information from pilot
reports (PIREPs) is available in both ATC domains, but these reports might not be available at all
times or even for the relevant geographical areas.
1.1 Purpose
The main purpose of this study is to develop en route controller weather display concepts for
convective activity (i.e., thunderstorms), ceiling/visibility, and icing information that meet
controller needs and provide operationally useful information that effectively enables the
controller to transfer hazard information to the pilot. An additional purpose is to explore suitable
implementation techniques and phraseology examples for operational use and communication
with pilots. If the outcome of this effort shows that available products cannot meet our display
requirements, we have an additional goal to provide research requirements to the weather
research program for the development of these displays.
2. METHOD
2.1 Working Group
At the beginning of the project, researchers put together a team that had the necessary knowledge
and experience of en route air traffic operations, GA pilot operations, and aviation weather.
Included in this team were three experienced GA pilots, one en route ATC Subject Matter Expert
(SME), and several Engineering Research Psychologists and Software Engineers. In addition,
the working group received input from an independent group of four en route SMEs.
2.2 Procedure
The weather display analysis and display prototyping took place in group settings over the course
of the project. During these sessions, the working group analyzed controller information
requirements for display information of convective activity (i.e., thunderstorms), ceiling/visibility,
and icing conditions. Throughout the work sessions, the team used a scenario-based methodology
to determine whether each weather display met controller information requirements. This implied
a determination of a controller’s ability to provide adequate weather avoidance operations and the
controller’s ability to provide relevant weather advisories to pilots when using the display. The
team also focused on documented real-life GA weather accidents, discussing issues with controller
and pilot weather situation awareness and shortcomings during weather-related communications.

3
2.3 Weather Data
In current en route operations, controllers use graphical representations of precipitation areas and
text-based information for visibility, ceiling, and icing conditions (Ahlstrom, 2007). All text-based
products require, to some degree, a mental interpretation and manipulation on part of the controller
and do not usually allow a direct and effortless application (Ahlstrom, 2005). Therefore, the task
of correlating text-based weather information with specific sector areas can be difficult and time
consuming. On the other hand, a graphical representation of weather information generally
provides a direct correlation between weather information and sector data. Although far from
being implemented across the aviation weather domain, there is currently a transition in the
display development from text-based weather products to graphical weather products (McCarthy,
2006).
Although few controller weather displays are available in current operations (Ahlstrom, 2003,
2007), many display examples and concepts are available for pilot operations (Stough &
Martzaklis, 2002). One elegant example is the Helicopter Emergency Medical Services tool
developed by Research Applications Laboratory researchers at the University Center for
Atmospheric Research (UCAR). This tool provides, among many other things, a grid-based
system that graphically depicts assessments for ceiling, visibility, and icing conditions. To assess
the conditions between the reporting stations for Aviation Routine Weather Report and Terminal
Area Forecast sites, the system interpolates and produces a best estimate of the likely conditions.
By using this graphical tool, pilots could gain a quick overview of the likely weather situation at
a given geographical location or at points along their intended line of flight. The tool provides
an effortless and direct pick up of important weather constraints and does not require any mental
elaboration by the user.
Because the tool provides precipitation, ceiling, visibility, icing, and flight category data in a
graphical format, these data sets would be very useful for our display concept development.
Therefore, we contacted the researchers at UCAR who generously provided us with weather data
covering the Continental United States (CONUS). In the following, we provide a brief
description of the weather data used for our prototype displays. More detailed information about
the data sources, applications, and a user tutorial are available on the Web (http://weather.aero/
hems/). For a review of the tool and weather data see Buehler (2007).
From the grid-based data, we created separate displays for Ceiling, Visibility, Flight Category,
Icing, and Precipitation. The data grids for the Ceiling and Visibility Displays derive from
observations, surface weather reports, and satellite data. The Ceiling Display shows the ceiling
in feet above ground level for eight altitudes ranging from 0-5,000 feet. A ninth category shows
areas containing obstructions. The Visibility Display shows the visibility in areas ranging from
zero visibility to 10 miles of visibility. The Ceiling and Visibility grids provide data for a third
grid used to create a Flight Category display.
The Flight Category Display codes areas according to Visual Flight Rules (VFR), Marginal VFR
(MVFR), IFR, and Low IFR (LIFR). The Flight Category Display is based on data from certain
cloud-base ceilings and horizontal surface-visibility values. The Ceiling, Visibility, and Flight
Category Displays update approximately every 5 minutes. Because of data set limitations (e.g.,
due to the distance between measuring stations), these data grids have a maximal resolution of
approximately 5 kilometers.
4
The Icing Display consists of two icing metrics: Icing Severity and Icing Probability. The Icing
Severity combines many data sources, such as temperature, humidity, radar data, satellite, pilot
reports, and observed surface weather to depict areas with none, trace, light, moderate, and heavy
icing. The Icing Probability displays areas and their associated probability of icing from 5-85%.
Both the Icing Severity and Icing Probability information come from the Current Icing Product.
The grid cell size for the Icing display is approximately 20 x 20 kilometers, and the display
updates once every hour.
Finally, the Precipitation Display consists of a Next-Generation Weather Radar (NEXRAD) Data
composite for the range 5-75 dBZ. This Precipitation Display updates approximately every 5
minutes and has a grid resolution of 1 square kilometer.
3. EN ROUTE WEATHER DISPLAY CONCEPTS
In the following sections, we define our weather display concepts with information requirements,
illustrations, and phraseology examples. We derived controller weather display requirements
from the control tasks and control strategies applicable to en route controllers during severe
weather avoidance (Ahlstrom, 2004).
Control tasks define what a controller has to do when controlling an aircraft during different
adverse weather phenomena (e.g., provide weather advisories, requesting PIREPs). Control
strategies define the possible options that the controller has when performing these control tasks
(e.g., climb, vector). For example, if an aircraft experiences in-flight icing, an en route controller
can climb, descend, or vector the aircraft away from the hazardous area. In order to perform
either one of these operations, however, the controller must have immediate information about
the location of the hazard (in relation to the aircraft) as well as information about hazard-free
areas. Furthermore, the weather information display must enable the controller to transfer
information about the location and extent of hazardous areas to pilots to enhance decision
making in the cockpit. If an Icing Display provides this information and allows the controller to
select the appropriate action to transfer useful information to pilots, we can say that the display
information satisfies the controller’s operational requirements for icing avoidance. Conversely,
if the Icing Display provides information that does not allow the controller to select and execute
a control strategy or to transfer operationally useful information to pilots, it does not meet the
controller’s information requirements for icing avoidance.
To support the controller during active weather avoidance operations, our concept makes use of
an automated support system that tracks GA aircraft and hazardous weather areas. If the
automated system detects a future conflict with an aircraft and a hazardous weather region (i.e.,
"no-go" area), the system alerts the controllers about the aircraft and the hazard. In this situation,
the support system allows the controller to display the hazard type, and the controller can either
relay the information to the pilot or take the necessary control actions. In other situations,
controllers will use the weather displays in various situations where pilots contact the controllers
to request weather information. In these situations, the controllers need quick access to
operationally relevant information for pilots.
For all the weather information displays, we have optimized the original data information for use
by en route controllers. For example, the Flight Category data contains information that specifies

5
regions of obscurations, VFR, MVFR, IFR, and LIFR conditions. This information is very
important during pilot pre-flight planning because it gives a very quick overview of conditions
that the pilot is likely to encounter during a flight. For an en route controller, the Flight Category
Display only needs to display shaded regions for two categories. The first region is obscurations
and the second region is a combination of all non-VFR regions into a single IFR area. Essentially,
these shaded areas are no-go regions and all other areas are "go" regions for VFR aircraft,
enhancing controller decision making during severe weather avoidance. Similarly, we combined
data sources into fewer but more operationally relevant controller categories for the remainder of
our display concepts.
Within the present framework, we assume that controllers communicate with pilots using radio.
Today, various data-link applications are becoming more prevalent and could provide another
means for communicating weather information in the future. However, the relay of weather
information from the en route controller to the pilot does not require such means. The displays
provide a quick look of hazardous areas that controllers can directly communicate to pilots.
Furthermore, controllers use phraseology that is similar to the phraseology used in the field today
to describe weather areas.
Finally, although weather data are available that would meet our weather information
requirements, there are currently no displays available that would meet controller needs.
Therefore, we have included research requirements for the development of each weather display
(see section 5, Summary of Research Requirements). However, we want to emphasize that our
display requirements are general examples. The display system needs to be flexible and allow
adaptation to specific en route sector needs, depending on traffic patterns and geographical
location. For example, the need for specific altitude strata for ceiling/visibility and icing
information are likely to vary across the CONUS. In this report, our displays provide only
generic examples of how to code each weather hazard to provide operationally meaningful
information. In the current stage of display development, we have not specified color palettes
for use on current en route systems. We merely use shaded color areas to demonstrate the
display concepts, although guidelines for the use of color palettes and weather information on
ATC displays are available (Ahlstrom & Arend, 2005).
3.1 Automated Weather Avoidance Support Tool
The weather concept displays provide the controller with quick-look information for aircraft
hazards caused by reductions in ceiling and visibility, icing conditions, and convective activity.
During weather avoidance operations, the controller actively uses this information to advise
pilots of hazardous weather areas and to help pilots avoid these areas. However, these operations
add additional requirements for the controller that could easily have detrimental effects on
controller workload during operations in adverse weather conditions. Therefore, to support the
controller during these operations, our weather avoidance concept includes an automated support
tool. This tool automatically tracks GA aircraft, based on the aircraft type filed on the flight plan,
and correlates this information with the 3D weather database to detect future conflicts between
aircraft and weather hazards. The specific aircraft types included in the tracking are single-
engine piston aircraft and light twin-engine aircraft under 6,000 lbs; generally, with or without
limited weather detection capability and, in most cases, without deicing capability. The support
tool alerts the controller by blinking the aircraft data block 20 minutes ahead of a predicted
6
aircraft or hazard conflict. As soon as the automated support system generates an alert, the
controller receives specific information about the weather hazard in a read-out window
(moveable) on the situation display. The controller also has the option to display the specific
weather hazard that the aircraft will encounter given its current flight path. This allows the
controller to verify the situation and to take appropriate action in a timely manner. The
controller can either inform the pilot about the location and extent of the hazard, thereby
enhancing cockpit decision making, or execute necessary weather avoidance actions to avoid
a conflict between the aircraft and the hazard.
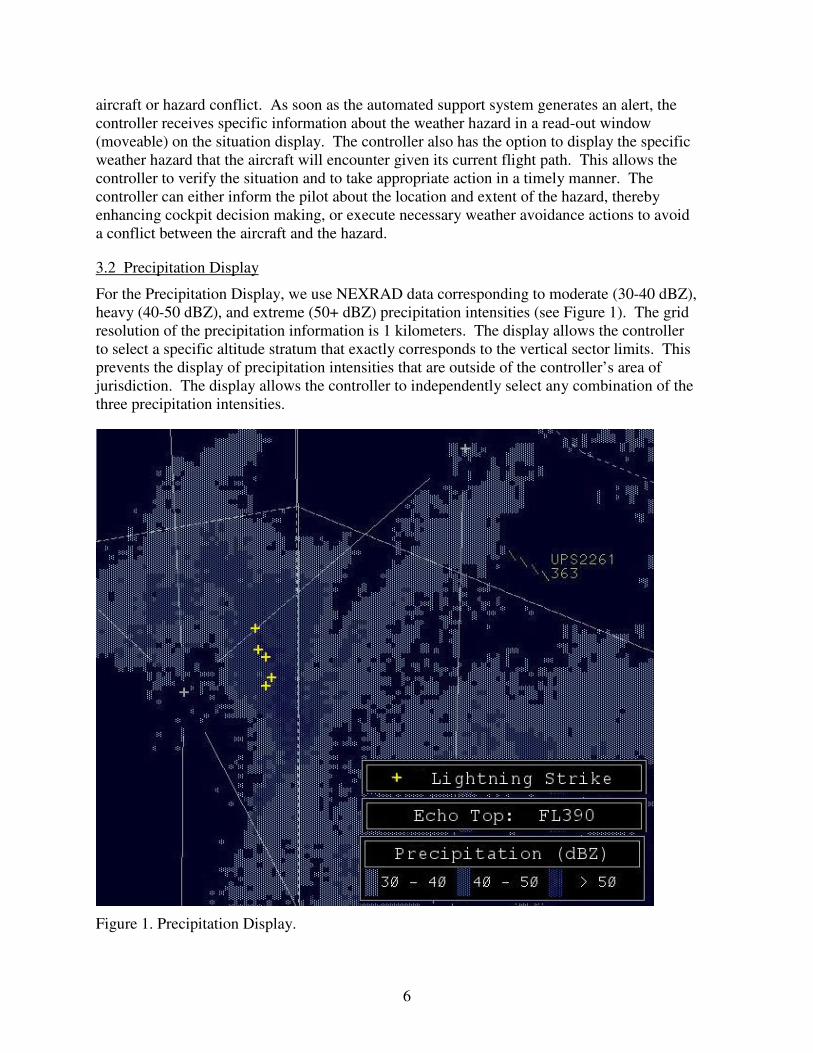
3.2 Precipitation Display
For the Precipitation Display, we use NEXRAD data corresponding to moderate (30-40 dBZ),
heavy (40-50 dBZ), and extreme (50+ dBZ) precipitation intensities (see Figure 1). The grid
resolution of the precipitation information is 1 kilometers. The display allows the controller
to select a specific altitude stratum that exactly corresponds to the vertical sector limits. This
prevents the display of precipitation intensities that are outside of the controller’s area of
jurisdiction. The display allows the controller to independently select any combination of the
three precipitation intensities.
Figure 1. Precipitation Display.

7
Given the current problem with the en route precipitation display accuracy caused by winds and
slow radar update rates (Ahlstrom & Dury, 2007), our prototype display makes use of all
available wind information (i.e., real-time observations, satellite, radar, PIREPs) and previous
NEXRAD updates to display extrapolations of precipitation locations once a minute. This
improved precipitation display provides the controller with a more accurate display of
precipitation locations, enhances the accuracy of controller weather avoidance operations, and
improves the quality of weather advisories to pilots.
Cloud top information is very important for GA operations. In the field, the supervisor can tailor
the ESIS to display echo top information in each area of specialization. However, this
information is not available at the controller workstation. In our Precipitation Display concept,
the controller can display grid-based echo top information along with the precipitation areas.
Each bin in the grid is 2 x 2 kilometers and provides a single echo top value. After activating the
echo top information, the controller can slew the cursor across the precipitation areas and display
the echo top values in a moveable read-out window located on the situation display.
To provide information that is indicative of thunderstorms and convective activity, the controller
can display lightning symbols that indicate a lightning strike (i.e., cloud-to-ground) at those
locations within the past 15 minutes. The lightning symbols appear on the display for 15
minutes, after which they disappear. During this 15-minute interval, the size of each lightning
symbol decreases twice; first after 5 minutes and then after 10 minutes.
3.2.1 Phraseology Example
The phraseology that en route controllers can use to communicate precipitation, lightning, and
echo top information to pilots is as follows: N123, heavy precipitation between ten o'clock and
two o'clock, one five miles. Moving east at two zero knots, tops flight level three niner zero.
Precipitation area is two five miles in diameter. Lightning displayed.
3.2.2 Research Requirements for the Precipitation Display
As shown in Figure 1, the Precipitation Display contains features not currently available on en
route controller displays. Therefore, there is a need to develop a Precipitation Display that meets
the following requirements:
• Allows user-defined altitude strata that limit the display of precipitation intensities to the
volume within the sector altitudes.
• Uses wind information and previous precipitation updates to extrapolate a best estimate
of current intensity locations. The display of the precipitation intensities updates once a
minute.
• Displays echo top information in association with the Precipitation Display.
• Shows symbols for cloud-to-ground lightning strikes on the Precipitation Display. Each
symbol indicates that there has been a lightning strike at that location within the past 15
minutes. Each symbol times out after 15 minutes.

8
3.3 Ceiling Display
The graphical Ceiling Display in Figure 2 shows an example of two different shaded areas for
ceilings that are below VFR minima (i.e., no-go regions). The first area shows ceilings below
500 feet, and the second area shows ceilings between 500-1,000 feet. Non-shaded areas on the
situation display have a ceiling of more than 1,000 feet, which meets the ceiling minima for VFR
operations (i.e., go regions). Alternatively, the Ceiling Display can be tailored to display all
ceiling levels (in feet above the ground level) across the sector. The grid resolution for the
ceiling data is 5 kilometers, and the display updates every 5 minutes.
Figure 2. Ceiling Display.
3.3.1 Phraseology Example
To communicate ceiling information to pilots, en route controllers can use the following
phraseology: N123, ceiling less than 500 feet between ten o'clock and two o'clock, one five
miles.

9
3.3.2 Research Requirements for the Ceiling Display
The Ceiling Display in Figure 2 is not available in current ATC operations. Therefore, there is a
need to develop a Ceiling Display that shows shaded areas where ceilings are less than 500 feet
and between 500-1,000 feet.
3.4 Visibility Display
The Visibility Display in Figure 3 shows an example of shaded regions for two visibility levels
that are below VFR minima (i.e., no-go regions). The first region shows areas that have a
visibility of less than 1 mile, and the second region shows areas that have a visibility between 1
mile and 3 miles. Non-shaded areas on the situation display have a visibility of more than 3
miles, which meets the visibility minima for VFR operations (i.e., go regions). Alternatively,
the Visibility Display can be tailored to display all visibility conditions (in miles) across the
sector. The Visibility Display has the same spatial resolution (5 kilometers) and update rate
(every 5 minutes) as the Ceiling Display.
Figure 3. Visibility Display.

10
3.4.1 Phraseology Example
To communicate visibility information to pilots, en route controllers can use the following
phraseology: N123, visibility less than 1 mile between ten o'clock and two o'clock, one five miles.
3.4.2 Research Requirements for the Visibility Display
The Visibility Display, as illustrated in Figure 3, is not available in current ATC operations.
Therefore, there is a need to develop a graphical Visibility Display that shows a shaded area
where the visibility is less than 1 mile, and a second shaded area where the visibility is between
1-3 miles.
3.5 Flight Category Display
The Flight Category Display example in Figure 4 is derived from the Ceiling and Visibility
Displays. The display shows shaded regions for obscurations and IFR conditions. Both of
these regions are no-go areas for VFR aircraft. All non-shaded regions on the situation display
represent VFR conditions. The spatial resolution and update rate is the same as for the
Visibility and Ceiling Displays.
Figure 4. Flight Category Display.

11
3.5.1 Phraseology Example
The phraseology that en route controllers can use to communicate flight category information
to pilots is as follows: N123, VFR flight not recommended between ten o'clock and two o'clock,
one five miles.
3.5.2 Research Requirements for the Flight Category Display
The Flight Category Display in Figure 4 is not available in current ATC operations. Therefore,
there is a need to develop a Flight Category Display that shows shaded areas for obscurations
and IFR conditions.
3.6 Icing Probability Display
The Icing Probability Display in Figure 5 shows shaded areas where the probability of icing is
25-50%, 50-75%, or above 75%. The controller can select and display the icing probability for
one of eight different pre-defined altitudes. The need for specific altitude strata are determined
by the Air Route Traffic Control Center's (ARTCC’s) geographical region, weather patterns,
and traffic patterns, which are not likely to be the same across the CONUS. The grid resolution
for the Icing Probability Display is 20 x 20 kilometers. The display updates once every hour.
Figure 5. Icing Probability Display.
12
3.6.1 Phraseology Example
To communicate icing probability information to pilots, en route controllers can use the
following phraseology: N123, icing probability between ten o'clock and two o'clock, one five
miles, icing probability is greater than 50% at one two thousand.
3.6.2 Research Requirements for the Icing Probability Display
The graphical Icing Probability Display is not available at the controller workstation in current
operations. Therefore, there is a need to develop an Icing Probability Display that meets the
following requirements:
• The capability to show shaded areas where the probability of icing is 25-50%, 50-75%,
and above 75%.
• The capability to select one of eight pre-defined altitude strata for the display of icing
probability.
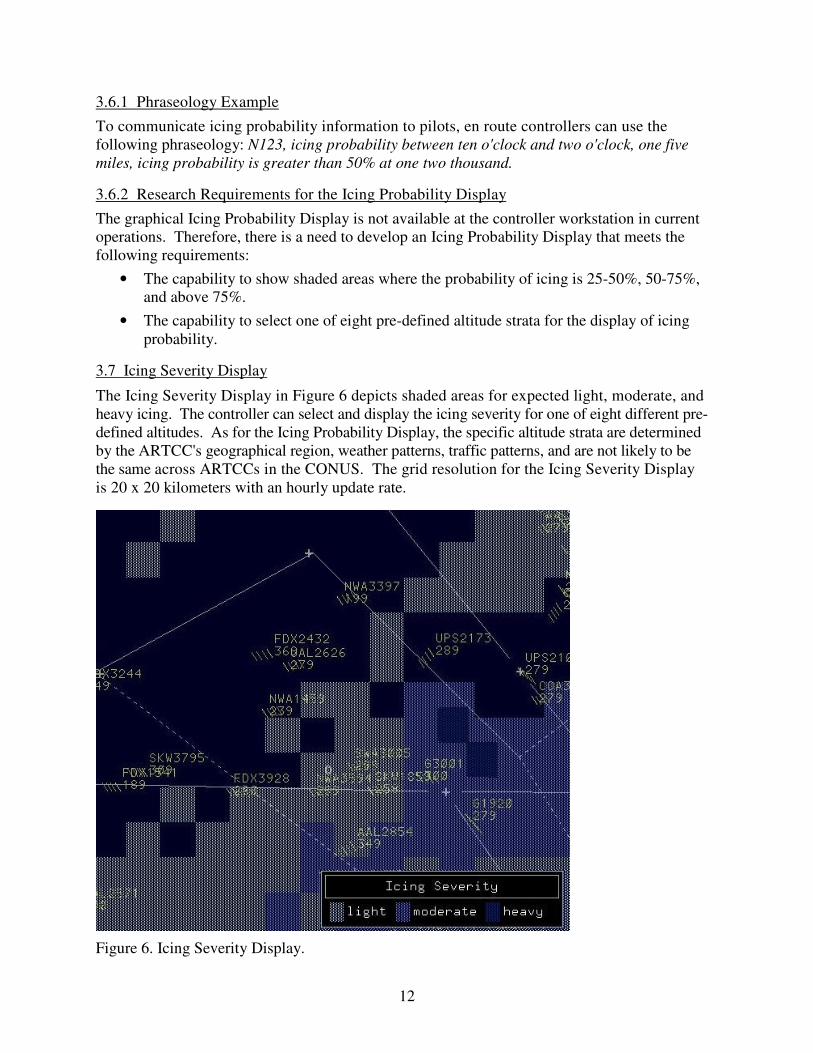
3.7 Icing Severity Display
The Icing Severity Display in Figure 6 depicts shaded areas for expected light, moderate, and
heavy icing. The controller can select and display the icing severity for one of eight different pre-
defined altitudes. As for the Icing Probability Display, the specific altitude strata are determined
by the ARTCC's geographical region, weather patterns, traffic patterns, and are not likely to be
the same across ARTCCs in the CONUS. The grid resolution for the Icing Severity Display
is 20 x 20 kilometers with an hourly update rate.
Figure 6. Icing Severity Display.

13
3.7.1 Phraseology Example
To communicate icing severity information to pilots, en route controllers can use the following
phraseology: N123, icing severity between ten o'clock and two o'clock, one five miles, icing
severity is heavy at one two thousand.
3.7.2 Research Requirements for the Icing Severity Display
The graphical Icing Severity Display is not available in current ATC operations. Therefore,
there is a need to develop an Icing Severity Display that meets the following requirements:
• The capability to show shaded areas for expected light, moderate, and heavy icing.
• The capability to select one of eight pre-defined altitude strata for the display of icing
severity.
4. DISCUSSION
One of the Federal Aviation Administration’s goals is to increase the safety of flight by reducing
the number of weather-related accidents. As part of this effort, research and development have
provided many new weather products that pilots can use pre-flight and in the air. Although
pilots have seen an increase in weather products and weather services, en route controllers still
depend on legacy products, such as Precipitation Displays and text-based weather descriptions.
En route controllers are at a disadvantage when providing weather-related services to pilots
because of the limitations in display accuracy, information specificity, and presentation format of
these legacy weather products. This limitation reduces the ability of controllers to take a more
pronounced role in keeping aircraft away from hazardous weather areas and limits the usefulness
of information that controllers relay to pilots. Researchers need to develop controller weather
products that meet controller requirements for severe weather avoidance and enhance the
collaboration with pilots. Once developed, these weather products will provide information that
enhances cockpit decision making and work towards a reduction in weather-related GA
accidents.
In this report, we propose weather displays for use by en route controllers during severe weather
avoidance. Primarily, these displays focus on information that allows controllers to support GA
pilots to avoid hazards caused by reductions in ceiling/visibility, icing, and convective activity.
Furthermore, the weather displays provide pertinent information that controllers can relay to
pilots, thereby enhancing cockpit decision making. We also propose an automated support tool
that (a) tracks GA aircraft and hazardous weather areas and (b) alerts the controller about
impending conflicts to further support the controller during these operations. Once alerted, the
controller can either inform the pilot about the location and extent of the hazard or execute
necessary weather avoidance actions.
Although we illustrate our display concepts as part of the controller’s main situation display in
this report, the presentation of these weather displays are not limited to the controller’s display.
For example, Ahlstrom and Friedman-Berg (2006) showed that Terminal Radar Approach
Control controllers could use advanced weather information equally and effectively on both the

14
main situation display and the auxiliary display (which was located on top of the situation
display). Likewise, this means that we can present weather displays on the En Route
Information Display System next to the controller workstation and on the ESIS in each area
of specialization.
As is true for most display concepts for the future air traffic domain, there are issues to be
resolved, such as research and development of new data sources or the integration of separate
sources of information. Graphical weather data for controllers is problematic. There has been
no prior development and there are no operational requirements that specify what controllers
need. However, pertinent and sufficient data sources exist today that could meet controller
requirements for severe weather avoidance and, when relayed to pilots, could enhance decision
making in the cockpit. In fact, all of the data sources for our weather display concepts exist
today and are readily available. What has yet to be developed is the capability to display these
data sources graphically at the controller workstation or on auxiliary displays. To initiate this
development process, we have included research requirements for each weather display to serve
as input to the weather research program for the development of these displays.
Granted, controllers would need training on both the displays and on phraseology for weather
avoidance and weather advisories before they could use these displays in the field. Similarly,
there is a need to inform pilots on what information the controller has available and how this
information can affect cockpit decision making. As far as controller phraseology is concerned,
there is virtually no change in the phraseology needed to use our weather displays compared to
the phraseology that en route controllers use in current operations. This fact is important for
several reasons. First, it eliminates the introduction of an entirely new phraseology for
controllers, and it reduces the time needed for training and operational evaluation. Second, the
current weather phraseology is familiar to pilots; therefore, it would have very little impact on
pilot training and the use of this information in the cockpit.
However, we do see a need for controller and pilot training that aims at developing a new safety
culture where all parties work together to increase weather situation awareness and safety of
flight. Today’s en route environment is limited with regards to what weather information is
available to the controller (Ahlstrom & Dury, 2007). Furthermore, there are indications that
controllers do not trust their information and that they are uncertain about the value it brings to
pilots via advisories (Ahlstrom & Dury). This limits the usefulness of weather information and
works against a cultural climate where controllers perceive weather information and weather-
related communication between controllers and pilots as important. With our proposed displays,
controllers can provide both the big and the small weather picture within the airspace. Pilots, on
the other hand, are often restricted to the small weather picture even when equipped with weather
radar. By providing controllers with more adequate information that is readily available,
displayed in a proper format, and easily transmitted to pilots, we lay the foundation for making a
change in the current climate and work towards greater communication and collaboration.
Finally, we envision the use of radio communication for the transfer of weather information
between controllers and GA pilots. With our proposed displays and controller phraseology, there
is no requirement that necessitates other means for the transfer of this information. Research and
development are working on data-linked weather capabilities that will change the way we
transfer weather information in the future. Our weather information concepts are compatible
15
with both the present radio-based and future data-linked-based capabilities. However, at present,
there is no infrastructure in place that allows the seamless transfer of either text-based or
graphical weather data between en route controllers and GA pilots. Once we develop these data-
link capabilities, controllers could transfer pertinent weather information and aircraft positions
directly to the cockpit. This could be an important step to enhance shared weather situation
awareness between controllers and pilots. It could also be an important step to reduce the
number of weather-related GA accidents and increase the safety of flight.
5. SUMMARY OF RESEARCH REQUIREMENTS
In the following section, we provide research requirements for the development of our proposed
weather avoidance displays. For the Ceiling, Visibility, Flight Category, and Icing Display
requirements, we provide one generic example of how the available data can be adapted to
display a certain combination of hazard areas or altitude levels. However, operational versions
of these Display Systems must be very flexible and allow tailoring of incoming data. There is no
single display that will fulfill all sector needs and controller requirements, as this will depend on
each sector's geographical location and traffic pattern. Therefore, each display requirement
implicitly assumes full control of tailoring the data display at the sector level.
• Automated Weather Avoidance Support Tool
− Develop a tool that automatically tracks GA aircraft, based on the aircraft type (filed
on the flight plan), and correlates this information with the 3D weather database to
detect future conflicts between aircraft and weather hazards. The tool alerts the
controller by blinking the aircraft data block 20 minutes ahead of a predicted aircraft
and hazard conflict. During the alert, the controller receives specific information
about the weather hazard on the situation display; the information is presented in the
moveable read-out window. The controller also has the option to display the specific
weather hazard on the situation display (e.g., the Icing Probability Display for the
altitude of 8,000 feet).
• Precipitation Display
− Develop a Precipitation Display that allows user-defined altitude strata that limit the
display of precipitation intensities to the volume within the sector altitudes.
− Develop a capability to use wind information and previous precipitation updates to
extrapolate a best estimate of current intensity locations. The display of the
precipitation intensities updates once a minute.
− Develop a capability to display echo top information in association with the
Precipitation Display.
− Develop a capability to show symbols for cloud-to-ground lightning strikes on the
Precipitation Display. Each symbol indicates that there has been a lightning strike at
that location within the past 15 minutes. Each symbol times out after 15 minutes.
• Ceiling Display
− Develop a Ceiling Display that shows shaded areas where ceilings are less than 500
feet and between 500-1,000 feet.

16
• Visibility Display
− Develop a Visibility Display that shows a shaded area where the visibility is less than
1 mile, and a second shaded area where the visibility is between 1-3 miles.
• Flight Category Display
− Develop a Flight Category Display that shows shaded areas for obscurations and IFR
conditions.
• Icing Probability Display
− Develop an Icing Probability Display that shows shaded areas where the probability
of icing is 25-50%, 50-75%, and above 75%.
− Develop the capability to select one of eight pre-defined altitude strata for the display
of icing probability.
• Icing Severity Display
− Develop an Icing Severity Display that shows shaded areas for expected light,
moderate, and heavy icing.
− Develop the capability to select one of eight pre-defined altitude strata for the display
of icing severity.

17
References
Ahlstrom, U. (2003). Current trends in the display of aviation weather. Journal of Air Traffic
Control, 45(3), 14-21.
Ahlstrom, U. (2004). TRACON controller weather information needs: II. Cognitive work
analysis (DOT/FAA/CT-TN04/09). Atlantic City International Airport, NJ: FAA William
J. Hughes Technical Center.
Ahlstrom, U. (2005). Advanced weather displays for TRACON controllers. Journal of Air
Traffic Control, 47(2), 29-36.
Ahlstrom, U. (2007). Availability and operational use of weather information by en route and
terminal controllers (DOT/FAA/TC-TN-07/01). Atlantic City International Airport, NJ:
FAA William J. Hughes Technical Center.
Ahlstrom, U., & Arend, L. (2005). Color usability on air traffic control displays. In Proceedings
of the Human Factors and Ergonomics Society 49th Annual Meeting (pp. 93-97). Santa
Monica, CA: Human Factors and Ergonomics Society.
Ahlstrom, U., & Dury, T. G. (2007). Weather information for en route controllers
(DOT/FAA/TC-07/08). Atlantic City International Airport, NJ: FAA William J. Hughes
Technical Center.
Ahlstrom, U., & Friedman-Berg, F. (2006). TRACON controller weather information needs: III.
Human-in-the-loop simulation (DOT/FAA/TC-06/10). Atlantic City International
Airport, NJ: FAA William J. Hughes Technical Center.
Aircraft Owners and Pilots Association. (2002). Aircraft icing (Safety Advisor SA11-11/02).
Frederick, MD: AOPA Air Safety Foundation.
Aircraft Owners and Pilots Association. (2006a). Thunderstorms and ATC (Safety Advisor
SA26-04/06). Frederick, MD: AOPA Air Safety Foundation.
Aircraft Owners and Pilots Association. (2006b). WARP weather and radar processor (Safety
Brief SB05-01/06). Frederick, MD: AOPA Air Safety Foundation.
Buehler, L. (2007). New helicopter emergency medical services weather tool. FAA Aviation
News, 46(1), 1-3.
Carpenter, S. J., & Brusda, J. (2006, October). Creating an improved understanding of flight
weather. The Front, 6(3), 3-7.
Groff, L. S., & Price, J. M. (2006). General aviation accidents in degraded visibility: A case
control study of 72 accidents. Aviation, Space, and Environmental Medicine, 77(10),
1062-1067.
Herzegh, P., Wiener, G., Bankert, R., Bateman, R., Benjamin, S., Brown, J., et al. (2006).
Development of FAA national ceiling and visibility products: Challenges, strategies and
progress. In Proceedings of the 12th Conference on Aviation Range and Aerospace
Meteorology (Paper P1.17). American Meteorological Society.

18
Knecht, W. R. (2007). How general aviation pilots use weather information providers and
products. In Proceedings of the 14th International Symposium on Aviation Psychology
(pp. 333-338). Dayton, OH: Wright State University Press.
Lenz, M. (2004). Me? Lose control? You gotta be…Uh oh! Atlas Aviation Inc. Retrieved May
16, 2007, from http://www.atlasaviation.com/feature%20articals/featured-article-
2005/Me-Lose-Control.htm
Li, G., & Baker, S. P. (2007). Crash risk in general aviation. Journal of the American Medical
Association, 297(14), 1596-1598.
Maynard, W. L., & Sand, W. R. (1999). The state of the art knowledge for icing accidents for
general aviation aircraft. The Journal of Air Law and Commerce, 65(1), 719-767.
McCarthy, J. (2006). Weather support to aviation: Thoughts for the future with emphasis on
operational needs. In Proceedings of the 12th
Conference on Aviation Range and
Aerospace Meteorology (Paper 1.2). American Meteorological Society.
National Transportation Safety Board. (2005). Risk factors associated with weather-related
general aviation accidents (NTSB/SS-05/01). National Transportation Safety Board.
National Transportation Safety Board. (2006a). Annual review of aircraft accident data. U.S.
general aviation, calendar year 2003 (NTSB/ARG-07/01). National Transportation
Safety Board.
National Transportation Safety Board. (2006b). Thunderstorm encounters (Safety Alert SA-11).
National Transportation Safety Board. Retrieved November 13, 2006, from
http://download.aopa.org/epilot/2006/ 061012ntsb-alert.pdf
Parson, S., Beringer, D., Knecht, W., Crognale, M. A., Wiegmann, D., Beard, B. L., et al. (2005).
General aviation pilot’s guide to preflight weather planning, weather self-briefings, and
weather decision making. Washington, DC: Federal Aviation Administration.
Politovich, M. K., & Bernstein, B. C. (2006). Recent success stories from the inflight icing PDT.
In Proceedings of the 12th Conference on Aviation Range and Aerospace Meteorology
(Paper 3.2). American Meteorological Society.
Prinzo, O. V., Hendrix, A. M., & Hendrix, R. (2007). An analysis of preflight weather briefings
(DOT/FAA/AM-07/4). Washington, DC: Federal Aviation Administration.
Stough, H. P., III., & Martzaklis, K. S. (2002). Progress in the development of weather
information systems for the cockpit. In Proceedings of the General Aviation Technology
& Exhibition Conference (Paper SAE 2002-01-1520). SAE International.
Wong, D. K. Y., Pitfield, D. E., Caves, R. E., & Appleyard, A. J. (2006). Quantifying and
characterizing aviation accident risk factors. Journal of Air Transport Management, 12,
352-357.
19
Acronyms
AOPA Aircraft Owners and Pilots Association
ARTCC Air Route Traffic Control Center
ATC Air Traffic Control
CONUS Continental United States
ESIS Enhanced Status Information System
GA General Aviation
IFR Instrument Flight Rules
IMC Instrument Meteorological Conditions
LIFR Low Instrument Flight Rules
MVFR Marginal Visual Flight Rules
NEXRAD Next-Generation Weather Radar
NTSB National Transportation Safety Board
PIREP Pilot Report
SME Subject Matter Expert
UCAR University Center for Atmospheric Research
VFR Visual Flight Rules
VMC Visual Meteorological Conditions