Embed Size (px)
Citation preview

HFN Report
Human Factors and Economic Aspects on Safety
Proceedings of the Swedish Human Factors Network (HFN) Conference, April 5 – 7, 2006, Linköping, Sweden
Edited by Clemens Weikert HFN report 2007-1
ISSN 1654-7551
ISBN 978-91-7393-999-7
i
Contents Preface ii Keynote: How to develop a safety culture? 108
Michael Lischke Papers: Time analysis of ATC radio traffic in a simulated free flight scenario 1
Fredrik Barchéus Interruptions in preflight- jump seat observations of communication in the cockpit 10
Kristina Enflo & Fredrik Barchéus Crisis management: What is required – How to design 19
Gunnar Dahlbäck, Dan Lindholm & Kjell Holmström Training of collaborative skills with mid-fidelity simulation 31
Nicklas Dahlström State of the Art Analysis:An Overview of Advanced Driver Assistance Systems (ADAS) and Possible Human Factors Issues 38
Anders Lindgren & Fang Chen Driving abilities assessed by means of driving simulators 51
Kjell Ohlsson The concept of normality and its impact on ICT design 58
Kjell Ohlsson, Hans Persson & Olle Östlin Evaluation of an in vehicle warning system 64
Birgitta Thorslund, Anna Anund & Magnus Hjälmdahl Constraint Recognition and State Space Representation in Collaborative Distributed Command and Control 72
Rogier Woltjer, Kip Smith & Erik Hollnagel A Systemic Functional Resonance Analysis of the Alaska Airlines Flight 261 Accident 83
Rogier Woltjer Information and Communication Technology in Collocated Emergency Management Training 94
Rogier Woltjer, Ida Lindgren & Kip Smith Joystick-controlled vehicles for rivers with severe disabilities 103
Joakim Östlund and Björn Peters
ii
Preface Now, finally, here are the edited proceedings from the HFN Conference 'Human Factors and Econo-mic Aspects on Safety' April 5 - 7, 2006. Two of the papers presented at the conference were withdrawn by the authors rather early in the editing process. Another two presentations are published in the proceedings as PowerPoint slides and not as regular papers. The Keynote by Prof. John W. Senders is for technical reasons not included in the printed proceedings but is available for downloading in pdf-format from the HFN website (www. humanfactorsnetwork.se). We (the organizers and the editor) would like to express our thanks to the contributing authors, especially for their patience shown by not pressing us for a final publication date. The Editor
Time analysis of ATC radio traffic in a simulated free flight scenario
Fredrik Barchéus
Division of Human Factors Engineering/INDEK Royal Institute of Technology, Stockholm, Sweden
Abstract
Radio communication is currently the primary mean of communication in Air Traffic Control. This is now being complemented by datalink technology to enhance capacity. To assess the largest benefits of datalink implementation an analysis of ATC radio communication was made by timing speech acts from 4.5 hours of communication during a simulation. The results show that address and altitude information account for over 50% of ATC communication. The largest benefits should be gained for communication regarding sector entry or exit since this type of communication is overrepresented in en-route air traffic.
Introduction In present Air Traffic Control, radio transferred speech is the main means of communication between pilots and air traffic controllers. Although being a simple and fairly robust way of communication, the medium suffers from bad sound quality and intrinsic language problems. To overcome these issues and to increase communication capacity datalink has been proposed as a primary mean of communication. On the other hand, current voice communication over open frequencies enables pilots to get a general awareness of the traffic situation. Consequently both mediums will most likely persist for a foreseeable future. One way of approaching the mixed modality environment could be to divide information so that instead of transferring messages either by voice or datalink, as much of the previous research has examined, the information could be shared in a parallel manner so that within the same message some information is communicated using voice while other is communicated via datalink as shown in figure 1. To assess what kind of communication would be most beneficial to transfer to datalink a time analysis of ATC radio traffic has been performed. Theory Previous research has shown that much of voice communication is not acknowledged properly (Rantanen & Kokayeff, 2002). Most research on pilot and controller handling of voice communication has focused on the relation between communication and errors (Morrow, et al., 1993, Prinzo & Britton, 1993). Lately, research has been performed to investigate how datalink communication would affect efficiency and safety in the Air Traffic Management system (Lee, et al., 2004, Lozito, et al., 2003, McGann, et al., 1998, Prinzo, 2001). Results have shown that datalink communication poses new demands on the usage of voice communication. Prinzo (2001) showed in a simulation of approach control, that in a mixed modality setting voice transmissions were notably shorter than datalink messages. Whereas datalink messages were restarted more often, they were more accurate and contained fewer topics than voice communication. McGann and colleagues (McGann, et al., 1998) investigated the relations between presentation of ATC-messages and transaction time in three different environments, voice only, datalink only and mixed. They discovered that communication transaction times were longer for datalink messages that were preceded by another message in both mixed and datalink-only environment. These findings only occurred when there was a short interval (5 sec) between the first and the second message. For voice messages transaction the same thing happened when a voice message was preceded by a datalink message and a short interval.
1
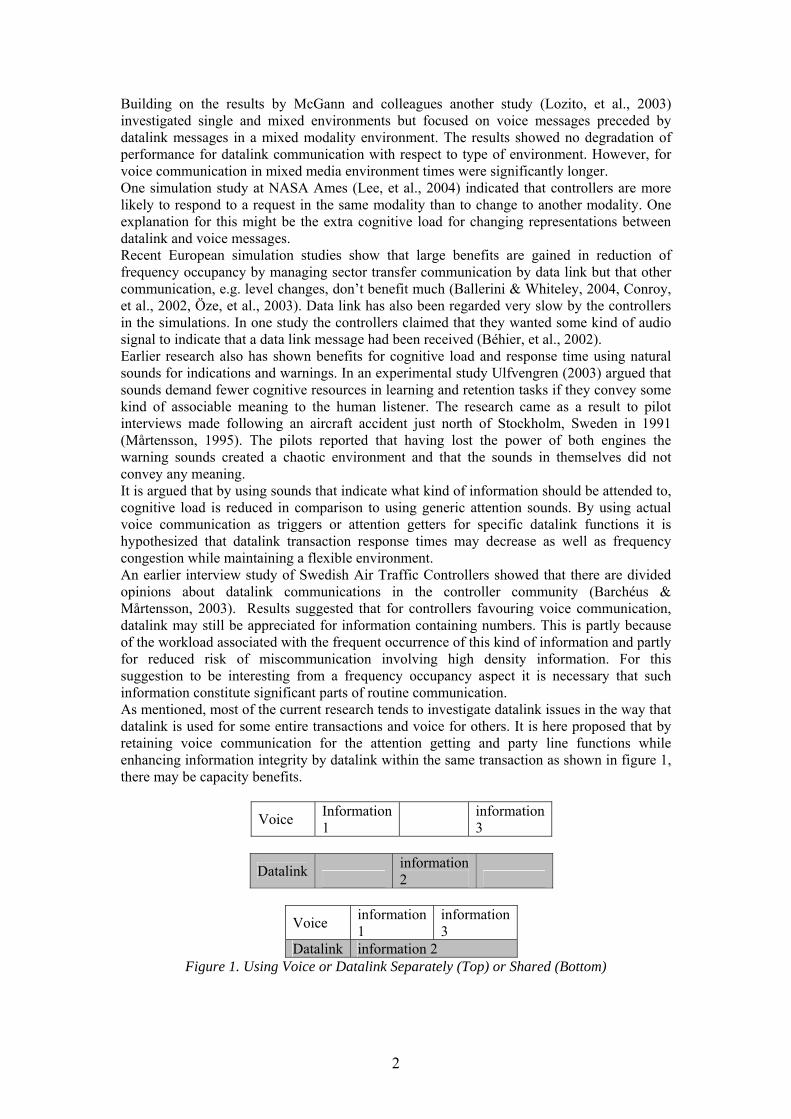
Building on the results by McGann and colleagues another study (Lozito, et al., 2003) investigated single and mixed environments but focused on voice messages preceded by datalink messages in a mixed modality environment. The results showed no degradation of performance for datalink communication with respect to type of environment. However, for voice communication in mixed media environment times were significantly longer. One simulation study at NASA Ames (Lee, et al., 2004) indicated that controllers are more likely to respond to a request in the same modality than to change to another modality. One explanation for this might be the extra cognitive load for changing representations between datalink and voice messages. Recent European simulation studies show that large benefits are gained in reduction of frequency occupancy by managing sector transfer communication by data link but that other communication, e.g. level changes, don’t benefit much (Ballerini & Whiteley, 2004, Conroy, et al., 2002, Öze, et al., 2003). Data link has also been regarded very slow by the controllers in the simulations. In one study the controllers claimed that they wanted some kind of audio signal to indicate that a data link message had been received (Béhier, et al., 2002). Earlier research also has shown benefits for cognitive load and response time using natural sounds for indications and warnings. In an experimental study Ulfvengren (2003) argued that sounds demand fewer cognitive resources in learning and retention tasks if they convey some kind of associable meaning to the human listener. The research came as a result to pilot interviews made following an aircraft accident just north of Stockholm, Sweden in 1991 (Mårtensson, 1995). The pilots reported that having lost the power of both engines the warning sounds created a chaotic environment and that the sounds in themselves did not convey any meaning. It is argued that by using sounds that indicate what kind of information should be attended to, cognitive load is reduced in comparison to using generic attention sounds. By using actual voice communication as triggers or attention getters for specific datalink functions it is hypothesized that datalink transaction response times may decrease as well as frequency congestion while maintaining a flexible environment. An earlier interview study of Swedish Air Traffic Controllers showed that there are divided opinions about datalink communications in the controller community (Barchéus & Mårtensson, 2003). Results suggested that for controllers favouring voice communication, datalink may still be appreciated for information containing numbers. This is partly because of the workload associated with the frequent occurrence of this kind of information and partly for reduced risk of miscommunication involving high density information. For this suggestion to be interesting from a frequency occupancy aspect it is necessary that such information constitute significant parts of routine communication. As mentioned, most of the current research tends to investigate datalink issues in the way that datalink is used for some entire transactions and voice for others. It is here proposed that by retaining voice communication for the attention getting and party line functions while enhancing information integrity by datalink within the same transaction as shown in figure 1, there may be capacity benefits.
Voice Information 1 information
3
Datalink information 2
Voice information 1
information 3
Datalink information 2 Figure 1. Using Voice or Datalink Separately (Top) or Shared (Bottom)
2
Although much research has focused on measuring radio communication it has been done mainly using the ratio of speech acts as an indication to what kind of information is most critical for voice communication. By measuring time occupancy, clues may be found to what kind of information demands most resources from a serial processing information management point of view. Since frequently occurring speech acts, or speech acts, may hypothetically be frequent just because they are short, inversely, rarely occurring speech acts may be very long. Hence, measured in time the fewer messages can result in as severe frequency occupancy problems as frequently occurring messages. To be able to predict possible benefits for frequency occupancy time the aim of the research is to investigate the frequency load for different kinds of voice communication. The present paper presents results from a time analysis of radio traffic in a simulated Free Flight scenario.
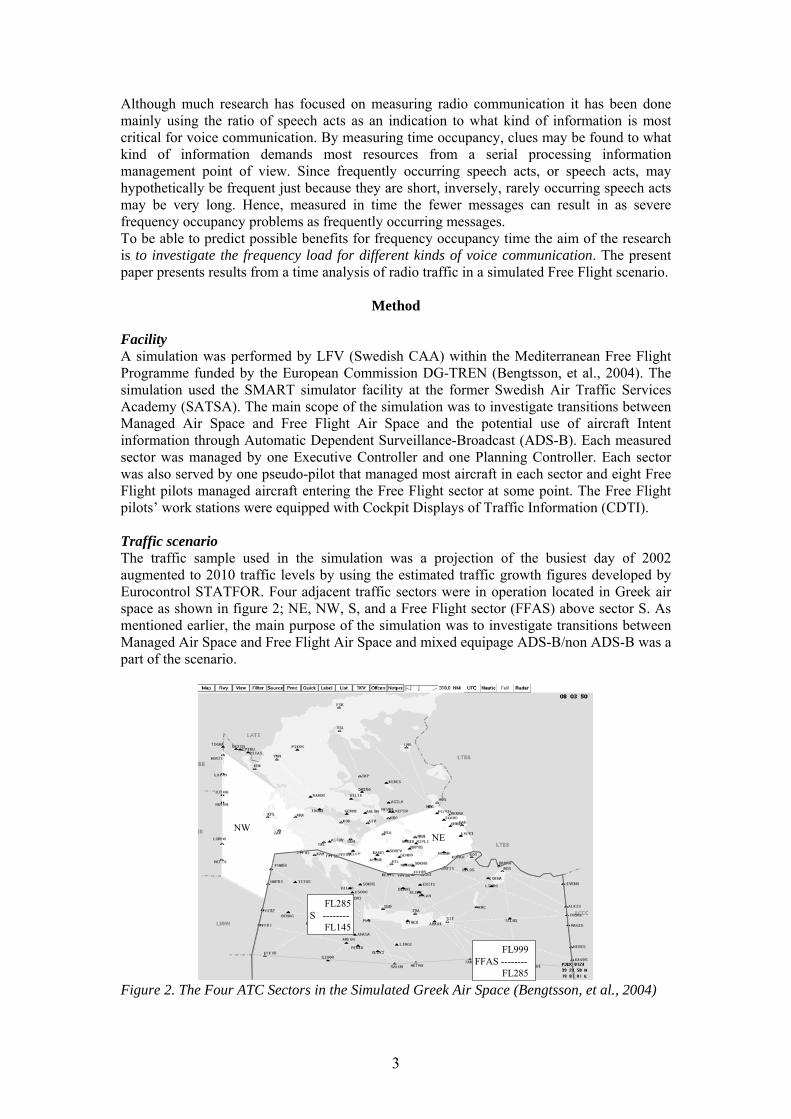
Method Facility A simulation was performed by LFV (Swedish CAA) within the Mediterranean Free Flight Programme funded by the European Commission DG-TREN (Bengtsson, et al., 2004). The simulation used the SMART simulator facility at the former Swedish Air Traffic Services Academy (SATSA). The main scope of the simulation was to investigate transitions between Managed Air Space and Free Flight Air Space and the potential use of aircraft Intent information through Automatic Dependent Surveillance-Broadcast (ADS-B). Each measured sector was managed by one Executive Controller and one Planning Controller. Each sector was also served by one pseudo-pilot that managed most aircraft in each sector and eight Free Flight pilots managed aircraft entering the Free Flight sector at some point. The Free Flight pilots’ work stations were equipped with Cockpit Displays of Traffic Information (CDTI). Traffic scenario The traffic sample used in the simulation was a projection of the busiest day of 2002 augmented to 2010 traffic levels by using the estimated traffic growth figures developed by Eurocontrol STATFOR. Four adjacent traffic sectors were in operation located in Greek air space as shown in figure 2; NE, NW, S, and a Free Flight sector (FFAS) above sector S. As mentioned earlier, the main purpose of the simulation was to investigate transitions between Managed Air Space and Free Flight Air Space and mixed equipage ADS-B/non ADS-B was a part of the scenario.
NWNE
S
FFAS
FFASFL999FFAS --------
FL285
FL285S --------
FL145
Figure 2. The Four ATC Sectors in the Simulated Greek Air Space (Bengtsson, et al., 2004)
3
Procedure Twelve simulation exercises were conducted in the simulation and were recorded using three video camcorders connected to the simulator audio circuit. In some exercises one sector workstation was filmed from several angles and identical radio traffic was captured. Consequently a total of 22 hours of radio traffic was recorded. For the purpose of this paper 4.5 hours of radio traffic has been analysed. The radio traffic from the tape was transcribed verbatim and speech acts were classified according to a coding scheme that was developed for this purpose. The different messages were then timed using a visual editing tool (Adobe Audition 1.5) Each speech act has been timed either at deviation from background noise level or simply between two syllables. Subjects Six operational Air Traffic Controllers from different European countries participated in the simulation along with nine pilots employed for simulation and education purposes by the LFV. The controllers represented Greece, Malta, Italy, Spain and Sweden. The data presented here is restricted to radio traffic from five of the six controllers. Three controller students acted as pseudo-pilots in the simulation, managing aircraft within each controlled sector. Eight certified pilots employed by LFV acted as Free Flight pilots, managing aircraft flying to or from the Free Flight sector. All pilots in the simulation were Swedish.
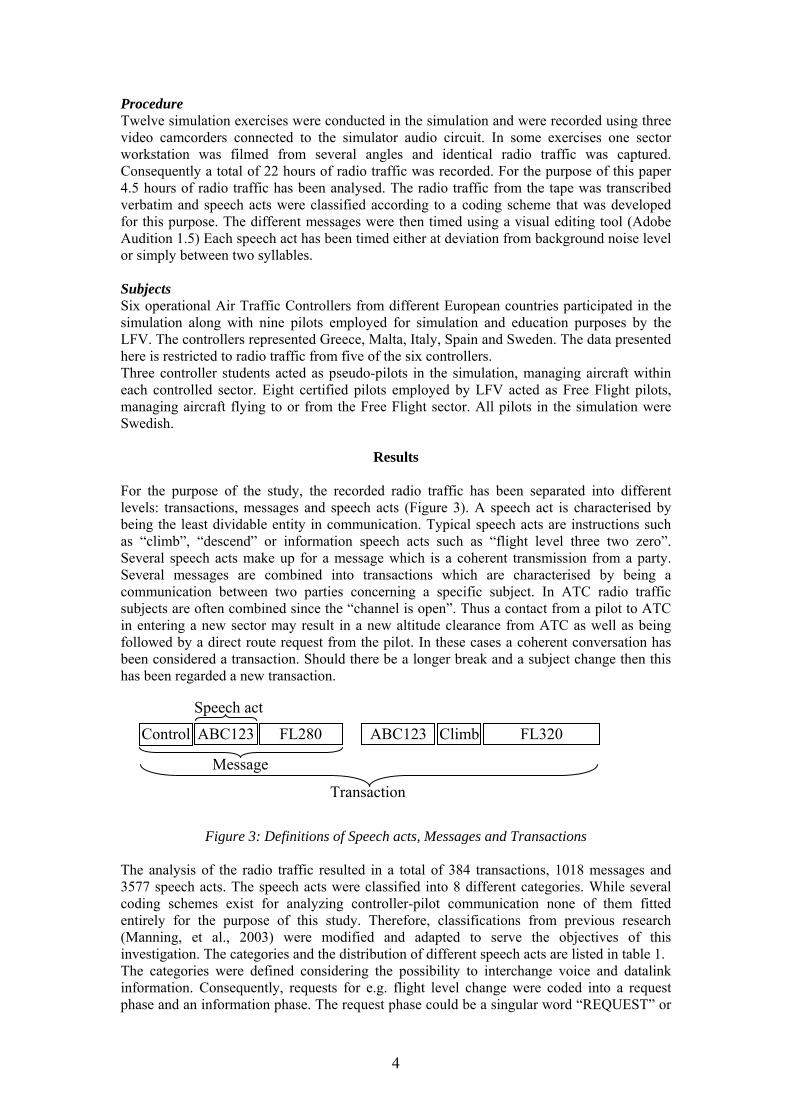
Results For the purpose of the study, the recorded radio traffic has been separated into different levels: transactions, messages and speech acts (Figure 3). A speech act is characterised by being the least dividable entity in communication. Typical speech acts are instructions such as “climb”, “descend” or information speech acts such as “flight level three two zero”. Several speech acts make up for a message which is a coherent transmission from a party. Several messages are combined into transactions which are characterised by being a communication between two parties concerning a specific subject. In ATC radio traffic subjects are often combined since the “channel is open”. Thus a contact from a pilot to ATC in entering a new sector may result in a new altitude clearance from ATC as well as being followed by a direct route request from the pilot. In these cases a coherent conversation has been considered a transaction. Should there be a longer break and a subject change then this has been regarded a new transaction.
Figure 3: Definitions of Speech acts, Messages and Transactions
The analysis of the radio traffic resulted in a total of 384 transactions, 1018 messages and 3577 speech acts. The speech acts were classified into 8 different categories. While several coding schemes exist for analyzing controller-pilot communication none of them fitted entirely for the purpose of this study. Therefore, classifications from previous research (Manning, et al., 2003) were modified and adapted to serve the objectives of this investigation. The categories and the distribution of different speech acts are listed in table 1. The categories were defined considering the possibility to interchange voice and datalink information. Consequently, requests for e.g. flight level change were coded into a request phase and an information phase. The request phase could be a singular word “REQUEST” or
ABC123 FL280
Speech act
Control ABC123 Climb FL320
Message
Transaction
4
a longer phrase “REQUEST TO ENTER CONTROLLED AREA” followed by an information phase e.g. “FLIGHT LEVEL 320”. The Request category also contains implicit requests for information such as “WHAT WOULD BE YOUR FINAL FLIGHT LEVEL”. Although this is not standard phraseology it is not unusual for pilots and controllers to deviate from written phraseology standards, indeed it is one of the flexible characteristics of voice communication technology. However, this also implies that Requests occupy longer amounts of time to complete. Instructions/clearances times are widely spread because of the changing nature of their use. A very short instruction “CLIMB” may be followed by a very long clearance “CLEARED TO ENTER FREE FLIGHT AIR SPACE” which inevitably results in a scattered result.
Table 1. Categories for Coding Radio Messages Category Occurrences Address 1153 Instruction/clearance 584 Altitude 528 Frequency 264 Position 259 Courtesy 248 Acknowledgement 178 Hesitation 127 Other information 114 Request 105 Corrective 17
For the purpose of clarity some examples of typical transactions are provided as follows:
Example 1. Short Controller-Pilot Transaction A/C: ATHEN CONTROL [Address] LTU EIGHT ZERO FOUR [Address]
FLIGHT LEVEL THREE SEVEN ZERO [Altitude] ATC: GOOD MORNING [Courtesy] LTU EIGHT ZERO FOUR [Address]
ADS CONTACT [Acknowledgement]
Example 2. Long Controller-Pilot Transaction A/C: CONTROL [Address] ALITALIA EIGHT EIGHT TWO [Address] ATC: ALITALIA EIGHT EIGHT TWO [Address] GO AHEAD [Request] A/C: EIGHT EIGHT TWO [Address] REQUEST CLEARANCE TO
LEAVE CONTROLLED AREA [Request] AT TRIPPLE FOX [Position] FLIGHT LEVEL THREE FIVE ZERO [Altitude] AND TIME FIVE ZERO [Time]
ATC: ALITALIA EIGHT EIGHT TWO [Address] LEAVE [Instruction/clearance] AT TRIPPLE FOX ZERO NINER [Position] FLIGHT LEVEL THREE FIVE ZERO [Altitude] ADS SERVICE TERMINATED [Other FF-related] MONITOR [Instruction/clearance] ONE FOUR FOUR DECIMAL ZERO [Frequency] GOOD DAY [Courtesy]
A/C: CLEARED [Instruction/clearance] TRIPPLE FOX [Position] FLIGHT LEVEL THREE FIVE ZERO [Altitude] AND WILL MONITOR [Instruction/clearance] ONE FOUR FOUR POINT ZERO [Frequency] ALITALIA EIGHT EIGHT TWO [Address]
Transmission time by speech acts The category that demanded longest individual transmission times was “Other information” and “Request”. The primary reason for this lie in the fact that when requests are made it is
5
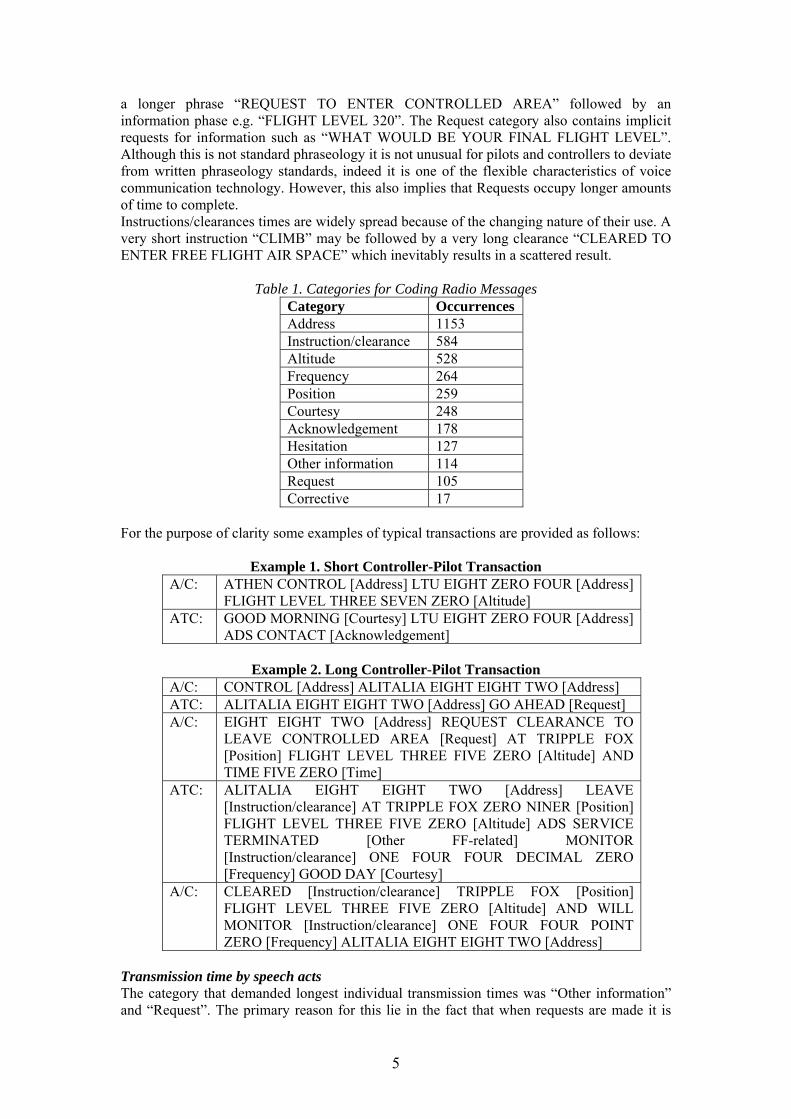
because of missing information. In these cases the analysis indicated that controllers start communication while still processing information which may result in elongation of words. Another explanation may be that pilot requests for entering in Managed Air Space coming from Free Flight Air Space was fairly long caused by prescribed phraseology. Since some categories that demand comparatively long periods of time are not used very much, they do not contribute to a great extent to the total transmission time. The largest contribution is made by speech acts that both require extended amounts of time as well as being frequently used. Analyzing total transmission time reveals that over 50% of the radio traffic consists of Address and Altitude information (Figure 4).
0%
5%
10%
15%
20%
25%
30%
35%
40%
Addres
s
Altitud
e
Instru
ction
/Clea
rance
Positio
n
Freque
ncy
Other
Hesita
tion
Reque
st
Ackno
wledge
ment
Courte
sy
All flightsNo Entry/Exit
Figure 4. Total Transmission Time by Category
Analysis showed that the largest part of communication was initiated as a consequence of ATC sector transfers. Measured by transaction the amount of sector transfer communications was 281 of 384 in total measuring up to 73% of all communication. Compensating for this, the time used decreases from 50% to merely 15% for the two largest categories. The ratios between different speech acts still show the same pattern, at least for the four largest categories. Transaction time Timing of separate messages effectively disregards silences in the communication. Such silences include connection entry/exit and intra-transaction slack. Silence caused by hesitation is included in the within-message analysis. Connection entry is the time that is needed by the radio equipment to establish a stable link and the resulting silence applied by pilots and controllers to prevent cut-off messages. Connection exit is the same operator applied silence at the end of a message until the radio link is released. This time is usually limited to a few tenths of a second. Intra-transaction slack is the natural silence that occur between messages within a transaction. Mostly these are limited to less than two seconds, but may be longer caused by e.g. longer times of information retrieval. Significant for intra-transaction slack is that the “ownership” of the frequency resides with the current communication pair. Other pilots have to wait for their turn. Observations during the simulation showed that pseudo-pilots tended to group communication from several aircraft together as a form of batch-processing strategy which strengthened the perception from the controllers’ perspective of frequency congestion.
6
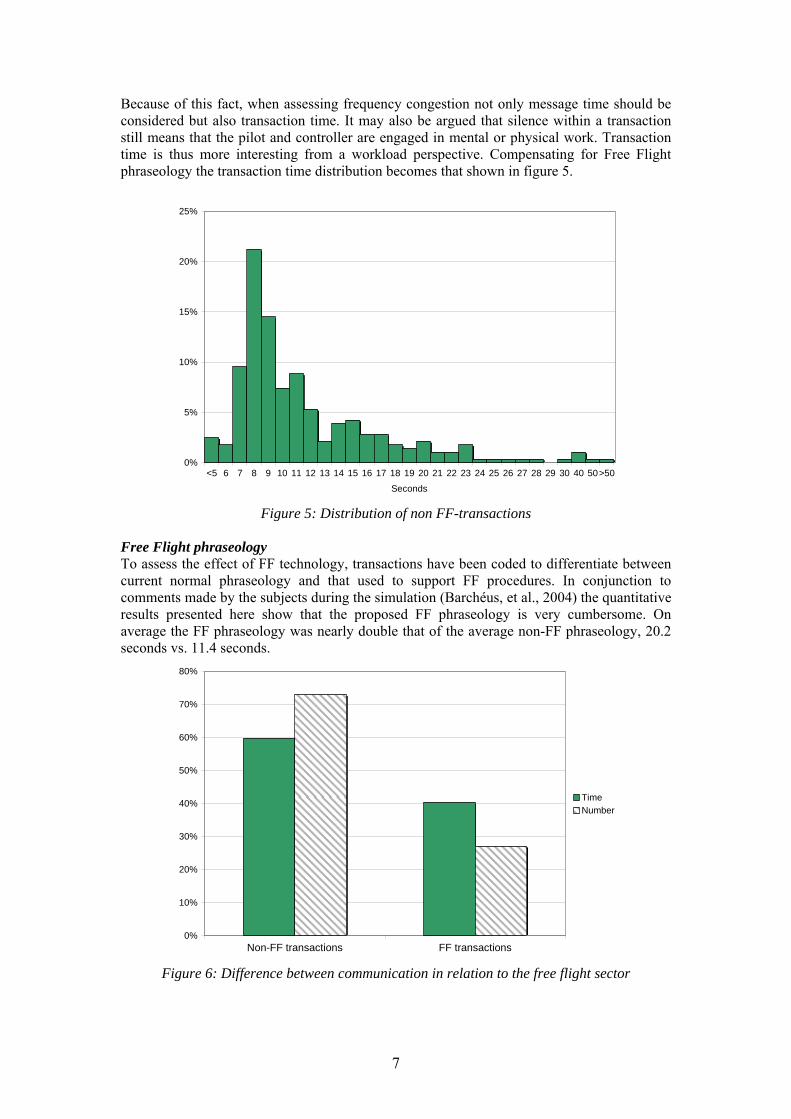
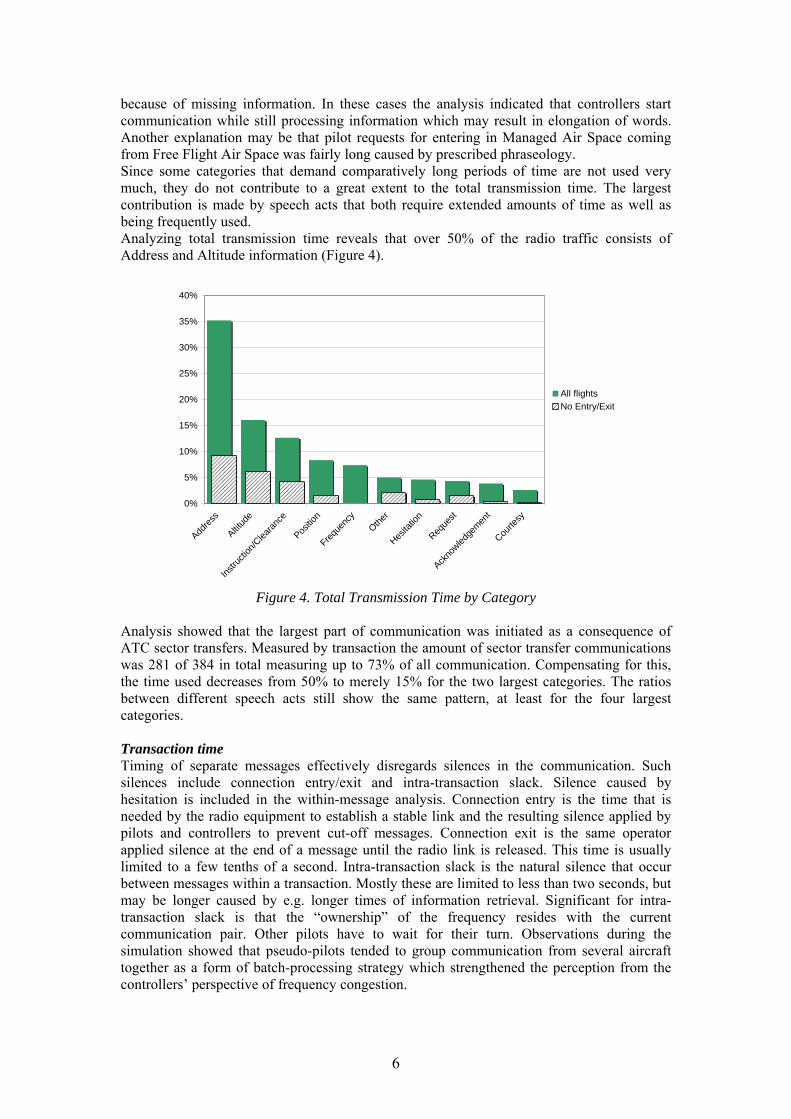
Because of this fact, when assessing frequency congestion not only message time should be considered but also transaction time. It may also be argued that silence within a transaction still means that the pilot and controller are engaged in mental or physical work. Transaction time is thus more interesting from a workload perspective. Compensating for Free Flight phraseology the transaction time distribution becomes that shown in figure 5.
0%
5%
10%
15%
20%
25%
<5 6 7 8 9 10 11 12 13 14 15 16 17 18 19 20 21 22 23 24 25 26 27 28 29 30 40 50>50
Seconds
Figure 5: Distribution of non FF-transactions Free Flight phraseology To assess the effect of FF technology, transactions have been coded to differentiate between current normal phraseology and that used to support FF procedures. In conjunction to comments made by the subjects during the simulation (Barchéus, et al., 2004) the quantitative results presented here show that the proposed FF phraseology is very cumbersome. On average the FF phraseology was nearly double that of the average non-FF phraseology, 20.2 seconds vs. 11.4 seconds.
0%
10%
20%
30%
40%
50%
60%
70%
80%
Non-FF transactions FF transactions
TimeNumber
Figure 6: Difference between communication in relation to the free flight sector
7
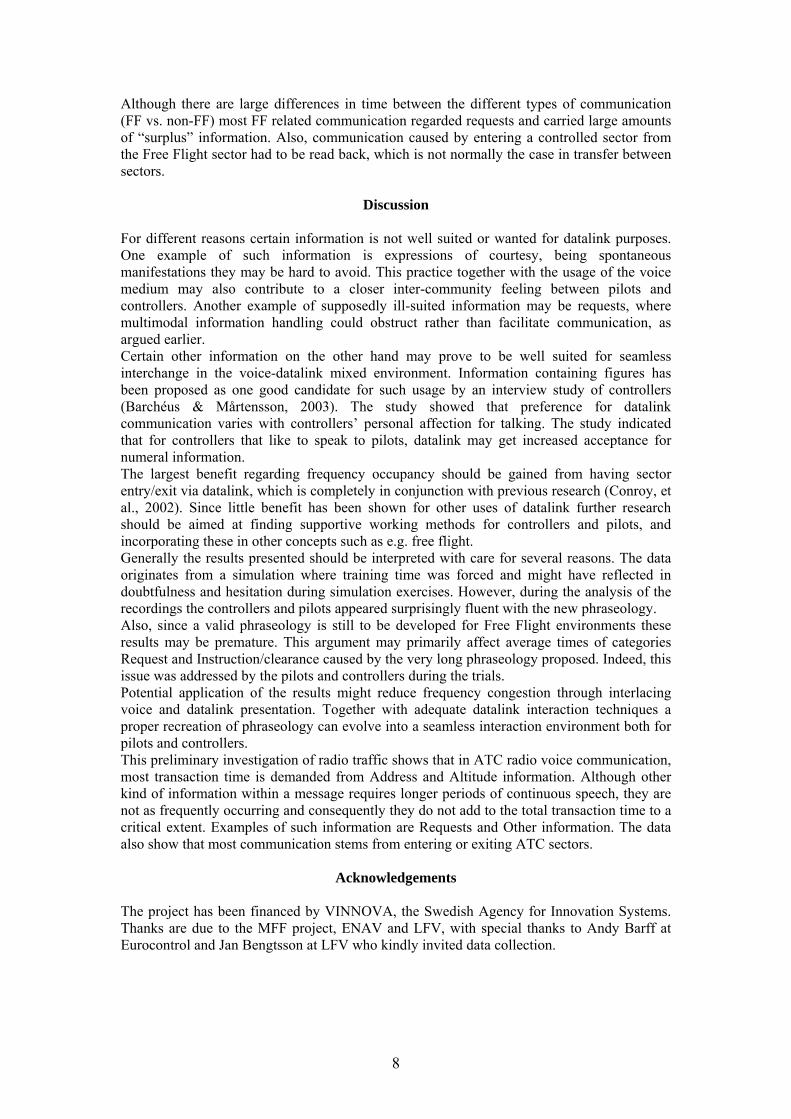
Although there are large differences in time between the different types of communication (FF vs. non-FF) most FF related communication regarded requests and carried large amounts of “surplus” information. Also, communication caused by entering a controlled sector from the Free Flight sector had to be read back, which is not normally the case in transfer between sectors.
Discussion For different reasons certain information is not well suited or wanted for datalink purposes. One example of such information is expressions of courtesy, being spontaneous manifestations they may be hard to avoid. This practice together with the usage of the voice medium may also contribute to a closer inter-community feeling between pilots and controllers. Another example of supposedly ill-suited information may be requests, where multimodal information handling could obstruct rather than facilitate communication, as argued earlier. Certain other information on the other hand may prove to be well suited for seamless interchange in the voice-datalink mixed environment. Information containing figures has been proposed as one good candidate for such usage by an interview study of controllers (Barchéus & Mårtensson, 2003). The study showed that preference for datalink communication varies with controllers’ personal affection for talking. The study indicated that for controllers that like to speak to pilots, datalink may get increased acceptance for numeral information. The largest benefit regarding frequency occupancy should be gained from having sector entry/exit via datalink, which is completely in conjunction with previous research (Conroy, et al., 2002). Since little benefit has been shown for other uses of datalink further research should be aimed at finding supportive working methods for controllers and pilots, and incorporating these in other concepts such as e.g. free flight. Generally the results presented should be interpreted with care for several reasons. The data originates from a simulation where training time was forced and might have reflected in doubtfulness and hesitation during simulation exercises. However, during the analysis of the recordings the controllers and pilots appeared surprisingly fluent with the new phraseology. Also, since a valid phraseology is still to be developed for Free Flight environments these results may be premature. This argument may primarily affect average times of categories Request and Instruction/clearance caused by the very long phraseology proposed. Indeed, this issue was addressed by the pilots and controllers during the trials. Potential application of the results might reduce frequency congestion through interlacing voice and datalink presentation. Together with adequate datalink interaction techniques a proper recreation of phraseology can evolve into a seamless interaction environment both for pilots and controllers. This preliminary investigation of radio traffic shows that in ATC radio voice communication, most transaction time is demanded from Address and Altitude information. Although other kind of information within a message requires longer periods of continuous speech, they are not as frequently occurring and consequently they do not add to the total transaction time to a critical extent. Examples of such information are Requests and Other information. The data also show that most communication stems from entering or exiting ATC sectors.
Acknowledgements The project has been financed by VINNOVA, the Swedish Agency for Innovation Systems. Thanks are due to the MFF project, ENAV and LFV, with special thanks to Andy Barff at Eurocontrol and Jan Bengtsson at LFV who kindly invited data collection.
8
References Ballerini, F. & Whiteley, M. (2004). DOVE-2 Real Time Simulation (Report 390). Brétigny-
sur-Orge: EUROCONTROL Experimental Centre Barchéus, F. & Mårtensson, L. (2003). New air traffic management systems - views of air
traffic controllers. In Proceedings of the 8th IFAC/IFIP/IFORS/IEA Symposium on Automated Systems Based on Human Skill and Knowledge. Göteborg, Sweden
Barchéus, F., Mårtensson, L. & Ulfvengren, P. (2004). Analysis of questionnaires from MFF-RTS3 Intent (Report MFF450TR00n - D452C). Stockholm: KTH
Béhier, P., Adams, C., Adnams, M., Beckers, J., Bharj, D., Daems, D., Huizer, H., Janssens, G., Koebe, K., McHugh, M., Mead, R. & Roca, J. (2002). PETAL-II Transition and Final Report, Volume 2 (Report EATMP Reference number AGC/Z/02). Eurocontrol, PETAL-II Project Office
Bengtsson, J., Ternov, S. & Schack, U. (2004). RTS3 Ground Human Factors in Free Flight (A5) Transition with Intent - LFV (Report MFF450TR005 D451C - Annex 4). LFV, MFF-Consortium
Conroy, P., Deransy, R., McGregor, R., Pichancourt, I. & Whiteley, M. (2002). LINK2000+ Real-time simulation project (Report 376). Brétigny-sur-Orge: EUROCONTROL Experimental Centre
Lee, P. U., D'Arcy, J.-F., Mafera, P., Smith, N., Battiste, V., Johnson, W., Mercer, J., Palmer, E. A. & Prevôt, T. (2004). Trajectory Negotiation via Data Link: Evaluation of Human-in-the-loop Simulation. In Proceedings of the HCI-Aero 2004. Toulouse
Lozito, S., Martin, L., Dunbar, M., McGann, A. & Verma, S. (2003). The Impact of Voice, Data Link, and Mixed Air Traffic Control Environments on Flight Deck Procedures. In Proceedings of the ATM2003, The 5th USA/Europe R&D Seminar. Budapest, Hungary
Manning, C., Fox, C. & Pfleiderer, E. (2003). Relationships between measures of air traffic controller voice communications, taskload, and traffic complexity. In Proceedings of the 5th USA/Europe ATM R&D Seminar. Budapest, Hungary
McGann, A., Morrow, D., Rodvold, M. & Mackintosh, M. A. (1998). Mixed-media communication on the flight deck: A comparison of voice, data link, and mixed ATC environments. International Journal of Aviation Psychology, 8, 2, 137-156.
Morrow, D., Lee, A. & Rodvold, M. (1993). Analysis of Problems in Routine Controller-Pilot Communication. International Journal of Aviation Psychology, 3, 4, 285-302.
Mårtensson, L. (1995). The aircraft accident at Gottröra - the experiences of the cockpit crew. The International Journal of Aviation Psychology, 5, 3, 305-326.
Prinzo, O. V. (2001). Data-Linked Pilot Reply Time On Controller Workload and Communication in a Simulated Terminal Option (Report DOT/FAA/AM-01/8). Oklahoma City, OK: FAA Civil Aeromedical Institute
Prinzo, O. V. & Britton, T. W. (1993). ATC/Pilot Voice Communications: A Survey of the Literature (Report DOT/FAA/AM-93/20). Oklahoma City, OK: FAA Civil Aeromedical Institute
Rantanen, E. M. & Kokayeff, N. K. (2002). Pilot errors in copying air traffic control clearances. In Proceedings of the 46th Annual Meeting of the Human Factors and Ergonomics Society. 145-149. Santa Monica, CA
Ulfvengren, P. (2003). Associability: A comparison of sounds in a cognitive approach to auditory alert desing. Human Factors and Aerospace Safety, 3, 4, 313-331.
Öze, S., Whiteley, M., Deransy, R. & McGregor, R. (2003). DOVE 1 Real-time simulation (Report 383). Brétigny-sur-Orge: EUROCONTROL Experimental Centre
9
Interruptions in preflight - jump seat observations of communication in the cockpit
Kristina Enflo & Fredrik Barchéus
Division of Human Factors Engineering, School of Industrial Engineering and Management,
Royal Institute of Technology, Stockholm, Sweden
Abstract It is generally recognised that interruptions is a normal part of pilot’s everyday life. They may however be potentially harmful. Economic demands on airline companies and technical opportunities may change working procedures and alter communication flow, which in turn can affect the way interruptions are dealt with. The present paper seeks to analyse how communication propagates through the cockpit and to illustrate the origins of that communication. To achieve this goal jump-seat observations have been performed. The results indicate that interactions between different processes create potential interruptions for the pilots. By categorising communication with regards to being safety or non-safety related, it is shown that workload and potential interruptions may be handled by task reallocation. The analysis also shows that communication via radio constitutes a greater potential interruption than information via the cockpit door.
Introduction Current competition in aviation forces airlines to follow strict marketing concepts to position themselves towards certain customer sectors. Such marketing concepts include low-cost companies, which also has opened the opportunity for airlines to market themselves as business airlines focusing on a high level of service rather than just low ticket fares. One parameter that may be seen as a customer service is the latest allowed check-in time, which gives the passenger less “forced” transit time. However, it may delay factors as passenger and baggage counting for the flight crew. This postponement may induce stress for the crew and it is important that work associated with safety is not affected. At Malmö Aviation, a minor airline based in Malmö, Sweden, the latest check-in time is set to ten minutes before take off to increase customer value. Furthermore, competition has forced the airline to remove the function of the “ramp agent” who coordinated information flow between the pilots and other functions. To compensate for this, the pilots’ Standard Operating Procedures (SOP) have been rewritten and a Nokia Communicator mobile telephone with custom software has been introduced on the flight deck to facilitate weight and balance calculations. The SOP describes the safety procedures, concepts, responsibilities and working techniques to be adhered to. In addition to the SOP there is a Crew Contact System (CCS), through which changes in flight safety matters or company routines are distributed. Theoretical framework Several previous studies and accident and incident reports have acknowledged that interruptions on the flight deck can constitute safety hazards (Damos & Tabachnick, 2001; Dismukes, et al., 1998; Latorella, 1996) and several attempts have also been made to model interruptions on a formal basis (Diez, et al., 2002; Latorella, 1999). This has also been noted at the observed airline and preflight procedures have been designed so that items connected to the safety of flight are separated from other processes. Through this precaution the risk for non-safety related tasks to interfere with safety related ones is decreased.
10
Field and Spence (1994) showed in a series of laboratory experiments that interruptions elongated task time in a simple information retrieval task. The results also indicated that the interruptions were experienced to be more intrusive when they were not expected, than when the test subjects could anticipate being interrupted. Other studies have shown that error rates increase when tasks are interrupted (Latorella, 1996). Damos and Tabachnick (2001) performed flight deck observations to assess task prioritisation based on patterns of interruptions. Their study showed that Air Traffic Control (ATC) communication had a high probability of interrupting checklists. Thus ATC communication was considered more important than checklists. However, other less important tasks, such as cockpit communication, were not interrupted. Damos and Tabachnick argued that such tasks were relatively short and thus had a smaller probability of being interrupted. Previous studies have shown that while written airline material describes serial processes, the normal flight deck environment is characterised by concurrent task demands (Dismukes, et al., 2001; Loukopoulos, et al., 2001; Loukopoulos, et al., 2003). The difference between training and real-world situations may arguably be one cause of uncertainties that can add to pilot workload in preflight flow (Loukopoulos, et al., 2001). A central part in pilot work is communication with other functions, such as ATC or cabin crew. However, not only communication directly affecting the pilot, but all available communication must be screened to determine its relevance and may thus constitute an interruption (Loukopoulos, et al., 2003). A number of techniques are used by pilots to reduce vulnerability to lapses in monitoring and prospective memory (Dismukes, et al., 2001). Examples of such techniques include creating linking memory items to habitual actions or creating visual, auditory, or tactile reminders such as physically holding checklists until the tower calls. The removal of the ramp agent has added to pilot workload by increasing communication tasks. The reason that the pilot has been given this task is presumably that the pilot has access to radio, so it was the simplest solution. Accounts from pilots also state that they are now better involved in the loop since all communication has to pass through the cockpit. To be able to analyse the relationships between different task and working functions a series of jump-seat observations have been performed. The purpose is to map the preflight process to investigate how, when and with whom or what pilots interact in the work process. Potential interruptions for the pilots are studied in order to assess the impact and importance of these and the reason of the communication that causes them.
Method A total of 24 individual jump-seat observations were carried out by two observers from June through December 2005. At the four initial flights the pilots’ activities and communication were observed and noted with pen and paper without any other support. The data from these flights were compared and constituted the base for an observation template to facilitate the following observations. In parallel to the observational study the template was further developed. All the flights were domestic flights and lasted approximately one hour. The observational flights started at Stockholm/Bromma airport and were scheduled for Malmö/Sturup, Göteborg/Landvettter and Umeå airport. The flights took place during different times of the day, from early morning to late evening with different pilots as commanders and co-pilots. During release flights the observers studied the work in the crew room prior to entering the aircraft as well. In the template the normal flight was divided into several phases, A to E, to facilitate for the observers, see Table 1. In the present paper phase B, preflight checks and departure briefing,
11
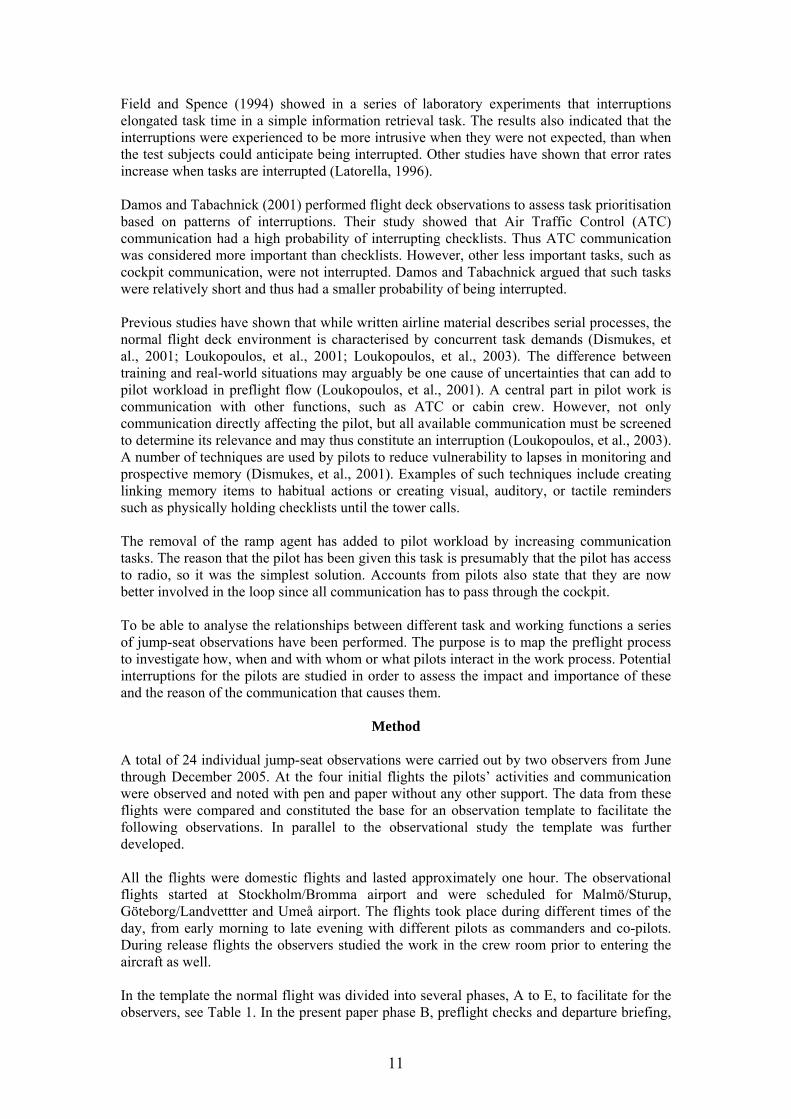
is studied since this is considered to be the most intense phase with regard to communication between different categories of personnel. Table 1. The process of a normal flight divided into phases.
Location Crew room Aircraft Aircraft Aircraft Aircraft
Content Preflight Briefing
Preflight Checks & Departure
Briefing
Engine Starts, Push-back, Taxi, Take-
Off
Climb, Cruise
Descent, Approach,
Landing & Taxi
PHASE Phase A Phase B Phase C Phase D Phase E With the use of the observation template, the events were labelled and ordered in a database. An event line was created for each flight and the events were ordered on the basis of the particular flight. During the observations a continuous validation of the notes was performed through confirming the events with the flight crew. In some cases this was not possible because of heavy workload for the pilots. If there were possible uncertainties these were checked during more calm periods. In cases where events were missed it was assumed that the multitude of observations ensured filling the gaps. In the study, an interruption was recorded when a pilot task was disrupted by another event, and then retained, regardless of the severity of the interruption. In March 2006 a feedback meeting was held at Malmö Aviation with the director of flight operations and the chief pilot, where the initial findings were discussed and complemented. The process map was further analysed on the basis of flows, such as the flow of passengers and the baggage. The communication around these flows was traced.
Results The preflight processes The analysis of the jump seat observations showed that the pilots’ work in phase B includes performing preflight checks and planning the flight as well as coordinating tasks between personnel. Weather information received in phase A is complemented by listening to ATIS (Automatic Terminal Information Service) on the radio, which gives information about weather on airport and runway. The flight plan (FLP) is coded into the GNS, the aircraft’s navigation system. To be able to perform weight and balance (W/B) calculations of the aircraft, a custom software for the Nokia Communicator mobile telephone is used. When entering the aircraft on a release flight the fuel receipt is usually already in the cockpit, since the ground personnel have refuelled the aircraft in advance. This means that the pilots can choose when to register the fuel information. In the phase B, the pilots may perform three checklists, called C/L Flight Deck Safety, C/L Flight Deck Originating and C/L Flight Deck Reduced. The C/L Flight Deck Safety is performed immediately after entering the aircraft, before other activities start. The C/L Flight Deck Originating is extensive and the most time demanding checklist, which may imply that it is interrupted several times. The pilots are working according to the advice to only have the weight and balance calculations left after performing C/L Flight Deck Reduced. As mentioned before, this is an attempt to separate the safety related activities from non-safety activities. The C/L Flight Deck Reduced is performed on all turnaround flights. The C/L Flight Deck Safety is usually performed if changing aircraft as well as the C/L Flight Deck Originating.
12
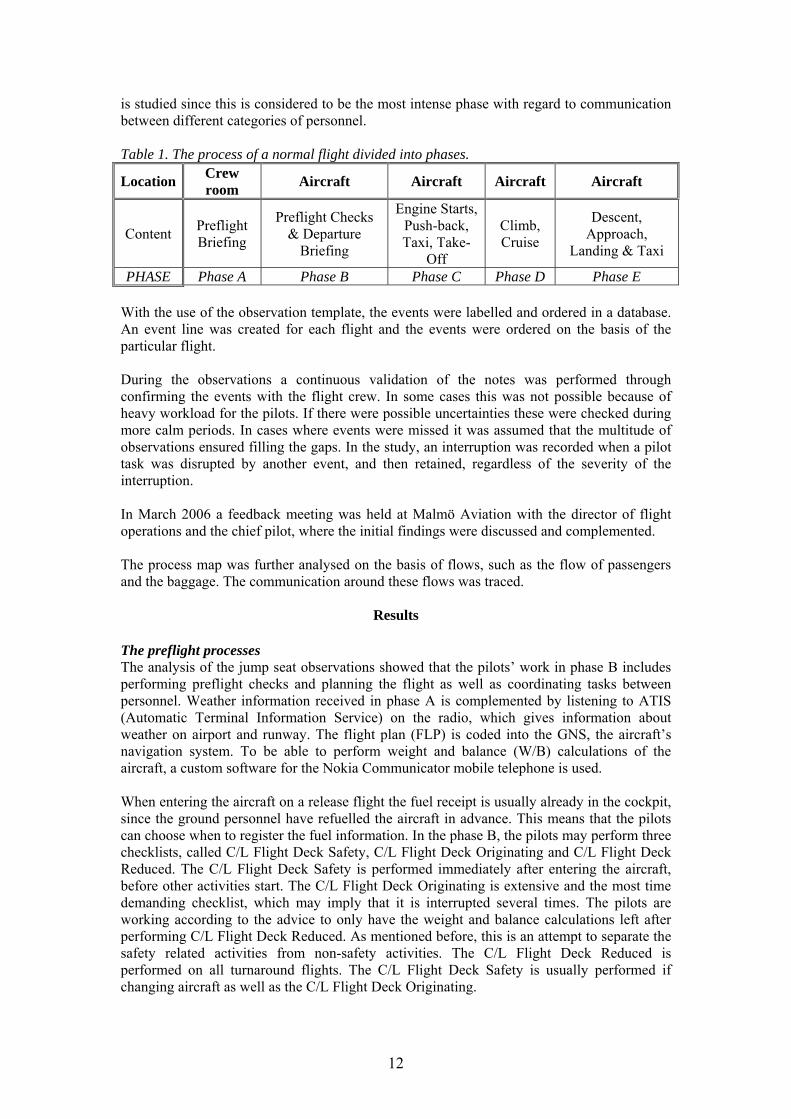
The Nokia Communicator is integrated into the operations of phase B to facilitate weight- and balance calculations and to register information of the flight into a company database. The tool distributes the work during the whole phase, since the information could be registered gradually after received required information, such as the fuel receipt, seating of the passengers and loading of the baggage. Before the Nokia Communicator was in use, the pilots made the calculations by hand with support of a calculator. The final calculation to get the total weight of the aircraft was time demanding. The final calculation is and has been performed just before the engines’ start up, under high time pressure because of the late check-in time for the passengers. The Nokia Communicator has diminished the workload for the pilots by distributing the activities and helping remembering which information is required. The pilots usually “share the work” with the Nokia Communicator between each other to increase the quality of the information to some extent, since the activities cannot be cross-checked. Communication flow The pilots’ work in phase B is also to coordinate between other functions, e.g. the cabin, the gate, the coordinator, the ATC and the ground. The whole, complex process of a normal flight can be explained on the basis of flows: The flow of passengers, the baggage and the catering. To handle the flows, communication between the functions and cooperation over the functions’ work processes are essential. This also applies beyond the mentioned flows. In order to prepare the aircraft for safe flight the pilots communicate with the ATC and the ground personnel, see Figure 1. The pilots need several clearances from ATC for each major step, ATC clearance, start-up clearance, and pushback clearance. The start-up clearance and the pushback clearance are often contained in the same message. The requests for clearances usually come from the pilots when the aircraft is ready. Malmö Aviation operates on relatively small airports in Sweden and hence the communication between ATC and pilots is limited, compared to larger airports. The pilot orders fuel either from the crew room before entering the aircraft or from the air, in case of a turnaround. The order goes via a coordinator to the fuel company. When the fuelling crew has filled the aircraft, they give a receipt to the pilots. On release flights the refuelling is usually done before the pilots enter the aircraft and the receipt is then already in the cockpit. The aircraft has to be airworthy, which is the duty of the technicians in cooperation with the pilots. After de-icing of the wings, performed by the ground personnel, the pilots are informed. GroundGround PilotPilot ATCATC
ATC clearanceATC request
Pushback request Pushback clearance
De-ice
Startup clearanceStartup request
Pushback
Aircraft equipment
Fuel receipt
Refuelling
Com
Com
Com
Com
Com
Com
Figure 1. In order to prepare the aircraft for safe flight the pilots communicate with the ATC and the ground personnel.
13
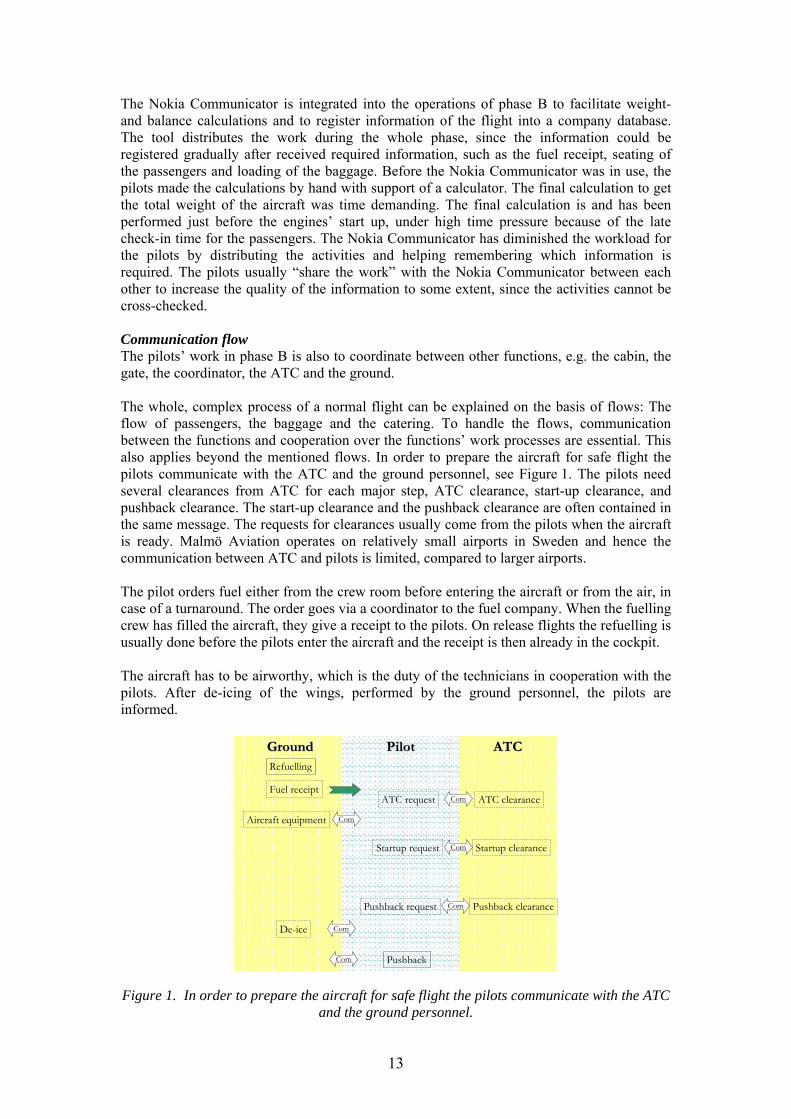
Number of passengers (PAX) and seating are required for weight and balance calculations (W/B) of the aircraft (Figure 2). The pilots also have the responsibility to verify the number of passengers on the aircraft with the number who passed the gate. The gate counts passengers that pass the gate and cabin counts the passengers on the aircraft. The communication with the gate goes via the radio, while the communication with the cabin goes via the cockpit door. If e.g. a passenger is missing, the cabin has to recount the passengers and the pilots need to reconfirm the number with the gate.
GateGate
no of PAX
CabinCabin PilotPilot
Security Checkcompleted
Boarding start
Boarding complete
no of PAX
W/B PAX
Com
Com
Com
Verification no of PAX
PAX
Com
Com
Com
Com
Seating Com
Com
Figure 2. The figure shows communication between pilots, cabin and gate, where the broken squares are given information. The arrows in the circle show further communication when,
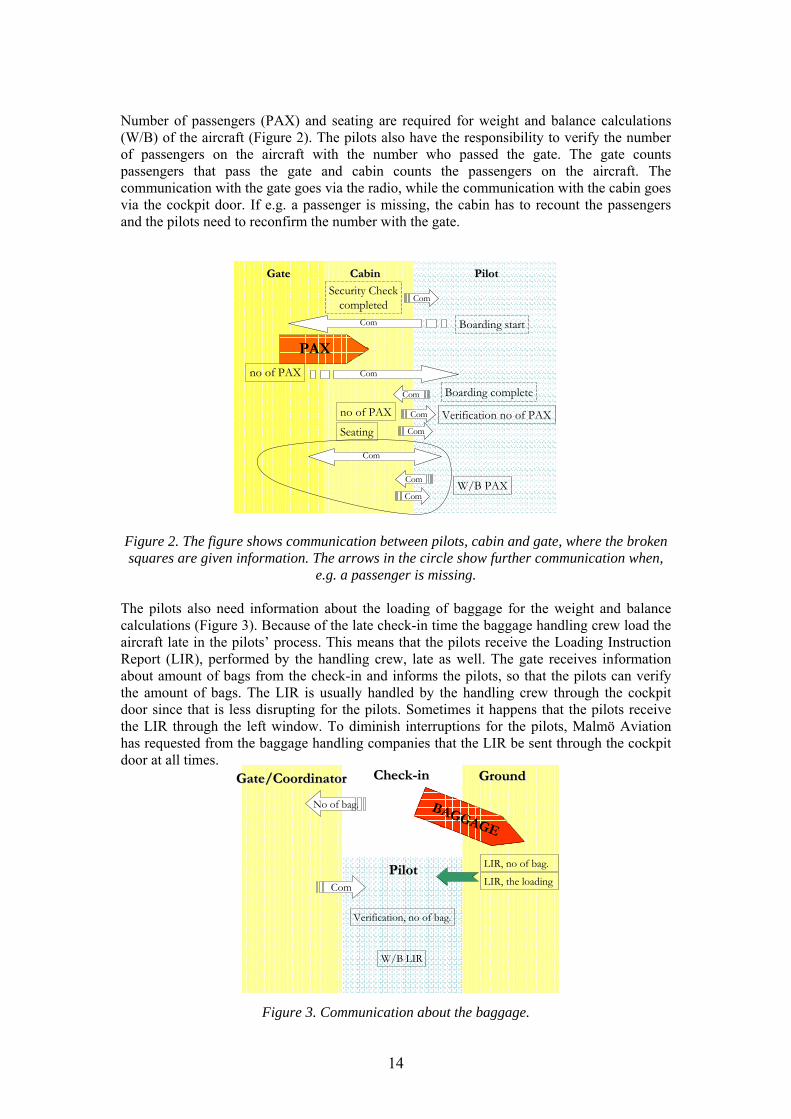
e.g. a passenger is missing. The pilots also need information about the loading of baggage for the weight and balance calculations (Figure 3). Because of the late check-in time the baggage handling crew load the aircraft late in the pilots’ process. This means that the pilots receive the Loading Instruction Report (LIR), performed by the handling crew, late as well. The gate receives information about amount of bags from the check-in and informs the pilots, so that the pilots can verify the amount of bags. The LIR is usually handled by the handling crew through the cockpit door since that is less disrupting for the pilots. Sometimes it happens that the pilots receive the LIR through the left window. To diminish interruptions for the pilots, Malmö Aviation has requested from the baggage handling companies that the LIR be sent through the cockpit door at all times.
CheckCheck--inin
LIR, no of bag.
Gate/Gate/CoordinatorCoordinator
PilotPilot
GroundGround
W/B LIR
Com
No of bag. BAGGAGE
Verification, no of bag.
LIR, the loading
Figure 3. Communication about the baggage.
14
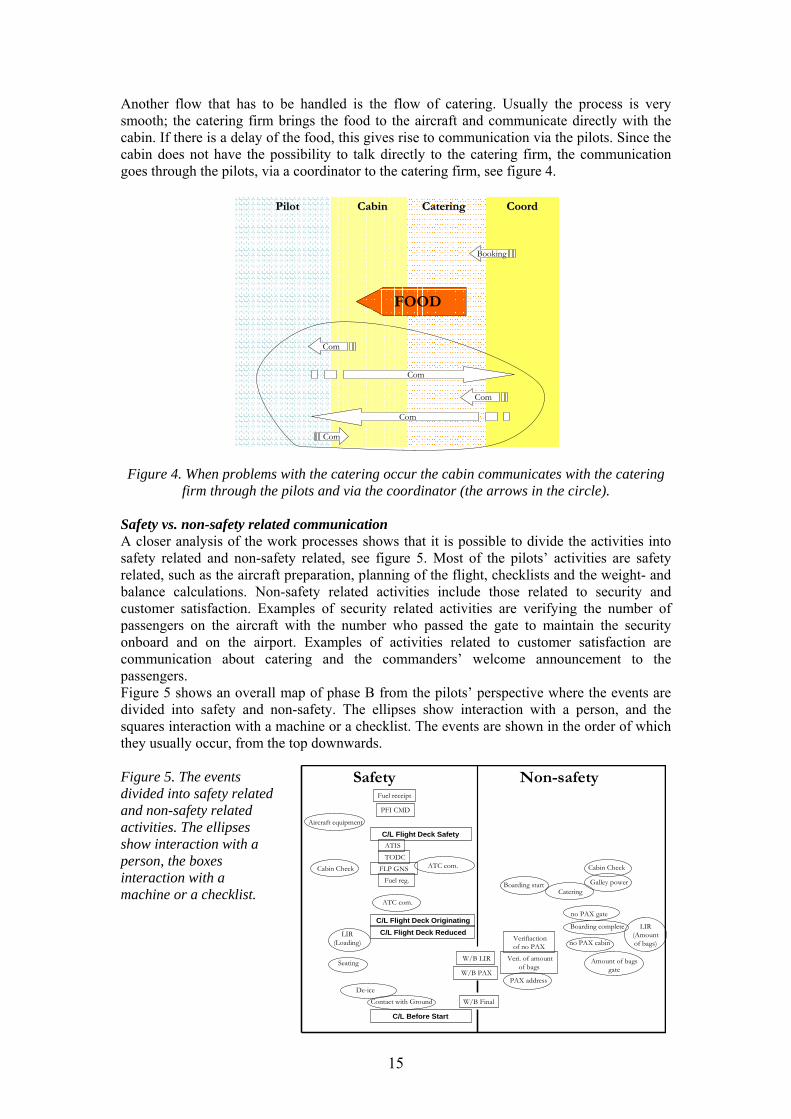
Another flow that has to be handled is the flow of catering. Usually the process is very smooth; the catering firm brings the food to the aircraft and communicate directly with the cabin. If there is a delay of the food, this gives rise to communication via the pilots. Since the cabin does not have the possibility to talk directly to the catering firm, the communication goes through the pilots, via a coordinator to the catering firm, see figure 4.
FOOD
CoordCoordPilotPilot CateringCateringCabinCabin
Com
Booking
Com
Com
Com
Com
Figure 4. When problems with the catering occur the cabin communicates with the catering firm through the pilots and via the coordinator (the arrows in the circle).
Safety vs. non-safety related communication A closer analysis of the work processes shows that it is possible to divide the activities into safety related and non-safety related, see figure 5. Most of the pilots’ activities are safety related, such as the aircraft preparation, planning of the flight, checklists and the weight- and balance calculations. Non-safety related activities include those related to security and customer satisfaction. Examples of security related activities are verifying the number of passengers on the aircraft with the number who passed the gate to maintain the security onboard and on the airport. Examples of activities related to customer satisfaction are communication about catering and the commanders’ welcome announcement to the passengers. Figure 5 shows an overall map of phase B from the pilots’ perspective where the events are divided into safety and non-safety. The ellipses show interaction with a person, and the squares interaction with a machine or a checklist. The events are shown in the order of which they usually occur, from the top downwards.
PFI CMD
C/L Flight Deck SafetyATIS
FLP GNS
TODC
Galley powerBoarding start
C/L Flight Deck OriginatingC/L Flight Deck Reduced
W/B LIR
W/B PAXPAX address
W/B FinalContact with Ground
C/L Before Start
LIR(Loading)
ATC com.
ATC com.
Cabin Check
no PAX gate
Boarding complete
no PAX cabin
Amount of bagsgate
Fuel receipt
Fuel reg.
Safety Non-safety
LIR(Amountof bags)
Seating
Verifiactionof no PAX
Veri. of amountof bags
Cabin Check
De-ice
Catering
Aircraft equipment
Figure 5. The events divided into safety related and non-safety related activities. The ellipses show interaction with a person, the boxes interaction with a machine or a checklist.
15
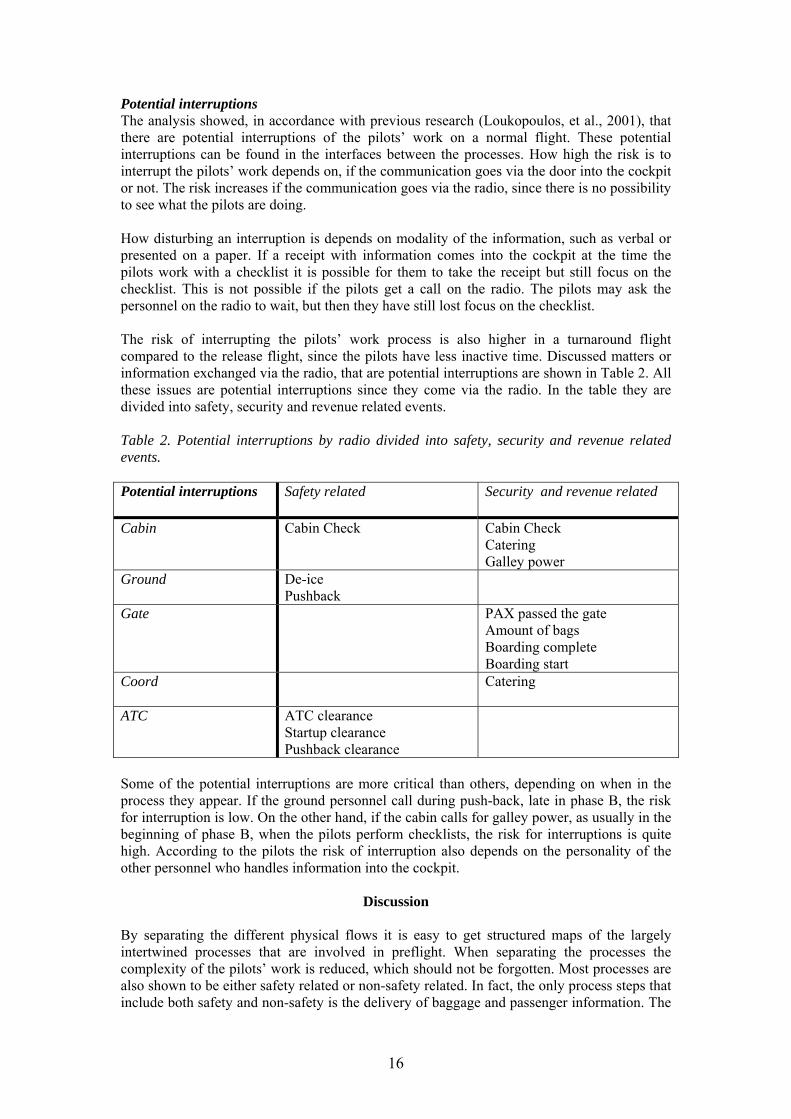
Potential interruptions The analysis showed, in accordance with previous research (Loukopoulos, et al., 2001), that there are potential interruptions of the pilots’ work on a normal flight. These potential interruptions can be found in the interfaces between the processes. How high the risk is to interrupt the pilots’ work depends on, if the communication goes via the door into the cockpit or not. The risk increases if the communication goes via the radio, since there is no possibility to see what the pilots are doing. How disturbing an interruption is depends on modality of the information, such as verbal or presented on a paper. If a receipt with information comes into the cockpit at the time the pilots work with a checklist it is possible for them to take the receipt but still focus on the checklist. This is not possible if the pilots get a call on the radio. The pilots may ask the personnel on the radio to wait, but then they have still lost focus on the checklist. The risk of interrupting the pilots’ work process is also higher in a turnaround flight compared to the release flight, since the pilots have less inactive time. Discussed matters or information exchanged via the radio, that are potential interruptions are shown in Table 2. All these issues are potential interruptions since they come via the radio. In the table they are divided into safety, security and revenue related events. Table 2. Potential interruptions by radio divided into safety, security and revenue related events. Potential interruptions
Safety related Security and revenue related
Cabin Cabin Check
Cabin Check Catering Galley power
Ground De-ice Pushback
Gate PAX passed the gate Amount of bags Boarding complete Boarding start
Coord
Catering
ATC ATC clearance Startup clearance Pushback clearance
Some of the potential interruptions are more critical than others, depending on when in the process they appear. If the ground personnel call during push-back, late in phase B, the risk for interruption is low. On the other hand, if the cabin calls for galley power, as usually in the beginning of phase B, when the pilots perform checklists, the risk for interruptions is quite high. According to the pilots the risk of interruption also depends on the personality of the other personnel who handles information into the cockpit.
Discussion By separating the different physical flows it is easy to get structured maps of the largely intertwined processes that are involved in preflight. When separating the processes the complexity of the pilots’ work is reduced, which should not be forgotten. Most processes are also shown to be either safety related or non-safety related. In fact, the only process steps that include both safety and non-safety is the delivery of baggage and passenger information. The
16
non-safety related part is connected to the amount of baggage and passengers located in the aircraft in relation to how many are recorded from the terminal building. The safety related information regards how the baggage and passengers are positioned inside the aircraft, to ensure correct trim of the rudders. As mentioned earlier, much of the information that goes through the cockpit is not related directly to safety. The analysis show that while the passenger seating information (safety) is not verified by the pilot i.e. compared to a second independent source, the number of passengers (non-safety) actually is. This information also comes via radio from the gate, which often constitute a greater potential interruption than information from the cockpit door. Hypothetically that information could be redirected to the cabin crew to alleviate pilot workload, which would constitute a higher degree of autonomy. However, the timing of some security and revenue events may have impact on safety related issues. Typically, passengers having boarded the wrong aircraft may create delays that the pilots must know in order to coordinate proper runway slots with the ATC. Such coordination could be overcome by sharing the same frequency so that any information is readily available for the pilots. By delegating the responsibility of non-safety related communication to the cabin crew, much pilot communication via radio could be eliminated. As shown here and elsewhere (e.g. Damos & Tabachnick, 2001) radio communication has a tendency to be disruptive to other tasks. The main issue with the hypothesised scenario would be to empower the cabin crew with a radio transceiver for communication with e.g. the catering company, of course accompanied by proper procedures to avoid confusions. The method of using jump seat observations allowed for a good integrity of data collection regarding occurrence of events. However, some information may have been un-noted because of lack of procedural knowledge on behalf of the observers. Typically, ATC clearances were duly noted but the exact contents were not. This was counteracted by post-hoc validation with company representatives. To produce more accurate data collection better observer training or audio recording for post-observation analysis is recommended. Interviews with the pilots also increase the depth of the analysis.
Acknowledgment This study was enabled by the director of flight operations at Malmö Aviation, Johan Westin, who allowed unlimited data collection, and the chief pilot Torgny Brännstam. We thank the crew and personnel at Malmö Aviation who have all been most helpful and friendly. The study was supported by the integrated project, HILAS (Human Integration into the Lifecycle of Aviation Systems) of the European 6th framework program, under supervision of Prof. Lena Mårtensson.
References Damos, D. L. & Tabachnick, B. G. (2001). Cockpit task prioritization: Jumpseat
observations (Report). Damos Recearch Associates Damos, D. L. & Tabachnick, B. G. (2001). The effect of interruptions on flight crew
performance: ASRS reports (Report). Los Angeles: Damos Recearch Associates Diez, M., Boehm-Davis, D. A. & Holt, R. W. (2002). Model-based predictions of interrupted
checklists. In Proceedings of the 46th Annual Meeting of the Human Factors and Ergonomics Society. Santa Monica, CA
Dismukes, K. R., Loukopoulos, L. D. & Jobe, K. K. (2001). The challenges of managing concurrent and deferred tasks. In Proceedings of the 11th International Symposium on Aviation Psychology. Columbus, OH
17

Field, G. & Spence, R. (1994). Now, where was I? New Zealand Journal of Computing, 5, 1, 35-43.
Latorella, K. A. (1996). Investigating interruptions: an example from the flightdeck. In Proceedings of the Human Factors and Ergonomics Society 40th annual meeting. 249-253.
Latorella, K. A. (1999). Investigating Interruptions: Inplications for Flightdeck Performance (Report NASA/TM-1999-209707). Hampton, VA: NASA Langley Research Center
Loukopoulos, L. D., Dismukes, K. R. & Barshi, I. (2001). Cockpit interruptions and distractions: a line observation study. In Proceedings of the 11th International Symposium on Aviation Psychology. Columbus, OH
Loukopoulos, L. D., Dismukes, K. R. & Barshi, I. (2003). Concurrent task demands in the cockpit: challenges and vulnerabilities in routine flight operations. In Proceedings of the 12th International Symposium on Aviation Psychology. Dayton, OH
18
Crisis management: What is required – How to design
Gunnar Dahlbäck, Dan Lindholm & Kjell Holmström
Rote Consulting AB, Sweden
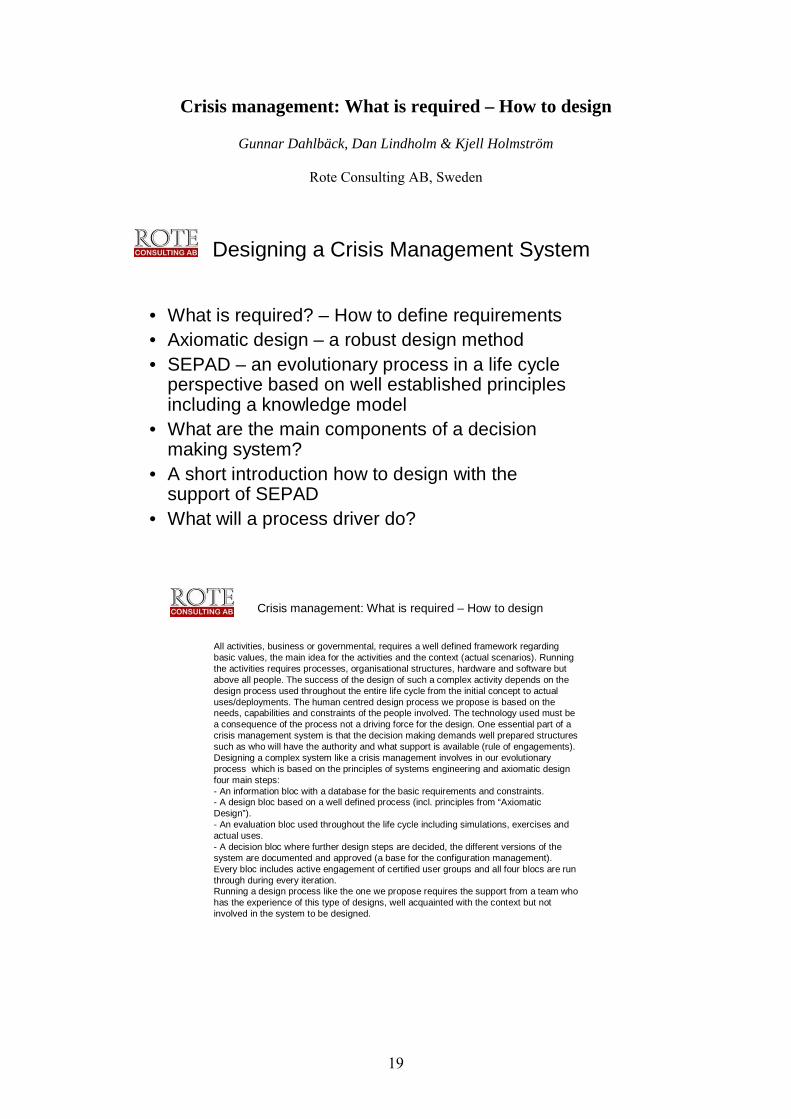
Designing a Crisis Management System
• What is required? – How to define requirements• Axiomatic design – a robust design method• SEPAD – an evolutionary process in a life cycle
perspective based on well established principlesincluding a knowledge model
• What are the main components of a decisionmaking system?
• A short introduction how to design with the support of SEPAD
• What will a process driver do?
Crisis management: What is required – How to design
All activities, business or governmental, requires a well defined framework regarding basic values, the main idea for the activities and the context (actual scenarios). Running the activities requires processes, organisational structures, hardware and software but above all people. The success of the design of such a complex activity depends on the design process used throughout the entire life cycle from the initial concept to actual uses/deployments. The human centred design process we propose is based on the needs, capabilities and constraints of the people involved. The technology used must be a consequence of the process not a driving force for the design. One essential part of a crisis management system is that the decision making demands well prepared structures such as who will have the authority and what support is available (rule of engagements).Designing a complex system like a crisis management involves in our evolutionary process which is based on the principles of systems engineering and axiomatic design four main steps: - An information bloc with a database for the basic requirements and constraints.- A design bloc based on a well defined process (incl. principles from “Axiomatic Design”). - An evaluation bloc used throughout the life cycle including simulations, exercises and actual uses.- A decision bloc where further design steps are decided, the different versions of the system are documented and approved (a base for the configuration management). Every bloc includes active engagement of certified user groups and all four blocs are run through during every iteration. Running a design process like the one we propose requires the support from a team who has the experience of this type of designs, well acquainted with the context but not involved in the system to be designed.
19
What is required?
INFORMATIONDOMAIN
Customer needsCustomer needs
ExpectationsExpectations
User requirementsUser requirements
EconomyLaws Environmentalrestric.Schedules
EconomyLaws Environmentalrestric.Schedules
FunctionalRequir.+Constraints
FunctionalRequir.+Constraints
Corporate strategiesCorporate strategies
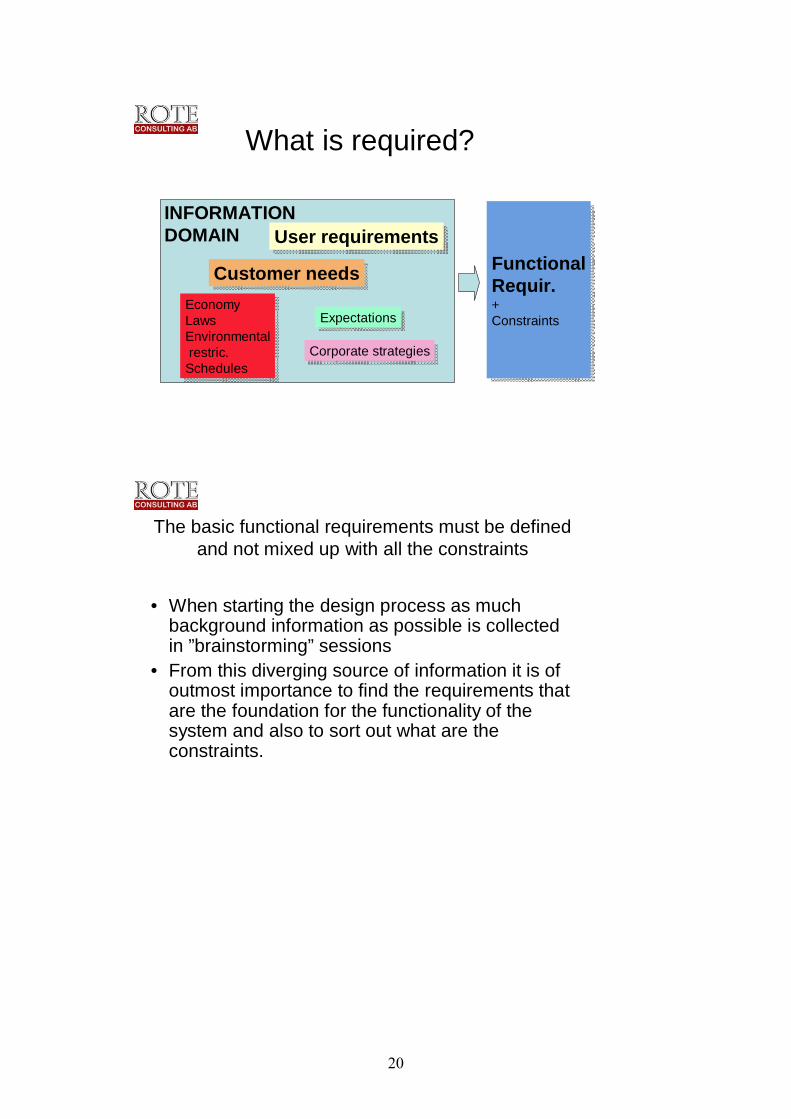
The basic functional requirements must be definedand not mixed up with all the constraints
• When starting the design process as muchbackground information as possible is collectedin ”brainstorming” sessions
• From this diverging source of information it is of outmost importance to find the requirements that are the foundation for the functionality of the system and also to sort out what are the constraints.
20
What is required for safe breathing
User requirement:No toxic gas in the mask
Improving the sealIs a design solution
Design solution:Avoid inward leakage with slightoverpressure in the mask
A lot of negative effects
Functional requirement?
Improved sealor
Breath clean air
Yes, then we can find severaldesign solutions and
choose the best one
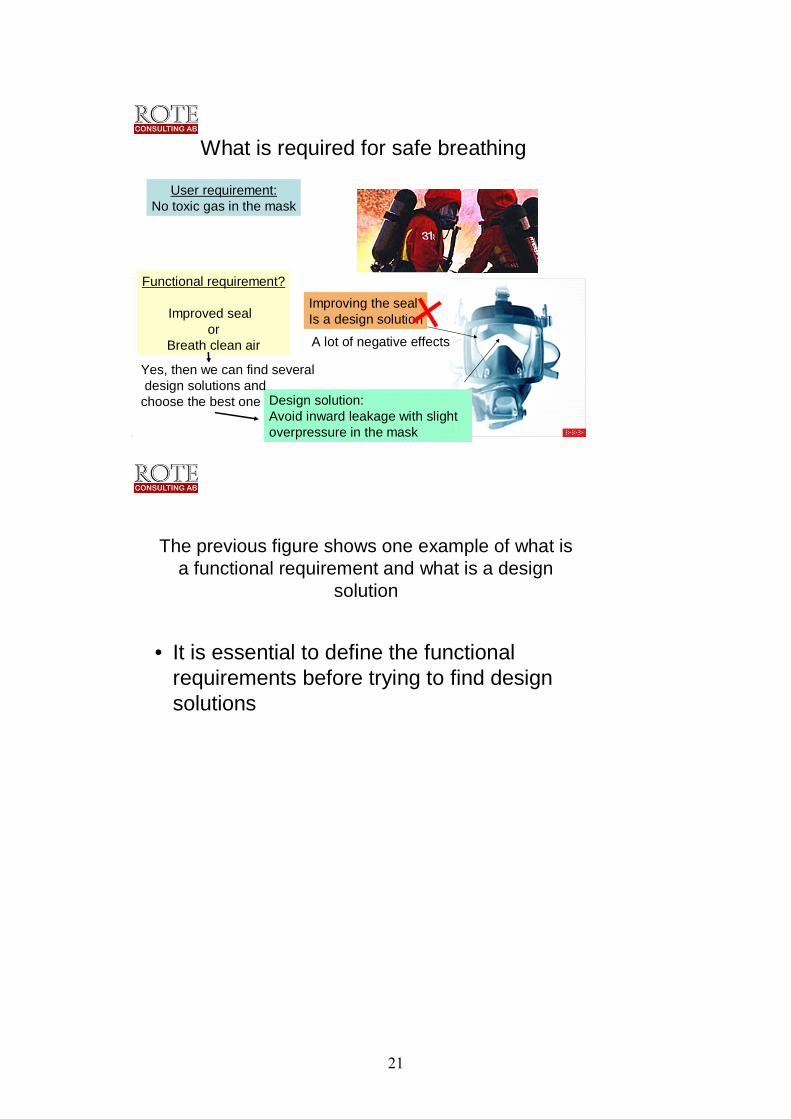
The previous figure shows one example of what is a functional requirement and what is a design
solution
• It is essential to define the functionalrequirements before trying to find design solutions
21
Maintain the independence of FRs: In an acceptable design, the DPsand the FRs are related in such a way that a specific DP can be adjusted to satisfy itscorresponding FR without affectingother FRs.
Axiom 2The Information Axiom
Axiom 1The Independence Axiom
Minimize the information content: Among alternative designs whichsatisfy Axiom 1, the best has the minimum information content whichmeans the maximum probability of success.
Axiomatic Design
Axiomatic design
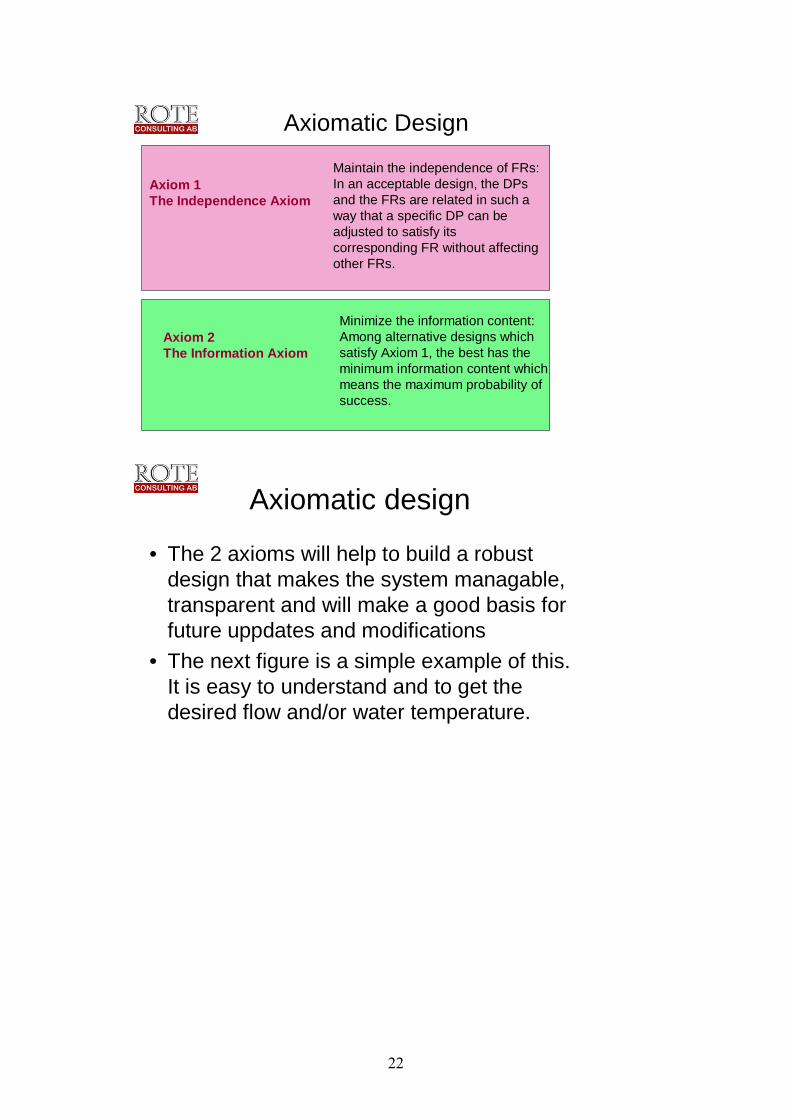
• The 2 axioms will help to build a robust design that makes the system managable, transparent and will make a good basis for future uppdates and modifications
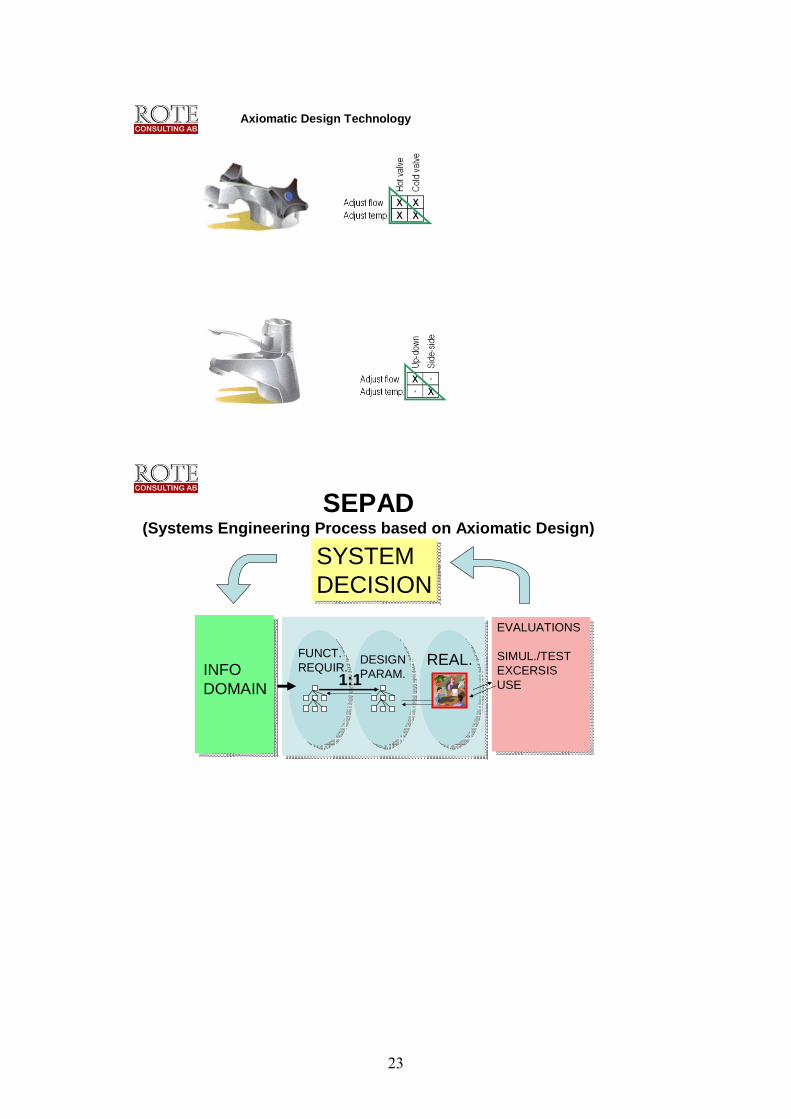
• The next figure is a simple example of this. It is easy to understand and to get the desired flow and/or water temperature.
22
Axiomatic Design Technology
SEPAD(Systems Engineering Process based on Axiomatic Design)
EVALUATIONS
SIMUL./TESTEXCERSISUSE
EVALUATIONS
SIMUL./TESTEXCERSISUSE
DESIGNPARAM.
DESIGNPARAM.
REAL.REAL.INFO DOMAIN 1:1
FUNCT.REQUIR.
SYSTEMDECISIONSYSTEMDECISION
23
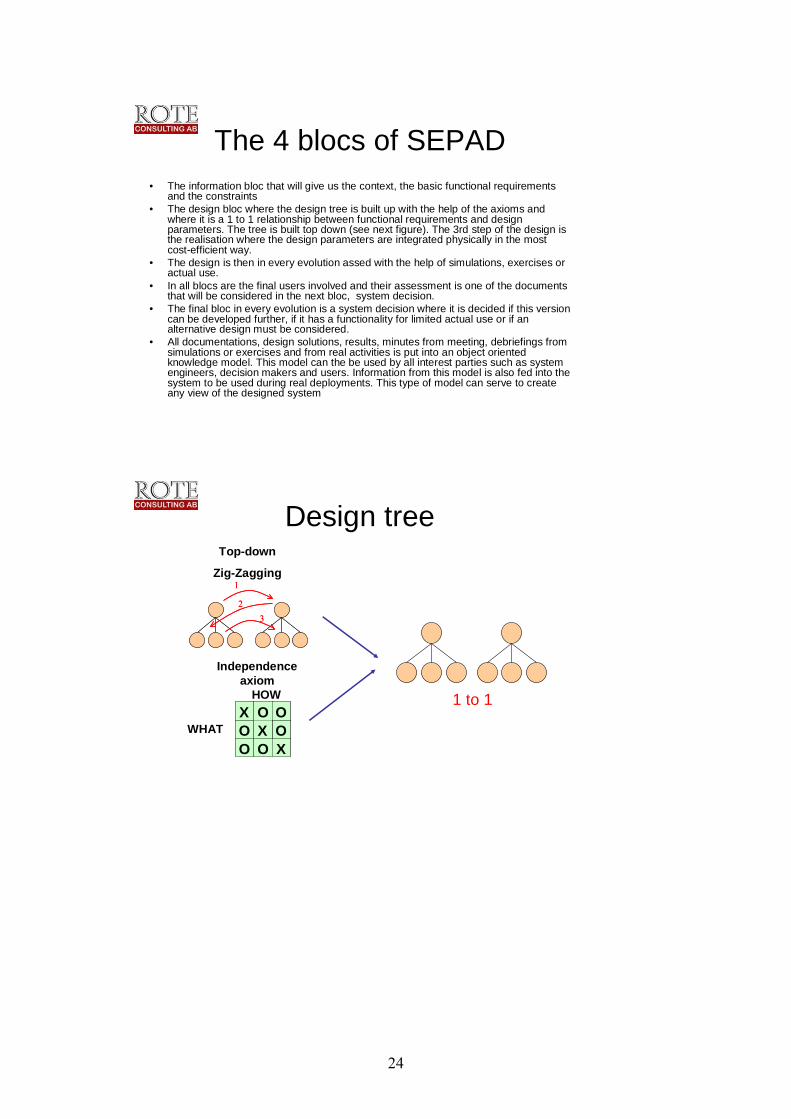
The 4 blocs of SEPAD• The information bloc that will give us the context, the basic functional requirements
and the constraints• The design bloc where the design tree is built up with the help of the axioms and
where it is a 1 to 1 relationship between functional requirements and design parameters. The tree is built top down (see next figure). The 3rd step of the design is the realisation where the design parameters are integrated physically in the most cost-efficient way.
• The design is then in every evolution assed with the help of simulations, exercises or actual use.
• In all blocs are the final users involved and their assessment is one of the documents that will be considered in the next bloc, system decision.
• The final bloc in every evolution is a system decision where it is decided if this version can be developed further, if it has a functionality for limited actual use or if an alternative design must be considered.
• All documentations, design solutions, results, minutes from meeting, debriefings from simulations or exercises and from real activities is put into an object oriented knowledge model. This model can the be used by all interest parties such as system engineers, decision makers and users. Information from this model is also fed into the system to be used during real deployments. This type of model can serve to create any view of the designed system
Design tree
1 to 1
1
23
1
23
Top-down
Zig-Zagging
Independenceaxiom
O OO
O OO
XX
X
O OO
O OO
XX
XWHAT
HOW
24
25
26
TECHN.
ORGANIS. PROC.
ACT
DECIDE
OBSERVE
ORIENT
Core ValuesMission StatementVisionsStrategies
ContextScenariosTasks
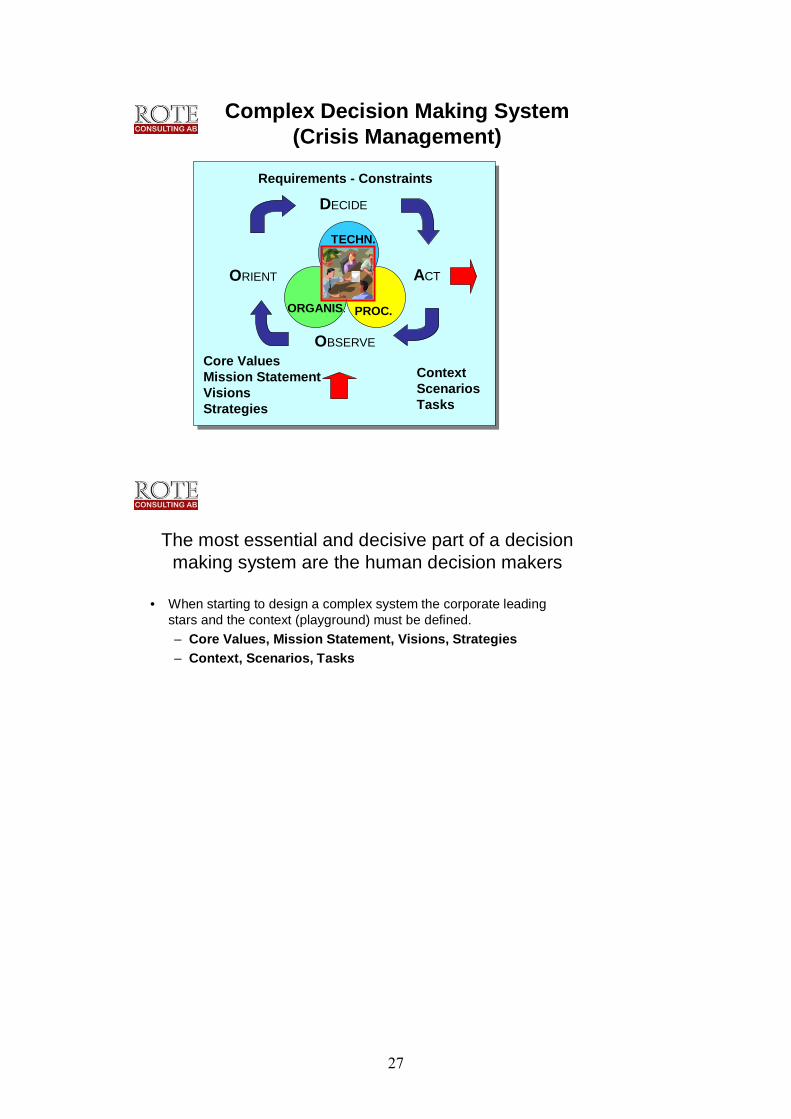
Complex Decision Making System(Crisis Management)
Requirements - Constraints
The most essential and decisive part of a decision making system are the human decision makers
• When starting to design a complex system the corporate leading stars and the context (playground) must be defined.– Core Values, Mission Statement, Visions, Strategies– Context, Scenarios, Tasks
27
Can SEPAD be used for designinga crisis management system?
The aims of SEPAD• Place the users and decision makers first, technology
shall be an answer to their requirements and constraints• Give an efficient knowledge model that can serve as
forceful decision support during actual use and give a traceable documentation with traceable system hierarchy.
• Lead to a robust system design• Support an evolutionary development throughout the
complete life cycle• Give a quality assured system via a quality assured
process
28
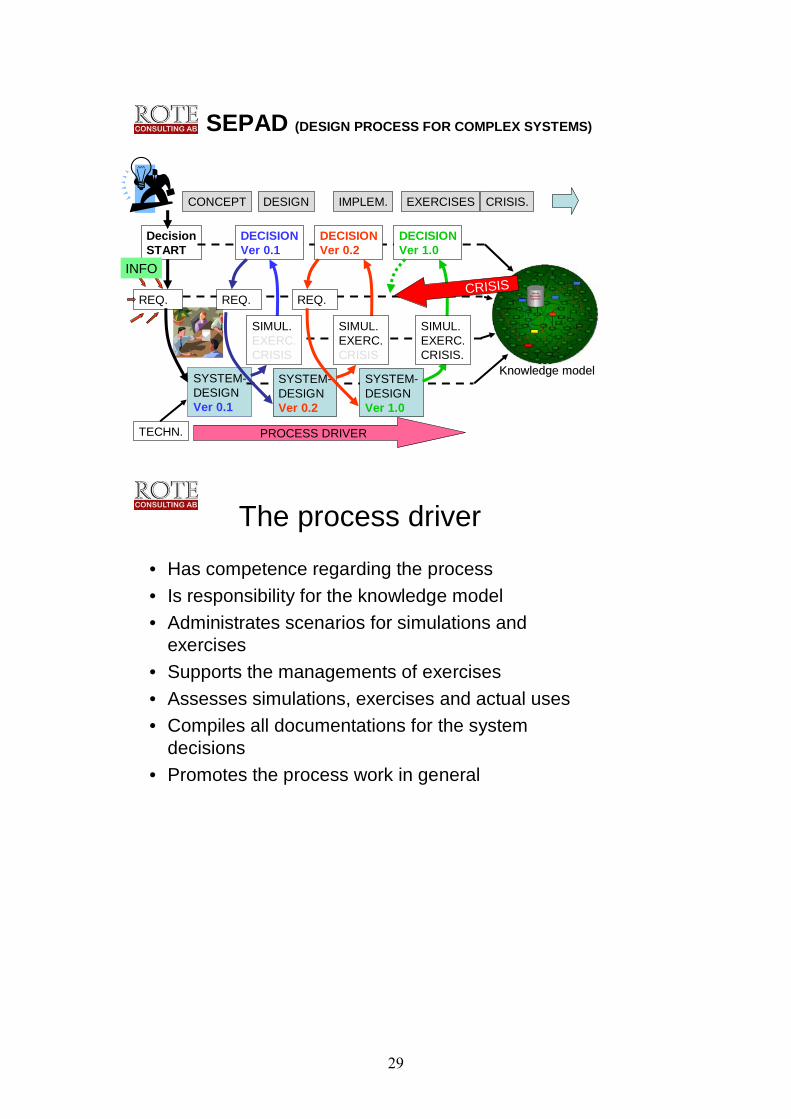
SEPAD (DESIGN PROCESS FOR COMPLEX SYSTEMS)
REQ.
SYSTEM-DESIGNVer 0.1
DECISIONVer 0.1
DECISIONVer 0.2
REQ. REQ.
DECISIONVer 1.0
IDÉ
SYSTEM-DESIGNVer 0.2
SYSTEM-DESIGNVer 1.0
DecisionSTART
PROCESS DRIVER
CONCEPT DESIGN IMPLEM. EXERCISES CRISIS.
SIMUL.EXERC.CRISIS
SIMUL.EXERC.CRISIS
SIMUL.EXERC.CRISIS.
TECHN.
INFO
KnowledgeKnowledge modelmodel
CRISIS
The process driver
• Has competence regarding the process• Is responsibility for the knowledge model• Administrates scenarios for simulations and
exercises• Supports the managements of exercises• Assesses simulations, exercises and actual uses• Compiles all documentations for the system
decisions• Promotes the process work in general
29
References• Stevens, R, Brook, P, Jackson, K, Arnold, S.”Systems Engineering: Coping with
Complexity” ISBN 0-13-095085-8, Prentice Hall Europe 1998.
• Suh, Nam P. ”Complexity: Theory and Applications, MIT-Pappalardo Series in Mechanical Engineering”, Oxford UP 2005.
• ISO/IEC 15288-System Life Cycle Processes ( www.15288.com )
• Booher, H.R (Ed). MANPRINT: An approach to Systems Integration. ISBN 0-442-00383-8, van Nostrand Reinhold, New York, 1990.
• Hollnagel, E., Woods, D.D..Joint Cognetive Systems: Foundations of CognetiveSystems Engineering. ISBN 0-8493-2821-7, Taylor&Francis, 2005.
• Lindholm, D. Towards Procedural Top-down Design: A Method Driven by Functional Requirements. Linköping Studies in Science and Technology, ThesisNo. 663. LiU-Tek-Lic-1997:64.
• Dahlbäck, G, Helander, M G, Rehn, T. User Centred Process for Optimising large Defence Systems. Presented at Qergo´99: International Conference on TQM and Human Factors, June 15-17, 1999
30
Training of collaborative skills with mid-fidelity simulation
Nicklas Dahlström
Lund University School of Aviation, Lund, Sweden
Abstract Management of group interaction is a central part of emergency handling, particularly when conflicting goals of safety and efficiency have to be balanced in the decision-making process. In situations of escalating risk breakdowns in management of group interaction can convert manageable situations into unrecoverable ones. However, successful emergency management depends not only on individual knowledge and decision-making skills, but also on collaborative skills acquired during earlier and similar circumstances. These skills can ensure the effective utilisation of the resources of the group. Simulation of situations of escalating risk can play an important role in acquiring such skills but require realistic scenarios and focus on the collaborative skills that are to be developed by the training. The increasing technological sophistication seen in simulators today does however not seem to be matched by systematic validation of the value of different levels of simulation on cognitive and collaborative skills, which means that educational resources can go underutilised or get misapplied. This paper will present and discuss a research project, carried out with student pilots at Lund University School of Aviation in co-operation with the University of Bamberg, which has tested the pedagogical value of mid-fidelity simulation on crew collaboration and decision-making skills. It will also discuss how different types of scenarios and different levels of simulation can be used to teach collaborative decision making skills with the aim of improving the cognitive and cooperative basis for emergency handling in escalating situations.
Introduction Accidents in both aviation and maritime transportation (as well as in other industries), such as Air Ontario at Dryden and Herald of Free Enterprise at Zeebrügge, have emphasised the importance of human factors in general and of information sharing, crew cooperation and effective group decision making in particular. Also, these accidents have emphasized the role of command and previous training of these “general” competencies as part of emergency management in a situation where events develop in a way that lead to an escalation of pressure and stress on the crew (Havold, 2000). Management of escalating situations, as in those accidents mentioned as well as in other situations with impact on the safety of air or maritime transport, poses an enormous challenge for crews. Since investigations of this type of accidents frequently have identified poor training of crew as a key contributing factor (Wang & Zhang, 2000) the development and validation of training that improves the management of escalating situations should be of great importance in making progress on safety. This goes especially for situations that take crews outside of their routine work (i.e. beyond rules, standard operational procedures and manuals). Research results from fire fighting (Klein, 1998) tell us that successful management of escalating and complex situations relies heavily on cognitive skills of the individuals involved as well as teamwork skills of the group. Among the cognitive processes that play an important role here are information processing, judgement and decision making and among the teamwork skills are communication, group interaction and leadership (Dörner, 1996; Strohschneider & Gerdes, 2004). Despite their criticality, opportunities to practise these skills
31
are often limited. The continuous development of the capabilities of high-fidelity simulation has greatly improved the return on training investment with respect to technical handling of aircraft and ships. Normal handling of aircraft and ships in various phases of transport as well as execution of standardised emergency routines can now be trained effectively in modern simulators. Also, modern technology in cockpits and on ship-bridges, which in turn present new error opportunities and routes to breakdown, can be introduced and practised with these advanced high-fidelity simulators (Lee & Sandquist, 2000; Lutzhöft & Dekker, 2002). However, the development of high-fidelity simulation has not necessarily brought with it improved opportunities for learning cognitive and coordinative skills. It is questionable if there is an empirical basis for assessing the value of various levels of fidelity of aircraft or ship-bridge simulation on the teaching of these kinds of skills. Also, what counts as relevant scenarios in which such skills could be practiced seems to be based more on operator experience than on systematic research. After the grounding of the Green Lily the Marine Accident Investigation Branch (MAIB) report recommended that the Maritime Coastguard Agency (MCA) should commission a research study into how bridge and engine room simulators can best be used for bridge and engine room resource management training that includes escalating emergencies and increasing levels of stress (Maritime Coastguard Agency, 2003). This study could be viewed as a response to the need to fill this gap in the knowledge of how to use different levels of simulation effectively for different types of training. Simulator fidelity and transfer of training The demand for continually increased levels of high-fidelity simulation could be viewed as a response to the need to practise other skills than those of handling an aircraft or ship. However, for crises and emergency training this could lead to a spiral of increased cost and lower availability of training simulators, since the investment required in high-fidelity simulation means that simulators becomes concentrated in a limited number of centres across the world. Despite the convincing visual effects, operator acceptance and face validity of high-fidelity simulation, there is no certainty whether or to what extent quality of training is improved or better transferred to the operational environment by higher levels of fidelity. Gradually the market for maritime simulators has become as important as the market for flight simulators (Cieutat, Gonzato & Guitton, 2001). This means that systematic validation of mid-fidelity ship-bridge simulation needs to be performed to avert the spiral of increased cost and decreased availability of simulators. Jackson (1993) claimed that “It is desirable that simulation fidelity and capability is sufficient to ensure the required transfer of training, but not to grossly exceed it since this would generally increase system cost with no return”. Such a validation could also be a crucial ingredient in the development of valuable and relevant scenarios that could help teach cognitive and collaborative skills, independent of the level of simulation fidelity. There are indications that the transfer of cognitive and procedural training to practice may in fact benefit from lower-fidelity simulations, as this removes “distracting” featurism from the training setting (Jackson, 1993). This is indicated by Caird (1996):
“…there is some evidence from flight simulation that higher levels of fidelity have little or no effect on skill transfer and reductions in fidelity actually improve training. Reductions of complexity may aid working memory and attention as skills and knowledge are initially acquired……Perhaps errors on the side of more fidelity reflect failed attempts to completely understand the underlying physical to cognitive mappings”
The connection between different levels of fidelity in training to different levels of learning seems to be underinvestigated and based mostly on a general faith in the effects of high
32
fidelity. Caird (1996) stated that “for decades, the naïve but persistent theory of fidelity has guided the fit of simulation systems to training.” The potential link between simulator level-of-fidelity and training return-on-investment needs to be researched and it might then turn out to be far more dependent on quality and relevance of the scenario and the exportability of the cognitive and coordinative skills acquired during the simulation than considered today. Strohschneider and Gerdes (2004) have shown that mid-fidelity simulations hold the potential of being very effective in teaching cognitive and team skills necessary for the successful management of emergencies. The tool used in this research was a mid-fidelity simulation of a ship, the M/S Antwerpen. The M/S Antwerpen simulation has previously been used in Germany for training of emergency management with hospital staff, fire-fighters and policemen. Validating the use of scenarios and mid-fidelity simulation, as well as developing these tools for emergency training of escalating situations, could represent an important step forward in training of crews’ cognitive and teamwork skills. Increased access to scenario-based mid-fidelity simulation also has the potential of creating a virtual experience for students as well as creating opportunities for experienced operators to understand how complex and escalating situations can be managed successfully.
Method Participants Of a total of 31 participants, 27 were students at Lund University School of Aviation in the later stage of their 20 month long training on the Airline Transport Pilot program and 4 were students on the Flight Instructor program. The M/S Antwerpen were performed in groups of 6 students, except for in the one case were the flight instructor students participated, in which there were 7 students in the group. The age of the participants ranged from 21 to 30 years. The M/S Antwerpen mid-fidelity simulation The M/S Antwerpen simulation represents a new type of mid-fidelity simulation that seems to be rarely used in crew training. It is a complex simulation that includes all the major technical aspects of a cruising ship as well as other conditions like sea, weather and other traffic. The crew and the 300 passengers are simulated individually. They are described in detail by gender, age, current position onboard and intended destination, physical status and degree of worry or fear and act independently according to the model and their individual assigned characteristics. The task given to the participants is to safely navigate the ship M/S Antwerpen through a stormy night in the Atlantic Ocean. The ship is positioned near the southern rim of the Grand Banks, 320 miles off Halifax, Nova Scotia. It is heading south and due to adverse conditions as well as the age of the ship the crew need to deal with different passenger related problems and several technical failures that in the end may result in a state of emergency. The participants play designed roles as captain, first officer, first engineer, chief steward, ship’s doctor, navigation officer and first machinist. The simulation program is run by two facilitators and most of the communication with the participants is provided by printouts that feed standard information, like the one that would be found on the ship’s bridge, as well as information about anything that would be outside of the normal and safe operation of the ship. The participants are not provided with any alternatives of possible actions. They have complete control of the ship and have to develop among themselves both overall strategies and instantaneous solutions to the situations that arise during the ship’s voyage. The M/S Antwerpen simulation program also records the inputs from the participants of the simulation.
33
The M/S Antwerpen simulation is in it self a part of a training program designed to develop the cognitive and cooperative skills of a group. The two or three-day program starts with an introduction and then continues with instructions, followed by the start of the first trip with the ship. This scenario is rarely completed entirely successful by a group and is followed by a debriefing session. After this lectures and discussions on effective group behaviours, especially related to emergency management, follows. The second scenario is designed to be more likely to end successfully and is also followed by a debriefing session. The tasks that a group has to solve during the M/S Antwerpen vary from trivial to avoidance of disaster. From the initial organisation of the group to the management of emergencies a group has the opportunity to exercise much of what they might have learned from theoretical and operational training previously. The M/S Antwerpen is not designed primarily to be used in a maritime setting. Even though the high level of detail in the simulation certainly makes this use highly relevant this was not the original intention with the simulation. Instead the intention is to practice individual and group skills regarding information management and decision making. These skills are central also to Crew Resource Management (CRM) as it is described by regulations and performed in the aviation industry today. In addition, it has long been proved that the principles of aviation Crew Resource Management seem to be universal to safety-critical industries and aviation, maritime, nuclear and chemical industry as well as health care have developed and shared knowledge together for many years now. Data collection Data from the two trips with the M/S Antwerpen with each group was collected in the form of log-files from the simulation itself, collection of all order-notes given from the participants to the facilitators and observations of the group made by a designated observer. The data from the sessions with M/S Antwerpen have not yet been systematically analysed and all results presented in this paper should be considered as preliminary as it is based predominantly on the observations made during the sessions.
Results Initially, the groups of participants were provided with general information on the ship M/S Antwerpen and the trip they were about to make as well as information on their respective roles. Already at this stage the groups experienced problems with handling the amount of information they were provided with in the limited time available for preparation. Although this is part of the design of the training, the early phase of the first trip is relatively non-eventful and does provide time for the group to continue to sort out which information is available in the group. However, as the first trip started and information started to come out of the printer the groups immediately became intensively engaged in the simulation. There were few attempts after this to regain an overview of the knowledge available in the group or on the structure of work in the groups. Attention was normally focused on the next sheet of paper coming out of the printer. In none of the groups goals or main priorities of the mission were explicitly stated or even openly discussed during the first session. There were few or no attempts to form a strategy for information sharing, division of responsibilities (beyond those explicitly stated for the role) or for how decisions should be made. The few attempts that were made were restricted to changing seats when realising that some roles had more in common than others and individual attempts by some participants to log their own activities or those transpiring in their department (primarily engineers logging maintenance and repair work on the technical systems of the ship). As the first session went along more intensive periods were followed by those with less intensity. This provided groups with the opportunity to reflect on what has occurred on the ship and how the events have been managed. It is also is an opportunity to consider on a more
34
general level how the work in the group is being performed and how it may be improved. These periods of idle time were however not used for any of this type of “process discussion”. When the intensity went down the participants normally relaxed, chatted lightly about private matters, told some jokes or simply sat seemingly passive waiting for something to happen. All of the groups participated lively, intensively and engaged in the simulation. One example of the extent of this was when a drunken passenger had been confined to a room which later could not be reached as it was blocked by fire. When it became clear to the group that this passenger could not be saved, the group expressed disappointment with their own performance and one group member was clearly upset. The intense participation could also be seen on the amount of discussions and proposals in the group. However, many of the discussions never came to any conclusion since they were interrupted by new information from the printer and many proposals accordingly never turned into action. In the absence of clear strategies regarding decision making all crew members seemed to be empowered to make their own decisions. Initial attempts to have someone read and distribute information and to make sure that the captain was aware of all decisions were not stable in the face of escalating intensity of the simulation. In every group there were examples of the same order coming from more than one crew member, the crew not being aware of orders already having been given and also of contradictory orders provided to the facilitators. The lack of systematic information sharing and the consequences of it became obvious in the last stages of the first trip. When the scenario escalated and placed increasing levels of pressure on the crew there were many signs of confusion in the groups, with the most obvious being that in some cases some participants were not even aware of that there was a fire engulfing the ship until late after it had started. Also, in one group the captain and the chief steward only late in a discussion realised that they were talking about different ends of the ship when they were discussing evacuation of passengers. As the session entered its final stages signs of the increasing pressure on the crew could also be observed as communication between crew members became increasingly difficult and could no longer sustain coordinated actions in the group. Orders became more unclear and difficult to interpret and seemed to be given without coordination from individuals or sub-groups within the group. For all of the groups the first trip ended with loss of the ship and a majority of the passengers as fatal victims of the events. In preparation of the second trip with the M/S Antwerpen all of the five groups acted decidedly more proactive than before the first trip; goals were explicitly formulated, roles and duties as well as information connected to them were clarified, orders for various expected situations were prepared and different emergency scenarios were also discussed and prepared for. In addition all of the groups had organised their seating and information in log-files, on desks, whiteboard and walls to facilitate their tasks. Briefing routines had been decided on by all of the groups. For some of the groups the discipline to perform and actively participate in briefings started deteriorating already after the first briefing. As the escalation of events in the scenario increased individual group members seemed to be caught up in their own responsibilities and the emergence of yet another paper from the printer seemed to distract group members during the briefings. Even groups that with great engagement tried to maintain briefing discipline had problems and after about half of the session the briefings of all groups had lost their initial form and purpose. The briefings became more of a one-to-one briefing with the captain about their area of responsibility. More decisions were made in the second scenario and they were overall better coordinated than during the first scenario. The dramatic change of how information was managed in the
35
group (from piles of paper on a table to data on whiteboard, maps on the wall, log-files etc.) as well as the briefings seemed to keep the groups together which led to more effective use of competence and resources available for the group. Even as the groups in the second session were more prepared and motivated by the opportunity to improve their performance, use of idle time showed great variation between the groups. While some of the groups did use idle time to review actions and take proactive measures against anticipated risks others again fell back to a more relaxed behaviour. The difficulties with getting caught up in the unfolding of events were proven by the variation in process-oriented discussions. While discussion of how the work was being done was present in some of the groups it was still limited and for some groups there was practically no process discussion during the second scenario. The final results, as counted in fatal victims of events on the ship, of the groups did not necessarily mirror the improvements of performance but in the debriefing sessions after the second trip all groups expressed satisfaction with the improvement in their methods of managing the events. Also, all groups stated that they found the sessions to be important learning for their future role as airline pilots.
Discussion The results of the M/S Antwerpen indicates the usefulness of mid-fidelity simulation for training of generalised skills such as information sharing, group interaction and decision making. The observations made during the sessions also provide interesting insights in the individual and group actions in an escalating situation and proves that M/S Antwerpen can be used as a research tool to investigate the individual and group processes in action in this type of scenarios. In particular the face-validity, participant acceptance and appreciation of the value of M/S Antwerpen as training tool questions the need for the type of “photorealism “ required in aviation today by regulations, provided by simulator manufacturers and favoured by operators themselves. By removing the opportunity to focus on instrument readings and control settings the participants in the M/S Antwerpen sessions are put in a situation where their most useful tools are those of understanding the behaviour of themselves and their group. While effects of the improvements of information management in the groups could be argued to be unsurprising (since it is one of the main learning points after the first session) the lack of structure in information management in all of the groups was still surprising. In spite of confusion, lack of knowledge as well as uncoordinated and contradictory orders there were few or no attempts during the first sessions to discuss or change the way information was managed. The dominance of the issues being at hand for the moment seemed to effectively block any attempts to consider other strategies for handling of information in the group. Another interesting observation has been of the process oriented discussions. The lack of this even during the second scenario can be interpreted as a strong indicator of the difficulties for a group to break out of the minute to minute management of events and instead focus on how the work is being done and consider if can be organised more effectively. This seems to be a quality of group management of escalating situations that needs a considerable amount of training before it can be applied in situations of increasing stress. The M/S Antwerpen has also provided the observers of the processes in the groups with questions of generalised and specialised competence. In most operator professions training starts with performing the specific operation, although with simple and restricted tasks. The
36
student operator then continues to develop operational competence in parallel with acquiring knowledge deemed necessary for the operation. This creates a track to the future work role where generalised competence, such as that of decision making and group interaction is interwoven with the practise of skills in the operational frame. In other professions (such as engineering, medicine etc.) generalised competence is the starting point of the building of professional skills. Only later in the education and training specific procedures for performing and professional action become a part of the skills. How these different routes to competence that needs to be used under high stress might affect analysis and action in escalating situations is a question that will be considered in the further use of the M/S Antwerpen. Even at this initial stage the use of M/S Antwerpen for training of future pilots has proven valuable and the use of is as a tool for research on escalating situations has shown great promise. Methods of collecting and analysing the data from the sessions will still need to be developed and the content of the concept outside that of the simulator sessions needs to be developed and adapted. In parallel with this, investigation in the use of cases of different levels of fidelity for this type of training should provide a broader base for understanding the connection between simulation and learning than what is available today.
References Caird, J. K. (1996). “Persistent issues in the application of virtual environment systems to
training.” Proc. HICS’96: Third Annual Symposium on Human Interaction with Complex Systems. Los Alamitos, CA: IEEE Computer Society Press, pp. 124-132.
Cieutat J. M., Gonzat J. P. & Guitton P. (2001). A new efficient wave model for maritime training simulator, Computer Graphics, Spring Conference 2001, 202-209. IEEE Comput. Soc.
Clemmensen T. (1994). Observation in maritime emergency management. DMI, EURET research programme, April 1994.
Dörner D. (1996). The logic of failure: recognizing and avoiding error in complex situations. New York: Metropolitan books.
Havold J. I. (2000). Culture in maritime safety. Maritime Policy & Management 27(1), 79-88. Jackson, P. (1993). “Applications of Virtual Reality in Training simulation”. In K. Warwick, J. Gray and D. Roberts (eds.) Virtual Reality in Engineering. London: The Institution of Electrical Engineers.
Klein, G. (1998). Sources of power: How people make decisions. Cambridge, MA: MIT Press.
Lee J. D. & Sanquist T. F. (2000). Augmenting the operator function model with cognitive operations: assessing the cognitive demands of technological innovation in ship navigation, Systems, Man and Cybernetics Part A, IEEE Transactions on 30(3), 273-285.
Lützhöft, M., & Dekker, S. W. A. (2002). On your watch: Automation on the bridge. Journal of Navigation, 55(1), 83-96.
Maritime Coastguard Agency (2003). Simulator Training for Handling Escalating Emergencies. Project RP 467 Final Report. Warsash Maritime Centre.
Offshore (1995). Innovative emergency training puts accent on thoughtful teamwork, Offshore 55 (3), 81-82.
Strohschneider S. & Gerdes J. (2004). M/S ANTWERPEN: Emergency management training for low risk environments, Simulation and Gaming 35 (3), 394-413
Wang J. & Zhang S. M. (2000). Management of human error in shipping operations, Professional Safety 45, 23-28.
37
State of the Art Analysis: An Overview of Advanced Driver Assistance Systems (ADAS) and
Possible Human Factors Issues
Anders Lindgren & Fang Chen Department of Computer Science and Engineering, Chalmers University of Technology,
Göteborg, Sweden
Abstract
Over the last decades safety has become a more and more important factor within the automotive industry. Results from safety tests like Euro NCAP (The European New Car Assessment Programme) provide customers with information about how safe different cars are when it comes to e.g. front and side impact collisions, so called Passive Safety. Today Active Safety Systems are designed to actively assist the driver in avoiding accidents before they occur. These systems are also known as Advanced Driver Assistance Systems (ADAS) and designed to help the driver by taking the pressure of him/her in standard situations. Thereby driving safety is increased even before critical situations arise (Siemens VDO, 2005). However, research shows that this kind of automation may increase the driver’s reaction time and situation awareness (Brookhuis et al., 2001). Results also show that ADAS has behavioural influences on the driver. As an example, studies on the Adaptive Cruise Control (ACC) system show that the system may influence the driver considering changes in speed, safety margins to the vehicle in front and frequency of lane change manoeuvres (Saad, 2004). This paper describes the basic ideas, functions, and possible human factors issues concerning both current ADAS and future concepts and will hopefully function as an essential introduction within the area of active systems.
Introduction Advanced Driver Assistance Systems are electronic systems that are designed to support the driver in his/her driving task. This support is ranging from simple information presentation through advanced assisting and even taking over the driver’s tasks in a critical situation. The common characteristic of these ADAS is that they (compared to passive safety systems) directly intervene with the driving task leaving it a delicate task for the automotive industry to integrate these systems in their vehicles, get the drivers’ to accept them and most importantly, having them improve traffic safety in the way they are intended to. Current ADAS The Advanced Driver Assistance Systems can be divided into eight different categories: Late-ral control, Longitudinal control & Avoidance, Reversing/Parking aids, Vision enhancements, Intelligent speed adaptation, Driver monitoring, Pre-crash systems and Road surface/ Low friction warning (AIDE, 2005). Lateral Control The ADAS associated with Lateral Control can be divided into the following subcategories: Lane Departure Warning (LDW) Wandering out of a traffic lane may result in loss of control or a collision with another vehicle and studies show that 55 percent of fatal crashes in the U.S. are caused by these unintended lane departures (Headley, 2005). The Lane Departure Warning system uses a camera to recognize lane markings and is activated when the driver is about to leave his/her own lane without using the blinker signal. The system protects the driver from accidental lane changes through a visual warning. At the same time, the driver
38
will experience a combination of steering wheel vibrations and a slight automatic correction to return the car to the original lane (Siemens VDO, 2005). The LDW is a symmetric function, meaning that it will have the same departure measures for both left and right lane departure and the steering support system can be overridden if needed (AIDE, 2005). Manufacturers hope that the LDW can help avoid dangerous situations caused by loss of alertness, cell-phone distraction and drowsiness both for the driven vehicle and the surrounding traffic environment (Toyota Active Safety, 2005). Blind Spot Detection In urban traffic critical situations may arise if vehicles in the so called blind spots are overlooked. Blind spots can be either on the side or behind the vehicle and through a camera integrated in the lateral rear window, the blind spot detection system provides the driver with information on whether there are any vehicles, cyclists or pedestrians in the area not visible to him/her (Siemens VDO, 2005). This information is often provided through a red lamp on the A pillar in the car and is generated depending on the difference in speed between the driver’s own vehicle and others. Manufacturers often use passive systems infrared sensor technology to detect objects in the blind spot area. The reason for this is that passive sensor technology is less expensive and that active sensors might interfere with one another and thereby not work as reliable (Wang et al., 2005; Raab et al. 2003). Passive sensors senses thermal energy from e.g. the tires of a moving vehicle or bodily heat from a pedestrian and this temperature is then compared to the temperature of a reference part of the road. If there is no vehicle or person in the blind spot, the two sensed temperatures will be almost identical and no warning is signalled (AIDE, 2005). Lane Change Assistance (LCA) The Lane Change Assistance works together with the blind spot detection together the systems gather data on the current lane that the car is driving in and the lane of the other vehicle. The system gives a warning if the driver returns to his or her original lane too soon after overtaking (Bishop, 2005). The warning light remains active as long as a vehicle remains in the critical zone. If a driver ignores the system warning and tries to change lanes (with possible risks of a collision) he or she will be warned by a vibration in the steering wheel (Siemens VDO, 2005). The thought benefits of these systems are that they will improve driving safety thanks to reliable information on vehicles in the blind spot zone and thereby give the driver a more relaxed driving experience, especially on open roads and freeways (Siemens VDO, 2005).
Longitudinal Control & Avoidance Systems Longitudinal Control and Avoidance systems can be divided into the following subcategories: Adaptive Cruise Control (ACC) Adaptive Cruise Control is a sensor based technology that automatically adjusts the vehicle’s speed to sustain a safe distance from the vehicle ahead in the same lane (Siemens VDO, 2005; BMW, 2005). The ACC is expected to ensure that there is enough distance to the car driving in front of you, even if that car unexpectedly lowers the speed. If e.g. the vehicle ahead slows down or accelerates, the system either makes the car decelerate or accelerate to maintain the optimal distance (Ford, 2005). The ACC also keep the wanted distance in traffic on several lanes and in curves and elevation changes. If the driving situation requires more deceleration than the ACC can provide, the system warns the driver acoustically and/or visually prompting him or her to actively use the brakes (Siemens VDO, 2005). If the driver uses the brakes, the ACC will be automatically deactivated. The system is manually turned on/off and visual feedback is provided to the driver when the system is in operation (AIDE, 2005). Upcoming generations of these systems will also use a vision-based lane detection to get more information of road curvature, cross-correlate this information with forward sensing data and thereby increase the confidence level when deciding which vehicles that are in-lane and relevant to track. There is also ongoing research investigating the possibility of integrating digital maps into the road/lane tracking algorithms to further increase the system performance (Bishop, 2005).
39
Traffic Jam Assist/Stop & Go As a complement to the ACC the traffic jam assist (sometimes called stop & go) is designed to help the driver in congested traffic conditions such as people’s daily drive to work. When the system is activated, it looks for a reference car ahead of the own vehicle (Siemens VDO, 2005). The system automatically keeps the distance to the vehicle in front at speeds below 70 km/h and makes the vehicle stop and start from standstill without the driver’s intervention. If the traffic lightens the system makes the vehicle hold 70 km/h until the driver makes a new intervention (AIDE, 2005). Curve Management The curve management system works together with the ACC and automatically reduces the speed if the vehicle is approaching a dangerous curve. The basic functionality of the ACC remains as the curve management is able to keep the selected speed and pre-defined distance depending on obstacles in front of the vehicle. The curve management system uses so called ADAS maps, developed for ADAS applications containing information on landmarks and road curvature. Together with the ACC and a localization system containing GPS antennas the system provides the longitudinal control with information on how to adapt the speed of the vehicle. According to AIDE (2005), this is done by:
Identifying the vehicle on the map Reconstructing the road profile on which the vehicle is currently travelling Calculating the curvature structure Computing and evaluating the optimal speed for travelling through a specific curve Computing the systems action distance Setting up the travelling speed
Forward Collision Warning (FCW) Collision warning systems are developed to avoid the risks of colliding with an obstacle ahead of the vehicle. The systems use a sensor technology (laser or microwave radars) that measures distance, angular position and relative speed of the obstacles. The collision warning system’s sensor is placed at the vehicle’s front and constantly scanning the road ahead. If an obstacle is found, the system decides whether or not the vehicle is in imminent danger of crashing. If there is a risk of crashing, the system provides the driver with a warning. Most of today’s systems are non-cooperative and independent of whether or not other vehicles on the road are equipped with collision warning appliances. Technologies with a so called vehicle to vehicle communication are under development but these systems require a rear end transponder to be able to exchange information on other vehicles presence, location and speed. Some of these collision warning systems also provide brake support in order to decrease the risk of a rear-end collision (AIDE, 2005). Electronic Brake Assist (BA) The BA system interprets a quick depression of the brake pedal from the driver as an emergency braking action and complements the applied braking power if the driver has not stepped hard enough on the brake pedal. The system is included in various ABS systems and optimizes the vehicle’s braking capacity in emergency braking situations and thereby also possibly shortens the stopping distance (Toyota Active Safety, 2005). Forward Crash Mitigation (FCM) The next step after forward collision warning and electronic brake assist is the forward crash mitigation. The FCM is a more conservative system that requires the estimated crash probability to be almost 100 percent before initiating braking. The system uses audible and sometimes tactile alerts to initially warn the driver of an upcoming crash situation. If the driver does not respond to these alerts the system uses maximum brake force at the last moment and simultaneously pretensioning the seatbelts to reduce the severity of the crash (Bishop, 2005).
40
Traffic Sign Recognition Using a camera together with the navigation system the traffic sign recognition system provides the driver with information about the current speed limit. The current speed is constantly presented to the driver through a status display in the head-up display. The camera recognizes signs on the side and above the road at a distance of 35 meters and compares this information with information from the navigation system to make sure that for example a dirty sign showing 30 km/h is not being mistaken for one showing 130 km/h. The idea with this system is to increase traffic safety and to keep drivers from speeding and thereby avoiding paying fines (Siemens VD0, 2005). Reversing/Parking Aids The aim of parking aid devices is to detect obstacles at low speeds. There are several names on the systems that actively support the driver when parking their car (Parking Assist System, Park Mate, Park Distance Control etc.). The idea and functionality of the systems is however very similar. They use sensors in the front and rear of the car to detect obstructions and notify the driver of objects that are close to the vehicle while parking (Toyota, 2005). These notifications often come in the form of an acoustic signal that increases/decreases depending on the distance to the obstacle. Most of the systems also provide the driver with acoustic and visual driving tips on how to manoeuvre the car into the parking spot. Distances to the curb and other vehicles are monitored on a screen and the system recognizes objects that appear unexpectedly such as pedestrians and provide the driver with an acoustic warning signal. Some systems also check for potential parking spaces and measure if the found space is large enough. Once an appropriate space is found, the system signals the driver to stop through an acoustic and visual signal (Siemens VDO, 2005). Backup Monitor The backup monitor consists of a rear-facing camera in the back of the car that is activated when the transmission is put in reverse. An image of the area behind the vehicle is displayed on the navigation system screen providing the driver with an enhanced view of possible objects behind the vehicle (Toyota Safety Features, 2005). Vision Enhancement Systems Over the last years car manufacturers have been working with assistance systems supporting the driver in driving conditions with reduced visibility. There have been a number of different technological approaches in the design of these systems. Ultraviolet light headlamps make particular materials reflect the light but the system is limited as there are possible obstacles that may not be discovered. Other systems use near infrared illuminators and projects the road ahead on an image to the driver with the help of a head up display. Night Vision Driving at night-time can be demanding and therefore several car companies have developed support systems called night vision (Siemens VDO, 2005). These systems use cameras and near-infrared lights to flood the area in front of the vehicle. A camera on the dashboard then projects the image onto the lower front windshield. Another approach is the use of far infrared sensors that makes it possible for the driver to see clear images in complete darkness. The system uses a thermal map of the environment and projects the image to the driver on a head up display (AIDE, 2005). The night vision system is supposed to reduce the stress of after-hours driving considerably. (Toyota Coming Safety, 2005) and generate safer driving by improving the vision at night and in bad weather (Siemens VDO, 2005). Smart Headlamps The expression Smart Headlamps contains several new functions combined with the vehicles’ halogen and xenon light sources. This technology includes headlamps that are programmed to look around corners and automatically dim when oncoming traffic is detected and automatically height adjusting lights that compensate the aim of the headlamps when driving with heavy loads (Toyota Coming Safety, 2005). This type of adaptive front lighting also adjusts the illumination pattern depending on the vehicle’s speed. For instance, if the car is driven in low speed the light distribution is adjusted down
41
and outwards, while in high speed driving distributing the light longer and narrower for increased visibility at farther distances (Bishop, 2005). Driver Monitoring Systems Systems for Driver Monitoring observe the driver’s physiological status like for instance: drowsiness, level of attention, eye-movements, heart-rate and identifies risks that might appear because of abnormal statuses. Situations in which the driver’s alertness is weakened and the driving task cannot be maintained at a tolerable level of performance are included in the term “driver impairment”. These impairments could be consequences of e.g. stress, fatigue, alcohol or drug abuse, inattention or various diseases (AIDE, 2005). Driver Vigilance Monitoring The Driver Vigilance Monitoring system uses sensors that gives information about the vehicle’s lateral position, steering wheel position, driver behaviour, and eyelid movements and provides the driver with warning signals if e.g. the lateral position changes in an irrational pattern or eyelid movements lessen (AIDE, 2005). Pre-Crash Systems The function of a pre-crash system is to detect when an accident is unavoidable. The information given by the system can be used to pre-activate the on-board vehicle restrain systems like seat-belts and airbags (AIDE, 2005; Mercedes Benz, 2005). Smart Restraint Systems Smart Restraint Systems is one example of systems that detect pre-crash situations, provide advance warning of imminent crashes and deploy the appropriate airbags beforehand prior to the impact to achieve maximum protection for people travelling in the vehicle. Systems like PRE-SAFE sensor systems sense critical situations such as emergency braking or slipping through sub-systems like brake assist and traction control and thereafter activate precautionary measures to protect the occupants riding in the vehicle. Research shows that in two thirds of all accidents, there is enough time to deploy occupant protection measures between the critical situation developing and the accident itself. With these systems, if the accident does occur, the vehicle and occupants will be better prepared. Further, the systems are fully reversible so they can be restored to their original status if no accident occurs (Mercedes-Benz, 2005). As a further development step, vehicle inner space monitoring will adapt the airbag inflation to the current situation inside the car. If e.g. there is no person in the passenger seat, no airbag will inflate or only inflate partially depending on the position of the driver. Among manufacturers, new sensors (e.g. video sensors), and 3D reconstruction are currently developed for pre-crash sensing and this new technology is supposed to be used for exploring the possibility of weight sensing and capacitive sensors (AIDE, 2005). Rear End Collision Avoidance The Rear End Collision Avoidance is a system that senses the presence and speed of vehicles and other objects in the vehicle’s lane of travel. This system can be seen as an extension of the Adaptive Cruise Control with the advantage that this system uses not only longitudinal control sensors but also road departure and intelligent navigation sensors to have the capability of performing combined lateral control and braking actions. If the headway and/or time to collision are below a pre-programmed limit, the system either warns the driver, or if no action is taken, activates the brakes to avoid a rear end collision (AIDE, 2005). Rear-Collision Warning System The rear collision warning system alerts are designed to first warn the driver of an impending accident and then, if needed, activate the vehicle's safety belt pretensioners to optimally position the driver and thereby hopefully minimizing the risk of injury. The oncoming vehicle is alerted by a rear-mounted light strobe system with the purpose of avoiding an upcoming accident (Ford Advanced Telematics, 2005).
42
Road Surface/Low Friction Warning Systems Road Surface and Low Friction Warning systems use either vehicle sensors or fixed road sensors to measure the road surface and/or friction condition. The information is transmitted to the in-vehicle system that uses an audio or visual way of informing the driver. This information may also in the future be transmitted to traffic information centers that provide other road users and maintenance operators with this essential information (AIDE, 2005). Anti-Lock Braking System (ABS) The ABS is a system that is designed to keep the vehicle’s wheels from locking up during hard braking or normal braking on icy surfaces. The system uses individual wheel speed sensors to detect brake lock-up and then modulates brake pressure during hard braking to avoid wheel lock-up and help the driver retain steering control (Toyota Safety Technology, 2005). The system helps the driver avoid an accident by making it possible for him/her to remain control in an emergency-braking manoeuvre where the wheels would otherwise lock up and skid (Toyota Active Safety, 2005).
Electronic Brake Force Distribution (EBD) The EBD system is included in some ABS systems as it electronically distributes the hydraulic pressure of the brakes between the front and rear axles depending on driving conditions and vehicle load. The EBD monitors the load on the different axles and then uses the ABS controller to send more braking power to the axle with the greater load. This procedure ensures that the front and rear tires effectively share the braking loads under all conditions, resulting in better braking performance (Toyota Active Safety, 2005). Electronic Traction Control (TCS) The Electronic Traction Control is a system that automatically keeps the drive wheels from spinning during acceleration. A microprocessor is used to compare the rotational speed of the vehicle's wheels. When one of the wheels loses traction, the rotational speed of that wheel quickly rises compared to the other wheels. In case this happens, an electronic control unit makes the engine reduce its power output and/or apply brake power for that particular wheel. This helps the driver to keep control of the vehicle while accelerating on slippery surfaces and can also help sports cars maintain traction while accelerating on roads with rough tarmac (Toyota Active Safety, 2005). Vehicle Stability Control (VSC) The Vehicle Stability Control is a system that uses technology from ABS and Traction Control to help the driver maintain control of the vehicle during extreme turns and other emergency manoeuvres. A microprocessor is used to compare throttle position, rotational speed of the wheels and steering angle to decide if the vehicle has lost grip in e.g. a turn and begun to under-steer or over-steer. If this is the case, the microprocessor sends signals to the brakes and throttle e.g. increase brake power on one or several wheels and reduce engine output to help restore vehicle control and hopefully avoid an accident (Toyota Active Safety, 2005; Ford Accident Avoidance, 2005). Downhill Assist Control System (DAC) SUVs and other larger vehicles can be equipped with a downhill assist control system called DAC. The purpose of the system is to help maintain the vehicle’s speed at 3-7 km/h during downhill driving. The DAC is designed to assist engine braking and help maintaining the control of the vehicle in a straight position during descent on steep slopes or slippery surfaces. The DAC is deactivated automatically if the driver presses down the brake pedal or the DAC-button. In detail the system consists of active wheel speed sensors that determine the current road conditions. Together with an accelerator pedal angle sensor, a master cylinder pressure sensor, and the setting of a position switch, the DAC determines the targeted vehicle speed. When the vehicle accelerates during descent and thereby exceeds the predetermined speed, the DAC is activated, and the required brake hydraulic pressure for each wheel is calculated to slow down and meet the targeted speed (Toyota HAD-DAC, 2005).
43
Hill Start Assist Control (HAC) HAC is a system that uses the vehicle’s wheel speed sensors and brakes to keep it from rolling back or slipping sideways when starting from a stop on a hillside. The system is activated automatically when the driver shifts the transmission in any forward gear and the system verifies the driver’s intended vehicle direction from three factors; the present gearshift position, the moving direction of the wheels, and the speed of the wheels. When the system activates, the HAC measures the necessary brake force of each wheel to help prevent individual wheels from locking and thereby causing vehicle slippage (Toyota HAD-DAC, 2005) Tire Pressure Warning System The Tire Pressure Warning System uses special wheel speed sensors to measure wheel’s rotational speed relative to the other wheels. This allows the system to detect dangerously low air pressure in the tires. If there is a critical air pressure loss in one or several tires, the system notifies the driver and unnecessary tire wear can be prevented (Toyota Coming Safety, 2005). Future Technologies Many ADAS are already available on the market today but more and more advanced systems are under development and expected to reach the market in the near future. Honda Accord ADAS Just recently Honda presented an ADAS-system that automatically speeds up and slows down the vehicle as well as steers around bends. The system is not invented to replace the driver but all he/she has to do is to nudge the wheel gently every 10 seconds to keep the system active. The main advantage, according to the manufacturer, is that the system can make long journeys less tiring and prevent some accidents by reducing driver error. The car uses two main components, the ACC that scans ahead for other vehicles and the Lane Keep Assist System that watches the white road lines and controls the steering. Currently the system only works on motorways but the intention is to have it work also on smaller roads and in city traffic (Ananova, 2005) Intelligent Speed Adaptation The Intelligent Speed Adaptation (ISA) is expected to control the speed of the car based on either input by the driver (e.g. setting the wanted speed limit) or according to traffic signs. Speed control functions integrated with traffic control systems may be used in vehicles together with an infrastructure-based system, giving the car information on the current traffic situation. This information could be based on (AIDE, 2005):
Vehicle speed sensors located at traffic signs and lights. The vehicles navigation system, with stored speed limit information and car location
based on GPS. The system should the give the driver a warning to prevent speeding. If a warning is not enough, the system may activate a counter force in the accelerator pedal and even regulate the fuel and braking system to prevent speeding.
A regional centre that communicates data to cars within a certain area to facilitate navigation and adverse traffic and weather conditions.
By-Wire Controls Today, the traditional mechanical links between the driver and the vehicle’s steering, braking, and propulsion system is being replaced by drive-by-wire technology. The idea with this originally aviation industry technology is to replace the mechanical links with full computer interpretations of the driver’s control inputs. This technology could allow the vehicle to take full authority over speed and path in certain driving situations e.g. when a crash is imminent and hopefully avoid an accident from happening (Toyota Coming Safety, 2005). Intersection Collision Avoidance The intersection collision avoidance system provides the driver with a warning if there is a potential risk for a collision at an intersection. So far two different technologies have been used. The first consists of a camera placed on the side of the vehicle’s front that identifies vehicles about 20-25 meters away from the junction. The
44
second technology is based on a short range vehicle to vehicle communication. Since intersections are complex traffic situations AIDE (2005) recommends a cooperative vehicle-infrastructure solution sensing other vehicles on intersecting roads and possible traffic control violations. Questions on how to warn the driver are still open. Current prototypes projects the intersection image to the driver through an in-vehicle screen but research has shown that this is a far from optimal solution (AIDE, 2005). Pedestrian or Obstacle Detection Accidents involving vulnerable citizens like pedestrians and cyclists are very common. These systems are intended to detect these vulnerable citizens and warn the driver whenever an obstacle occurs in the predicted vehicle course. One way of achieving this may be to use vehicle sensors or infrastructure-based sensors that communicate with the vehicles. Another way could be to provide the pedestrians with some kind of bar-code for recognition and identification or to use an intelligent camera based system that learns from training-images of pedestrians and other objects and thereby manages to detect different classes of objects (AIDE, 2005). Railroad Crossing Collision Avoidance The railroad crossing collision system warns the driver when approaching a railroad crossing that has present or soon coming rail traffic the railroad. This system is initially meant for buses and trucks carrying dangerous cargo but extensions to other vehicles may be reality when it becomes cost effective (AIDE, 2005). Radar Braking The radar braking system uses microwave-based sensors wired to the cruise-control system. This makes it possible for the system to have the vehicle automatically lowering its speed when a slower car is travelling ahead in the same lane. An extension of this system is forward looking radars that help initiate braking when required. Some manufacturers already offer these extended systems as an option but they are limited as the brakes only reduce the vehicle’s speed to decrease a potential accident’s severity, not having the sufficient power to avoid a collision (Toyota Coming Safety, 2005). Roll Stability Control Sensors used in vehicles’ stability control systems can be used to more than just helping keep the vehicle travelling in the desired direction. An extension of these systems is the Roll Stability Control that uses algorithms to automatically apply the brakes if the driver begins a cornering manoeuvre that is not possible for the vehicle to complete. The system activates before the vehicle spins around or drifts wide by reducing speed and thereby helping the driver keep the vehicle steady in the appropriate lane and direction (Toyota Coming Safety, 2005). Perception of Vehicle Surroundings This system uses all of the vehicle’s sensor information to create a 360 degree model of the car’s immediate surrounding area. By using data to create a real-time representation of the surroundings, possible risks such as people and other vehicles in the danger area may be identified (Headley, 2005). Smart Highways/Autonomous Driving LDW, ACC and By-wire Controls are three key elements of future highway systems that strive for safer and more efficient point-to-point travel with minimal driver participation. These Smart Highways are long in the experimental stage and automatic guidance lanes could be reality and in select areas by the next decade (Toyota Coming Safety, 2005). Given to what research shows at the moment, a possible scenario for automated vehicle travelling would include lane operations with the following technologies used (Bishop, 2005 p.226):
• Surround sensing • Lane detection augmented by magnetic markers in road for severe winter areas. • “Drive-by-wire” technology for electronic actuation of throttle, brakes, and steering • Inter-vehicle communication
45
• Communication between vehicles and a traffic operations centre for flow management
• Operation on a dedicated lane Digital Maps and Satellite Positioning One way of making today’s ADAS more efficient could be the usage of onboard digital maps that combined with satellite positioning can work as a cooperative system to receive information from outside the vehicle. Automotive researchers have identified a number of active safety systems that could be improved by digital map data.
• Curve Warning • Smart Headlamps • Adaptive Cruise Control • Traffic Jam Assist/Stop & Go • Lane Change Assistant • Lane Departure Warning • Collision Warning • Autonomous Driving
The data from the digital maps could assist ADAS in several ways. Systems that use image processing can be complemented by a map data on where the road is “thought” to be and thereby improve lane detection and reduce false alarms. For radar systems, hills and valleys may cause problems with targets suddenly disappearing but with complementing map data the system can continue tracking the vehicle in front over e.g. the crest of a hill (Bishop, 2005). Driver Health Monitoring Health related functions embedded in the automotive telematics could be designed not only to help preventing serious accidents from happening when the driver becomes temporarily inattentive due to e.g. fatigue or drowsiness but also to create a personal bond between the car owner and the car (AIDE, 2005). Enhanced Night Vision/Night Eye Earlier in this paper the night vision system was presented. In the future, this system may be improved by implementing a pedestrian detection function that uses complex algorithms to examine video images and then generate a warning in the video image on the dashboard display. This improved system will make it possible for the driver to see pedestrians outside the headlight beam or concealed by the light of oncoming traffic (Siemens VDO, 2005). Night-Eye vision systems’ features a low-light colour camera system that warns the driver in case of possible threats that cannot be seen with the naked eye. Some manufacturers prefers to use black and white displays while others have the opinion that colour displays are more intuitive and easy to understand (Ford Advanced Telematics, 2005) Human Factors Issues Concerning ADAS Although the purpose of ADAS is to generate a positive effect on traffic safety, negative effects on e.g. driver behaviour have been found as well (Dragutinovic et al., 2005; Saad, 2004; Brookhuis et al., 2001; Kovordányi, 2005). One common aspect of all these systems is that they all (in some way) depend on the driver’s conditions and limitations. Below, possible human factors problems with different ADAS are presented to give an overview of the great amount of research that is required within this area of interest. System Warning Design One ubiquitous problem that confronts many system designers is the design of warnings that promote appropriate responses from the driver. A badly designed and overly sensitive system can increase driver’s workload and thereby decrease his/her situation awareness, comfort and
46
safety (Vahidi & Eskandarian 2003). As an example, inappropriate responses such as ignoring the collision warning signals and failing to break when essential or sharp braking manoeuvres when not necessary could jeopardize traffic safety for both the driver and other vehicles on the road (Lee et al., 2004). Driver Trust & Acceptance According to Lee et al. (2004) the success of a collision warning system depends on how well the system algorithm and driver interface are tailored to the driver’s conditions, limitations and preferences. Algorithms have strong safety benefit effects on collision warning systems but the driver interface may be equally important as it influences the driver’s responding time and acceptance of the system. As an example, a loud auditory warning may generate a rapid response but can, if it occurs too frequently, undermine driver acceptance. Further, Lee et al. talks about two critical factors that govern the effectiveness of collision warning systems:
1. The collision warning system must encourage a driver response that is both timely and appropriate.
2. For the drivers to trust and accept a system, annoyance associated with nuisance warnings (false alarms) must be minimized.
Bishop (2005) also mentions the importance of ADAS being well balanced to be as effective as possible. If the driver gives too much trust to the system it creates a dependence that could reduce vigilance while under-trust in the system could affect the driver to not take notice of the warnings or even shut down the system if possible. Driver Behaviour One of the biggest issues in ADAS operation is how the driver reacts to factors like loosing some of their driving autonomy and how the adapt to these changes. Locus of control Locus of control is a personal view about how external forces influence and control events in a person’s life. It is determined by the extent to which a driver attributes his/her own actions as responsible for the behaviour of the vehicle (internal locus of control) or if the behaviour of the vehicle is a consequence of the automated systems (external locus of control). An external locus of control may lead the driver to take a passive role when interacting with automated systems while an internal locus of control might lead drivers to take an active role. Studies by e.g. Stanton and Young (2005) has shown that drivers with external locus of control are less cautious, less attentive and more likely to be involved in traffic accidents than people with internal locus. These findings support a system interface that is designed to keep the driver active and alert when interacting with an ADAS. However, people tend to adapt to new systems quickly and these adaptations may not always be positive. Behavioural Adaptation Behavioural adaptation can, when used in this context, be described as a collection of behaviours that occur following changes to traffic safety such as ADAS (Rubin-Brown & Parker, 2004). Normally behavioural adaptation increases a person’s odds of surviving in a changing world but in traffic safety this adaptation may have negative consequences. Research has shown that drivers tend to misuse the increased safety margins that ADAS creates by adapting their driving style and e.g. increase their driving speed and pay less attention to the driving task than when driving without ADAS. These negative behavioural adaptations can eliminate the intended safety effect of ADAS such as lane departure warning systems (Kovordányi et al., 2005). Results presented by Rudin-Brown and Parker (2004) demonstrate that the Adaptive Cruise Control can induce potentially safety critical behavioural adaptation in drivers. In their study, participants using the ACC located significantly more items per minute on a secondary task compared to those driving unsupported. However, in addition the ACC-drivers’ response times to hazard detection tasks increased and also resulted in significantly more lane position variability. Kovordányi et al. (2005) proposes an idea that when an ADAS is introduced, car handling will get better; causing the driver to subconsciously adjust to the differences between the expected and actual
47
outcome. If this behavioural adaptation is to be mitigated, they suggest the use of a dynamic assistance policy preventing the driver from foreseeing the improved car handling. Further, when studying drivers’ behavioural adaptation many individual characteristics may be considered important in order to find potential dissimilarities in adaptation between different ADAS. Factors like age, gender and degree of experience are important but also personality traits such as sensation seeking and driving style. The factor “driving style” has recently received special attention when assessing impacts of ADAS. It is described as a driver characteristic that typifies his/her personal way of driving, for instance speed level, safety margins and level of attention allocated to the driving task. Research results show that the various dimensions of driving style need to be taken into account as an important factor for explaining the observed behavioural adaptations (Saad, 2004). Situational Awareness To effectively plan or problem solve changing environments, people must have a reasonably accurate awareness of the present and evolving situation. This concept of situation awareness is used for its relevance when it comes to understanding the reasons of accidents in which situation awareness has been lost. Situation awareness and working memory is directly linked. As our awareness of a surfacing situation mostly resides in working memory, it degrades as our cognitive resources are reorganized to competing tasks. Therefore situation awareness has implications for automation as higher levels of automation reduce workload and improve performance, but also maybe decrease situation awareness (Wickens, 2000). Ma et al. (2005) reports (according to Ward, 2000) of reduced situation awareness when using Adaptive Cruise Control (ACC) appeared, as participants showed poorer attention to lane positioning and slower response times to unexpected events. Mental Workload With the introduction of more and more ADAS, the driver’s role transforms from a manual to more of a supervisory control. Carsten and Nilsson (2001) reports (according to Wickens 1992) that this supervisory control can be an even more difficult human task since it increases the demand on human cognition while the demand on human action is decreased. This combination of low arousal and high momentary stress when something goes wrong gives the driver problems when required to regain control of a previously automated system. Workload research argues for an optimal level of mental workload, neither underloading nor overloading the individual. The ADAS that has been a target for most human factor studies is the ACC. Studies on ACC have shown reduced mental workload for drivers using ACC as the driver is relieved from some elements of the driving task. In general these results indicate that ACC accomplishes the goal of reducing the frequency of vehicles driving too close to each other and the severity of rear-end collisions. However, research by e.g. Stanton et al. (1997) and Ma et al. (2005) show that this decreased workload may have the driver direct his/her attention away from the driving task when using ACC and thereby affecting the driver’s ability to retain control of the vehicle in an emergency situation. A study by Rudin-Brown et al. presented by Ma et al. (2005) showed a significant improvement in secondary task performance for participants driving under an ACC condition compared to driving without ACC. As a result, drivers demonstrated a significantly smaller amount of safe braking events under ACC conditions compared to driving without the system. These results, according to Ma et al., demonstrate that the use of ACC may improve driver performance on everything except driving. The authors also points out that the improvements in secondary task performance while using ACC may lead to unexpected increases in accidents caused by driver distraction when performing more in-vehicle secondary tasks. Summary ADAS are systems designed to support the driver in his/her driving task. The purpose of the Advanced Driver Assistance Systems is to generate a positive effect on traffic safety but negative effects on e.g. driver behaviour has been found as well (Dragutinovic et al. 2005; Saad, 2004; Brookhuis, 2001; Kovordányi, 2005). One common aspect of all ADAS is that
48
the all (in some way) depend on the driver’s conditions and limitations. Badly designed systems may have negative effects on e.g. mental workload (Stanton et al., 2005), over- or under-trust to the system (Bishop, 2005), or safety critical behaviour adaptations (Rudin-Brown, 2004). Results like these show that there is a great amount of work needed to be done in making ADAS improve traffic safety in the way they are intended to. Acknowledgments
This literature review paper is to work as a base for upcoming research on HMI for integrated ADAS within the IVSS-sponsored project OPTIVe (optimized system integration for safe interaction in vehicles).
References AIDE. (2005). Review and Taxonomy of IVIS/ADAS applications (IST-1-507674-IP). Ananova. (2006). Car Drives Itself. [www]
<http://www.ananova.com/news/story/sm_1680513.html> Received 2006-01-23 Bishop. R. (2005) Intelligent Vehicle Technology and Trends. Norwood, MA: Artech House
INC. BMW. (2005). Active Safety. [www] <www.bmw.com> Received 2005-12-13 Brookhuis, K.A., de Waard, D., Janssen, W.H. (2001). Behavioural impacts of Advanced
Driver Assistance Systems–an overview. EJTIR, 1, 3, 245 – 253. Carsten, O.M.J., & Nilsson, L. (2001) Safety Assessment of Driver Assistance Systems
EJTIR, 1, no. 3, 225 – 243 Dragutinovic, N., Brookhuis, K.A., Hagenzieker, M.P., Marchau, V.A.W.J. (2005).
Behavioural effects of Advanced Cruise Control Use – a meta-analytic approach, EJTIR, 5, no. 4, 267-280.
Ford. (2005) Accident Avoidance. [www] <www.ford.com/en/innovation/safety/accidentAvoidance> Received 2005-10-31
Ford. (2005) Adaptive Cruise Control. [www] <www.ford.com/en/innovation/safety/accidentAvoidance /AdaptiveCruiseControl> Received 2005-10-31
Ford. (2005) Advanced Telematics.. [www] <www.ford.com/en/innovation/safety/accidentAvoidance /AdvancedTelematics> Received 2005-10-31
Headley, P. (2005). ESC as a baseline for active safety. (Paper Number 05-0332). USA, Continental Teves.
Kovordányi, R (2005). When will advanced driver support systems be user-adaptive? The case of adaptive cruise control (Tech Rep. SS-05-02). Menlo Park, California, The AAAI Press.
Kovordányi, R., Ohlsson, K., Alm, T. (2005) Dynamically Deployed Support as a Potential Solution to Negative Behavioral Adaptation. Proceedings of the 2005 IEEE Intelligent Vehicle Symposium, June 6-8, Las Vegas, Nevada.
Lee, J.D., Hoffman, J.D., Hayes, E. (2004). Collision Warning Design to Mitigate Driver Distraction. Proceedings of the CHI 2004 Conference, April 24-29, Vienna, Austria, 65-72.
Ma, R. Sheik-Nainar, A., Kaber, D.B. (2005). Situation Awareness in Driving While Using Adaptive Cruise
Control and a Cell Phone, Proceedings of the Human Factors and Ergonomics Society 49th Annual Meeting, 381-385.
Mercedes Benz. (2005). Pre-Safe. [www] <www.mercedes-benz.com/innovation> Received 2005-10-31
Raab, W., Bruels, N., Hachmann, U., Harnisch, J., Ramacher, U., Sauer, C., Techmer, A. (2003). A 100-GOPS Programmable Processor for Vehicle Vision Systems, IEEE Design & Test of Computers, Jan-Feb, 8-16
Rubin-Brown, C.M., Parker, H.A. (2004) Behavioural adaptation to adaptive cruise control (ACC): implications for preventive strategies, Transportation Research Part F 7, 59–76.
49

Saad, F. (2004). Behavioural adaptations to new driver support systems - Some critical issues*. Proceedings of the IEEE International Conference on Systems, Man and Cybernetics, 288-293.
Siemens VDO Automotive AG. (2005). Increasing Comfort – Boosting Safety. Advanced Driver Assistance Systems (J71001-A-A643-X-7600) Germany, Siemens VDO Automotive AG Corporate Communications.
Stanton, N.A., Young, M., McCaulder, B. (1997). Drive-by-Wire: The Case of Driver Workload and Reclaiming Control with Adaptive Cruise Control, Safety Science Vol. 27, NO. 2/3, 149- 159
Stanton, N.A., Young, M. (2005). Driver behaviour with adaptive cruise control, Ergonomics, Vol. 48, No. 10, 1294 – 1313
Toyota. (2005). Active Safety Technologies - Inside the technologies that work behind the scenes to help you deal with the unexpected. [www] <www.toyota.com> Received 2005-10-31
Toyota. (2005). Coming Safety Attractions - Looking ahead to the technologies that will help make the cars of the future safe. [www] <www.toyota.com> Received 2005-10-31
Toyota. (2005). Had-Dac Downhill and Hill-start Assist Control System Enhance Off-road Capability. [www] <www.toyota.com> Received 2005-10-31
Toyota. (2005). 2005 Toyota, Scion and Lexus Safety Feature Roundup. [www] <www.toyota.com> Received 2005-10-31
Vahidi, A & Eskandarian, A. (2003). Research Advances in Intelligent Collision Avoidance and Adaptive Cruise Control. IEEE Transactions on Intelligent Transportation Systems, Vol. 4, No. 3, September, 143-153.
Wang, J., Bebis, G, Miller, R. (2005). Overtaking Vehicle Detection Using Dynamic and Quasi-Static Background Modeling. IEEE Computer Society Conference on Computer Vision and Pattern Recognition, Vol. 3, June, 64-71
Wickens, C.D. & Hollands, J.G. (2000). Engineering Psychology and Human Performance, New Jersey: Prentice-Hall Inc.
50
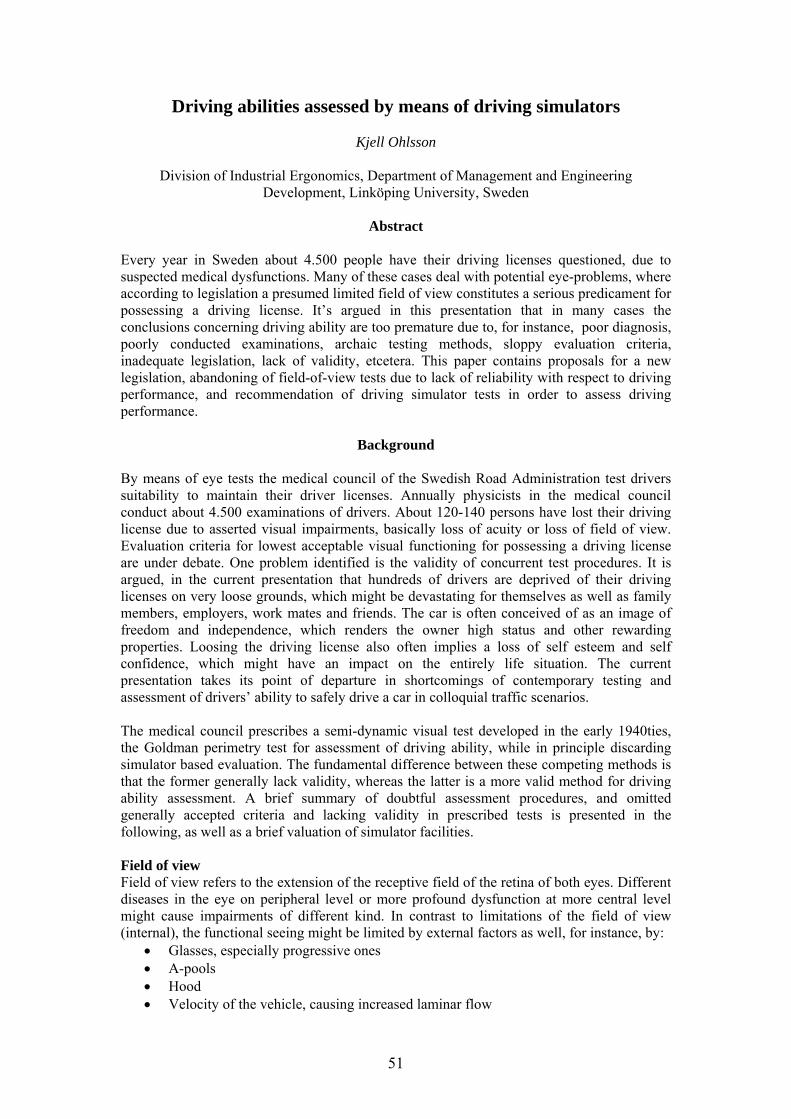
Driving abilities assessed by means of driving simulators
Kjell Ohlsson
Division of Industrial Ergonomics, Department of Management and Engineering Development, Linköping University, Sweden
Abstract
Every year in Sweden about 4.500 people have their driving licenses questioned, due to suspected medical dysfunctions. Many of these cases deal with potential eye-problems, where according to legislation a presumed limited field of view constitutes a serious predicament for possessing a driving license. It’s argued in this presentation that in many cases the conclusions concerning driving ability are too premature due to, for instance, poor diagnosis, poorly conducted examinations, archaic testing methods, sloppy evaluation criteria, inadequate legislation, lack of validity, etcetera. This paper contains proposals for a new legislation, abandoning of field-of-view tests due to lack of reliability with respect to driving performance, and recommendation of driving simulator tests in order to assess driving performance.
Background
By means of eye tests the medical council of the Swedish Road Administration test drivers suitability to maintain their driver licenses. Annually physicists in the medical council conduct about 4.500 examinations of drivers. About 120-140 persons have lost their driving license due to asserted visual impairments, basically loss of acuity or loss of field of view. Evaluation criteria for lowest acceptable visual functioning for possessing a driving license are under debate. One problem identified is the validity of concurrent test procedures. It is argued, in the current presentation that hundreds of drivers are deprived of their driving licenses on very loose grounds, which might be devastating for themselves as well as family members, employers, work mates and friends. The car is often conceived of as an image of freedom and independence, which renders the owner high status and other rewarding properties. Loosing the driving license also often implies a loss of self esteem and self confidence, which might have an impact on the entirely life situation. The current presentation takes its point of departure in shortcomings of contemporary testing and assessment of drivers’ ability to safely drive a car in colloquial traffic scenarios. The medical council prescribes a semi-dynamic visual test developed in the early 1940ties, the Goldman perimetry test for assessment of driving ability, while in principle discarding simulator based evaluation. The fundamental difference between these competing methods is that the former generally lack validity, whereas the latter is a more valid method for driving ability assessment. A brief summary of doubtful assessment procedures, and omitted generally accepted criteria and lacking validity in prescribed tests is presented in the following, as well as a brief valuation of simulator facilities. Field of view Field of view refers to the extension of the receptive field of the retina of both eyes. Different diseases in the eye on peripheral level or more profound dysfunction at more central level might cause impairments of different kind. In contrast to limitations of the field of view (internal), the functional seeing might be limited by external factors as well, for instance, by:
• Glasses, especially progressive ones • A-pools • Hood • Velocity of the vehicle, causing increased laminar flow
51
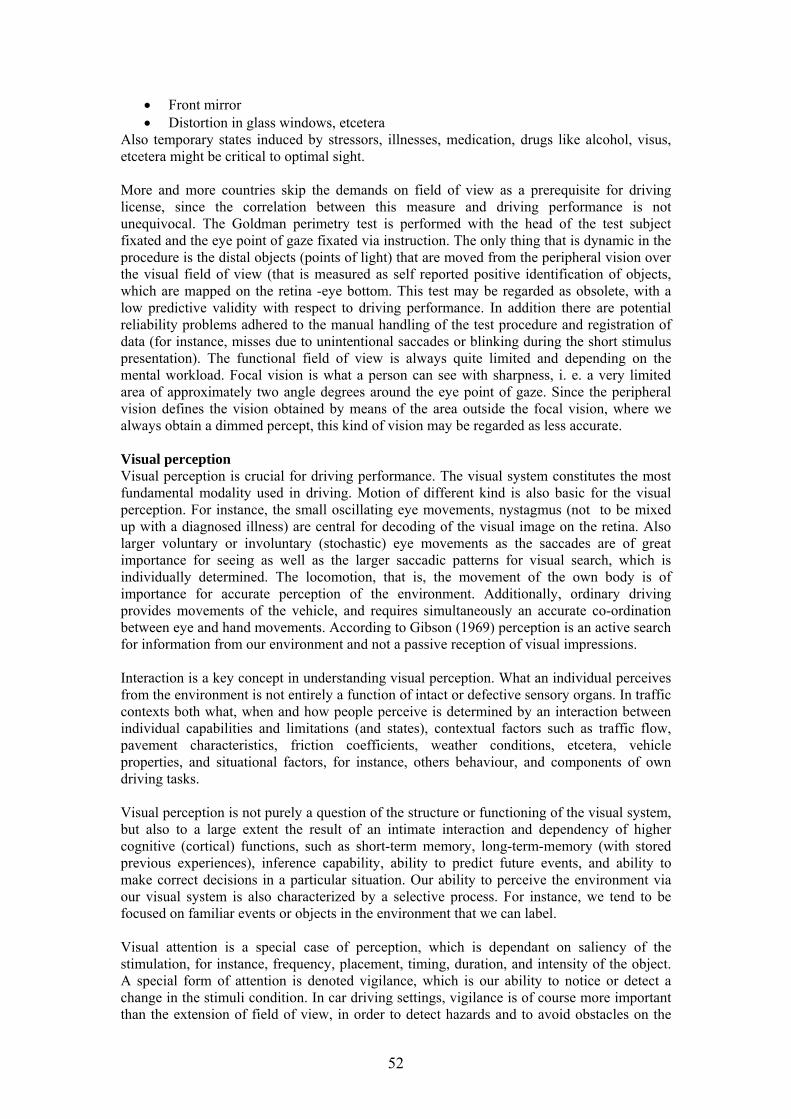
• Front mirror • Distortion in glass windows, etcetera
Also temporary states induced by stressors, illnesses, medication, drugs like alcohol, visus, etcetera might be critical to optimal sight. More and more countries skip the demands on field of view as a prerequisite for driving license, since the correlation between this measure and driving performance is not unequivocal. The Goldman perimetry test is performed with the head of the test subject fixated and the eye point of gaze fixated via instruction. The only thing that is dynamic in the procedure is the distal objects (points of light) that are moved from the peripheral vision over the visual field of view (that is measured as self reported positive identification of objects, which are mapped on the retina -eye bottom. This test may be regarded as obsolete, with a low predictive validity with respect to driving performance. In addition there are potential reliability problems adhered to the manual handling of the test procedure and registration of data (for instance, misses due to unintentional saccades or blinking during the short stimulus presentation). The functional field of view is always quite limited and depending on the mental workload. Focal vision is what a person can see with sharpness, i. e. a very limited area of approximately two angle degrees around the eye point of gaze. Since the peripheral vision defines the vision obtained by means of the area outside the focal vision, where we always obtain a dimmed percept, this kind of vision may be regarded as less accurate. Visual perception Visual perception is crucial for driving performance. The visual system constitutes the most fundamental modality used in driving. Motion of different kind is also basic for the visual perception. For instance, the small oscillating eye movements, nystagmus (not to be mixed up with a diagnosed illness) are central for decoding of the visual image on the retina. Also larger voluntary or involuntary (stochastic) eye movements as the saccades are of great importance for seeing as well as the larger saccadic patterns for visual search, which is individually determined. The locomotion, that is, the movement of the own body is of importance for accurate perception of the environment. Additionally, ordinary driving provides movements of the vehicle, and requires simultaneously an accurate co-ordination between eye and hand movements. According to Gibson (1969) perception is an active search for information from our environment and not a passive reception of visual impressions. Interaction is a key concept in understanding visual perception. What an individual perceives from the environment is not entirely a function of intact or defective sensory organs. In traffic contexts both what, when and how people perceive is determined by an interaction between individual capabilities and limitations (and states), contextual factors such as traffic flow, pavement characteristics, friction coefficients, weather conditions, etcetera, vehicle properties, and situational factors, for instance, others behaviour, and components of own driving tasks. Visual perception is not purely a question of the structure or functioning of the visual system, but also to a large extent the result of an intimate interaction and dependency of higher cognitive (cortical) functions, such as short-term memory, long-term-memory (with stored previous experiences), inference capability, ability to predict future events, and ability to make correct decisions in a particular situation. Our ability to perceive the environment via our visual system is also characterized by a selective process. For instance, we tend to be focused on familiar events or objects in the environment that we can label. Visual attention is a special case of perception, which is dependant on saliency of the stimulation, for instance, frequency, placement, timing, duration, and intensity of the object. A special form of attention is denoted vigilance, which is our ability to notice or detect a change in the stimuli condition. In car driving settings, vigilance is of course more important than the extension of field of view, in order to detect hazards and to avoid obstacles on the
52
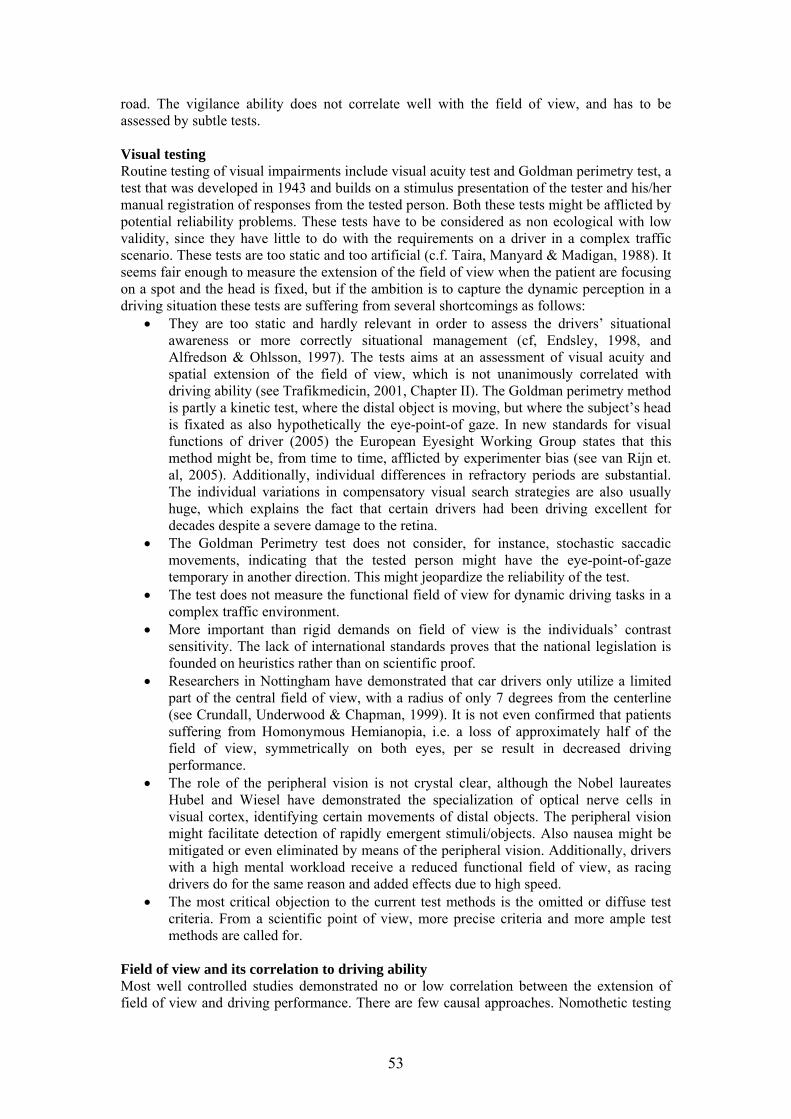
road. The vigilance ability does not correlate well with the field of view, and has to be assessed by subtle tests. Visual testing Routine testing of visual impairments include visual acuity test and Goldman perimetry test, a test that was developed in 1943 and builds on a stimulus presentation of the tester and his/her manual registration of responses from the tested person. Both these tests might be afflicted by potential reliability problems. These tests have to be considered as non ecological with low validity, since they have little to do with the requirements on a driver in a complex traffic scenario. These tests are too static and too artificial (c.f. Taira, Manyard & Madigan, 1988). It seems fair enough to measure the extension of the field of view when the patient are focusing on a spot and the head is fixed, but if the ambition is to capture the dynamic perception in a driving situation these tests are suffering from several shortcomings as follows:
• They are too static and hardly relevant in order to assess the drivers’ situational awareness or more correctly situational management (cf, Endsley, 1998, and Alfredson & Ohlsson, 1997). The tests aims at an assessment of visual acuity and spatial extension of the field of view, which is not unanimously correlated with driving ability (see Trafikmedicin, 2001, Chapter II). The Goldman perimetry method is partly a kinetic test, where the distal object is moving, but where the subject’s head is fixated as also hypothetically the eye-point-of gaze. In new standards for visual functions of driver (2005) the European Eyesight Working Group states that this method might be, from time to time, afflicted by experimenter bias (see van Rijn et. al, 2005). Additionally, individual differences in refractory periods are substantial. The individual variations in compensatory visual search strategies are also usually huge, which explains the fact that certain drivers had been driving excellent for decades despite a severe damage to the retina.
• The Goldman Perimetry test does not consider, for instance, stochastic saccadic movements, indicating that the tested person might have the eye-point-of-gaze temporary in another direction. This might jeopardize the reliability of the test.
• The test does not measure the functional field of view for dynamic driving tasks in a complex traffic environment.
• More important than rigid demands on field of view is the individuals’ contrast sensitivity. The lack of international standards proves that the national legislation is founded on heuristics rather than on scientific proof.
• Researchers in Nottingham have demonstrated that car drivers only utilize a limited part of the central field of view, with a radius of only 7 degrees from the centerline (see Crundall, Underwood & Chapman, 1999). It is not even confirmed that patients suffering from Homonymous Hemianopia, i.e. a loss of approximately half of the field of view, symmetrically on both eyes, per se result in decreased driving performance.
• The role of the peripheral vision is not crystal clear, although the Nobel laureates Hubel and Wiesel have demonstrated the specialization of optical nerve cells in visual cortex, identifying certain movements of distal objects. The peripheral vision might facilitate detection of rapidly emergent stimuli/objects. Also nausea might be mitigated or even eliminated by means of the peripheral vision. Additionally, drivers with a high mental workload receive a reduced functional field of view, as racing drivers do for the same reason and added effects due to high speed.
• The most critical objection to the current test methods is the omitted or diffuse test criteria. From a scientific point of view, more precise criteria and more ample test methods are called for.
Field of view and its correlation to driving ability Most well controlled studies demonstrated no or low correlation between the extension of field of view and driving performance. There are few causal approaches. Nomothetic testing
53
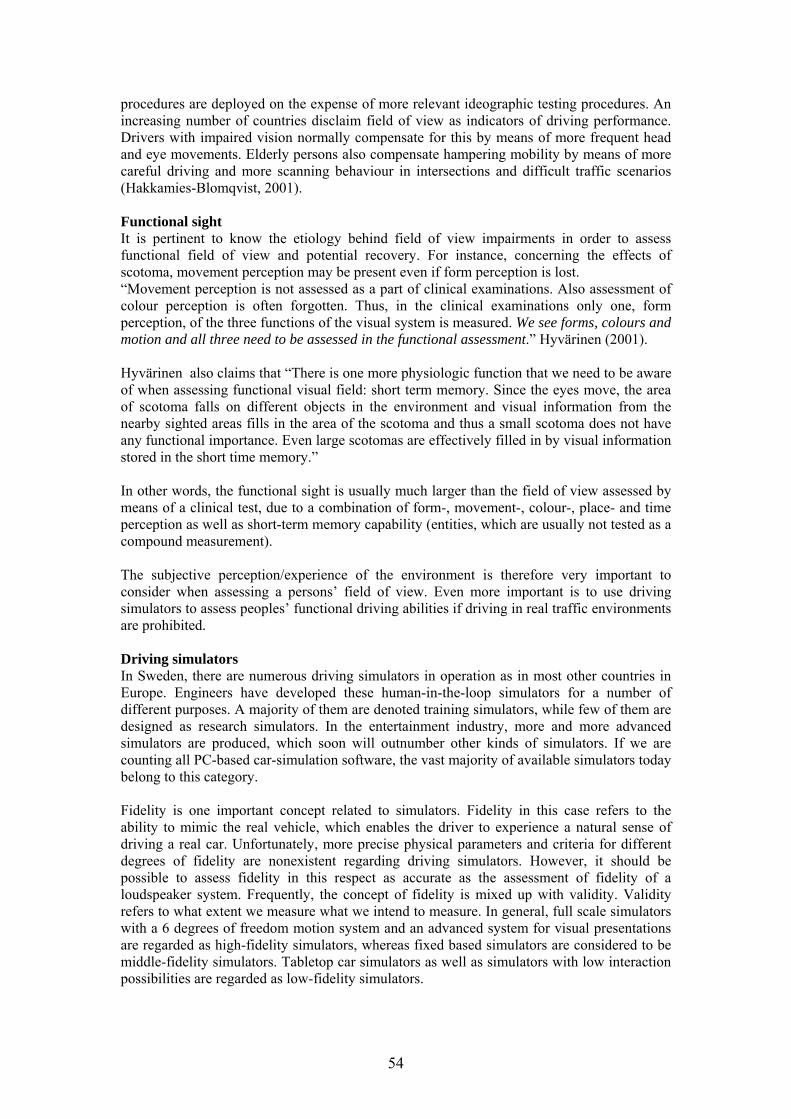
procedures are deployed on the expense of more relevant ideographic testing procedures. An increasing number of countries disclaim field of view as indicators of driving performance. Drivers with impaired vision normally compensate for this by means of more frequent head and eye movements. Elderly persons also compensate hampering mobility by means of more careful driving and more scanning behaviour in intersections and difficult traffic scenarios (Hakkamies-Blomqvist, 2001). Functional sight It is pertinent to know the etiology behind field of view impairments in order to assess functional field of view and potential recovery. For instance, concerning the effects of scotoma, movement perception may be present even if form perception is lost. “Movement perception is not assessed as a part of clinical examinations. Also assessment of colour perception is often forgotten. Thus, in the clinical examinations only one, form perception, of the three functions of the visual system is measured. We see forms, colours and motion and all three need to be assessed in the functional assessment.” Hyvärinen (2001). Hyvärinen also claims that “There is one more physiologic function that we need to be aware of when assessing functional visual field: short term memory. Since the eyes move, the area of scotoma falls on different objects in the environment and visual information from the nearby sighted areas fills in the area of the scotoma and thus a small scotoma does not have any functional importance. Even large scotomas are effectively filled in by visual information stored in the short time memory.” In other words, the functional sight is usually much larger than the field of view assessed by means of a clinical test, due to a combination of form-, movement-, colour-, place- and time perception as well as short-term memory capability (entities, which are usually not tested as a compound measurement). The subjective perception/experience of the environment is therefore very important to consider when assessing a persons’ field of view. Even more important is to use driving simulators to assess peoples’ functional driving abilities if driving in real traffic environments are prohibited. Driving simulators In Sweden, there are numerous driving simulators in operation as in most other countries in Europe. Engineers have developed these human-in-the-loop simulators for a number of different purposes. A majority of them are denoted training simulators, while few of them are designed as research simulators. In the entertainment industry, more and more advanced simulators are produced, which soon will outnumber other kinds of simulators. If we are counting all PC-based car-simulation software, the vast majority of available simulators today belong to this category. Fidelity is one important concept related to simulators. Fidelity in this case refers to the ability to mimic the real vehicle, which enables the driver to experience a natural sense of driving a real car. Unfortunately, more precise physical parameters and criteria for different degrees of fidelity are nonexistent regarding driving simulators. However, it should be possible to assess fidelity in this respect as accurate as the assessment of fidelity of a loudspeaker system. Frequently, the concept of fidelity is mixed up with validity. Validity refers to what extent we measure what we intend to measure. In general, full scale simulators with a 6 degrees of freedom motion system and an advanced system for visual presentations are regarded as high-fidelity simulators, whereas fixed based simulators are considered to be middle-fidelity simulators. Tabletop car simulators as well as simulators with low interaction possibilities are regarded as low-fidelity simulators.
54
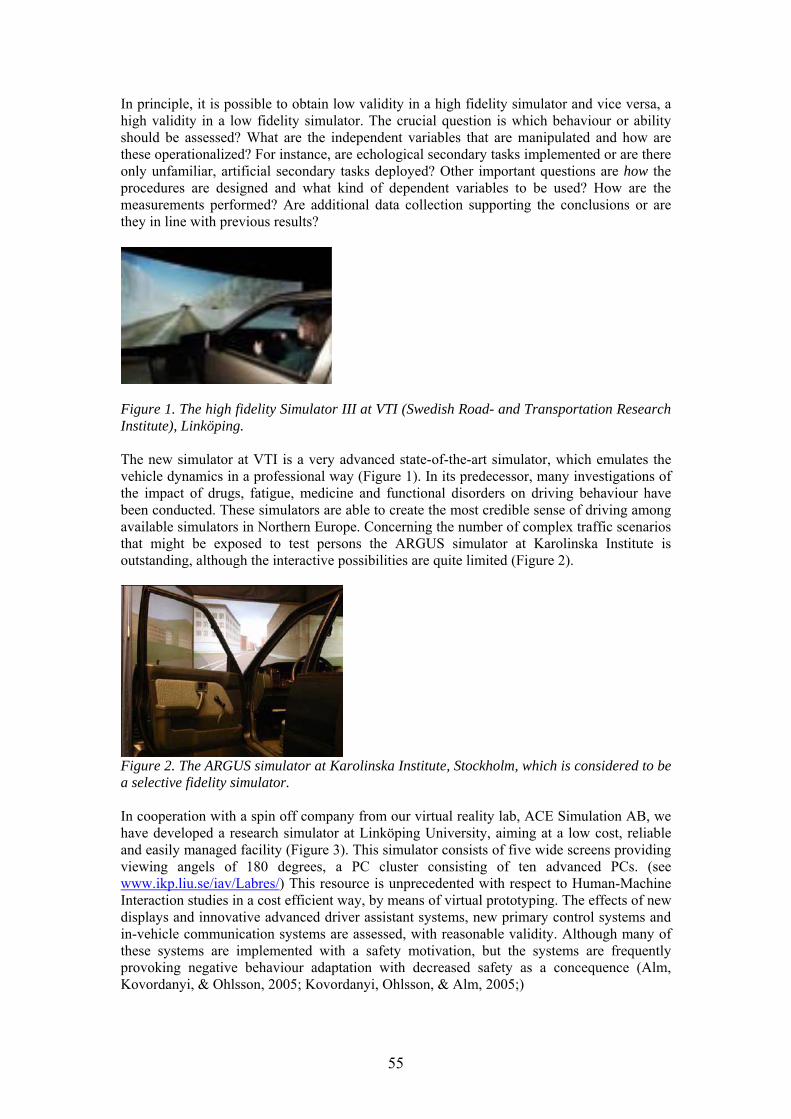
In principle, it is possible to obtain low validity in a high fidelity simulator and vice versa, a high validity in a low fidelity simulator. The crucial question is which behaviour or ability should be assessed? What are the independent variables that are manipulated and how are these operationalized? For instance, are echological secondary tasks implemented or are there only unfamiliar, artificial secondary tasks deployed? Other important questions are how the procedures are designed and what kind of dependent variables to be used? How are the measurements performed? Are additional data collection supporting the conclusions or are they in line with previous results?
Figure 1. The high fidelity Simulator III at VTI (Swedish Road- and Transportation Research Institute), Linköping. The new simulator at VTI is a very advanced state-of-the-art simulator, which emulates the vehicle dynamics in a professional way (Figure 1). In its predecessor, many investigations of the impact of drugs, fatigue, medicine and functional disorders on driving behaviour have been conducted. These simulators are able to create the most credible sense of driving among available simulators in Northern Europe. Concerning the number of complex traffic scenarios that might be exposed to test persons the ARGUS simulator at Karolinska Institute is outstanding, although the interactive possibilities are quite limited (Figure 2).
Figure 2. The ARGUS simulator at Karolinska Institute, Stockholm, which is considered to be a selective fidelity simulator. In cooperation with a spin off company from our virtual reality lab, ACE Simulation AB, we have developed a research simulator at Linköping University, aiming at a low cost, reliable and easily managed facility (Figure 3). This simulator consists of five wide screens providing viewing angels of 180 degrees, a PC cluster consisting of ten advanced PCs. (see www.ikp.liu.se/iav/Labres/) This resource is unprecedented with respect to Human-Machine Interaction studies in a cost efficient way, by means of virtual prototyping. The effects of new displays and innovative advanced driver assistant systems, new primary control systems and in-vehicle communication systems are assessed, with reasonable validity. Although many of these systems are implemented with a safety motivation, but the systems are frequently provoking negative behaviour adaptation with decreased safety as a concequence (Alm, Kovordanyi, & Ohlsson, 2005; Kovordanyi, Ohlsson, & Alm, 2005;)
55
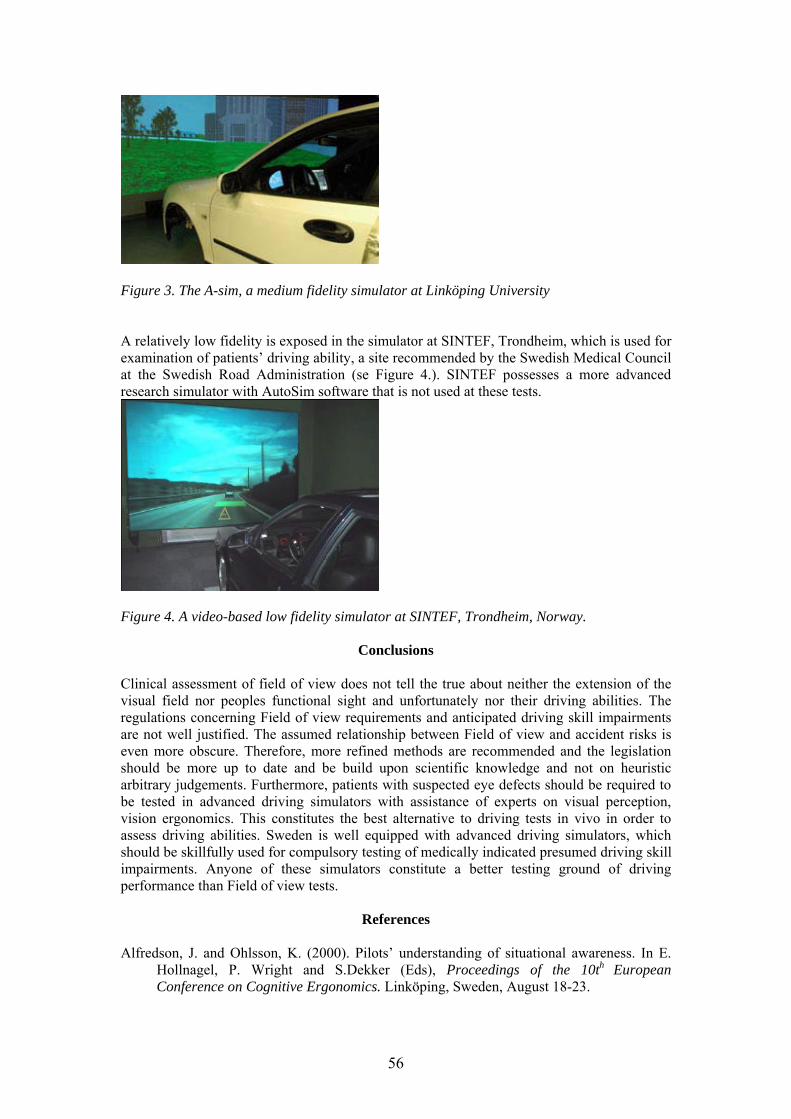
Figure 3. The A-sim, a medium fidelity simulator at Linköping University A relatively low fidelity is exposed in the simulator at SINTEF, Trondheim, which is used for examination of patients’ driving ability, a site recommended by the Swedish Medical Council at the Swedish Road Administration (se Figure 4.). SINTEF possesses a more advanced research simulator with AutoSim software that is not used at these tests.
Figure 4. A video-based low fidelity simulator at SINTEF, Trondheim, Norway.
Conclusions
Clinical assessment of field of view does not tell the true about neither the extension of the visual field nor peoples functional sight and unfortunately nor their driving abilities. The regulations concerning Field of view requirements and anticipated driving skill impairments are not well justified. The assumed relationship between Field of view and accident risks is even more obscure. Therefore, more refined methods are recommended and the legislation should be more up to date and be build upon scientific knowledge and not on heuristic arbitrary judgements. Furthermore, patients with suspected eye defects should be required to be tested in advanced driving simulators with assistance of experts on visual perception, vision ergonomics. This constitutes the best alternative to driving tests in vivo in order to assess driving abilities. Sweden is well equipped with advanced driving simulators, which should be skillfully used for compulsory testing of medically indicated presumed driving skill impairments. Anyone of these simulators constitute a better testing ground of driving performance than Field of view tests.
References Alfredson, J. and Ohlsson, K. (2000). Pilots’ understanding of situational awareness. In E.
Hollnagel, P. Wright and S.Dekker (Eds), Proceedings of the 10th European Conference on Cognitive Ergonomics. Linköping, Sweden, August 18-23.
56
Alm, T., Kovordanyi, R. and Ohlsson, K. (2005). Glass Cockpit Simulators: Tools for IT-based car systems design and evaluation. Proceedings of Driving Simulator Conference in Orlando, Fl, USA.)
Crundall, D., Underwood, G. and Chapman, P. 1999. Driving experience and the functional field of view. Perception, Vol 28.
Endsley, E. (1995). Towards a theory of situation awareness in dynamic systems. Human Factors, 37:1, pp. 32-64.
Gibson, J. (1969). Våra sinnen som perceptuella system. Beckmans Bokförlag, Stockholm. (Swedish translation).
Hakamies-Blomqvist L. m fl (2001) Strategisk kompensation och körbeteende hos äldre bilförare. VTI rapport 470. (In Swedish)
Hyvärinen, L. (2001). Functional Field of Vision. Report at Lea-Test Ltd. Apollonkatu 6 A 4, FIN-00100, Helsinki. Kovordanyi, R., Ohlsson, K. and Alm, T. (2005). Dynamically Deployed Support as a
Potential Solution to Negative Behavioral Adaptation. Proceedings of the IEEE Intelligent Vehicles Symposium, Las Vegas, Nevada, USA.
Taira, E.D, Manyard, M., and Madigan, M.J. (1988). Assessing the Driving Ability of the Elderly. Haworth Press Inc. New York, USA.
Trafikmedicin. (2001). Vägverket, Trafikmedicinska Rådet. Borlänge. (in Swedish). Van Rinj, L.J. et al. (2005). New Standards for the visual functions of drivers. Report of the
Eyesight Working Group. Brüssels.
57
The concept of normality and its impact on ICT design
Kjell Ohlsson1, Hans Persson2 & Olle Östlin2
1Division of Industrial Ergonomics, Department of Management and Engineering Development,Linköping University, Sweden
2Institute of Humane Technology, Bollnäs, Sweden
Background From a governmental point of view there are several explicit visions dealing with peoples’ access to public service. IT democracy is a viable concept in policymakers’ statements. Broadband connection to all citizens was a slogan a few years back. The invented “home PC reform” has also been deployed for a number of years in Sweden, implying that employees should have access to computers in their home. A special authority was invented, the 24 hours agency, with a vision to enable all kind of information 24 hours a day to our citizens. An explicit goal from the government is that in 2010, Sweden will be an equal, accessible society. However, the fact is that this will never become true, since there are numerous people in Sweden that never will have prerequisites to participate in the “wired or wireless society”. Too many people are alienated from social communication and accordingly societal communication. Depending on lack of knowledge, intellectual capabilities, motivation, incentives, or illness, handicap, or difficulties of various sorts, people are not taking part of what is happening in the cyber space. For instance, about 20% of the population suffers from mild reading disorders that inhibit their ability to extract meaning of quite simple texts. The content of Websites seems to be harder to grasp for these persons. There might be several reasons why electronically generated text is more difficult to capture than a paper text. Others might suffer from illnesses of different kind and physical or mental disorders. A large number of the population suffers from reduced mobility. For instance, about 17 % of the Swedish population has reduced muscle strength in their hands and lack of precision, preventing them to handle a mouse with accuracy. In addition, a large number of the population is below average intellectual capability, witch may limit their interaction with public authorities via computerized systems. Many Swedes are also immigrants that expose severe language difficulties, which hamper their communication skills. The number of “old” elderly people is growing fast in many countries, among them Sweden, -in general people with minor experience from computerized information and communication systems. The list of all groups with a feeling of being left astray is long. In an annual investigation of peoples’ ICT (information and communication technology) habits the World Internet Institute conducts interview studies with a large sample in several countries. The study in 2004 revealed that 74 % of the Swedes had access to a computer, and 65% had access to Internet, whereas only 24 had access to broadband connection (Findahl, 2004). In order to include most people in future possibilities to interact by means of innovative ICT, an Institute for Humane Technology was established in 2003 in Bollnäs, located in the middle of Sweden. A participative approach around the concept design-for-all has been the guideline for the activities aiming at easy access to ICT products and services for all citizens. These products and services should not only be usable, but also be worth to use –by means of added values (cf. Eftring, 1999). Contemporary development of ICT products and services presumes that people in general are casted in the same form, irrespective of functional differences. The concept of normality is still the keyword for design considerations in industry. This paper will challenge the usefulness of the concept of normality.
58
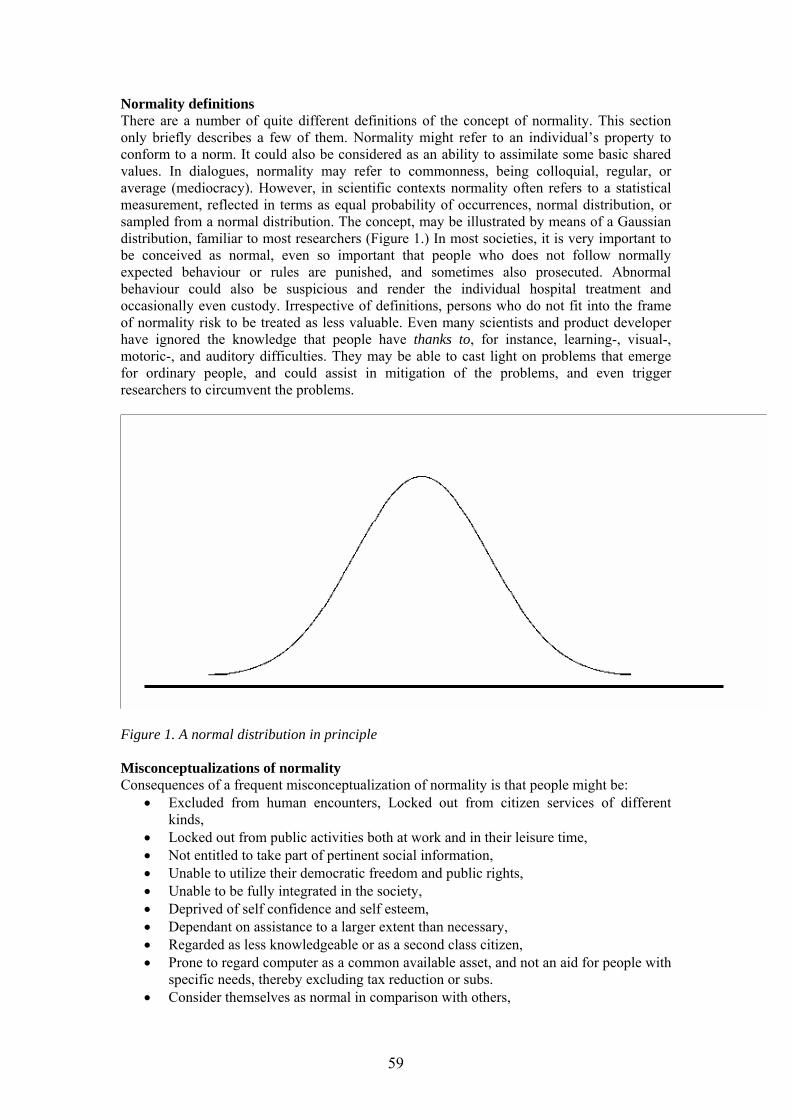
Normality definitions There are a number of quite different definitions of the concept of normality. This section only briefly describes a few of them. Normality might refer to an individual’s property to conform to a norm. It could also be considered as an ability to assimilate some basic shared values. In dialogues, normality may refer to commonness, being colloquial, regular, or average (mediocracy). However, in scientific contexts normality often refers to a statistical measurement, reflected in terms as equal probability of occurrences, normal distribution, or sampled from a normal distribution. The concept, may be illustrated by means of a Gaussian distribution, familiar to most researchers (Figure 1.) In most societies, it is very important to be conceived as normal, even so important that people who does not follow normally expected behaviour or rules are punished, and sometimes also prosecuted. Abnormal behaviour could also be suspicious and render the individual hospital treatment and occasionally even custody. Irrespective of definitions, persons who do not fit into the frame of normality risk to be treated as less valuable. Even many scientists and product developer have ignored the knowledge that people have thanks to, for instance, learning-, visual-, motoric-, and auditory difficulties. They may be able to cast light on problems that emerge for ordinary people, and could assist in mitigation of the problems, and even trigger researchers to circumvent the problems.
Figure 1. A normal distribution in principle Misconceptualizations of normality Consequences of a frequent misconceptualization of normality is that people might be:
• Excluded from human encounters, Locked out from citizen services of different kinds,
• Locked out from public activities both at work and in their leisure time, • Not entitled to take part of pertinent social information, • Unable to utilize their democratic freedom and public rights, • Unable to be fully integrated in the society, • Deprived of self confidence and self esteem, • Dependant on assistance to a larger extent than necessary, • Regarded as less knowledgeable or as a second class citizen, • Prone to regard computer as a common available asset, and not an aid for people with
specific needs, thereby excluding tax reduction or subs. • Consider themselves as normal in comparison with others,
59
• Tempted to compare themselves with small subgroups, which might be odd in several respects, and thereby draw wrong conclusions about normality.
A scientific approach to the concept of normality Data collected from a sample of individuals are usually lumped together and aggregated at higher levels. So, if the research interest focuses on group levels, usually measured features of a particular randomly selected group are normally distributed. In that respect, most people will be within the range of normality. But, if the same features are measured from an idiosyncratic point of view, the more features that are measured the less likelihood that an individual is considered to be within the range of normality in all dimensions. An individual might be odd in several respects, but still be considered as “normal”. Many people, experience difficulties of different kind in the interaction with ITC. During a lifetime, most people experience from time to time difficulties that have an immense impact on their ability to understand modern technology. ICT design Currently, ITC design targets assumed “normal” groups of people. In many cases, the design develops without appropriate user requirements, and too often end users are omitted from the design process. A person with explicit dysfunctions or difficulties is seldom regarded as a valuable resource in the design process. A couple of years ago IHT developed TED, a model for test, evaluation and design of ITC products and services with support from Swedish Post and Telegraph Board and other financial sources (Ohlsson, Persson, & Östlin, 2005). This model, based on an ISO standard 13407 takes advantage of indicator groups consisting of people with well defined difficulties in the design process (see Figure, 2). These people are usually extremely aware of their difficulties, since they have struggled with them all their lives, implying that their meta-cognitive abilities might sometimes be more matured compared to comparable abilities among people without these difficulties. This has been confirmed in a study of “broadband for handicapped”, in which IHT conducted a study on WEB-search for critical information on predefined Websites. One group consisted of CEOs of SMEs, while another group consisted of personnel at health care centers, and finally a group of intellectually handicapped. Following tasks were deployed in a quasi-experimental study:
• Log on procedure, order broadband connections,
• Install broadband on own computer,
• Make necessary adaptation of own computer,
• Contact customer PC support,
• Contact customer broadband support.
• Information interpreter In brief, the results demonstrated a superior ability to express elaborated explanations of experienced difficulties during task completion among the intellectually handicapped, whereas the CEOs and the health care employees provided scanty comments that could hardly inform system designers. Finally, the latter groups were confronted with the comments from the former group. In this process, the users who didn’t experience any difficulties had to admit that they had similar interaction difficulties as the intellectually handicapped. A selection of comments from the CEOs was as follows:
• I didn’t observed that condition,
• It was so difficult that I skipped it,
60
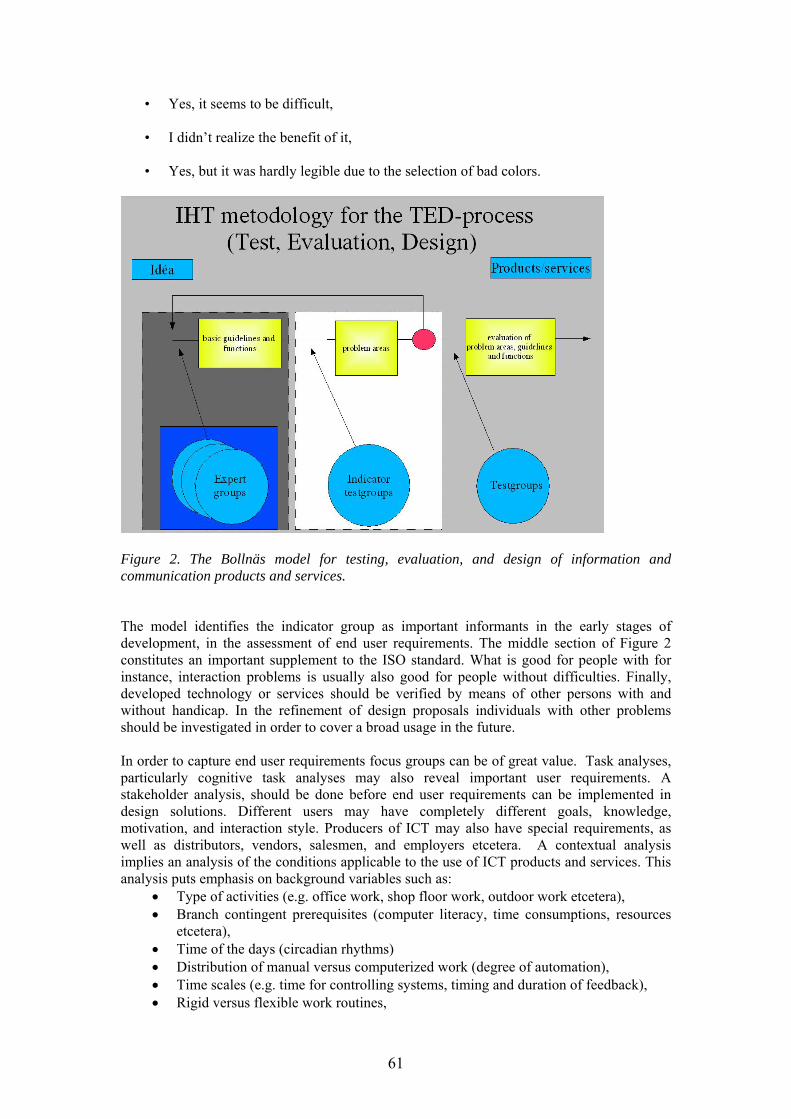
• Yes, it seems to be difficult,
• I didn’t realize the benefit of it,
• Yes, but it was hardly legible due to the selection of bad colors.
Figure 2. The Bollnäs model for testing, evaluation, and design of information and communication products and services. The model identifies the indicator group as important informants in the early stages of development, in the assessment of end user requirements. The middle section of Figure 2 constitutes an important supplement to the ISO standard. What is good for people with for instance, interaction problems is usually also good for people without difficulties. Finally, developed technology or services should be verified by means of other persons with and without handicap. In the refinement of design proposals individuals with other problems should be investigated in order to cover a broad usage in the future. In order to capture end user requirements focus groups can be of great value. Task analyses, particularly cognitive task analyses may also reveal important user requirements. A stakeholder analysis, should be done before end user requirements can be implemented in design solutions. Different users may have completely different goals, knowledge, motivation, and interaction style. Producers of ICT may also have special requirements, as well as distributors, vendors, salesmen, and employers etcetera. A contextual analysis implies an analysis of the conditions applicable to the use of ICT products and services. This analysis puts emphasis on background variables such as:
• Type of activities (e.g. office work, shop floor work, outdoor work etcetera), • Branch contingent prerequisites (computer literacy, time consumptions, resources
etcetera), • Time of the days (circadian rhythms) • Distribution of manual versus computerized work (degree of automation), • Time scales (e.g. time for controlling systems, timing and duration of feedback), • Rigid versus flexible work routines,
61
• Standardized versus unique interfaces, • Compatibility with previous systems (e.g. familiarity, habitual interaction, s).
Individually related background variables might also be included in a contextual analysis, such as:
• Beginners versus experienced users versus experts, • Computer experience, • Stand alone versus teamwork, • Domain knowledge, • Cultural background,
Feasibility studies might reveal what features to be adhered to the products or services. At the end, the efficiency, ease of use, handling quality, learning, and ….. will create more usable, more appreciated and more accessible ICT products and services not only for people with handicap or disorders, but also for the ordinary user without these difficulties.
Conclusions There are no generally accepted definitions of the concept of normality. It is also very important to fit into a “normality thinking”, although the concept is vaguely defined. Otherwise, people might be excluded from access to crucial services and products, primarily due to ignorance and prejudice. A statistical approach to normality is not sufficient, since individual properties may be unevenly distributed. The more that is measured the less normal individual. Certain individual features may be very salient, especially since the group of comparison in general is quite limited in an individual perspective. Comparisons are rarely done in relation to population means or to the average person. In this context, the question is if there are any normal individuals. A more scientific approach takes an idiosyncratic view as a point of departure for investigations of difficulties that may substantially influence the interaction between people by means of ICT. Thus, a model has been developed for test, evaluation, and design of ICT products and services by introduction of indicator groups with well-defined problems. The ambition is to get a real involvement of end users that usually are forgotten in ITC development in order to obtain more usable, secure and appreciated products and services. This is accomplished by work in standardization groups, further refinement of the TED model and No special solutions for people with handicaps or special needs are required. Instead of tailoring products and services for different small target groups, our approach allows personalization of functions adapted to a vast majority. Future research The TED-model has to be verified for people with other types of difficulties, and broader test groups, with a more balanced composition. The TED model in itself needs some elaboration. The composition of user panels has to be more stringent and a taxonomy for specific difficulties related to performance measures has to replace medical diagnosis, which usually are too crude and useless in informing design.
References Eftring H. (1999), The Useworthiness of Robots for People with physical disabilities, Certec,
Lund, http://www.certec.lth.se/doc/useworthiness/useworthiness.pdfFindahl, O. (2004). Swedes and the Internet. Report from World Internet Institute, Uppsala
University. (in Swedish, available at www.wii.se) PTS. (2004). Broadband for handicapped people. Stockholm. (in Swedish)
62

Ohlsson, K. Persson, H. and Östlin, O. (2005). The Bollnäs’ model for testing, evaluation and design of information and communication technology services. Proceedings of the “Online Deliberation” conference at Stanford University, May 23-25.
63
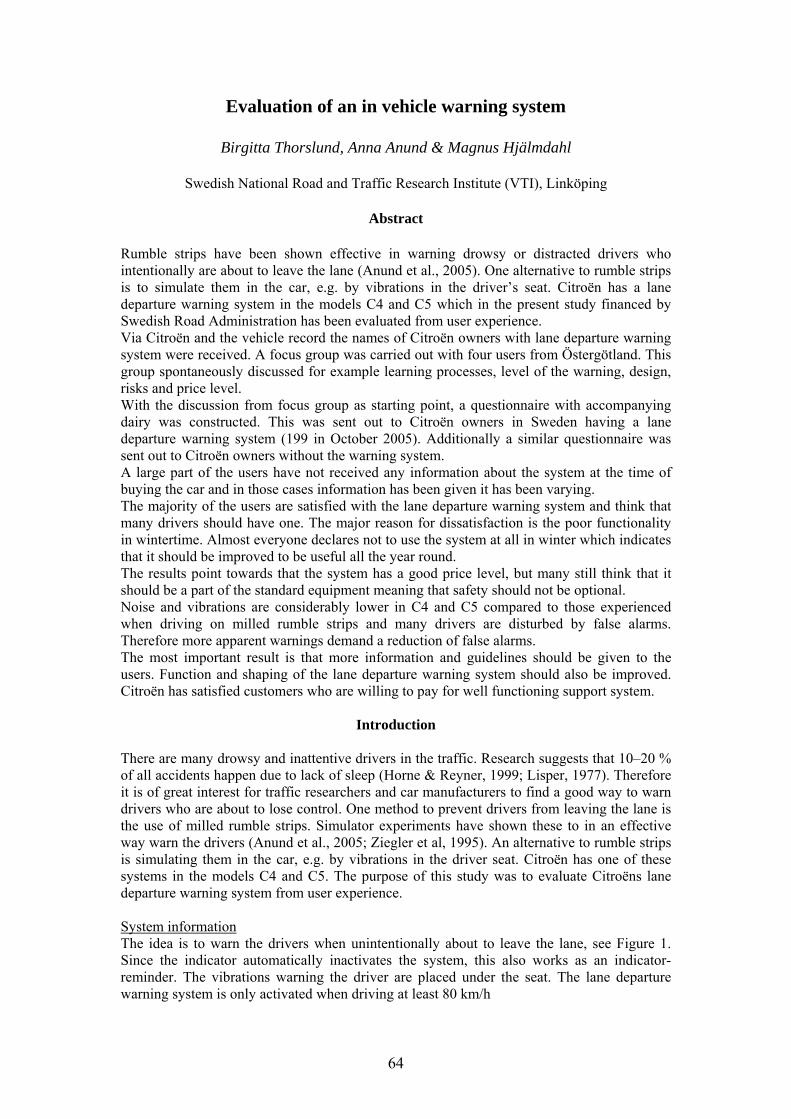
Evaluation of an in vehicle warning system
Birgitta Thorslund, Anna Anund & Magnus Hjälmdahl
Swedish National Road and Traffic Research Institute (VTI), Linköping
Abstract Rumble strips have been shown effective in warning drowsy or distracted drivers who intentionally are about to leave the lane (Anund et al., 2005). One alternative to rumble strips is to simulate them in the car, e.g. by vibrations in the driver’s seat. Citroën has a lane departure warning system in the models C4 and C5 which in the present study financed by Swedish Road Administration has been evaluated from user experience. Via Citroën and the vehicle record the names of Citroën owners with lane departure warning system were received. A focus group was carried out with four users from Östergötland. This group spontaneously discussed for example learning processes, level of the warning, design, risks and price level. With the discussion from focus group as starting point, a questionnaire with accompanying dairy was constructed. This was sent out to Citroën owners in Sweden having a lane departure warning system (199 in October 2005). Additionally a similar questionnaire was sent out to Citroën owners without the warning system. A large part of the users have not received any information about the system at the time of buying the car and in those cases information has been given it has been varying. The majority of the users are satisfied with the lane departure warning system and think that many drivers should have one. The major reason for dissatisfaction is the poor functionality in wintertime. Almost everyone declares not to use the system at all in winter which indicates that it should be improved to be useful all the year round. The results point towards that the system has a good price level, but many still think that it should be a part of the standard equipment meaning that safety should not be optional. Noise and vibrations are considerably lower in C4 and C5 compared to those experienced when driving on milled rumble strips and many drivers are disturbed by false alarms. Therefore more apparent warnings demand a reduction of false alarms. The most important result is that more information and guidelines should be given to the users. Function and shaping of the lane departure warning system should also be improved. Citroën has satisfied customers who are willing to pay for well functioning support system.
Introduction There are many drowsy and inattentive drivers in the traffic. Research suggests that 10–20 % of all accidents happen due to lack of sleep (Horne & Reyner, 1999; Lisper, 1977). Therefore it is of great interest for traffic researchers and car manufacturers to find a good way to warn drivers who are about to lose control. One method to prevent drivers from leaving the lane is the use of milled rumble strips. Simulator experiments have shown these to in an effective way warn the drivers (Anund et al., 2005; Ziegler et al, 1995). An alternative to rumble strips is simulating them in the car, e.g. by vibrations in the driver seat. Citroën has one of these systems in the models C4 and C5. The purpose of this study was to evaluate Citroëns lane departure warning system from user experience. System information The idea is to warn the drivers when unintentionally about to leave the lane, see Figure 1. Since the indicator automatically inactivates the system, this also works as an indicator- reminder. The vibrations warning the driver are placed under the seat. The lane departure warning system is only activated when driving at least 80 km/h
64
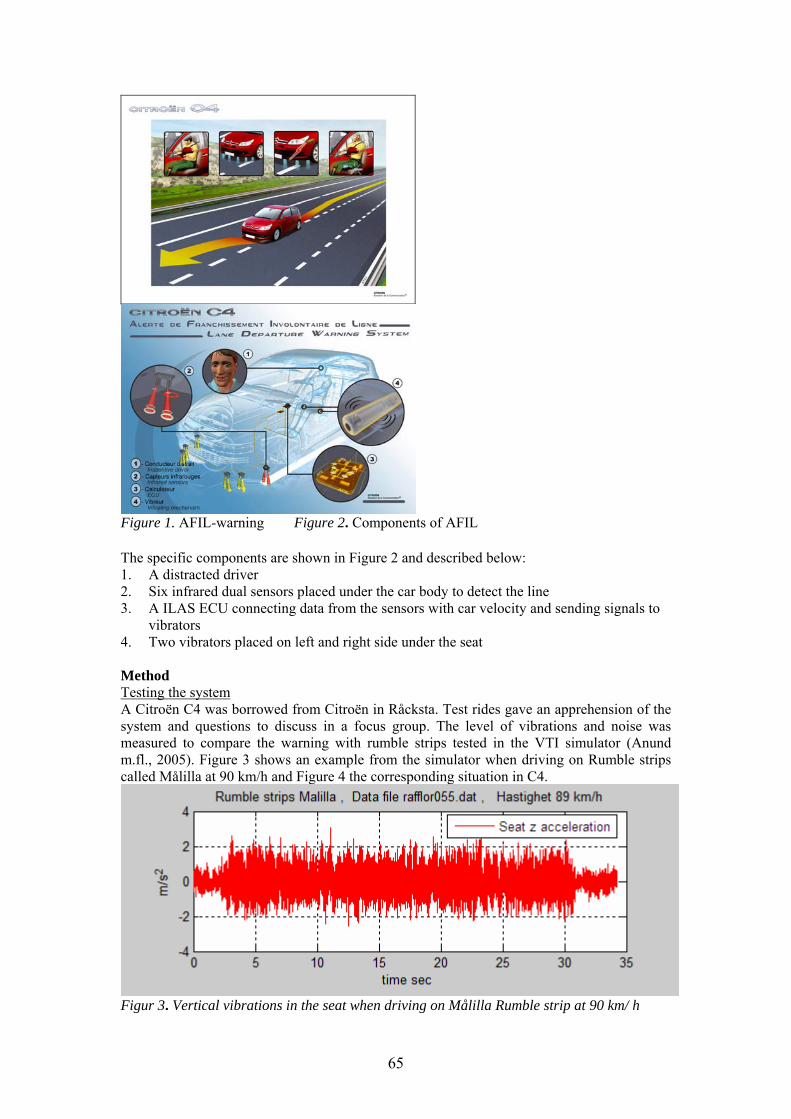
Figure 1. AFIL-warning Figure 2. Components of AFIL The specific components are shown in Figure 2 and described below: 1. A distracted driver 2. Six infrared dual sensors placed under the car body to detect the line 3. A ILAS ECU connecting data from the sensors with car velocity and sending signals to
vibrators 4. Two vibrators placed on left and right side under the seat Method Testing the system A Citroën C4 was borrowed from Citroën in Råcksta. Test rides gave an apprehension of the system and questions to discuss in a focus group. The level of vibrations and noise was measured to compare the warning with rumble strips tested in the VTI simulator (Anund m.fl., 2005). Figure 3 shows an example from the simulator when driving on Rumble strips called Målilla at 90 km/h and Figure 4 the corresponding situation in C4.
Figur 3. Vertical vibrations in the seat when driving on Målilla Rumble strip at 90 km/ h
65
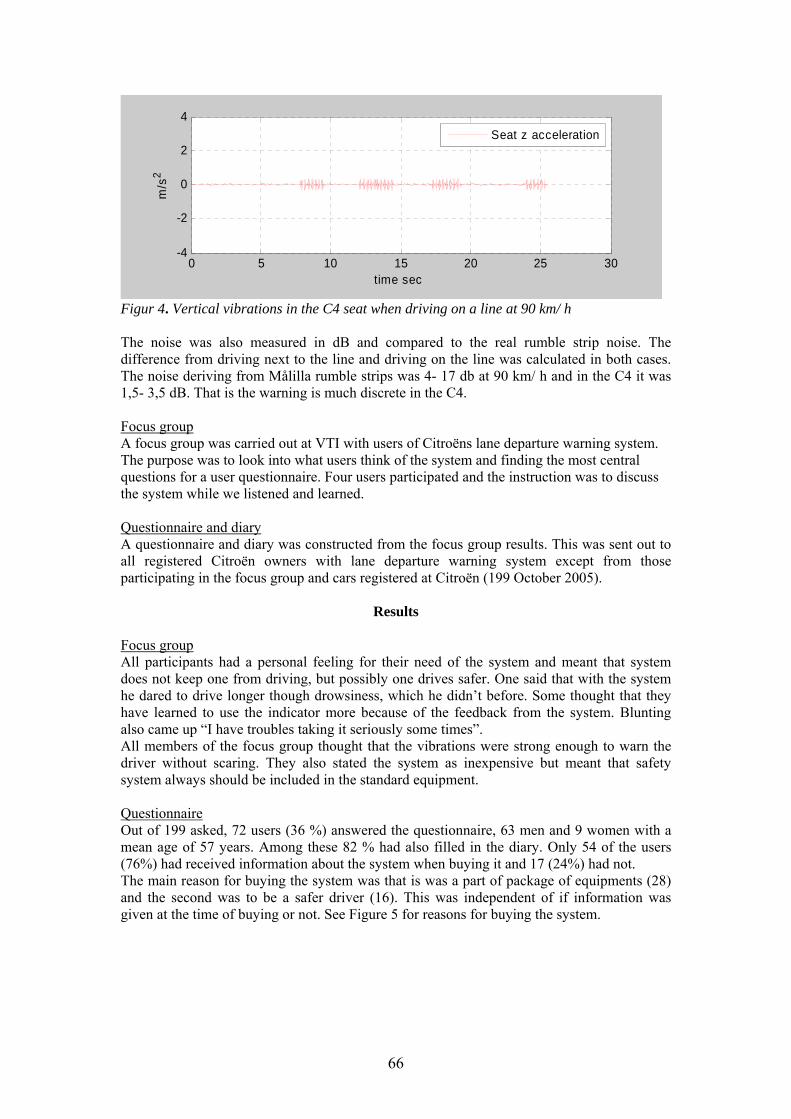
0 5 10 15 20 25 30-4
-2
0
2
4
time sec
m/s
2
Seat z acceleration
Figur 4. Vertical vibrations in the C4 seat when driving on a line at 90 km/ h The noise was also measured in dB and compared to the real rumble strip noise. The difference from driving next to the line and driving on the line was calculated in both cases. The noise deriving from Målilla rumble strips was 4- 17 db at 90 km/ h and in the C4 it was 1,5- 3,5 dB. That is the warning is much discrete in the C4. Focus group A focus group was carried out at VTI with users of Citroëns lane departure warning system. The purpose was to look into what users think of the system and finding the most central questions for a user questionnaire. Four users participated and the instruction was to discuss the system while we listened and learned. Questionnaire and diary A questionnaire and diary was constructed from the focus group results. This was sent out to all registered Citroën owners with lane departure warning system except from those participating in the focus group and cars registered at Citroën (199 October 2005).
Results Focus group All participants had a personal feeling for their need of the system and meant that system does not keep one from driving, but possibly one drives safer. One said that with the system he dared to drive longer though drowsiness, which he didn’t before. Some thought that they have learned to use the indicator more because of the feedback from the system. Blunting also came up “I have troubles taking it seriously some times”. All members of the focus group thought that the vibrations were strong enough to warn the driver without scaring. They also stated the system as inexpensive but meant that safety system always should be included in the standard equipment. Questionnaire Out of 199 asked, 72 users (36 %) answered the questionnaire, 63 men and 9 women with a mean age of 57 years. Among these 82 % had also filled in the diary. Only 54 of the users (76%) had received information about the system when buying it and 17 (24%) had not. The main reason for buying the system was that is was a part of package of equipments (28) and the second was to be a safer driver (16). This was independent of if information was given at the time of buying or not. See Figure 5 for reasons for buying the system.
66
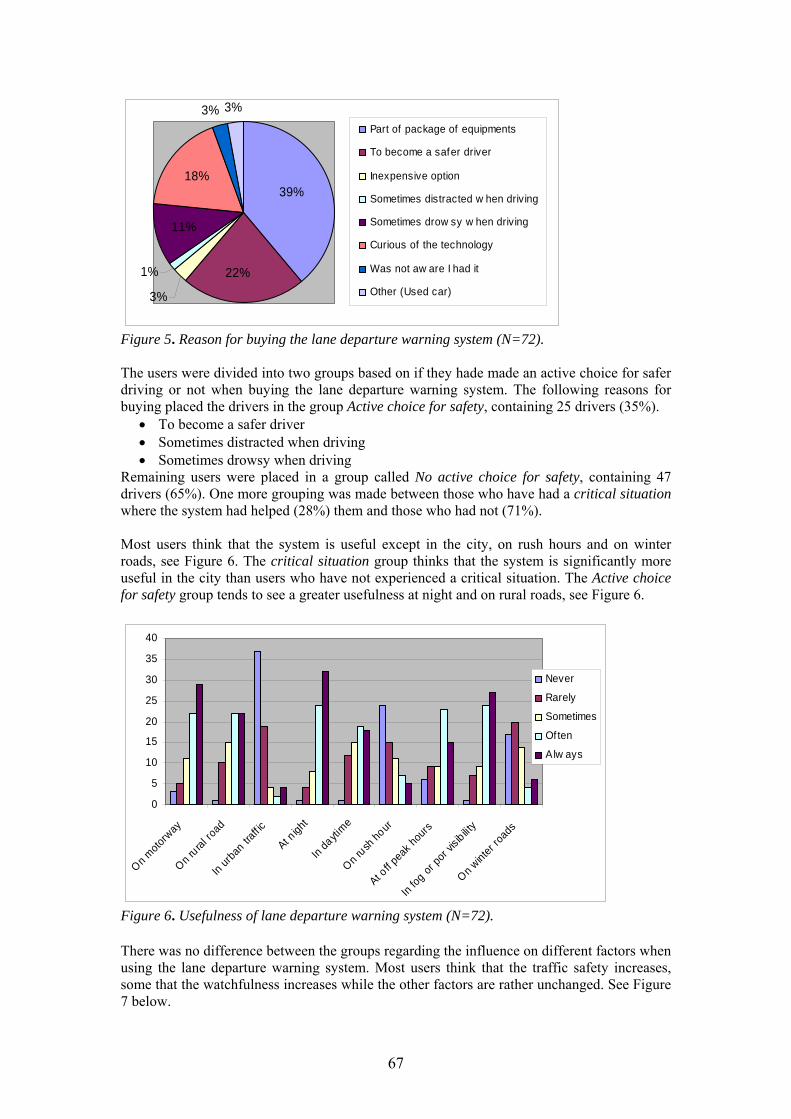
3%
1%
3% 3%
39%
22%
11%
18%
Part of package of equipments
To become a safer driver
Inexpensive option
Sometimes distracted w hen driving
Sometimes drow sy w hen driving
Curious of the technology
Was not aw are I had it
Other (Used car)
Figure 5. Reason for buying the lane departure warning system (N=72). The users were divided into two groups based on if they hade made an active choice for safer driving or not when buying the lane departure warning system. The following reasons for buying placed the drivers in the group Active choice for safety, containing 25 drivers (35%).
• To become a safer driver • Sometimes distracted when driving • Sometimes drowsy when driving
Remaining users were placed in a group called No active choice for safety, containing 47 drivers (65%). One more grouping was made between those who have had a critical situation where the system had helped (28%) them and those who had not (71%). Most users think that the system is useful except in the city, on rush hours and on winter roads, see Figure 6. The critical situation group thinks that the system is significantly more useful in the city than users who have not experienced a critical situation. The Active choice for safety group tends to see a greater usefulness at night and on rural roads, see Figure 6.
0
5
10
15
20
25
30
35
40
On moto
rway
On ru ral
road
In urb
an tra
ff ic
At nigh
t
In da
ytime
On rush
hour
At off p
eak ho
urs
In fog
or po
r visib
ility
On winter
road
s
Never
Rarely
Sometimes
Often
Alw ays
Figure 6. Usefulness of lane departure warning system (N=72). There was no difference between the groups regarding the influence on different factors when using the lane departure warning system. Most users think that the traffic safety increases, some that the watchfulness increases while the other factors are rather unchanged. See Figure 7 below.
67
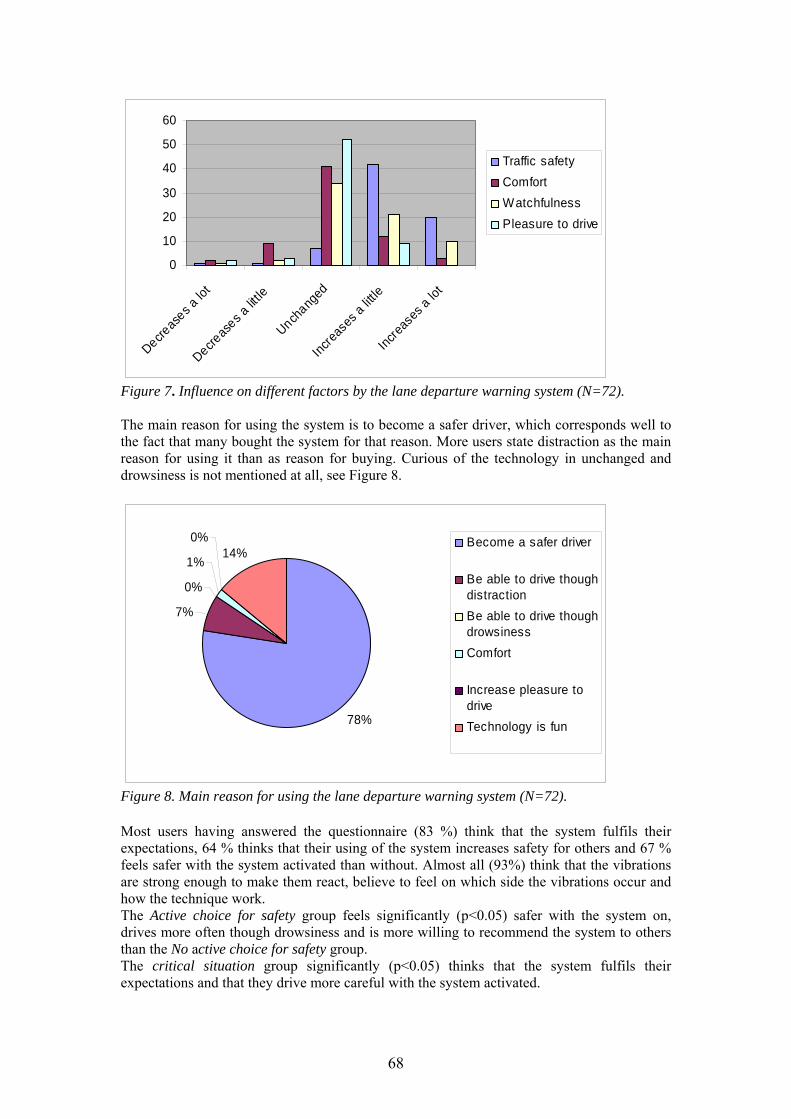
0
10
20
30
40
50
60
Decreas
es a lo
t
Decreas
es a lit
tle
Unchang
ed
Increa
ses a
little
Increa
ses a
lot
Traffic safetyComfortWatchfulnessPleasure to drive
Figure 7. Influence on different factors by the lane departure warning system (N=72). The main reason for using the system is to become a safer driver, which corresponds well to the fact that many bought the system for that reason. More users state distraction as the main reason for using it than as reason for buying. Curious of the technology in unchanged and drowsiness is not mentioned at all, see Figure 8.
78%
7%
0%
1%
0%14%
Become a safer driver
Be able to drive thoughdistractionBe able to drive thoughdrowsinessComfort
Increase pleasure todriveTechnology is fun
Figure 8. Main reason for using the lane departure warning system (N=72). Most users having answered the questionnaire (83 %) think that the system fulfils their expectations, 64 % thinks that their using of the system increases safety for others and 67 % feels safer with the system activated than without. Almost all (93%) think that the vibrations are strong enough to make them react, believe to feel on which side the vibrations occur and how the technique work. The Active choice for safety group feels significantly (p<0.05) safer with the system on, drives more often though drowsiness and is more willing to recommend the system to others than the No active choice for safety group. The critical situation group significantly (p<0.05) thinks that the system fulfils their expectations and that they drive more careful with the system activated.
68
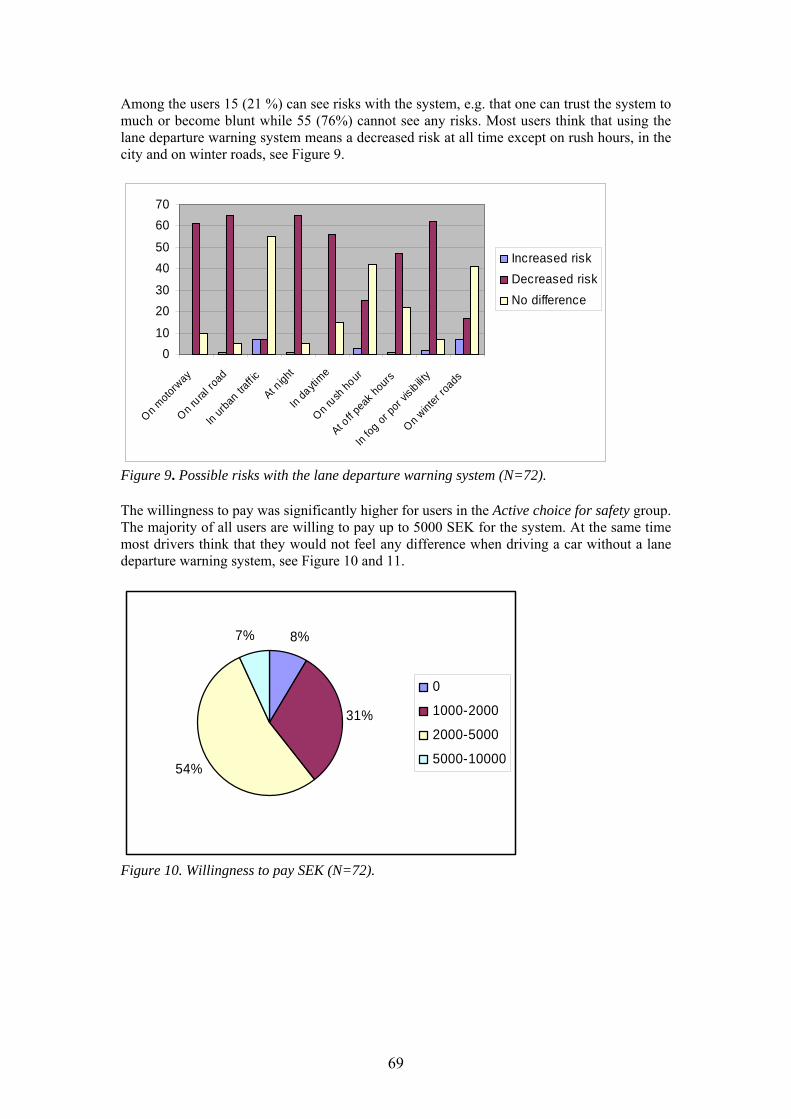
Among the users 15 (21 %) can see risks with the system, e.g. that one can trust the system to much or become blunt while 55 (76%) cannot see any risks. Most users think that using the lane departure warning system means a decreased risk at all time except on rush hours, in the city and on winter roads, see Figure 9.
010
2030
4050
6070
On moto
rway
On ru ral
road
In urb
an tra
ff ic
At nigh
t
In da
ytime
On rush
hour
At off p
eak h
ours
In fog
or po
r visib
ility
On wint
er roa
ds
Increased riskDecreased riskNo difference
Figure 9. Possible risks with the lane departure warning system (N=72). The willingness to pay was significantly higher for users in the Active choice for safety group. The majority of all users are willing to pay up to 5000 SEK for the system. At the same time most drivers think that they would not feel any difference when driving a car without a lane departure warning system, see Figure 10 and 11.
8%
31%
54%
7%
0
1000-2000
2000-5000
5000-10000
Figure 10. Willingness to pay SEK (N=72).
69
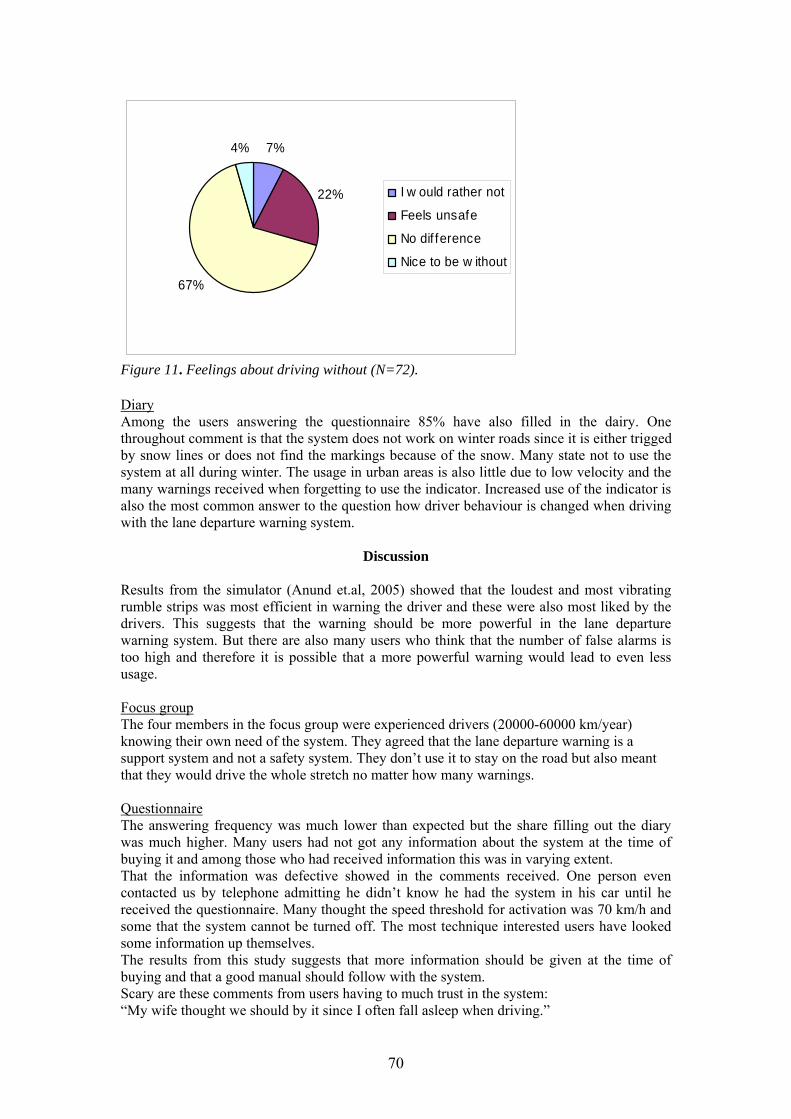
7%
22%
67%
4%
I w ould rather not
Feels unsafe
No dif ference
Nice to be w ithout
Figure 11. Feelings about driving without (N=72). Diary Among the users answering the questionnaire 85% have also filled in the dairy. One throughout comment is that the system does not work on winter roads since it is either trigged by snow lines or does not find the markings because of the snow. Many state not to use the system at all during winter. The usage in urban areas is also little due to low velocity and the many warnings received when forgetting to use the indicator. Increased use of the indicator is also the most common answer to the question how driver behaviour is changed when driving with the lane departure warning system.
Discussion Results from the simulator (Anund et.al, 2005) showed that the loudest and most vibrating rumble strips was most efficient in warning the driver and these were also most liked by the drivers. This suggests that the warning should be more powerful in the lane departure warning system. But there are also many users who think that the number of false alarms is too high and therefore it is possible that a more powerful warning would lead to even less usage. Focus group The four members in the focus group were experienced drivers (20000-60000 km/year) knowing their own need of the system. They agreed that the lane departure warning is a support system and not a safety system. They don’t use it to stay on the road but also meant that they would drive the whole stretch no matter how many warnings. Questionnaire The answering frequency was much lower than expected but the share filling out the diary was much higher. Many users had not got any information about the system at the time of buying it and among those who had received information this was in varying extent. That the information was defective showed in the comments received. One person even contacted us by telephone admitting he didn’t know he had the system in his car until he received the questionnaire. Many thought the speed threshold for activation was 70 km/h and some that the system cannot be turned off. The most technique interested users have looked some information up themselves. The results from this study suggests that more information should be given at the time of buying and that a good manual should follow with the system. Scary are these comments from users having to much trust in the system: “My wife thought we should by it since I often fall asleep when driving.”
70
“I activate the system for the 200 last kilometres when driving to Spain.” “Now I can drive long stretches even without my wife.” Most users are satisfied with the system and think that everybody should have one. The most common reason for dissatisfaction is the bad function in winter. Almost everyone states not using the lane departure warning system in winter time, which is severe, especially in a country where it is winter a great part of the year. This indicates that the system should be further developed to function all year around. The fact that users don’t think that lane departure warning system makes any difference in urban areas, on rush hours or on winter roads corresponds well to that the system does not work there. The results indicates a good price level but many think that safety should not be an option and therefore systems like this should be included in the standard equipment. Diary There is a lot of data loss in the diaries since many do not use the system at all on winter roads. This would have looked different if the study had been made another time of the year, but then maybe the result that many users are dissatisfied with the function in winter would have fell out. Conclusions The users think that the lane departure warning system is useful when it works and does not give to many false warnings. Many are prepared to pay much more than it costs even if they actually think that it should be a part of the standard equipment. The recommendations to Citroën are:
• The lane departure warning system is a good idea which can be even better if further developed.
• Give your customers good information and a user manual with recommendations and advice.
• There are many satisfied customers willing to pay for good warning system.
References
Anund, A., Hjälmdahl, M., Sehammar, H., Palmqvist, G., & Thorslund, B. (2005). Placement and design of milled rumble strips on centre line and shoulder (No. VTI rapport 523A). Linköping. VTI.
Horne, J.A. & Reyner, L.A. (1999). Vehicle accidents related to sleep: a review. Occupationel and Environmental Medicine 56(5): 289–294.
Lisper, H-O.(1977). Trötthet i trafiken: En empirisk och teoretisk översikt. SOU 2: 229–284.
71
Constraint Recognition and State Space Representation in Collaborative Distributed Command and Control
Rogier Woltjer1, Kip Smith2 & Erik Hollnagel1
1Cognitive Systems Engineering Laboratory, Department of Computer and information
Science, Linköping University, Sweden 2Division of Industrial Ergonomics, Department of Mechanical Engineering
Linköping University, Sweden
Abstract
This paper describes a method for the recognition of constraints in network-based command and control, and illustrates its application in a command and control microworld. The method uses modeling of functions and functional resonance (FRAM) to extract the essential variables that describe the behavior of a command and control team and the process it attempts to control. It juxtaposes these variables in state space representations illustrating constraints and regions for opportunities for action. Examples show how state space plots of C3Fire microworld data can aid in the description of behavior vis-à-vis constraints, and discusses how state space representations may be used to improve control in network-based command and control settings. Keywords: Constraints, command and control, emergency management, functional modeling, FRAM.
Introduction
Command and control is in a phase of change. Both civilian emergency managers and military commanders seek to implement network-based organizations. The drive for network-based command and control stems from the identification of coordination problems in complex environments that resist solution by traditional hierarchic command structures (Brehmer & Sundin, 2000; Cebrowski & Garstka, 1998). For example, civilian agencies want to improve inter-agency coordination (Smith & Dowell, 2000) and the military wants to overcome problems with combat power and speed. Moreover, joint operations by a growing number of (international) civilian agencies and military services are often required suggesting that a new range of technical and social problems is emerging. This situation presents a challenge to studies of network-based command and control. Two of the challenges are (1) how to describe and model joint behavior, and (2) how to design information technology that supports network-based command and control. In this paper we address these challenges by outlining a method for analysis of joint behavior using constraints and opportunities for action represented in state spaces. The method is meant to inform the design of information technology to be used in network-based command-and-control centers. Our research goal is to develop and verify a methodology to identify constraints generated by the actions of distributed collaborative decision makers. By addressing this goal, we aim to provide insight in distributed collaborative command and control in dynamic network-based settings. Understanding how constraints shape action of joint cognitive systems contributes to the science of network-based command and control and to the design of systems that support command and control. In this paper we restrict our analysis to the management of emergency situations in distributed collaborative command and control. Command and control and decision making The design of any support system is necessarily based on the model that the designers have of the task that is to be supported. Sometimes this model is only a chimera in the designers’
72
minds. It would be distinctly preferable if they were to analyze the task they mean to support in detail, so that their design of their tool could be based on an explicit and well-informed model. Moreover, their design would benefit if they were to envision how their design will change the task and whether it will serve the actual purpose of the joint system that it is designed for (Hollnagel & Woods, 2005). The modeling of command and control and decision making is therefore a critical precursor of the design of support systems. Diverse research traditions including, but not limited to, cognitive systems engineering, and decision making address the modeling of command and control. Here we offer a selective review of several models linking control, command and control, and decision making. Joint command and control systems We adhere to the paradigm of cognitive systems engineering (CSE; Hollnagel & Woods, 2005). Cognitive systems engineering addresses questions such as how to make use of the power of contemporary technology to facilitate human cognition, how to understand the interactions between humans and technologies, and how to aid design and evaluation of digital artifacts. Related to distributed cognition (Hollan et al., 2000) and macrocognition (Klein et al., 2003), CSE takes an ecological view regarding the importance of the context when addressing cognition. It focuses on constraints that are external to the cognitive system (present in the environment) rather than on the internal constraints (memory limitations, etc.) that are foci of the information processing perspective. The unit of analysis in cognitive systems engineering is the ‘joint cognitive system.’ A cognitive system (Hollnagel & Woods, 2005) is a system that can control its goal-directed behavior on the basis of experience. The term ‘joint cognitive system’ (Hollnagel & Woods, 2005) means that control is accomplished by an ensemble of cognitive systems and (physical and social) artifacts that exhibit goal-directed behavior. In the areas of interest to cognitive systems engineering, typically one or several persons (controllers) and one or several support systems constitute a joint cognitive system which is typically engaged in some sort of process control in a complex environment. An early account of modern command and control centers is provided by Adelson (1961), who describes decisions in what he called ‘command control centers’. He states that “command centers are typically nodes in networks constituting command control systems” (Adelson, 1961, p. 726). Furthermore, he demonstrates problem-driven joint systems thinking in that he emphasizes the importance of the objectives of technological improvement of command centers based on the real needs of “the assemblage of men and machines that constitute the system” (Adelson, 1961, p. 729). The dynamics of decision making and control Researchers often associate command and control with decision making. The term ‘decision making’ refers to a mental process that precedes the execution of action. The classical prescriptive model of the decision making process is normative decision theory. According to this theory, decision making includes four sequential steps: the generation of all possible options for action, independent assessments of the probability and utility of each option, and the selection of the option with the highest expected utility (see e.g. Von Neumann & Morgenstern, 1953). Although normative decision theory has proven to be difficult to apply to dynamic, complex environments like command and control (Brehmer, 1992; Hollnagel, 1993, 1999; Klein & Calderwood, 1991), it has dominated the ‘expert system’ paradigm for decision support systems. Like normative decision theory generally, decision support systems based on the option generation and evaluation paradigm can perform well only in limited, well-defined and predictable domains. Predictably, they are typically inappropriate for network-based command and control, because the underlying model of ‘decision making’ does not fit the distributed nature of the task. The literature is replete with reports about the pervasively negative consequences of support systems based on decision theoretic designs including, but not limited to, lack of user acceptance, brittle performance when faced with unanticipated
73
novelty, users’ over-reliance on the machine’s ‘expertise,’ and biasing users’ cognitive and decision processes (Bainbridge, 1983; Dekker & Woods, 1999, 2002; Hollnagel, 1999; Hollnagel & Woods, 2005; Roth et al., 1997). Fortunately, alternative models have emerged that are more appropriate for command and control applications. Numerous studies of decision makers in so-called ‘naturalistic’ settings have lead to a model of ‘recognition-primed decision making’ (e.g., Klein & Calderwood, 1991). Its critical insight is that ‘decision makers’ in naturalistic settings actually don’t make decisions and only rarely consider more than one option. Adequate recognition and simulation of the situation are thus the keys to successful ‘decision making’ according to this model. A second approach is called ‘dynamic decision making’ (Brehmer, 1992). This approach focuses on the functions served by decision making in order to gain control, or to achieve some desired state of affairs, rather than on the decisions themselves. This approach describes decision making as the intersection of two control processes: (1) the system that the decision maker aims to control and (2) the means for achieving control. The second process is used to control the first. The third approach to modeling that we review are the models that form the foundations of cognitive systems engineering (CSE, Hollnagel & Woods, 2005): (1) the cyclic model of action as it is performed by joint cognitive systems, (2) a contextual control model (COCOM), and (3) the extended control model (ECOM) of cognitive systems engineering. The cyclical model of human action is the heart of cognitive systems engineering, and is based on Neisser’s (1976) perceptual cycle. This model, also called CAEC loop, basically states that an operator’s current understanding (or construct, C) directs the operator’s next action. This action (A) produces some information or feedback. This information (or event, E) modifies the operator’s current understanding, etc. Event evaluation and action often occur in an intermingled or iterative fashion. The control principle is based on the idea that behavior towards goals, and thereby control, is a combination of feedback (compensatory) and feedforward (anticipatory) control. The four simultaneous control loops in ECOM range in their character on a gradual scale from short-term compensatory control to long-term anticipatory control. Control support through the recognition of constraints The cognitive systems engineering view on intelligent decision support for process control is highly influenced by the principle that a joint cognitive system controls its behavior to achieve its goals. The focus is on action rather than decision. Rather than supporting decision making, cognitive systems engineering aims to support actions of joint cognitive systems directed at gaining and maintaining control. Supporting control means supporting the evaluation of the situation and anticipation of future events, the selection of action, and the performance of action, as well as ensuring that the time available for actions is sufficient (Hollnagel & Woods, 2005). These reflections result in the cognitive systems engineering view that states: “From the joint cognitive system perspective, the intelligence in decision support lies not in the machine itself (the tool), but in the tool builder and in the tool user.” (Woods, 1986, p. 173). In the many tasks where the option generation and evaluation paradigm of intelligent decision support systems seems inappropriate, other ways of supporting the joint cognitive system to gain and maintain control may be found. For the domain of air traffic control, Dekker & Woods (1999) mention an alternative form of supporting controllers: “In one situation, controllers suggested that telling aircraft in general where not to go was an easier (and sufficient) intervention than telling each individual where to go” (p. 94). This statement suggests that operators may sufficiently be informed about the constraints on their actions, rather than all possible actions. Fundamental similarities between the air traffic control and command and control tasks indicate that this idea may transfer well to the command and control domain. Similarly, the approach to decision support that we are currently investigating is to support control through recognition of constraints.
74
The constraint concept has been discussed in a command and control context. As a result of a study employing grounded theory, Persson (1997) defines command and control as “the enduring management of internal and external constraints by actors in an organization in order to achieve imposed and internal goals” (p. 131). He argues that the core of command and control is “constraint management”, and defines constraint as something that is an obstacle to action or goal-achievement. Persson indicates the importance of the recognition, resolution, and thereby management of constraints in command and control. Constraints and their representation The concept ‘constraint’ has been addressed by scientists from a variety of disciplines and perspectives and has implications for cognitive systems engineering (Ashby, 1956; Checkland, 1981; Gibson, 1986; Hollnagel & Woods, 2005; Reitman, 1964; Vicente, 1999; Vicente & Rasmussen, 1992; Woods, 1995). Combining these perspectives we define constraint as either a limit on goal-directed behavior, or an opportunity for goal-directed behavior, or both. Constraints are invariably described as essential factors in the functioning of (cognitive) systems. This work addresses constraints explicitly in the analysis of behavior of joint cognitive systems. In CSE constraints are said to shape the selection of appropriate action (Hollnagel & Woods, 2005). Similarly, the related disciplines of cybernetics and systems theory consider the concept of constraint to be of major importance, because constraints facilitate control. Woods (1986) emphasizes the importance of spatial representations when providing support to controllers. In this paper we develop the visualization of constraints as the support strategy. Representation design (Woods, 1995) and ecological interface design (Vicente & Rasmussen, 1992), offer design guidelines concerned with constraint: Decision support systems should facilitate the discovery of constraints, represent constraints in a way that makes the possibilities for action and resolution evident, and highlight the time-dependency of constraints. One representation scheme for such discovery is the state space. State space representation is a graphic method for representing the change in state of process variables over time (Ashby, 1960; Stappers & Flach, 2004). The variables are represented by the axes of a coordinate system. States are defined by points in the space. Time is represented implicitly by the traces of states through the space. Recent work in cognitive systems engineering, human factors, and ergonomics reflects a renewed interest in the state space representation. The metaphor of state spaces has recently been described as “that of the cartographer’s map, showing a landscape with roads and pitfalls, mountains and rivers, i.e., opportunities and threats, but leaving the reader’s mind free to roam and imagine developing states and possible routes through the territory” (Stappers & Flach, 2004, p. 825). A method for the recognition of constraints From the discussion above, we can conclude that constraints are acknowledged in work practice and described in the literature to shape action and enable control, and that being aware of constraints is essential for process controllers. However, in complex and dynamic environments where constraints continually change, where people have to work collaboratively and where information and people are distributed, keeping abreast of all relevant constraints can be difficult. To address this difficulty, this paper investigates a method for recognizing constraints in process control tasks. The method is intended to become part of the support systems that Brehmer & Sundin (2000) and Cebrowski & Garstka (1998) envision. The method has three steps, which are discussed in turn.
(1) The first step in the method is a functional resonance analysis of the joint cognitive system’s process control task. The analysis is conducted by (or in consultation with) a domain
75
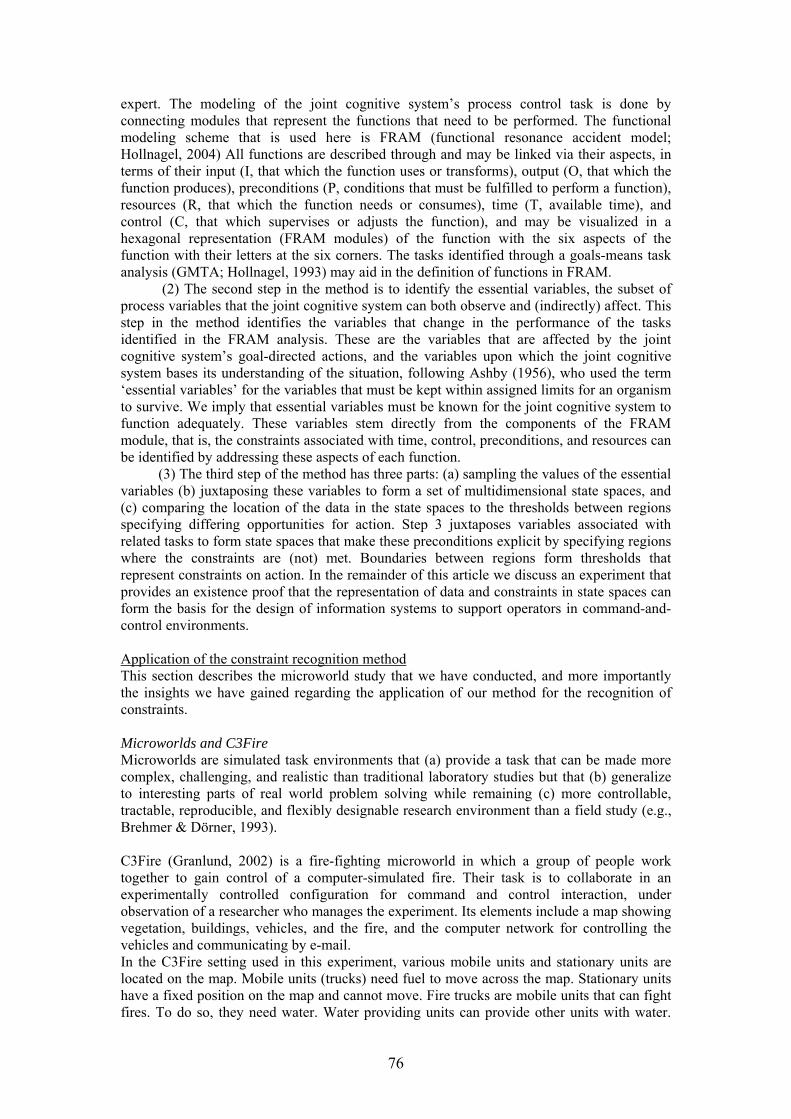
expert. The modeling of the joint cognitive system’s process control task is done by connecting modules that represent the functions that need to be performed. The functional modeling scheme that is used here is FRAM (functional resonance accident model; Hollnagel, 2004) All functions are described through and may be linked via their aspects, in terms of their input (I, that which the function uses or transforms), output (O, that which the function produces), preconditions (P, conditions that must be fulfilled to perform a function), resources (R, that which the function needs or consumes), time (T, available time), and control (C, that which supervises or adjusts the function), and may be visualized in a hexagonal representation (FRAM modules) of the function with the six aspects of the function with their letters at the six corners. The tasks identified through a goals-means task analysis (GMTA; Hollnagel, 1993) may aid in the definition of functions in FRAM.
(2) The second step in the method is to identify the essential variables, the subset of process variables that the joint cognitive system can both observe and (indirectly) affect. This step in the method identifies the variables that change in the performance of the tasks identified in the FRAM analysis. These are the variables that are affected by the joint cognitive system’s goal-directed actions, and the variables upon which the joint cognitive system bases its understanding of the situation, following Ashby (1956), who used the term ‘essential variables’ for the variables that must be kept within assigned limits for an organism to survive. We imply that essential variables must be known for the joint cognitive system to function adequately. These variables stem directly from the components of the FRAM module, that is, the constraints associated with time, control, preconditions, and resources can be identified by addressing these aspects of each function.
(3) The third step of the method has three parts: (a) sampling the values of the essential variables (b) juxtaposing these variables to form a set of multidimensional state spaces, and (c) comparing the location of the data in the state spaces to the thresholds between regions specifying differing opportunities for action. Step 3 juxtaposes variables associated with related tasks to form state spaces that make these preconditions explicit by specifying regions where the constraints are (not) met. Boundaries between regions form thresholds that represent constraints on action. In the remainder of this article we discuss an experiment that provides an existence proof that the representation of data and constraints in state spaces can form the basis for the design of information systems to support operators in command-and-control environments.
Application of the constraint recognition method This section describes the microworld study that we have conducted, and more importantly the insights we have gained regarding the application of our method for the recognition of constraints. Microworlds and C3Fire Microworlds are simulated task environments that (a) provide a task that can be made more complex, challenging, and realistic than traditional laboratory studies but that (b) generalize to interesting parts of real world problem solving while remaining (c) more controllable, tractable, reproducible, and flexibly designable research environment than a field study (e.g., Brehmer & Dörner, 1993). C3Fire (Granlund, 2002) is a fire-fighting microworld in which a group of people work together to gain control of a computer-simulated fire. Their task is to collaborate in an experimentally controlled configuration for command and control interaction, under observation of a researcher who manages the experiment. Its elements include a map showing vegetation, buildings, vehicles, and the fire, and the computer network for controlling the vehicles and communicating by e-mail. In the C3Fire setting used in this experiment, various mobile units and stationary units are located on the map. Mobile units (trucks) need fuel to move across the map. Stationary units have a fixed position on the map and cannot move. Fire trucks are mobile units that can fight fires. To do so, they need water. Water providing units can provide other units with water.
76
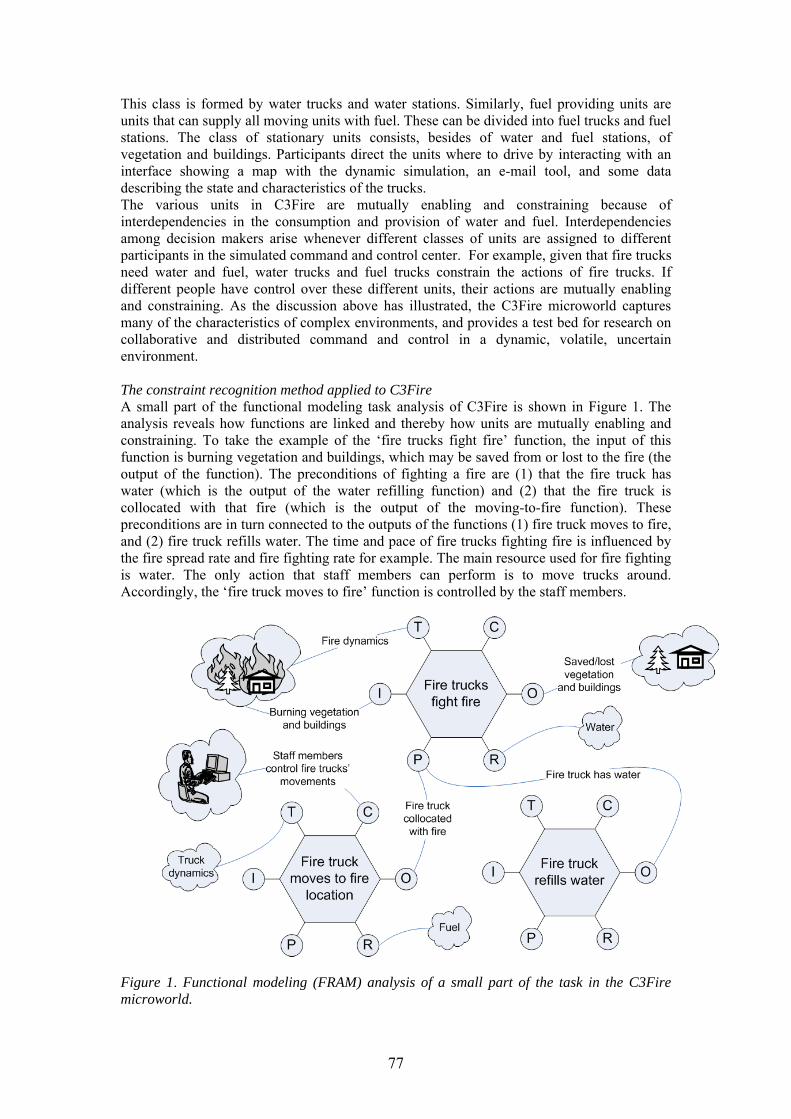
This class is formed by water trucks and water stations. Similarly, fuel providing units are units that can supply all moving units with fuel. These can be divided into fuel trucks and fuel stations. The class of stationary units consists, besides of water and fuel stations, of vegetation and buildings. Participants direct the units where to drive by interacting with an interface showing a map with the dynamic simulation, an e-mail tool, and some data describing the state and characteristics of the trucks. The various units in C3Fire are mutually enabling and constraining because of interdependencies in the consumption and provision of water and fuel. Interdependencies among decision makers arise whenever different classes of units are assigned to different participants in the simulated command and control center. For example, given that fire trucks need water and fuel, water trucks and fuel trucks constrain the actions of fire trucks. If different people have control over these different units, their actions are mutually enabling and constraining. As the discussion above has illustrated, the C3Fire microworld captures many of the characteristics of complex environments, and provides a test bed for research on collaborative and distributed command and control in a dynamic, volatile, uncertain environment. The constraint recognition method applied to C3Fire A small part of the functional modeling task analysis of C3Fire is shown in Figure 1. The analysis reveals how functions are linked and thereby how units are mutually enabling and constraining. To take the example of the ‘fire trucks fight fire’ function, the input of this function is burning vegetation and buildings, which may be saved from or lost to the fire (the output of the function). The preconditions of fighting a fire are (1) that the fire truck has water (which is the output of the water refilling function) and (2) that the fire truck is collocated with that fire (which is the output of the moving-to-fire function). These preconditions are in turn connected to the outputs of the functions (1) fire truck moves to fire, and (2) fire truck refills water. The time and pace of fire trucks fighting fire is influenced by the fire spread rate and fire fighting rate for example. The main resource used for fire fighting is water. The only action that staff members can perform is to move trucks around. Accordingly, the ‘fire truck moves to fire’ function is controlled by the staff members.
Figure 1. Functional modeling (FRAM) analysis of a small part of the task in the C3Fire microworld.
77
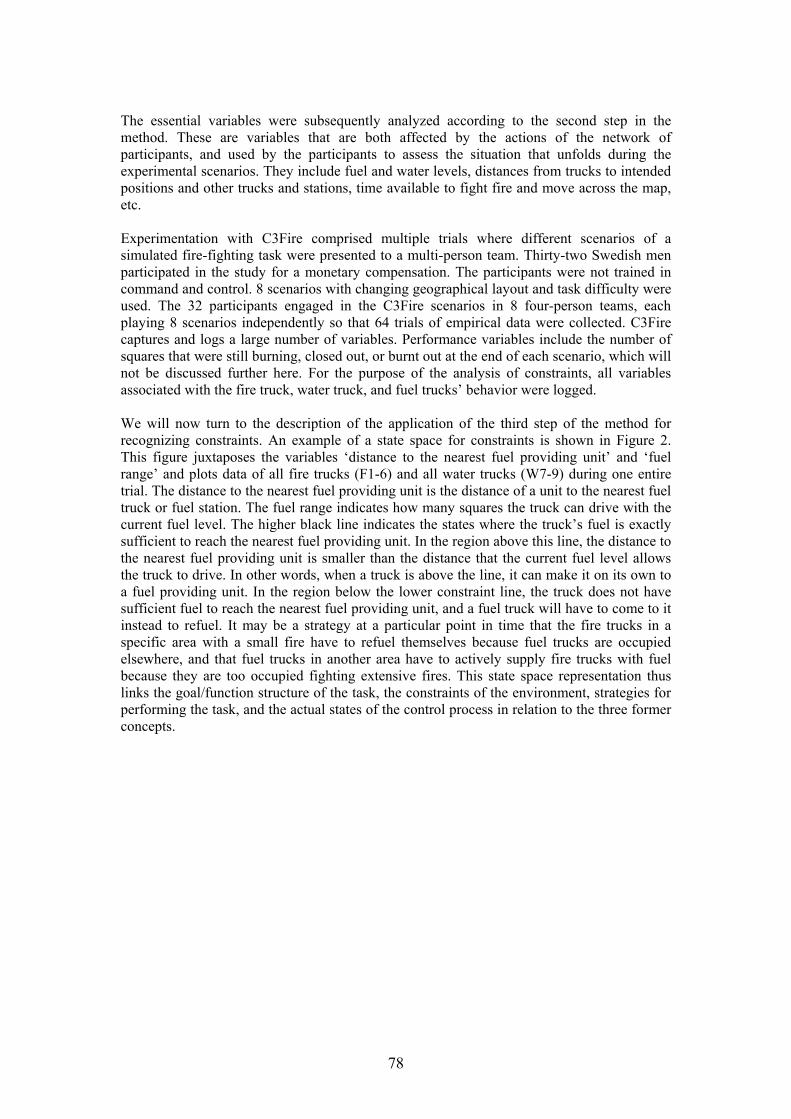
The essential variables were subsequently analyzed according to the second step in the method. These are variables that are both affected by the actions of the network of participants, and used by the participants to assess the situation that unfolds during the experimental scenarios. They include fuel and water levels, distances from trucks to intended positions and other trucks and stations, time available to fight fire and move across the map, etc.
Experimentation with C3Fire comprised multiple trials where different scenarios of a simulated fire-fighting task were presented to a multi-person team. Thirty-two Swedish men participated in the study for a monetary compensation. The participants were not trained in command and control. 8 scenarios with changing geographical layout and task difficulty were used. The 32 participants engaged in the C3Fire scenarios in 8 four-person teams, each playing 8 scenarios independently so that 64 trials of empirical data were collected. C3Fire captures and logs a large number of variables. Performance variables include the number of squares that were still burning, closed out, or burnt out at the end of each scenario, which will not be discussed further here. For the purpose of the analysis of constraints, all variables associated with the fire truck, water truck, and fuel trucks’ behavior were logged. We will now turn to the description of the application of the third step of the method for recognizing constraints. An example of a state space for constraints is shown in Figure 2. This figure juxtaposes the variables ‘distance to the nearest fuel providing unit’ and ‘fuel range’ and plots data of all fire trucks (F1-6) and all water trucks (W7-9) during one entire trial. The distance to the nearest fuel providing unit is the distance of a unit to the nearest fuel truck or fuel station. The fuel range indicates how many squares the truck can drive with the current fuel level. The higher black line indicates the states where the truck’s fuel is exactly sufficient to reach the nearest fuel providing unit. In the region above this line, the distance to the nearest fuel providing unit is smaller than the distance that the current fuel level allows the truck to drive. In other words, when a truck is above the line, it can make it on its own to a fuel providing unit. In the region below the lower constraint line, the truck does not have sufficient fuel to reach the nearest fuel providing unit, and a fuel truck will have to come to it instead to refuel. It may be a strategy at a particular point in time that the fire trucks in a specific area with a small fire have to refuel themselves because fuel trucks are occupied elsewhere, and that fuel trucks in another area have to actively supply fire trucks with fuel because they are too occupied fighting extensive fires. This state space representation thus links the goal/function structure of the task, the constraints of the environment, strategies for performing the task, and the actual states of the control process in relation to the three former concepts.
78
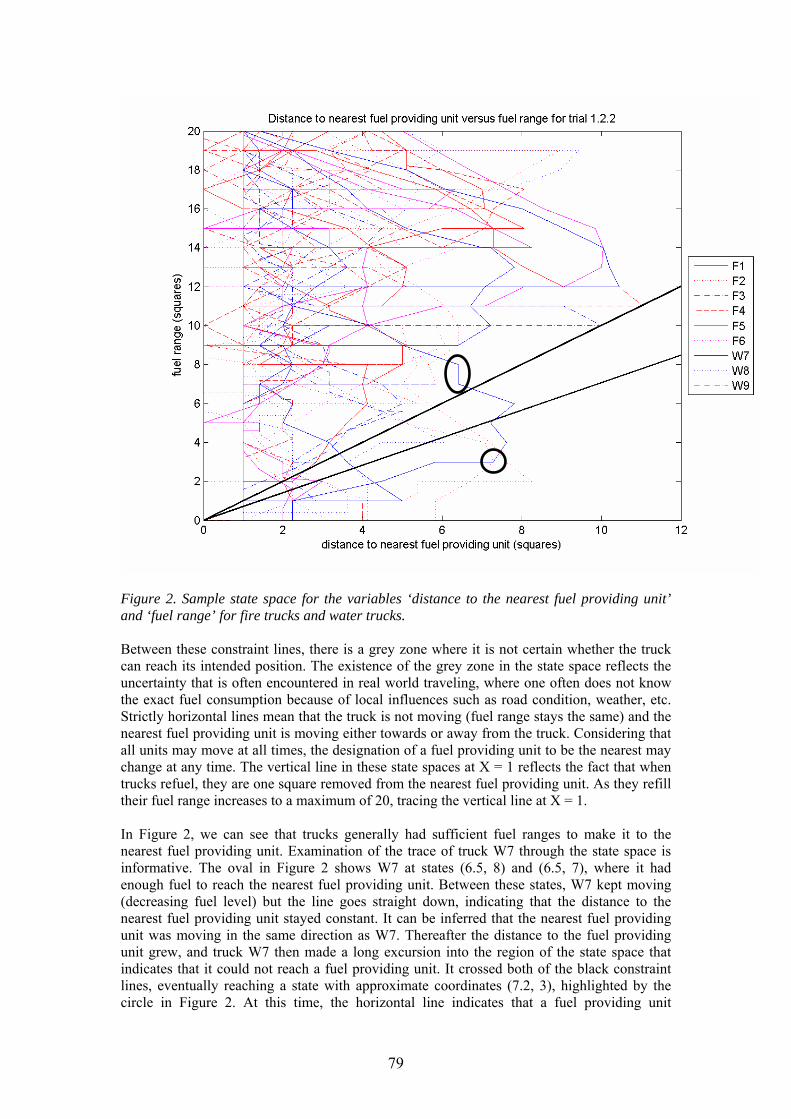
Figure 2. Sample state space for the variables ‘distance to the nearest fuel providing unit’ and ‘fuel range’ for fire trucks and water trucks. Between these constraint lines, there is a grey zone where it is not certain whether the truck can reach its intended position. The existence of the grey zone in the state space reflects the uncertainty that is often encountered in real world traveling, where one often does not know the exact fuel consumption because of local influences such as road condition, weather, etc. Strictly horizontal lines mean that the truck is not moving (fuel range stays the same) and the nearest fuel providing unit is moving either towards or away from the truck. Considering that all units may move at all times, the designation of a fuel providing unit to be the nearest may change at any time. The vertical line in these state spaces at X = 1 reflects the fact that when trucks refuel, they are one square removed from the nearest fuel providing unit. As they refill their fuel range increases to a maximum of 20, tracing the vertical line at X = 1. In Figure 2, we can see that trucks generally had sufficient fuel ranges to make it to the nearest fuel providing unit. Examination of the trace of truck W7 through the state space is informative. The oval in Figure 2 shows W7 at states (6.5, 8) and (6.5, 7), where it had enough fuel to reach the nearest fuel providing unit. Between these states, W7 kept moving (decreasing fuel level) but the line goes straight down, indicating that the distance to the nearest fuel providing unit stayed constant. It can be inferred that the nearest fuel providing unit was moving in the same direction as W7. Thereafter the distance to the fuel providing unit grew, and truck W7 then made a long excursion into the region of the state space that indicates that it could not reach a fuel providing unit. It crossed both of the black constraint lines, eventually reaching a state with approximate coordinates (7.2, 3), highlighted by the circle in Figure 2. At this time, the horizontal line indicates that a fuel providing unit
79
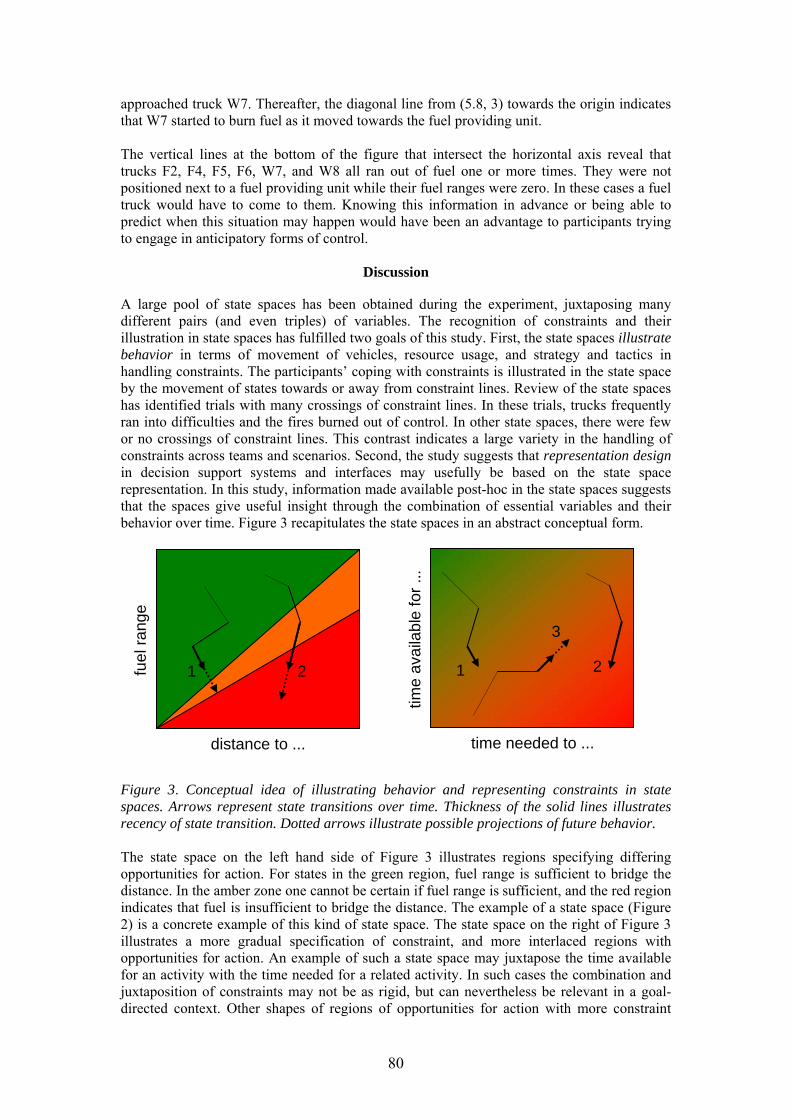
approached truck W7. Thereafter, the diagonal line from (5.8, 3) towards the origin indicates that W7 started to burn fuel as it moved towards the fuel providing unit. The vertical lines at the bottom of the figure that intersect the horizontal axis reveal that trucks F2, F4, F5, F6, W7, and W8 all ran out of fuel one or more times. They were not positioned next to a fuel providing unit while their fuel ranges were zero. In these cases a fuel truck would have to come to them. Knowing this information in advance or being able to predict when this situation may happen would have been an advantage to participants trying to engage in anticipatory forms of control.
Discussion
A large pool of state spaces has been obtained during the experiment, juxtaposing many different pairs (and even triples) of variables. The recognition of constraints and their illustration in state spaces has fulfilled two goals of this study. First, the state spaces illustrate behavior in terms of movement of vehicles, resource usage, and strategy and tactics in handling constraints. The participants’ coping with constraints is illustrated in the state space by the movement of states towards or away from constraint lines. Review of the state spaces has identified trials with many crossings of constraint lines. In these trials, trucks frequently ran into difficulties and the fires burned out of control. In other state spaces, there were few or no crossings of constraint lines. This contrast indicates a large variety in the handling of constraints across teams and scenarios. Second, the study suggests that representation design in decision support systems and interfaces may usefully be based on the state space representation. In this study, information made available post-hoc in the state spaces suggests that the spaces give useful insight through the combination of essential variables and their behavior over time. Figure 3 recapitulates the state spaces in an abstract conceptual form.
fuel
rang
e
distance to ...
1 2
time
avai
labl
e fo
r ...
time needed to ...
1 2
3
Figure 3. Conceptual idea of illustrating behavior and representing constraints in state spaces. Arrows represent state transitions over time. Thickness of the solid lines illustrates recency of state transition. Dotted arrows illustrate possible projections of future behavior. The state space on the left hand side of Figure 3 illustrates regions specifying differing opportunities for action. For states in the green region, fuel range is sufficient to bridge the distance. In the amber zone one cannot be certain if fuel range is sufficient, and the red region indicates that fuel is insufficient to bridge the distance. The example of a state space (Figure 2) is a concrete example of this kind of state space. The state space on the right of Figure 3 illustrates a more gradual specification of constraint, and more interlaced regions with opportunities for action. An example of such a state space may juxtapose the time available for an activity with the time needed for a related activity. In such cases the combination and juxtaposition of constraints may not be as rigid, but can nevertheless be relevant in a goal-directed context. Other shapes of regions of opportunities for action with more constraint
80
lines combined may be identified in the future, as they have been reported in the literature in other domains. State spaces form a very powerful representation. They can combine essential variables to form meaningful ensembles that are relevant to the goals of command and control. A value of an essential variable may not be informative in itself, but in the context of other variables and commander’s goals, meaning is added. Thus, the visually lucid nature of state spaces lets their observer interpret the values of essential variables in a goal-directed context. State spaces rearrange data in a way that facilitates situation assessment and extraction of meaning, leaving the cognitive work and interpretation of data to the human controller, and thus avoiding the pitfalls of automation. The detection of problems in the form of 'violations' of constraints and direction of attention at these problems are also likely to benefit from methods and representations that recognize constraints. The fact that a constraint is not adhered to may be part of people's strategy to cope with the unfolding situation, it may however also indicate undetected problems that require attention in order to adapt to unexpected circumstances and/or replan. Future research on the use of representations of constraint in displays will have to show how these representations may be best fitted to actual work practice. Acknowledgement
The Swedish Defense Material Administration is gratefully acknowledged for supporting this research.
References
Adelson, M. (1961). Human decisions in command control centers. Annals of the New York Academy of Sciences, 89, 726-731.
Ashby, W. R. (1956). An introduction to cybernetics (Internet (1999) ed.). London: Chapman & Hall. http://pcp.vub.ac.be/books/IntroCyb.pdf .
Ashby, W. R. (1960). Design for a brain: The origin of adaptive behavior (2nd (revised) ed.). London: Chapman & Hall Ltd.
Bainbridge, L. (1983). Ironies of automation. Automatica, 19(6), 775-779. Brehmer, B. (1992). Dynamic decision making: Human control of complex systems. Acta
Psychologica, 81, 211-241. Brehmer, B., & Dörner, D. (1993). Experiments with computer-simulated microworlds:
Escaping both the narrow straits of the laboratory and the deep blue sea of the field study. Computers in Human Behavior, 9(2-3), 171-184.
Brehmer, B., & Sundin, C. (2000). Command and control in network-centric warfare. In C. Sundin & H. Friman (Eds.), ROLF 2010 - the way ahead and the first step (pp. 45-54). Stockholm: The Swedish National Defence College.
Cebrowski, A. K., & Garstka, J. J. (1998). Network-centric warfare: Its origin and future. US Naval Institute Proceedings, January, 28-35.
Checkland, P. (1981). Systems thinking, systems practice. Chichester: John Wiley & Sons. Dekker, S. W. A., & Woods, D. D. (1999). To intervene or not to intervene: The dilemma of
management by exception. Cognition, Technology & Work, 1(2), 86-96. Dekker, S. W. A., & Woods, D. D. (2002). Maba-maba or abracadabra? Progress on human–
automation co-ordination. Cognition, Technology & Work, 4(4), 240-244. Gibson, J. J. (1986). The ecological approach to visual perception. Hillsdale, NJ: Lawrence
Erlbaum Associates. Granlund, R. (2002). Monitoring distributed teamwork training. Unpublished PhD Thesis,
Linköpings universitet, Linköping. Hollan, J., Hutchins, E., & Kirsch, D. (2000). Distributed cognition: Toward a new
foundation for human-computer interaction research. ACM Transactions on Computer-Human Interaction, 7(2), 174-196.
81
Hollnagel, E. (1993). Human reliability analysis: Context and control. London; San Diego, CA: Academic Press.
Hollnagel, E. (1999). From function allocation to function congruence. In S. Dekker & E. Hollnagel (Eds.), Coping with computers in the cockpit (pp. 29-53). Aldershot: Ashgate.
Hollnagel, E. (2004). Barriers and accident prevention. Mahwah, NJ: Lawrence Erlbaum Associates, Publishers.
Hollnagel, E., & Woods, D. D. (2005). Joint cognitive systems: Foundations of cognitive systems engineering. Boca Raton, FL: CRC Press.
Klein, G. A., & Calderwood, R. (1991). Decision models: Some lessons from the field. IEEE Transactions on Systems, Man and Cybernetics, 21(5), 1018-1026.
Klein, G. A., Ross, K. G., Moon, B. M., Klein, D. E., Hoffman, R. R., & Hollnagel, E. (2003). Macrocognition. IEEE Intelligent Systems, 18(3), 81-85.
Neisser, U. (1976). Cognition and reality: Principles and implications of cognitive psychology. San Francisco, CA: W. H. Freeman and Company.
Persson, P.-A. (1997). Toward a grounded theory for support of command and control in military coalitions. Unpublished Licentiate Thesis, Linköpings universitet, Linköping, Sweden.
Reitman, W., R. (1964). Heuristic decision procedures, open constraints, and the structure of ill-defined problems. In M. W. Shelly II & G. L. Bryan (Eds.), Human judgments and optimality (pp. 282-315). New York: John Wiley & Sons, Inc.
Roth, E. M., Malin, J. T., & Schreckenghost, D. L. (1997). Paradigms for intelligent interface design. In M. Helander, T. K. Landauer & P. Prabhu (Eds.), Handbook of human-computer interaction (2nd ed., pp. 1177-1201). Amsterdam: Elsevier Science.
Smith, W., & Dowell, J. (2000). A case study of co-ordinative decision-making in disaster management. Ergonomics, 43(8), 1153-1166.
Stappers, P. J., & Flach, J. M. (2004). Visualizing cognitive systems: Getting past block diagrams. Paper presented at the IEEE International Conference on Systems, Man & Cybernetics, The Hague, The Netherlands.
Vicente, K. J. (1999). Cognitive work analysis: Towards safe, productive, and healthy computer-based work. Mahwah, NJ: Lawrence Erlbaum Associates.
Vicente, K. J., & Rasmussen, J. (1992). Ecological interface design: Theoretical foundations. IEEE Transactions on Systems, Man and Cybernetics, 22(4), 589-606.
Von Neumann, J., & Morgenstern, O. (1953). Theory of games and economic behavior (3rd ed.). Princeton, NJ: Princeton University Press. Original 1944.
Woods, D. D. (1986). Paradigms for intelligent decision support. In E. Hollnagel, G. Mancini & D. D. Woods (Eds.), Intelligent decision support in process environments (pp. 153-173). Berlin: Springer-Verlag.
Woods, D. D. (1995). Toward a theoretical base for representation design in the computer medium: Ecological perception and aiding human cognition. In J. Flach, P. Hancock, J. Caird & K. Vicente (Eds.), Global perspectives on the ecology of human-machine systems (pp. 157-188). Hillsdale, NJ: Lawrence Erlbaum Associates, Publishers.
82
A Systemic Functional Resonance Analysis of the Alaska Airlines Flight 261 Accident
Rogier Woltjer
Cognitive Systems Engineering Laboratory, Department of Computer and Information
Science, Linköping University
Abstract
On January 31, 2000, Alaska Airlines flight 261, an MD-83, crashed into the Pacific Ocean, after airplane pitch control was lost as a result of the in-flight failure of the horizontal stabilizer trim system jackscrew assembly's acme nut threads (NTSB, 2003). Accident investigation revealed a wide range of human, technical, and organizational factors contributing to this tragic event. In his recent book on barriers and accident prevention, Hollnagel (2004) describes a systemic method for barrier analysis and a systemic Functional Resonance Accident Model (FRAM). This paper treats each of the main categories of contributing factors that are identified in the systemic Functional Resonance Accident Model (FRAM): Impaired or missing barriers, latent conditions, technological failures, and human performance variability. It moreover discusses how resonance occurred between the functional entities in the joint system of human, technical, and organizational systems. It thereby aims to facilitate a better understanding of how unexpected consequences of design, certification, limited and inadequate maintenance, negligent safety culture, economic factors, and human performance together can contribute to accidents. In this way it aims to contribute to accident prevention and the engineering of more resilient complex dynamic systems. Keywords: Accidents, aviation maintenance, safety, functional modelling, functional resonance, FRAM.
Introduction
On the 31st of January, 2000, Alaska Airlines flight 261, an MD-83, crashed into the Pacific killing all 88 persons on board. Accident investigation (NTSB, 2003) revealed a wide range of human, technical, and organizational factors contributing to this tragic event. To be able to prevent accidents, they need to be understood as deeply as possible. As scholars have recently argued, the event-chain models of accident causation, and the view on safety as a hunt for human error, do not suffice to be able to model and understand the complex nature of contemporary accidents, and more ‘systemic’ models of accidents and safety are necessary (Amalberti, 2001; Dekker, 2004; Hollnagel, 2004; Leveson, 2004; Rochlin, 1999; Woods & Cook, 2002). Systemic models treat safety as an emergent property of systems as a whole, and try to find systemic vulnerabilities rather than flawed components of a system. After describing the accident in more detail, one such systemic accident model is applied in this paper to the facts and findings that the NTSB (2003) reported after their investigation and analysis. The accident model that is applied is the Functional Resonance Accident Model (FRAM; Hollnagel, 2004), which is presented and used in an attempt to understand and model the Alaska Airlines Flight 261 accident. This paper thereby serves the following two purposes: (1) to describe, model and thereby understand why the factors contributing to the accident as identified by the NTSB could manifest themselves as they did, (2) to familiarize with and assess the applicability of the Functional Resonance Accident Model. Alaska Airlines Flight 261 This section presents relevant factual information for this report. First, the MD-80 series horizontal stabilizer jackscrew assembly is explained in a simple way, to give the reader some
83
elementary background information about the normal functioning of the parts that sustained mechanical failure during the accident. Second, the executive summary of the NTSB is quoted for a summary of the accident and the contributing factors identified by the NTSB. The MD-80 horizontal stabilizer jackscrew assembly The stabilizer of the MD-80 series consists of a horizontal pivoting wing mounted on top of the vertical tail fin of the aircraft. The horizontal stabilizer directs the pitch (nose-up/-down) of the aircraft. The horizontal wing rotates around the horizontal stabilizer aft hinge point at the back of the horizontal stabilizer, so that if the front of the horizontal stabilizer is down, it presses the tail down, and thereby the nose of the airplane up. The back edge of the horizontal stabilizer is the elevator, which the (auto-) pilot uses to control the aircraft pitch. The whole horizontal stabilizer can be trimmed to set the wings to a ‘default’ air flow so that the nose pitch can be adjusted to the centre of gravity of the aircraft. The horizontal stabilizer and its trim tabs can be controlled by the autopilot, and by the pilot with the flight controls and switches in the cockpit. This helps the pilots because it makes the controls lighter to handle, and by adjusting the trim the pilots do not need to pull or push the control column to compensate for a centre of gravity that has moved to the front or to the back because of the aircraft’s changing load. A jackscrew assembly at the front of the horizontal stabilizer moves the front of the horizontal wing up and down. Inside the front of the vertical stabilizer attached to the horizontal stabilizer front spar attach bracket there are two motors (primary and alternate) rotating an acme screw. This screw rotates in an acme nut that is attached to the vertical stabilizer, thus moving the horizontal stabilizer up and down. The screw and the nut both have two threads each. There are both electrical and mechanical stops (the latter at more outward positions than the former) to prevent the screw from rotating beyond a certain point. Beyond a certain horizontal stabilizer position, the elevators cannot compensate for the upward or downward pressure of the stabilizer. There are maximum downward and maximum upward positions for the horizontal stabilizer, ensuring that the (auto-) pilot can still control the pitch of the aircraft with the elevators. Furthermore, the threads on screw and nut need to be lubricated to avoid excessive wear. This wear is checked during so-called end play checks, where an inspector and a mechanic check the possibility for movement between screw thread and nut thread, which is a direct measurement for wear. NTSB Accident Report Executive Summary The executive summary of the National Transportation Safety Board's accident report gives an outline of the probable causes of the accident in the eyes of the NTSB: “The National Transportation Safety Board determines that the probable cause of this accident was a loss of airplane pitch control resulting from the in-flight failure of the horizontal stabilizer trim system jackscrew assembly's acme nut threads. The thread failure was caused by excessive wear resulting from Alaska Airlines' insufficient lubrication of the jackscrew assembly. Contributing to the accident were Alaska Airlines' extended lubrication interval and the Federal Aviation Administration's (FAA) approval of that extension, which increased the likelihood that a missed or inadequate lubrication would result in excessive wear of the acme nut threads, and Alaska Airlines' extended end play check interval and the FAA's approval of that extension, which allowed the excessive wear of the acme nut threads to progress to failure without the opportunity for detection. Also contributing to the accident was the absence on the McDonnell Douglas MD-80 of a fail-safe mechanism to prevent the catastrophic effects of total acme nut thread loss.” (NTSB, 2003, p. xii)
Functional Resonance Accident Model In his recent book on barriers and accident prevention, Hollnagel (2004) describes Functional Resonance (as a systemic) Accident Model with the acronym FRAM. The essential components of the model are presented in Figure 1 below. The following subsections go
84
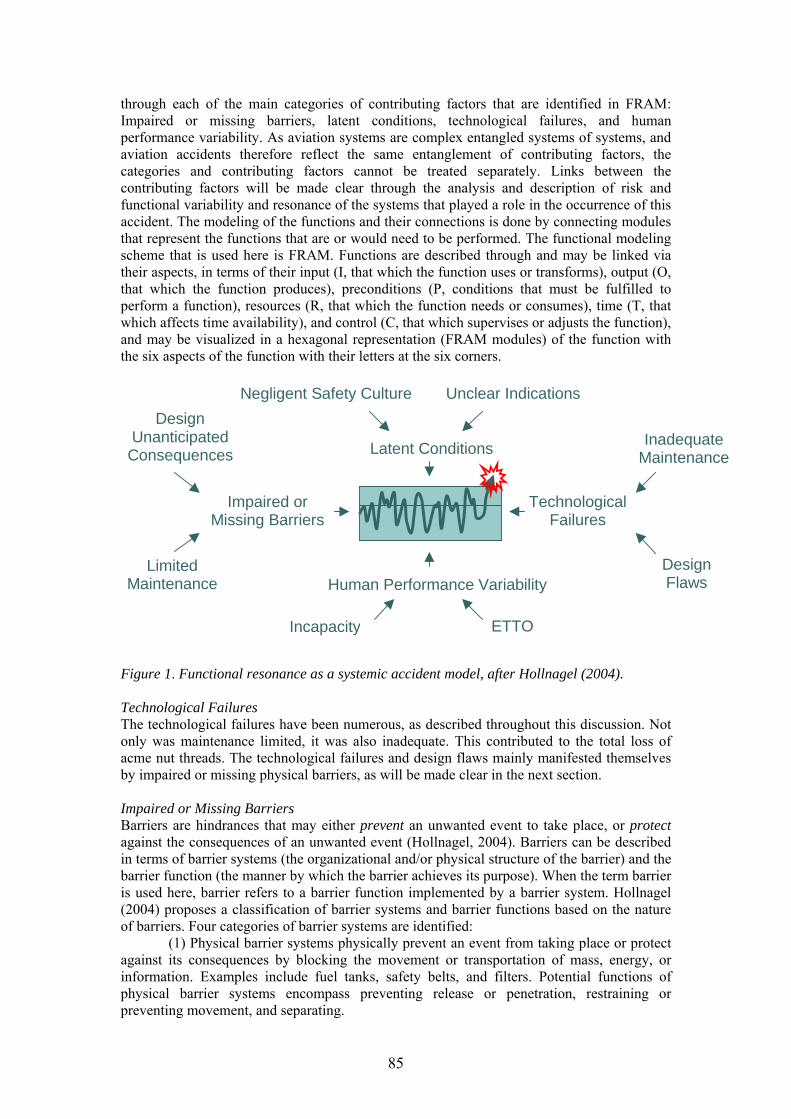
through each of the main categories of contributing factors that are identified in FRAM: Impaired or missing barriers, latent conditions, technological failures, and human performance variability. As aviation systems are complex entangled systems of systems, and aviation accidents therefore reflect the same entanglement of contributing factors, the categories and contributing factors cannot be treated separately. Links between the contributing factors will be made clear through the analysis and description of risk and functional variability and resonance of the systems that played a role in the occurrence of this accident. The modeling of the functions and their connections is done by connecting modules that represent the functions that are or would need to be performed. The functional modeling scheme that is used here is FRAM. Functions are described through and may be linked via their aspects, in terms of their input (I, that which the function uses or transforms), output (O, that which the function produces), preconditions (P, conditions that must be fulfilled to perform a function), resources (R, that which the function needs or consumes), time (T, that which affects time availability), and control (C, that which supervises or adjusts the function), and may be visualized in a hexagonal representation (FRAM modules) of the function with the six aspects of the function with their letters at the six corners.
Negligent Safety Culture Unclear Indications
Latent Conditions
Human Performance Variability
Impaired or Missing Barriers
TechnologicalFailures
InadequateMaintenance
DesignFlaws
Incapacity ETTO
Design Unanticipated Consequences
Limited Maintenance
Figure 1. Functional resonance as a systemic accident model, after Hollnagel (2004). Technological Failures The technological failures have been numerous, as described throughout this discussion. Not only was maintenance limited, it was also inadequate. This contributed to the total loss of acme nut threads. The technological failures and design flaws mainly manifested themselves by impaired or missing physical barriers, as will be made clear in the next section. Impaired or Missing Barriers Barriers are hindrances that may either prevent an unwanted event to take place, or protect against the consequences of an unwanted event (Hollnagel, 2004). Barriers can be described in terms of barrier systems (the organizational and/or physical structure of the barrier) and the barrier function (the manner by which the barrier achieves its purpose). When the term barrier is used here, barrier refers to a barrier function implemented by a barrier system. Hollnagel (2004) proposes a classification of barrier systems and barrier functions based on the nature of barriers. Four categories of barrier systems are identified:
(1) Physical barrier systems physically prevent an event from taking place or protect against its consequences by blocking the movement or transportation of mass, energy, or information. Examples include fuel tanks, safety belts, and filters. Potential functions of physical barrier systems encompass preventing release or penetration, restraining or preventing movement, and separating.
85
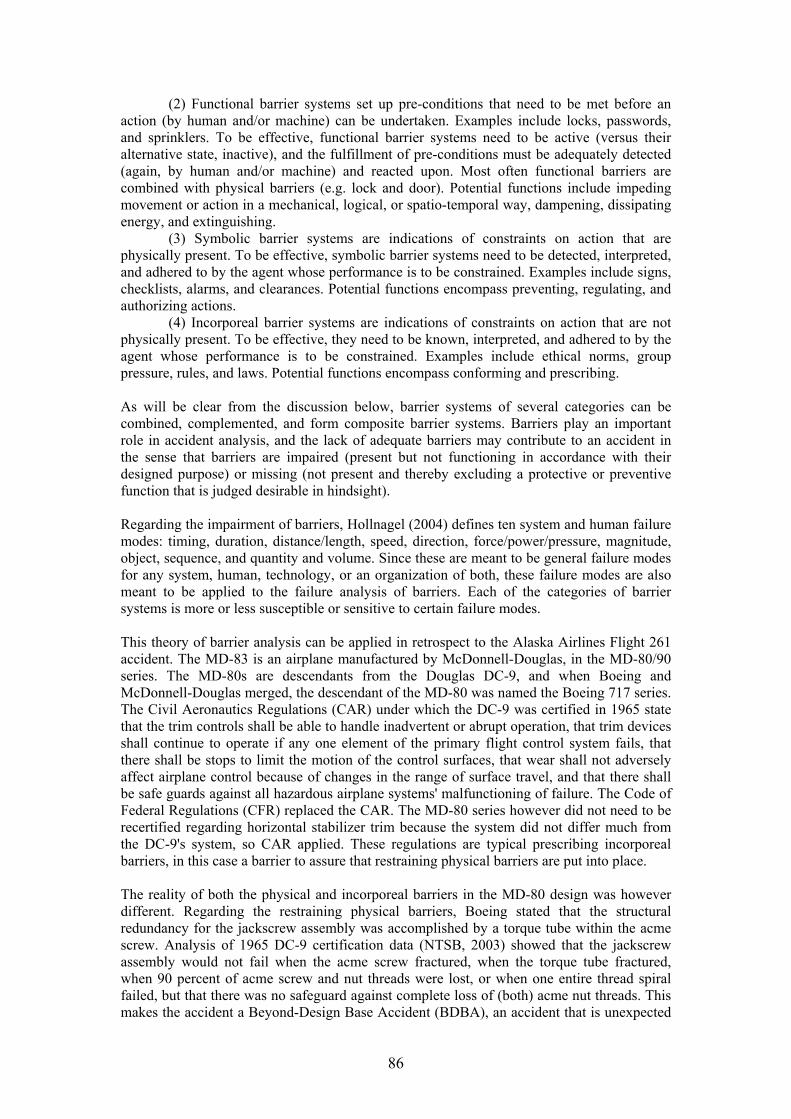
(2) Functional barrier systems set up pre-conditions that need to be met before an action (by human and/or machine) can be undertaken. Examples include locks, passwords, and sprinklers. To be effective, functional barrier systems need to be active (versus their alternative state, inactive), and the fulfillment of pre-conditions must be adequately detected (again, by human and/or machine) and reacted upon. Most often functional barriers are combined with physical barriers (e.g. lock and door). Potential functions include impeding movement or action in a mechanical, logical, or spatio-temporal way, dampening, dissipating energy, and extinguishing.
(3) Symbolic barrier systems are indications of constraints on action that are physically present. To be effective, symbolic barrier systems need to be detected, interpreted, and adhered to by the agent whose performance is to be constrained. Examples include signs, checklists, alarms, and clearances. Potential functions encompass preventing, regulating, and authorizing actions.
(4) Incorporeal barrier systems are indications of constraints on action that are not physically present. To be effective, they need to be known, interpreted, and adhered to by the agent whose performance is to be constrained. Examples include ethical norms, group pressure, rules, and laws. Potential functions encompass conforming and prescribing.
As will be clear from the discussion below, barrier systems of several categories can be combined, complemented, and form composite barrier systems. Barriers play an important role in accident analysis, and the lack of adequate barriers may contribute to an accident in the sense that barriers are impaired (present but not functioning in accordance with their designed purpose) or missing (not present and thereby excluding a protective or preventive function that is judged desirable in hindsight). Regarding the impairment of barriers, Hollnagel (2004) defines ten system and human failure modes: timing, duration, distance/length, speed, direction, force/power/pressure, magnitude, object, sequence, and quantity and volume. Since these are meant to be general failure modes for any system, human, technology, or an organization of both, these failure modes are also meant to be applied to the failure analysis of barriers. Each of the categories of barrier systems is more or less susceptible or sensitive to certain failure modes. This theory of barrier analysis can be applied in retrospect to the Alaska Airlines Flight 261 accident. The MD-83 is an airplane manufactured by McDonnell-Douglas, in the MD-80/90 series. The MD-80s are descendants from the Douglas DC-9, and when Boeing and McDonnell-Douglas merged, the descendant of the MD-80 was named the Boeing 717 series. The Civil Aeronautics Regulations (CAR) under which the DC-9 was certified in 1965 state that the trim controls shall be able to handle inadvertent or abrupt operation, that trim devices shall continue to operate if any one element of the primary flight control system fails, that there shall be stops to limit the motion of the control surfaces, that wear shall not adversely affect airplane control because of changes in the range of surface travel, and that there shall be safe guards against all hazardous airplane systems' malfunctioning of failure. The Code of Federal Regulations (CFR) replaced the CAR. The MD-80 series however did not need to be recertified regarding horizontal stabilizer trim because the system did not differ much from the DC-9's system, so CAR applied. These regulations are typical prescribing incorporeal barriers, in this case a barrier to assure that restraining physical barriers are put into place. The reality of both the physical and incorporeal barriers in the MD-80 design was however different. Regarding the restraining physical barriers, Boeing stated that the structural redundancy for the jackscrew assembly was accomplished by a torque tube within the acme screw. Analysis of 1965 DC-9 certification data (NTSB, 2003) showed that the jackscrew assembly would not fail when the acme screw fractured, when the torque tube fractured, when 90 percent of acme screw and nut threads were lost, or when one entire thread spiral failed, but that there was no safeguard against complete loss of (both) acme nut threads. This makes the accident a Beyond-Design Base Accident (BDBA), an accident that is unexpected
86
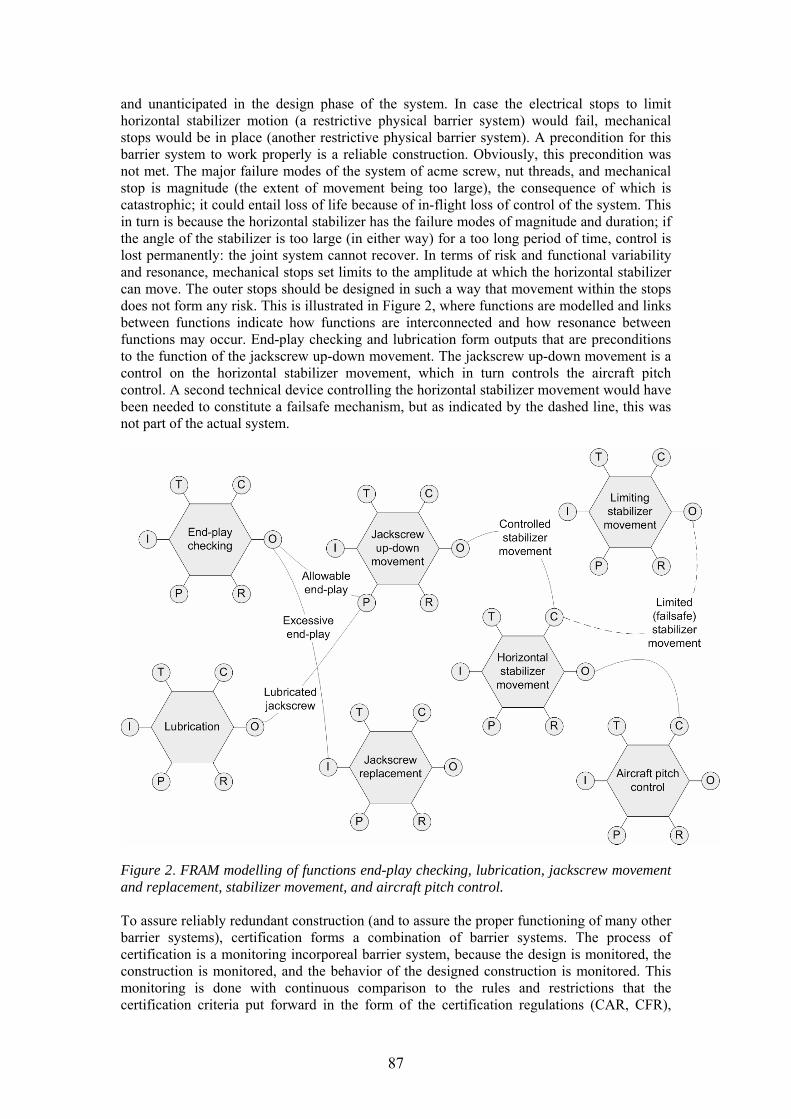
and unanticipated in the design phase of the system. In case the electrical stops to limit horizontal stabilizer motion (a restrictive physical barrier system) would fail, mechanical stops would be in place (another restrictive physical barrier system). A precondition for this barrier system to work properly is a reliable construction. Obviously, this precondition was not met. The major failure modes of the system of acme screw, nut threads, and mechanical stop is magnitude (the extent of movement being too large), the consequence of which is catastrophic; it could entail loss of life because of in-flight loss of control of the system. This in turn is because the horizontal stabilizer has the failure modes of magnitude and duration; if the angle of the stabilizer is too large (in either way) for a too long period of time, control is lost permanently: the joint system cannot recover. In terms of risk and functional variability and resonance, mechanical stops set limits to the amplitude at which the horizontal stabilizer can move. The outer stops should be designed in such a way that movement within the stops does not form any risk. This is illustrated in Figure 2, where functions are modelled and links between functions indicate how functions are interconnected and how resonance between functions may occur. End-play checking and lubrication form outputs that are preconditions to the function of the jackscrew up-down movement. The jackscrew up-down movement is a control on the horizontal stabilizer movement, which in turn controls the aircraft pitch control. A second technical device controlling the horizontal stabilizer movement would have been needed to constitute a failsafe mechanism, but as indicated by the dashed line, this was not part of the actual system.
Figure 2. FRAM modelling of functions end-play checking, lubrication, jackscrew movement and replacement, stabilizer movement, and aircraft pitch control.
To assure reliably redundant construction (and to assure the proper functioning of many other barrier systems), certification forms a combination of barrier systems. The process of certification is a monitoring incorporeal barrier system, because the design is monitored, the construction is monitored, and the behavior of the designed construction is monitored. This monitoring is done with continuous comparison to the rules and restrictions that the certification criteria put forward in the form of the certification regulations (CAR, CFR),
87
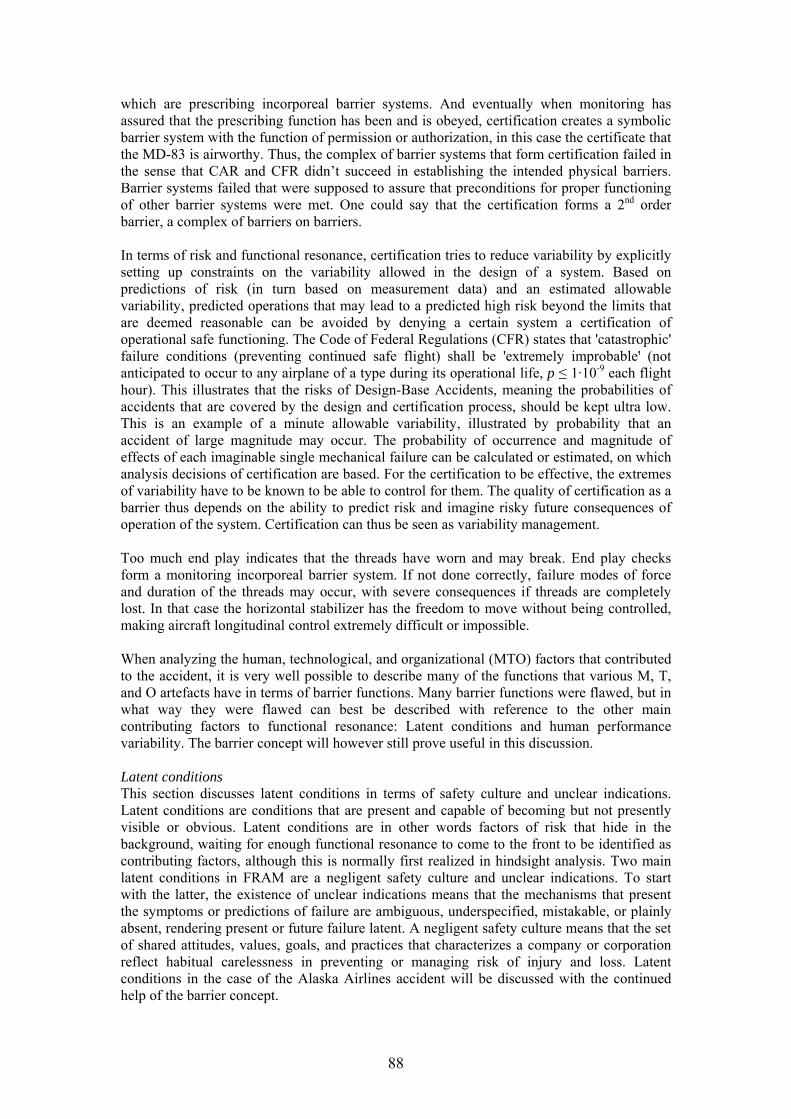
which are prescribing incorporeal barrier systems. And eventually when monitoring has assured that the prescribing function has been and is obeyed, certification creates a symbolic barrier system with the function of permission or authorization, in this case the certificate that the MD-83 is airworthy. Thus, the complex of barrier systems that form certification failed in the sense that CAR and CFR didn’t succeed in establishing the intended physical barriers. Barrier systems failed that were supposed to assure that preconditions for proper functioning of other barrier systems were met. One could say that the certification forms a 2nd order barrier, a complex of barriers on barriers. In terms of risk and functional resonance, certification tries to reduce variability by explicitly setting up constraints on the variability allowed in the design of a system. Based on predictions of risk (in turn based on measurement data) and an estimated allowable variability, predicted operations that may lead to a predicted high risk beyond the limits that are deemed reasonable can be avoided by denying a certain system a certification of operational safe functioning. The Code of Federal Regulations (CFR) states that 'catastrophic' failure conditions (preventing continued safe flight) shall be 'extremely improbable' (not anticipated to occur to any airplane of a type during its operational life, p ≤ 1·10-9 each flight hour). This illustrates that the risks of Design-Base Accidents, meaning the probabilities of accidents that are covered by the design and certification process, should be kept ultra low. This is an example of a minute allowable variability, illustrated by probability that an accident of large magnitude may occur. The probability of occurrence and magnitude of effects of each imaginable single mechanical failure can be calculated or estimated, on which analysis decisions of certification are based. For the certification to be effective, the extremes of variability have to be known to be able to control for them. The quality of certification as a barrier thus depends on the ability to predict risk and imagine risky future consequences of operation of the system. Certification can thus be seen as variability management. Too much end play indicates that the threads have worn and may break. End play checks form a monitoring incorporeal barrier system. If not done correctly, failure modes of force and duration of the threads may occur, with severe consequences if threads are completely lost. In that case the horizontal stabilizer has the freedom to move without being controlled, making aircraft longitudinal control extremely difficult or impossible. When analyzing the human, technological, and organizational (MTO) factors that contributed to the accident, it is very well possible to describe many of the functions that various M, T, and O artefacts have in terms of barrier functions. Many barrier functions were flawed, but in what way they were flawed can best be described with reference to the other main contributing factors to functional resonance: Latent conditions and human performance variability. The barrier concept will however still prove useful in this discussion. Latent conditions This section discusses latent conditions in terms of safety culture and unclear indications. Latent conditions are conditions that are present and capable of becoming but not presently visible or obvious. Latent conditions are in other words factors of risk that hide in the background, waiting for enough functional resonance to come to the front to be identified as contributing factors, although this is normally first realized in hindsight analysis. Two main latent conditions in FRAM are a negligent safety culture and unclear indications. To start with the latter, the existence of unclear indications means that the mechanisms that present the symptoms or predictions of failure are ambiguous, underspecified, mistakable, or plainly absent, rendering present or future failure latent. A negligent safety culture means that the set of shared attitudes, values, goals, and practices that characterizes a company or corporation reflect habitual carelessness in preventing or managing risk of injury and loss. Latent conditions in the case of the Alaska Airlines accident will be discussed with the continued help of the barrier concept.
88
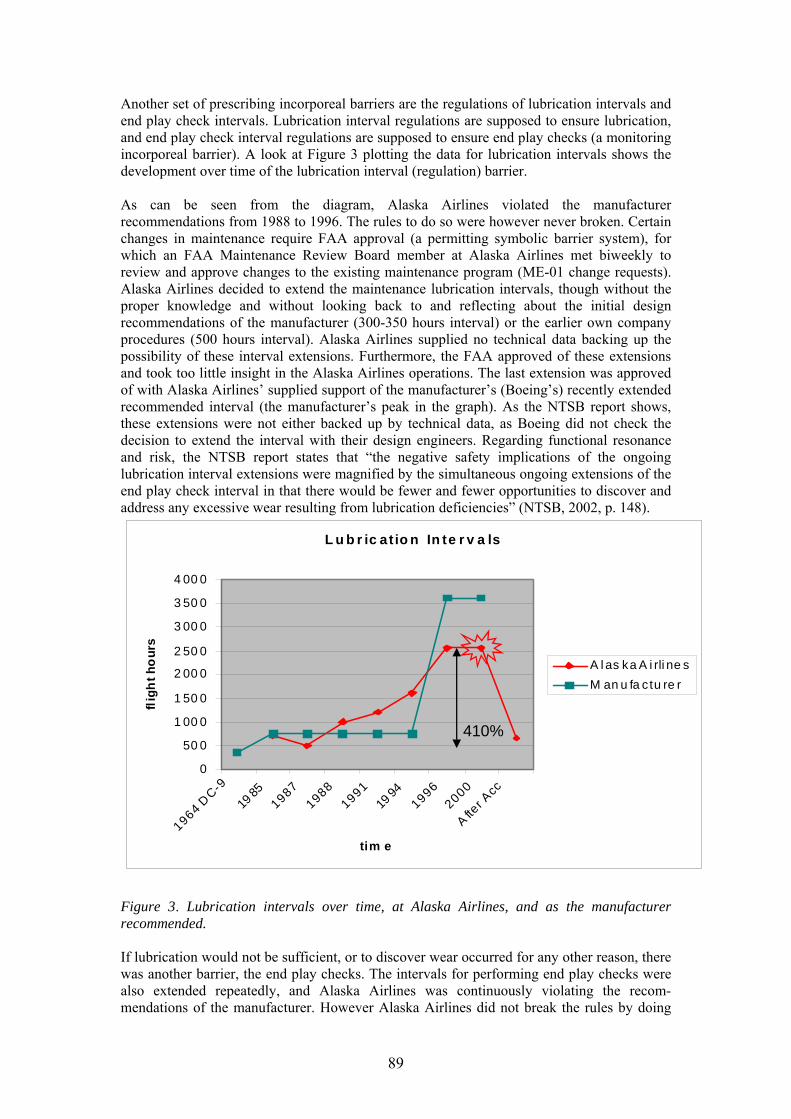
Another set of prescribing incorporeal barriers are the regulations of lubrication intervals and end play check intervals. Lubrication interval regulations are supposed to ensure lubrication, and end play check interval regulations are supposed to ensure end play checks (a monitoring incorporeal barrier). A look at Figure 3 plotting the data for lubrication intervals shows the development over time of the lubrication interval (regulation) barrier. As can be seen from the diagram, Alaska Airlines violated the manufacturer recommendations from 1988 to 1996. The rules to do so were however never broken. Certain changes in maintenance require FAA approval (a permitting symbolic barrier system), for which an FAA Maintenance Review Board member at Alaska Airlines met biweekly to review and approve changes to the existing maintenance program (ME-01 change requests). Alaska Airlines decided to extend the maintenance lubrication intervals, though without the proper knowledge and without looking back to and reflecting about the initial design recommendations of the manufacturer (300-350 hours interval) or the earlier own company procedures (500 hours interval). Alaska Airlines supplied no technical data backing up the possibility of these interval extensions. Furthermore, the FAA approved of these extensions and took too little insight in the Alaska Airlines operations. The last extension was approved of with Alaska Airlines’ supplied support of the manufacturer’s (Boeing’s) recently extended recommended interval (the manufacturer’s peak in the graph). As the NTSB report shows, these extensions were not either backed up by technical data, as Boeing did not check the decision to extend the interval with their design engineers. Regarding functional resonance and risk, the NTSB report states that “the negative safety implications of the ongoing lubrication interval extensions were magnified by the simultaneous ongoing extensions of the end play check interval in that there would be fewer and fewer opportunities to discover and address any excessive wear resulting from lubrication deficiencies” (NTSB, 2002, p. 148).
L u b r ic at io n In te r v a ls
0
50 0
1 00 0
1 50 0
2 00 0
2 50 0
3 00 0
3 50 0
4 00 0
1964 DC-9
1985
19871988
199119
941996
2000
A fter A
cc
tim e
flig
ht h
our
s
A l as ka A i rli ne sM an u fa ctu re r
410%
Figure 3. Lubrication intervals over time, at Alaska Airlines, and as the manufacturer recommended. If lubrication would not be sufficient, or to discover wear occurred for any other reason, there was another barrier, the end play checks. The intervals for performing end play checks were also extended repeatedly, and Alaska Airlines was continuously violating the recom-mendations of the manufacturer. However Alaska Airlines did not break the rules by doing
89
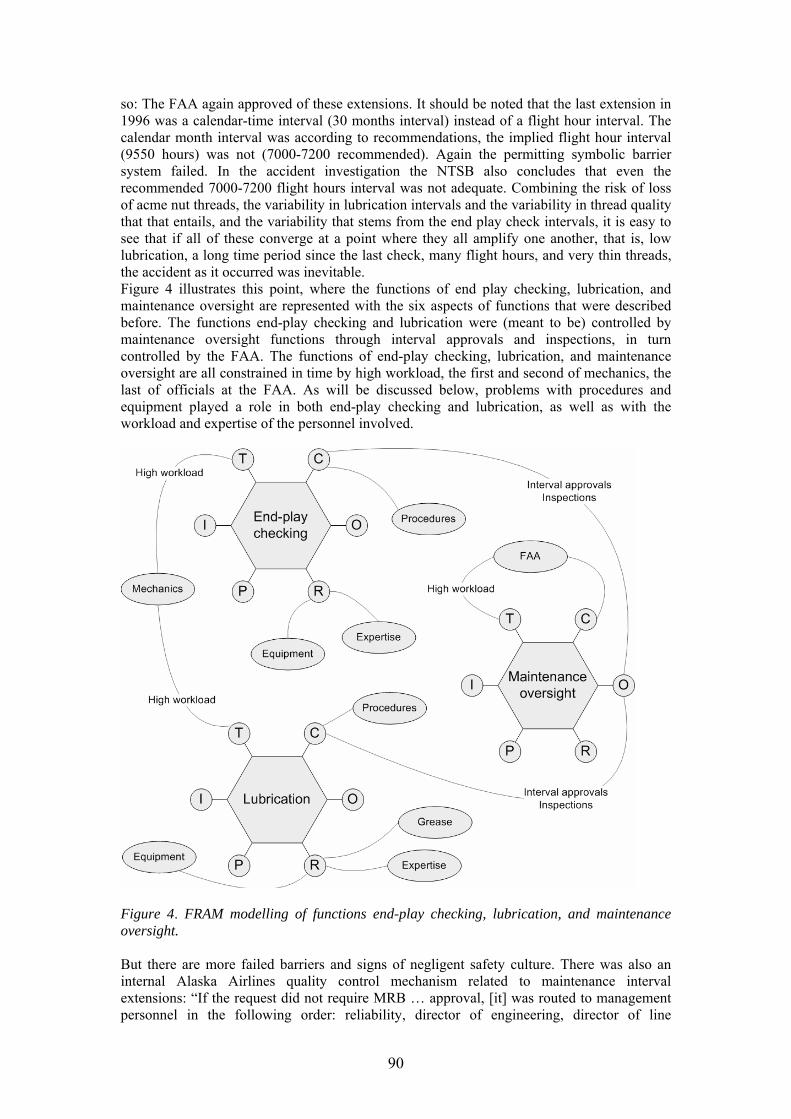
so: The FAA again approved of these extensions. It should be noted that the last extension in 1996 was a calendar-time interval (30 months interval) instead of a flight hour interval. The calendar month interval was according to recommendations, the implied flight hour interval (9550 hours) was not (7000-7200 recommended). Again the permitting symbolic barrier system failed. In the accident investigation the NTSB also concludes that even the recommended 7000-7200 flight hours interval was not adequate. Combining the risk of loss of acme nut threads, the variability in lubrication intervals and the variability in thread quality that that entails, and the variability that stems from the end play check intervals, it is easy to see that if all of these converge at a point where they all amplify one another, that is, low lubrication, a long time period since the last check, many flight hours, and very thin threads, the accident as it occurred was inevitable. Figure 4 illustrates this point, where the functions of end play checking, lubrication, and maintenance oversight are represented with the six aspects of functions that were described before. The functions end-play checking and lubrication were (meant to be) controlled by maintenance oversight functions through interval approvals and inspections, in turn controlled by the FAA. The functions of end-play checking, lubrication, and maintenance oversight are all constrained in time by high workload, the first and second of mechanics, the last of officials at the FAA. As will be discussed below, problems with procedures and equipment played a role in both end-play checking and lubrication, as well as with the workload and expertise of the personnel involved.
Figure 4. FRAM modelling of functions end-play checking, lubrication, and maintenance oversight.
But there are more failed barriers and signs of negligent safety culture. There was also an internal Alaska Airlines quality control mechanism related to maintenance interval extensions: “If the request did not require MRB … approval, [it] was routed to management personnel in the following order: reliability, director of engineering, director of line
90
maintenance, director of base maintenance, manager of maintenance control, director of quality control, director of maintenance planning and production control.” (NTSB, 2002, p. 28). The NTSB report however shows that there was too much eye for financial profit and too little for quality, rendering the in-company review not effective. Clearly there was a climate of production pressure in the company’s environment of commerce and competition. There were also unclear indications of when something had gone wrong. First of all the procedures for checking end play were unclear, and not effective in establishing reliable measures (see also the section ‘Human performance variability’). Second, the severity of end play was not clear with respect to how the end play would develop between one end play check and the next. At the last end play check, the inspector and mechanic measured the maximum allowed end play of 0.040 inches. This was reported, but then for second opinion repeatedly measured again, resulting in a lower value, and struck through on the reporting form. The measurement showed two different readings, and the lowest last-measured value was taken and the alarming news not spread. Moreover, it must have been unclear to the maintenance personnel and the battery of managers mentioned above what would happen to end play (and to the threads) after an end play of 0.040 inches was measured. 0.040 was allowed, but end play and wear could continue to increase in a different manner than until that point in time. Would wear continue linearly or exponentially? And what was the risk (probability of failure and severity of its consequences) of having an end play of 0.040 inches? Knowledge about this development could have also influenced the decisions made previously about end play check intervals. Human performance variability The variability in human performance largely can be explained by the efficiency thoroughness trade-off, the ETTO principle, and demand-related incapacity (Hollnagel, 2004). The basis of this principle is that actions will vary beyond the variability intended in work design because the demands, resources, system input, actions of other people, and working conditions may be harsher than was anticipated in the design phase of systems and their functioning in a work setting. Humans often have to meet goals of efficiency and thoroughness at the same time, and since these are conflicting goals, emphasis on one necessarily leads to a neglect of the other. This trade-off is though a necessary one to make in any time-bound working environment, people and organizations have to do so all the time in order to function appropriately. People and organizations are able to make this trade-off through adaptive and flexible behaviour: Short-cuts, heuristics, and expectation-driven actions are more norm than exception. They are however, also a reason for failure. There were several human performance variability aspects to this accident. Due to several occurrences of the ETTO principle forced onto the personnel of Alaska Airlines, variability in human actions occurred. These can be detected as typical ETTO principle statements like ‘not really important’, ‘this is normally OK’, and ‘it will be checked by someone else later’, statements that apply to the Alaska Airlines operations. Both FAA oversight and Alaska Airlines maintenance operations suffered from a lack of resources and time, thus capacity at Alaska Airlines and the FAA did not meet the local work demands. As a result, checks were delayed and rushed. The mechanic at the last lubrication did not adequately perform his task in the interpretation by the NTSB: in interviews by the safety board he ‘revealed a lack of knowledge of procedure’, because he took less time to complete the lubrication procedure than other expert opinions deemed necessary, and because he performed no visual check. While the mechanic’s statement is easily interpreted as an instance of human error, this judgment does not shed any light on the question why the mechanic performed his work the way he reported. Because of high work pressures on mechanics and managers, efficiency and financial profits were put on a higher priority than thoroughness, quality and safety. The working conditions (in this case for example the very limited physical space for performing and monitoring the lubrication,
91
adverse weather conditions, and usual darkness during late hours and shifts) that mechanics have had to cope with to actually perform the end play checks and lubrication procedures is another factor not taken into account in this judgment. The pilots also accounted for some human performance variability. Due to unclear check lists for the situation they were in, they started experimenting with checks, switches, and auto-pilot settings to regain control over the aircraft. This in hindsight was not appropriate, but they had to do something to both understand the situation and to regain control over it. As Leveson (2004, p. 246) emphasizes: “the effects of less successful actions are a natural part of the search on the part of the operator for optimal performance”. This translates to the situation in which the pilots of Alaska Airlines flight 261 were, when they tried to regain control over the aircraft.
Discussion
Altogether the risks add up to a complex combination of amplifying effects of breaches in barrier systems and their functioning. Combined, the variability that occurs in the functions described above contributed to the dreadful accident of Alaska Airlines 261. Hollnagel’s systemic accident model of functional resonance together with barrier analysis cover the very diverse and complicated contributing factors of the accident, and make the accident better understood. It also brings to light the complexity of barrier systems and functions, and how they are entangled and combined, as barriers on barriers, and as functions that with their variability resonate with other functions so that risks emerge. Space constraints limit the extent to which the FRAM functions can be presented here, but the paper has attempted to show how the functions that the various parts of the complex socio-technical system perform can be linked by their aspects defined in the FRAM modules, so that potential resonance is made more explicit. While attempting to treat the accident following the categories that are sketched in the functional resonance accident model diagram (Figure 1), it becomes clear that the classification has overlaps, as various factors can be classified in more than one category. Many missing and failing barriers can be seen as design flaws or technical failures, for example, since many barriers functions are implemented through technical solutions. Moreover, the wide range of defined classes of barrier systems in combination with the high degree of regulation in aviation makes that the failure or lack of incorporeal barriers can also be discussed in the category of safety culture. Human performance variability is especially in this case also highly related to limited and inadequate maintenance, and the ETTO principles’ occurrence that emerges from the accident report are clearly related to safety culture aspects. On the other hand this redundancy in classification illustrates the high degree of coupling between the systems of systems in aviation, and speaks in favour of the FRAM view of the absence of a purely linear causal event chain. The Alaska accident is a very illustrative example of the complex interactions between the many MTO factors that the systemic accident model addresses. However, since one always already looks at an accident with a certain model of accidents in mind (be it a vague idea of what causes accidents or specifically articulated systemic model), true validation of an accident model is never possible, one can just illustrate the usefulness in understanding current complex accident scenario’s. It can however be concluded that the model tested is a valuable help in describing accidents, analyzing barriers and functions, and addressing risk.
Conclusions
This paper has attempted to discuss the diverse contributing factors in the Alaska Airlines flight 261 accident in order to illustrate the concepts of the functional resonance accident model and the FRAM-modules and function descriptions, and to sketch how complex couplings and interactions involved in (accidents in) ultra-safe industries may be modelled using the barriers and functional resonance concepts. The way ahead in safety beyond the
92
current ultra-safety in the aviation industry is a matter of much debate (Amalberti, 2001; Dekker, 2004). The systemic functional resonance accident model (Hollnagel, 2004) discussed in this paper is an attempt in the direction of a better understanding and thus a better way of preventing accidents.
Acknowledgement
Erik Hollnagel is gratefully acknowledged for useful comments on earlier versions of this paper.
References
Amalberti, R. (2001). The paradoxes of almost totally safe transportation systems. Safety Science, 37, 109-126.
Dekker, S. W. A. (2004). Ten questions about human error: A new view of human factors and system safety. Lawrence Erlbaum Associates, Inc.
Hollnagel, E. (2004). Barriers and accident prevention. Aldershot, UK: Ashgate. Leveson, N. G. (2004). A new accident model for engineering safer systems. Safety Science,
42, 237-270. McDonald, N., Corrigan, S., Daly, C., & Cromie, S. (2000). Safety management systems and
safety culture in aircraft maintenance organisations. Safety Science, 34, 151-176. NTSB. (2003). Loss of control and impact with Pacific ocean, Alaska Airlines flight 261,
McDonnell Douglas MD-83, N963AS, about 2.7 miles north of Anacapa Island, California, January 31, 2000 (Aircraft Accident Report NTSB/AAR-02/01). Washington, DC: National Transportation Safety Board.
Rochlin, G. I. (1999). Safe operation as a social construct. Ergonomics, 42(11), 1549-1560. Woods, D. D., & Cook, R. I. (2002). Nine steps to move forward from error. Cognition,
Technology & Work, 4, 137-144.
93
Information and Communication Technology in Collocated Emergency Management Training
Rogier Woltjer1, Ida Lindgren2 & Kip Smith2
1Cognitive Systems Engineering Laboratory, Department of Computer and Information Science, Linköping University, Sweden
2Division of Industrial Ergonomics, Department of Mechanical Engineering Linköping University, Sweden
Abstract
This paper focuses on the role of ICT in emergency management training and inter-organisational coordination. Working in the same physical location, in a collocated manner, can be beneficial for the development of common ground and trust and, in turn, greater efficiency and effectiveness. We observed a full-scale, real-time exercise designed to facilitate cooperation among electricity and telecommunications companies. The exercise scenario was similar to the January 2005 windstorm that left much of southern Sweden without electricity or telephone service and revealed the need for better cooperation among utility providers. The observations suggest that the collocated training setting was clearly beneficial, but there was a mismatch in ICT use between the collocated training and the distributed actual work setting. It is therefore likely that the skills of artefact and ICT use learnt during training do not readily transfer to actual emergency management practice, and that a reliance on these skills is disadvantageous for operation effectiveness. Keywords: Emergency management, training, artefact use, collocated work, distri-buted work, real-time exercise, coordination, cooperation.
Introduction
Emergency management requires effective coordination, which can be achieved through sound training practice. This paper addresses the role of ICT in training for effective emergency management. The literature on work organisation suggests that groups that work face-to-face in the same physical location (i.e. collocated), rather than in a distributed manner, benefit from better communication and more flexible interaction and task allocation. These benefits of collocation facilitate the development of common ground and trust, which may in turn enhance efficiency and effectiveness. We expect to find similar benefits of collocation in emergency management operations. Further, we expect to find communication and artefact use during collocated training that cannot readily transfer to the ICT used to link distributed work settings. This expectation makes reliance on working with ICT in distributed work during emergency management operations questionable. To test these claims, we observed a full-scale exercise designed to facilitate cooperation among electricity and telecom companies. The exercise scenario was played out in real-time and was similar to the January 2005 (Alexandersson, 2005) windstorm that left much of southern Sweden without electricity or telephone service and revealed the need for better cooperation among utility providers. Emergency management has been defined as “the process of coordinating an emergency or its aftermath by communication with participants and organising the deployment and use of emergency resources” (Alexander, 2003, p. 118). It is a dynamic process conducted under stressful conditions that demands flexible but rigorous planning, cooperation among stakeholders, vigilance, heedfulness, and follow-through. The foundation of this paper is that Information and Communication Technology (ICT) plays multiple roles that may facilitate
94
the management of and training for emergency operations designed to restore power and telecommunications in response to catastrophic breakdowns in service. In this paper, the acronym ICT refers to any technical system or artefact designed to gather, process, distribute, or mediate information. We consider two disparate types of work organisation – collocated work (i.e., face-to-face in the same physical location) and distributed work (requiring artefact-mediated communication). The difference in communication possibilities and needs influences artefact use and utility. Among the artefacts we consider are whiteboards, telephones, and web-based tools, of which the last two are considered to be ICT. We use the word ‘utilities’ to refer to telecommunications companies, electric utilities, and related service providers that develop and maintain the power and telecommunications infrastructures. Electricity and telecom utilities’ emergency management Ineffective coordination is a reoccurring problem in emergency management (McEntire, 2002). The devastating storm that reached the west coast of Sweden on the 8th of January 2005 (Alexandersson, 2005) revealed the need for Swedish utilities to improve their cooperation and their preparedness for emergency management and recovery operations. A crisis like the January 2005 storm, as well as the August 2003 blackouts in North-America (Barron, 2003; Brown, 2004) expose the interdependencies between the electric and telecommunications systems. These two types of utilities are loosely coupled (Orton and Weick, 1990) to each other. Telecom equipment runs on electricity and is, accordingly, dependent on the power grid. Conversely, recovery from a breakdown of the electricity network relies mainly on functioning telecommunications. When an emergency occurs, all are affected and a joint effort is needed for quick recovery. Swedish electric utilities have, prior to the January 2005 storm, bundled their emergency management coordination in ‘Electricity Coordination Teams’. The telecom utilities have followed their lead and recently formed emergency coordination groups as well. The exercise that we observed was one of the first joint training exercises with electricity and telecom utilities present. An open question is how best to train those responsible for managing the utilities’ efforts to recover from an emergency. Training Training is vital for efficiency in dynamic and stressful environments. Training allows the emergency management personnel to develop their personal relationships and is likely to increase emergency response effectiveness (Baldwin, 1994; Perry and Lindell, 2003). Highly realistic exercises (with regard to pace, scale, workload, procedures, artefacts, etc.) train both domain-general skills (e.g., cooperation and communication) and domain-specific skills (e.g., use of specific artefacts and ICT). When people are active in a training environment they inevitably learn new facts, skills, and procedures (Säljö, 2000). It is therefore important that training environments situate the trainees in an appropriate setting that facilitates learning the knowledge and skills that are relevant to their actual work environment. This consideration extends to the ICT systems that are present in training and actual work settings. If there is a mismatch between the (ICT systems in the) training environment and the world of real practice, the domain-specific skills acquired during training may not transfer. Then again, acquired skills may transfer but be inappropriate and become sources of misunderstanding and ineffectiveness. Furthermore, emergency management systems that are not regularly used are not likely to be of use in actual emergencies (Turoff, 2002). Collocated Work Teams that work in separate locations but train face-to-face may encounter a mismatch between the artefacts used during training and those used in actual work practice. This mismatch is a cause for real concern because communication styles and artefact use learned during collocated training may be inappropriate when working in distributed, physically dispersed locations.
95
Collocated work refers to a work setting in which the personnel share the same physical location (Olson and Olson, 2000). There are noticeable advantages to collocated work compared to distributed work. Collocation can be beneficial for (a) communication (Olson and Olson, 2000, Olson et al., 2002), (b) flexible organisation, such as fluid sub-groupings or task allocation (Olson et al., 2002), (c) the development of trust (McAllister, 1995), (d) the development of common ground (Clark, 1996), and (e) productivity (Olson et al. 2002). Still, Jarvenpaa and Leidner (1999) found that ‘swift trust’ (Meyerson et al., 1996) can arise for a short period of time even in virtual teams, in which members have never met in person. Distributed work, the opposite of collocated work, is usually chosen when it is undesirable to relocate members of the team from their workplaces and/or the task at hand is short term in nature. Members of distributed teams typically communicate using telecom media such as telephone, e-mail, and videoconferencing (Cramton, 2002). Even though there are numerous advantages of collocated work, sharing a common space is not appropriate for all kinds of tasks or people (Schunn et al., 2002). There are two main disadvantages: (a) the work place can sometimes seem disordered when people are coming and going and the personnel can overhear each other’s conversations, and (b) constantly having people around leaves no room for privacy. However, there is considerable evidence that individuals working in a distributed manner are probable to profit from meeting face-to-face once in a while (Hinds and Kiesler, 2002). ICT in emergency management Apart from the organizational differences between collocated and distributed work, an important dissimilarity between collocated and distributed settings is the difference in the artefacts that are available. Distributed teams typically rely on ICT to coordinate their activities. Some ICT used in distributed settings enable people to communicate in a way that emulates face-to-face communication (Olson and Olson, 2000). The use and design of these digital artefacts therefore need to be considered in modern emergency management. In this paper, the artefacts of interest are ICT artefacts. We take on Hollnagel and Woods’ (2005, p. 66.) definition of artefact: “an artefact is a device used to carry out or facilitate a specific function that is part of work.” In order to understand how people think, learn, master situations, and use artefacts, it must be acknowledged that work is accomplished by a combination of people, the artefacts they use, and the organisation they are part of (Hollnagel and Woods, 2005; Säljö, 2000). Through the use of ICT, people can solve problems and control situations that they could not do by themselves. Additionally, the same ICT can serve different purposes in different conditions. For example, communication within a collocated work group need not be mediated through ICT, as they can communicate face-to-face. Instead, the artefacts are mainly used for external communication. In distributed work, however, ICT artefacts must serve the additional purpose of facilitating communication within the work group. In order for artefacts to serve people’s purposes, they (1) should be as transparent as possible so that artefact and human become a joint system with a common purpose, and (2) should amplify human skills, rather than replace human activity and reduce their skills (Hollnagel and Woods, 2005). An artefact’s usability and utility is consequently contextually dependent, and it is therefore important to realise that when learning how to use an artefact, it must not be taken out of the context in which it is to be used. If artefact design meets the above recommendations, they can make us smart (Hutchins, 1995; Norman, 1993; Säljö, 2000). Studies of ICT use in numerous domains imply that there are always benefits and disadvantages to the use of ICT, and this is also the case for emergency management (Suparamaniam, 2003). Technology enables coordination, but the efficacy of that coordination is dependent on the correct functioning of the technology. ICT can (1) enable communication between people who are physically distributed, (2) connect people in the field
96
to their home organisations and thereby provide assurance and security, and (3) enable people to send large amounts of data in short periods of time. But if the ICT is not functioning or designed properly, the meaning of information and data can be lost and effective coordination jeopardised (Suparamaniam, 2003). Another issue with ICT in general and in emergency management specifically is that it can be difficult for the receiver of information to verify the source, validity, and accuracy of the information, i.e., to ascertain whether the information can be trusted. In sum, ICT can facilitate effective coordination, but only when it works and only when the receiver of the information can verify its reliability and understand its content. Claims These reflections substantiate the following three claims: (1) Considering the advantages of collocated work, the team assembled for the utilities’ exercise is likely to benefit from the ability to communicate face-to-face and the opportunity to develop trust and common ground about the task of emergency management coordination. (2) A benefit of collocated training is the ability to communicate face-to-face and develop patterns of interaction that may transfer to distributed work and, hence, enhance operations. (3) However, considering the potential for a mismatch in communication, task allocation, and artefact (ICT) use during collocated training and actual distributed work, the associated skills and knowledge gained during training may not readily transfer to distributed work during actual emergency management operations.
Method
This section discusses the large-scale real-time exercise conducted in Sweden in 2005 by representatives of Swedish electricity and telecom utilities and other critical infrastructure. The immediate goal of the exercise was to develop cooperation and communication between decision makers from the various electricity and telecommunication companies in situations of crisis. The long term goal was to develop knowledge of the practice of crisis management and its consequences for society. The utilities participated to be able to re-enact the conse-quences of the January 2005 storm and learn to deal with them more efficiently. The Exercise, its Scenario, and the Work Environment The exercise was performed in real-time and simulated the effects of a devastating storm. The scenario was played in full-scale at a training centre, and in parallel at various remote sites on April 19, 2005, and lasted for approximately 10 hours. The scenario started with the situation that on April 14, a big storm forcefully accelerated through the Benelux, Denmark, and southern Norway through the southwest of Sweden towards Stockholm on the 15th. The violent advance of the storm resulted in power outages and downed telephone lines and masts, and associated severe infrastructure problems. The exercise was partially planned before the January 2005 storm hit the south of Sweden. The exercise scenario therefore combined hypothetical events with events similar to the January 2005 storm’s effects on the power and communication infrastructures. Because the scenario was only partially based on an actual emergency, the participants were likely to experience it as highly realistic without being overly constrained by their experience with the actual emergency (Alexander, 2000). Participants Participants were emergency managers from most of the companies involved in the real storm who were responsible for reacting to the emergency and for coordinating activities to return service to normal. Electricity and telecommunication utilities, as well as many other infrastructure organisations and companies, sent a total of approximately 60 representatives to the exercise. We observed a team of seven responsible for coordinating cooperation
97
between electric utilities during emergency operations. These seven are the actual members of one of the official Electricity Coordination Teams. The observed team consisted of six men and one woman, of whom five were representatives of electric companies and two of governmental agencies. The team was the same team that would have responded to a real-life crisis. The participants have extensive domain knowledge in their area of expertise. One of the team members is the designated chairperson. All other team members have flexible roles. They normally work in different locations and communicate by telecom links. During the exercise they were collocated and therefore used a different set of artefacts than they were used to. Informed consent for video-taping, anonymity, publication, etc., was obtained. Task The Swedish electric companies have formulated guidelines for implementing inter-organisational cooperation and coordination. These guidelines postulate that the Electricity Coordination Team’s task is to function as a coordination team, facilitating the cooperation between electricity companies. To do this, the team has to (a) collect information, (b) assess the situation before and during the power failure, (c) distribute material, equipment, personnel and other resources from other parts of the country to the affected area, (d) keep in continuous contact with the agency responsible for the power grid, and (e) find the people and competence needed to cope with the given situation. Many of the team’s tasks are conducted with the help of a power grid cooperation system (PGCS). This computer system displays the status of the power grid for planning and supporting emergency management during power failures, and is Internet-based. The team uses the PGCS to register, assess and distribute information about what is happening in the affected area. They can also use the system to request actions and resources from companies within the area. All decisions the team makes and notes from their meetings must be made available in the PGCS for others to see. Data Collection We observed the team in its workrooms. Data collection methods included (a) direct observation by two observers, (b) video-recording of the team’s workplace, (c) traces of artefact use (telephone, white-board, Internet), and (d) a transcript of a semi-structured retrospective interview with a subset of the observed participants. Exercise Procedure A group of representatives of companies and organisations affected by the simulated disaster, such as utility workers, industry representatives, police, firemen, a radio station, emergency services representatives, etc., simulated the disaster. Events were simulated in great detail using conventional media as information sources, such as press conferences, radio bulletins, press statements, phone calls, e-mail, etc. Various teams of decision makers, the emergency managers that were trained, had to cope with the simulated disaster. The team that we observed worked in two designated rooms, interacting with each other and other teams through several artefacts that mediated the flow of information. The collocated team of decision makers had access to the following artefacts:
• Whiteboards with pens, in both rooms;
• Computers: portable and desktop computers with Internet connections, e-mail and the
PGCS;
98
• Phones: land-lines and mobile phones in both rooms;
• Maps: electronic and hand-drawn maps.
• Newspaper: an electronic newspaper with relevant exercise information of the days
before the exercise;
• Radio: A radio station broadcast live coverage of the simulated disaster. The broadcast included news bulletins, press conferences, interviews, music, etc.
Results
The team usually works in a distributed manner. They typically stay at their home offices and coordinate their work and discuss the situation through telephone conferences. The team has a meeting location for highly critical emergencies, but they have never used it until now. They are openly sceptical of the possibility that they could ever work together in a collocated manner (e.g., in their meeting location), since their companies do not want them to be out of their offices for long periods of time. In that respect, the exercise setting differed from actual work practice. During the exercise, the team was collocated and had two rooms at its disposal. They initially made one room their meeting room. The other room was their hub for telephone calls and Internet communication. Team members were initially assigned to one room or the other. The team met every hour in the meeting room to listen to the radio broadcast, let each member update the others on the situation, and plan. These meetings were coordinated by the chairperson. Between meetings, most team members used the telephones to contact other teams of decision makers to exchange information. Occasionally they walked around, formed subgroups, and discussed issues together. As the exercise developed, team members started to move back and forth between subgroups and rooms. Several times, the hallway between the rooms became a meeting point and workplace. When the situation was relatively calm, conversations were often more social than professional. The evolving informality and the fluid nature of the subgroups and room assignments are characteristic benefits of collocated work. We analysed the functions the team performed using a framework adapted from Fleishman and Zaccaro’s (1992) taxonomy of team performance, and related the team functions to the artefacts used during the exercise. Some of the findings are presented here. A more detailed account of this analysis can be found elsewhere (Woltjer, Lindgren, & Smith, in press). Fleishman and Zaccaro’s taxanomy deals with team performace functions concerning (a) orientation (i.e. information exchange), (b) resource distribution, (c) timing and pacing of activities, (d) response coordination, (e) motivation, and (f) monitoring of the system. While face-to-face communication dominated internal information exchange, the major artefact used to mediate this function was the whiteboard. In contrast, ICT mediated external information exchange. The matching of team resources to requirements and workload balancing were continuously performed using the PGCS, the whiteboard, and face-to-face communication. Face-to-face meetings and the whiteboard, but no ICT, were instrumental in the timing and pacing of activities and the coordination of team responses. We observed the team engage in several of the motivational functions enumerated by Fleishman and Zaccaro. The reinforcement of task orientation was performed continuously through face-to-face communication and frequently with the aid of the whiteboard. ICT was instrumental in the resolution of conflicts with people outside the room. Internal conflicts were resolved using the whiteboard, the PGCS, and face-to-face communication. Typical conflicts concerned mismatches between what the team knew and what other participants stated to be true. Monitoring and adjustment of activities was done frequently using the white-board and face-to-face-communication. There was very little observable maintenance of procedures, only
99
procedures for the team’s joint responses applied, which were discussed occasionally face-to-face in team meetings. The whiteboard and face-to-face communication were the most frequently used media for all categories of team functions. The whiteboard and face-to-face communication can be used only when the team is collocated. When comparing the communication media (including ICT artefacts), it becomes clear that the remaining artefacts lack certain important characteristics for the utility teams’ communication. Being collocated enables a shared local context, informal interactions between team members, gestures, co-reference to objects, and implicit cues about peripheral activity (Olson and Olson, 2000). These characteristics clearly seem to be beneficial given the frequent use of face-to-face and whiteboard communication during the exercise.
Implications
We began the paper with rationale for three claims: (1) The team should benefit from being able to communicate face-to-face and develop trust and common ground; (2) They can develop patterns of interaction that may transfer to distributed work and, hence, enhance operations; (3) However, their communication, task allocation, and artefact (ICT) use during collocated training may not readily transfer to distributed practice. The observational study addresses the first and the last of these three claims. The abundant face-to-face communication and whiteboard use strongly suggest that the team benefited from the collocated setting. The continuous shared referencing to the whiteboard and the PGCS reveals that the team developed a consistent pattern of interaction that guided virtually all emergency management activity. Furthermore, the emergence of fluid subgroups and social (non-professional) conversations is consistent with the development of mutual trust and common ground. None of these social aspects were mediated by ICT. Our observations suggest that ICT can be useful for the practice of emergency management. However, it is difficult to imagine that ICT would be used to mediate social interaction during distributed emergency management (training). As mentioned earlier, whiteboards and face-to-face communication can only be used when the team is collocated. The observation that these are the most frequent modes of communication by the emergency management team suggests that there is likely to be a mismatch between what the team learned during training and what they need on the job. Additionally, because tasks were assigned given the collocated work conditions, task allocation in training may not correspond to or be appropriate for actual distributed work. Concerning this mismatch, either the training mode must change, or, during an actual emergency, the team should work together in its meeting location. In the future, distributed work settings may feature artefacts such as video-conferencing and virtual (electronic) whiteboard facilities. These ICT artefacts may partially address the need to co-reference objects and other subjects of conversation. However, informal interactions such as socialising may be resistant to mediation by ICT. Since such interactions are instrumental for the development of trust and common ground, distributed teams may be at a serious disadvantage that technology may not be able to overcome. Training for distributed emergency management poses a dilemma. On the one hand, collocated exercises have clear social benefits. On the other hand, the lessons and skills learned during collocated work may not transfer to the actual distributed work setting. We believe that the team would benefit from participating in more collocated exercises in the future. However, it is important that the ICT employed in collocated training closely resemble that used in their distributed work. If the training environment includes irrelevant
100
ICT, some of the knowledge and work routines acquired during the training may be neither useful nor transferable to actual emergency management. The whiteboard and face-to-face meetings offer ways of communicating that are not afforded by ICT in a distributed setting. This constitutes a significant difference between the training and real settings. Because the communication media that were used most extensively during training are unavailable in the team’s distributed work environment, the extent to which the training can generalise is unclear. It is difficult to imagine how this type of exercise could be performed in a distributed manner. To organise a realistic full-scale multi-organisation emergency management exercise is extremely difficult; to try to stage the scenario in a distributed fashion even more so. Even though the observed exercise differed markedly from how the team usually works, the benefits of the exercise for future emergency management are clear. The experience of working in the same physical location most likely helps team members to get to know each other better, which in turn can lead to the development of trust, common ground, and more efficient communication. Exercises like the one we observed may also enable emergency management workers to discover new ways of working that can be incorporated in their work organisation. The utilities’ exercise provides an example of how companies that provide services that are critical to society can set aside their commercial rivalry in order to improve their emergency management performance. The mismatch between the use of ICT during the exercise and actual work illustrates the challenges faced by ICT designers and developers of emergency management training exercises. Authors’ note This paper is an abridged version of an article that has been accepted for publication in the International Journal of Emergency Management (IJEM; Woltjer, Lindgren, & Smith, in press).
Acknowledgements The authors thankfully acknowledge IJEM reviewers and editors, Erik Hollnagel, and Kjell Ohlsson for useful comments on earlier drafts, Kjell Mo for giving us the opportunity to study the exercise, and ConDesign in Linköping for technical assistance.
References
Alexander, D. (2000). Scenario methodology for teaching principles of emergency management. Disaster Prevention and Management, 9, 89-97.
Alexander, D. (2003). Towards the development of standards in emergency management training and education. Disaster Prevention and Management, 12, 113-123.
Alexandersson, H. (2005). Den stora januaristormen 2005 [The big January 2005 storm]. Väder och Vatten, 1, 2005, 11.
Baldwin, R. (1994). Training for the management of major emergencies. Disaster Prevention and Management, 3, 16-23.
Barron, J. (2003). The blackout of 2003: The overview; Power surge blacks out northeast, hitting cities in 8 states and Canada; Midday shutdowns disrupt millions. The New York Times. 15 August 2003, New York, NJ.
Brown, J. (2004). Providing emergency care during a power outage: August 2003. Disaster Management & Response, 2, 20-23.
Clark, H.H. (1996). Using Language, Cambridge, MA, Cambridge University Press. Cramton, C.D. (2002). Attribution in distributed work groups. In Hinds, P.J. & Kiesler, S.
(Eds.) Distributed Work. (pp. 191-212). Cambridge, MA, MIT Press.
101
Fleishman, E.A. & Zaccaro, S.J. (1992). Toward a taxonomy of team performance functions. In Swezey, R. W. & Salas, E. (Eds.) Teams: Their Training and Performance. (pp. 31-56). Norwood, NJ, Ablex Publishing Corporation.
Hinds, P.J. & Kiesler, S. (Eds.) (2002). Distributed Work. Cambridge, MA, MIT Press. Hollnagel, E. & Woods, D.D. (2005). Joint Cognitive Systems: Foundations of Cognitive
Systems Engineering, Boca Raton, FL, CRC Press. Hutchins, E. (1995). Cognition in the Wild, Cambridge, MA, MIT Press. Jarvenpaa, S. L. & Leidner, D. E. (1999). Communication and trust in global virtual teams.
Organization Science, 10, 791-815. McAllister, D. (1995). Affect- and cognition-based trust as foundations for interpersonal
cooperation in organizations. Academy of Management Journal, 38, 24-59. McEntire, D.A. (2002). Coordinating multi-organisational responses to disaster: Lessons
from the March 28, 2000, Forth Worth Tornado. Disaster Prevention and Management, 11, 369-379.
Meyerson, D., Weick, K.E. & Kramer, R.M. (1996). Swift trust and temporary groups. In Kramer, R. M. & Tyler, T.R. (Eds.) Trust in Organizations: Frontiers of Theory and Research. (pp. 166-195). Thousand Oaks, CA, Sage.
Norman, D. (1993). Things that make us smart: Defending human attributes in the age of the machine, Perseus Books.
Olson, G.M. & Olson, J.S. (2000). Distance matters. Human-Computer Interaction, 15, 139-178.
Olson, J.S., Teasley, S., Covi, L. & Olson, G.M. (2002). The (currently) unique advantages of collocated work. In Hinds, P.J. & Kiesler, S. (Eds.) Distributed Work. (pp. 113-136). Cambridge, MA, MIT Press.
Orton, J.D. & Weick, K.E. (1990). Loosely coupled systems: A reconceptualization. Academy of Management Review, 15, 203-223.
Perry, W.R. & Lindell, M.K. (2003). Preparedness for emergency response: Guidelines for the emergency planning process. Disasters, 27, 336-350.
Schunn, C., Crowley & Okada, T. (2002). What makes collaborations across a distance succeed? The case of the cognitive science community. In Hinds, P.J. & Kiesler, S. (Eds.) Distributed Work. (pp. 407-432). Cambridge, MA, MIT Press.
Suparamaniam, N. (2003). Renegotiation of authority in the face of surprise. Unpublished doctoral dissertation, Linköpings universitet, Linköping, Sweden.
Säljö, R. (2000). Lärande i praktiken: ett sociokulturellt perspektiv [Learning in Practice: A Socio-cultural Perspective], Stockholm, Prisma.
Turoff, M. (2002). Past and future emergency response information systems. Communications of the ACM, 45, 29-32.
Woltjer, R., Lindgren, I., & Smith, K. (in press). A case study of information and communication technology in emergency management training. International Journal of Emergency Management, special issue on Information Technology Supporting Incident Management Systems.
102
Joystick-controlled vehicles for rivers with severe disabilities
Joakim Östlund and Björn Peters
Swedish National Road and Transport Research Institute (VTI), Linköping, Sweden
Background
There are about fifteen cars with joystick controls, driven by drivers with severe disabilities, on the Swedish roads today. The joystick concept has made it possible for people with severe disabilities to drive their own car, partly without any personal assistance. The joystick control has been accepted as an alternative primary control for drivers with disabilities without any major investigations of the pros and cons of such a control system. There are practically no laws, standards or restrictions on joystick control-adaptations. The 4-way joystick combines three primary driving tasks, steer, brake and gas, in one single electronic control. Car adaptation companies and developers of joystick control systems are to some extent aware of potential risks and deficiencies with joystick controlled vehicles. It is obvious that the joystick in some cases can be difficult to handle and is therefore considered a last adaptation alternative. In spite of this, no documented effort has been made to investigate the possibilities to drive a joystick-controlled car in a safe and comfortable manner. Focusing on functionality, following two questions can be asked to make a first attempt to define areas of problems on the joystick system concept: (1) How should the joystick be designed to optimise the possibilities to control a car? (2) How should the drivers control movements be transmitted to the car, and the reaction of the car transmitted back to the driver as feedback, to make the driving task as easy, comfortable and safe as possible? An approach to answer these two questions is to: • Do research on the control task in general • Establish contact with adaptation companies and drivers of joystick controlled cars • Investigate the current joystick technology • And finally perform a manoeuvre test at a driving court This project does not result in guidelines or suggested restrictions on joystick controlled vehicles, but rather in specified risks with the joystick concept and alternative joystick system design solutions to reduce these risks. The drivers Persons today considered able to drive with a 4-way joystick, are mostly persons with severe muscular atrophy, caused by muscular dystrophy and spinal cord injuries. What these two categories of people share is very limited area of motion and very little strength. There are however mainly one quality that a joystick driver are considered to need, and that is well-developed precise motor-functions. This is common among people with muscular dystrophy, but not among people with high spinal cord injuries. People in the last category can lack perception of touch and be spastic. Mental resources and manual control of dynamic systems Often a control handling is a reaction to stimuli from the environment. For example could the driver in the car in front suddenly brake firmly, which would cause the driver in the rear car to brake as well. How fast an operator reacts to stimuli with the proper control movement, and how well the result becomes, depend on: • The number of alternative control movements • How well the control movement is learned • How complex the movement is. A complex movement needs more time to be initiated.
103
• How distracted the operator is by other tasks • How well prepared the operator is to the situation When performing several control-tasks at the same time, it is important that the different tasks are well distinguished - both in handling and perceiving feedback on reactions on control movements. If the tasks are poorly distinguished, interference can occur because the operator performs an unintended control-movement (handling interference) or because the operator can not distinguish the feedback between different control-tasks. Hence, this is most crucial in controlling a car with a joystick, because joystick control contains three control-tasks: Steering, braking and accelerating. Critical system qualities The gain between joystick angle and lateral angle of the front wheels is crucial. Large gain implies small joystick movements, but low precision. Small gain implies high precision, but large joystick movements. This must be considered when designing control-systems, so that the perfect compromise between accuracy and size of control-movements is achieved. To be able to control a system at all, the system's reaction to a control movement must be predictable. Time delays between control movement and system reaction greatly affects the predictability, which of course affects the control performance. Especially when performing several control tasks, time delays are crucial. Another important characteristic is how the system reacts to a constant input, i.e. a constant joystick-deflection for braking. Is the responded brake force also constant, or does it increase with time? Does the angle of the front wheels increase towards maximum for a constant joystick steering-deflection, or is the front wheel angle also constant? The relation between control movement and system reaction should be as easily comprehended as possible for optimal system control. In most cases this relation should be: Constant input - Constant output. One more quality that often increases the control performance is linearity between input (control movement) and output (system reaction). An example of good system design is the ordinary brake pedal: The relation between pedal force and brake force is approximately linear, and the brake force is constant for a constant force on the brake. Tactile Feedback transmitted to the car driver via the steering wheel, the pedals, the car seat etc. can inform the driver of the state of the car. Especially disturbances on the system are with advantage to the system control, transmitted to the operator. Visual feedback is often claimed to be the most important information channel in car driving. But for controlling a car it is likely that tactile feedback is of major importance as well. When natural tactile feedback is not available in a system, artificial feedback can be used to give the operator useful information on the system being controlled. Passive feedback is artificial feedback, based on a model of the system, and simulates the system reaction on a control movement. Disturbances on the system can of course not be simulated, which is a great deficiency with passive feedback. Active feedback however is artificial feedback, based on the system's true state. Active feedback can therefor transmit information on disturbances on the system. Passive feedback is mostly achieved with simple system models, springs and dampers. Active feedback is achieved with sensors, advanced models and mainly electrical servomotors. Joystick design and control-characteristics A 4-way joystick is a stick with two degrees of freedom, back-forth and side to side. For car driving the two degrees of freedom are used to control speed and road position. For car driving when high precision is needed, demanding precise motor functions from the driver, the joystick is rather small and is mainly controlled by small finger movements and hand rotations. The disabled drivers mostly lack strength and hand mobility, why the joystick's area of motion that can be used for car control sometimes is further reduced.
104
Joystick feedback is at this time passive, realised with dampers and springs. As a consequence, much of the information normally transmitted to the driver by steering wheel and brake pedal is eliminated. The joystick steering-angle does not necessarily correspond to the actual steering angle of the front wheels. The driver does not "feel" the road as with an ordinary steering wheel, why disturbances and slippery roads can be hard to detect and compensated for. The driver can not feel the brake force in the joystick, as in the brake pedal. The total area of motion for the steering wheel is approximately 4 full revolutions. For the ordinary joystick it is 1/8 revolution. It is obvious that if there were a direct linear connection between joystick-angle and front wheel-angle, a great precision-problem would occur. It would not be possible to steer the car at all speeds. The common solution to this is to still have the linear connection, but to make gain factor between joystick angle and front wheel angle speed-dependent (smaller factor in higher speeds) and make the steering servo work slower for higher speeds. This implies that the driver can make fast and large joystick movements, but the steering system responds with a little and relatively slow change in front wheel angle. As a consequence, it may not possible to perform very fast and great steering manoeuvres, and there is not a correspondence between joystick and steering wheel at all times. This correspondence is very important in critical situations. The joystick-brake is controlled with a joystick-angle. The brake pedal is controlled with a force, which is the most natural since a body in motion is normally decelerated with a force. It is a more complex task to find a position and to change it, than finding and changing an exerted force. In a critical situation it is therefore likely that a position-controlled brake gives the driver less possibilities to control the brake-function than with a force controlled brake. Of course the forces needed to brake must be adapted to the impaired driver's capabilities. It is important that the connection between joystick angle/position corresponds linearly to the brake force. Because of the joystick as a stick with two degrees of movement-freedom, interference can occur between speed control and road position control. It is not easy to know or feel in every moment in which direction the joystick should be moved to control the car as wanted. An example is when applying the brakes in a curve: The steering angle should be held constant, but the joystick must be pushed forwards (or backwards) to brake. The steering angle is easily affected in this control movement. Summary of deficiencies Three possible deficiencies can be identified for the joystick systems of today: 1. The passive feedback does not guarantee that joystick angle and front wheel angle
correspond. Time delays therefore occur between joystick steering movements and change in front wheel angle. This could be crucial in critical situations.
2. The joystick brake can be difficult to handle because it is position-controlled and lacks force feedback on the actual brake force.
3. Interference can occur due to the joystick design as a stick with two degrees of freedom.
The manoeuvre test at Mantorp Driving Court Objectives and Method To assess the relevance of the deficiencies listed above, three manoeuvres were performed by experienced joystick car-drivers. Five drivers with different severe physical disabilities participated in the test with their own joystick-equipped cars. Also a control group of five non-disabled drivers participated and drove the manoeuvres with a conventional car. The different tests were: 1. Firm braking on straight road. 2. Firm braking in a curve
105
3. Double-lane change. The objective of the first manoeuvre was to assess the possibilities to perform a firm and fast stop of the car, under control and without too much discomfort. It was also interesting from an interference point of view to se how a fast joystick brake-movement affected the lateral control, how an unintended change of course was corrected for, and how the correction affected the brake force. The manoeuvre was performed in 60 km/h. The objective of the second test was mainly the same as in the first test. But due to the curvature the greater difficulties of braking and steering were expected to affect the car control to a larger extent than in the first manoeuvre. The test was performed in 60 and 70 km/h. The objective of the last test, the double lane change, was to investigate the possibilities to perform a fast lane change. Expected results were interference, unstable lateral control, and difficulties to steer fast enough. The manoeuvre was performed in 40, 45 and 50 km/h. Equipment Lateral and longitudinal forces on the cars were measured with an acceleration measuring-system, which was easily installed under the front passenger seat in the cars. Cones marked the different driving courses for the different manoeuvres. All manoeuvres were recorded with a video camera.
Results and conclusions The results of the braking manoeuvres were mainly: • Joystick drivers stopped the cars more firmly when the manoeuvre was difficult than
when it was easy. The control group braked with the same force, independent of difficulty.
• The brake force varied more for the joystick drivers. • If the driving course unintentionally was changed for the joystick drivers, a correction
often resulted in a change of brake force as well. This did not happen for the control group.
A conclusion of this is that joystick drivers have less brake control than non-disabled drivers. If the brake force curves are studied, it is clear that joystick drivers quite fast find an adequate brake force. This force is held constant until the car stops, unless the driver tries to change the brake force or if the lateral control needs attention and correction. If this happens, the brake force can begin to fluctuate much. The brake force seems to be difficult to change when driving with joystick. The results of the double lane change was: • The joystick drivers had great difficulties in managing the manoeuvre in 50 km/h, but
also in 45 km/h, and to some extent in 40 km/h. They hit cones in almost every try. The control group had practically no troubles in managing the manoeuvre in any of the three speeds. The problem for the joystick drivers was that they did not/could not steer much enough to manage the manoeuvre.
• Interference occurred for the joystick drivers, especially in the lane changes firm brake force could be applied.
Either the joystick drivers did not want/dare to steer as much as needed to manage the manoeuvre, or the steering system did not allow that fast and great steering manoeuvre.
106
Possibly both the joystick system and the drivers were pushed to the limits of their capabilities. The interference that occurred did not only depend on false-directed joystick movements, but also on joystick movements induced by body movements, in turn caused by car movements. In narrow curves the body of the joystick driver can move a few centimetres to the front left/right. This can induce joystick movements. Solutions The following joystick design features could improve the possibilities to control a car with a joystick: • Active feedback in steering would give the driver adequate information on road surface,
front wheel steering angle, and also reduce time delays between joystick movement and front wheel angle change.
• Force controlled acceleration and deceleration would reduce interference between steering and gas/brake. It would probably enhance brake performance as well.
• A redesign of the joystick should be made to distinguish steering from braking/accelerating.
It is of most importance that the driver is firmly fixated in relation to the car and joystick, so that car-movements can not be induced to the joystick through the driver. I consider adequate body support as the most important issue to solve. With insufficient support, a great joystick control system is of no use.
107
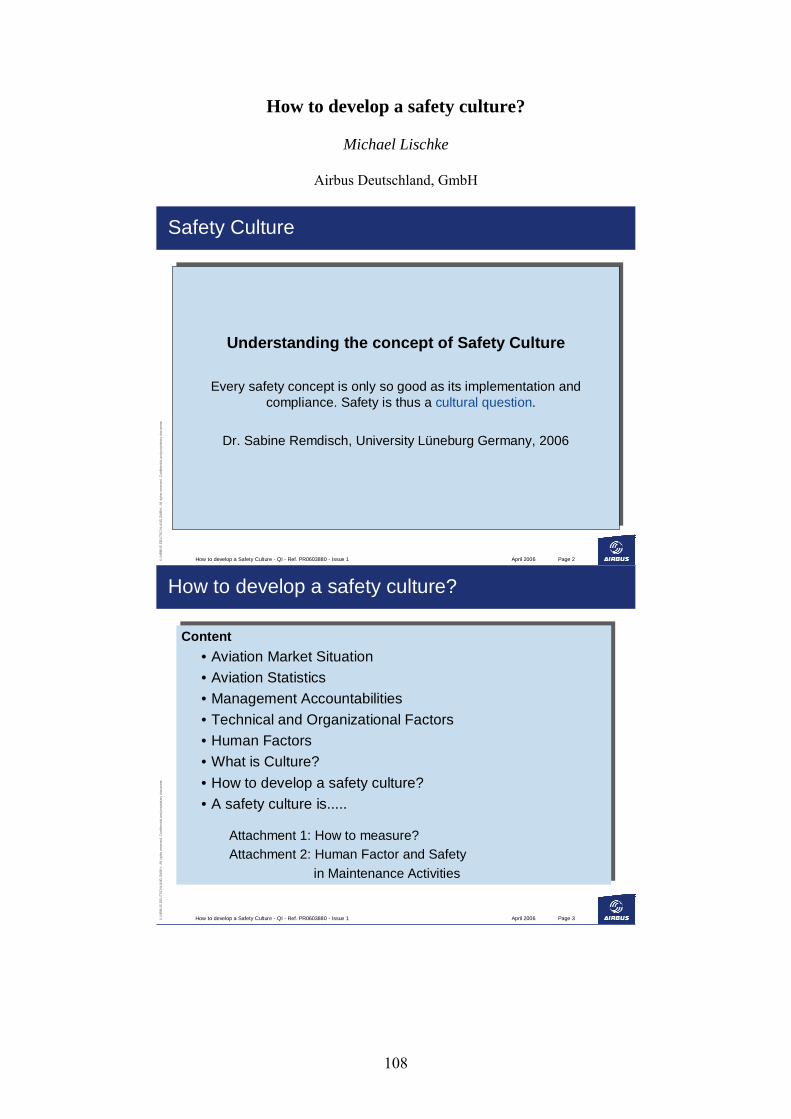
How to develop a safety culture?
Michael Lischke
Airbus Deutschland, GmbH
April 2006How to develop a Safety Culture - QI - Ref. PR0603880 - Issue 1 Page 2©A
IRB
US D
EU
TSC
HLA
ND
GM
BH.
All
right
s re
serv
ed. C
onfid
entia
l and
pro
prie
tary
doc
umen
t.
Safety Culture
Understanding the concept of Safety Culture
Every safety concept is only so good as its implementation and compliance. Safety is thus a cultural question.
Dr. Sabine Remdisch, University Lüneburg Germany, 2006
April 2006How to develop a Safety Culture - QI - Ref. PR0603880 - Issue 1 Page 3©A
IRB
US D
EU
TSC
HLA
ND
GM
BH.
All
right
s re
serv
ed. C
onfid
entia
l and
pro
prie
tary
doc
umen
t.
How to develop a safety culture?
Content• Aviation Market Situation• Aviation Statistics• Management Accountabilities• Technical and Organizational Factors• Human Factors• What is Culture?• How to develop a safety culture?• A safety culture is.....
Attachment 1: How to measure?Attachment 2: Human Factor and Safety
in Maintenance Activities
108
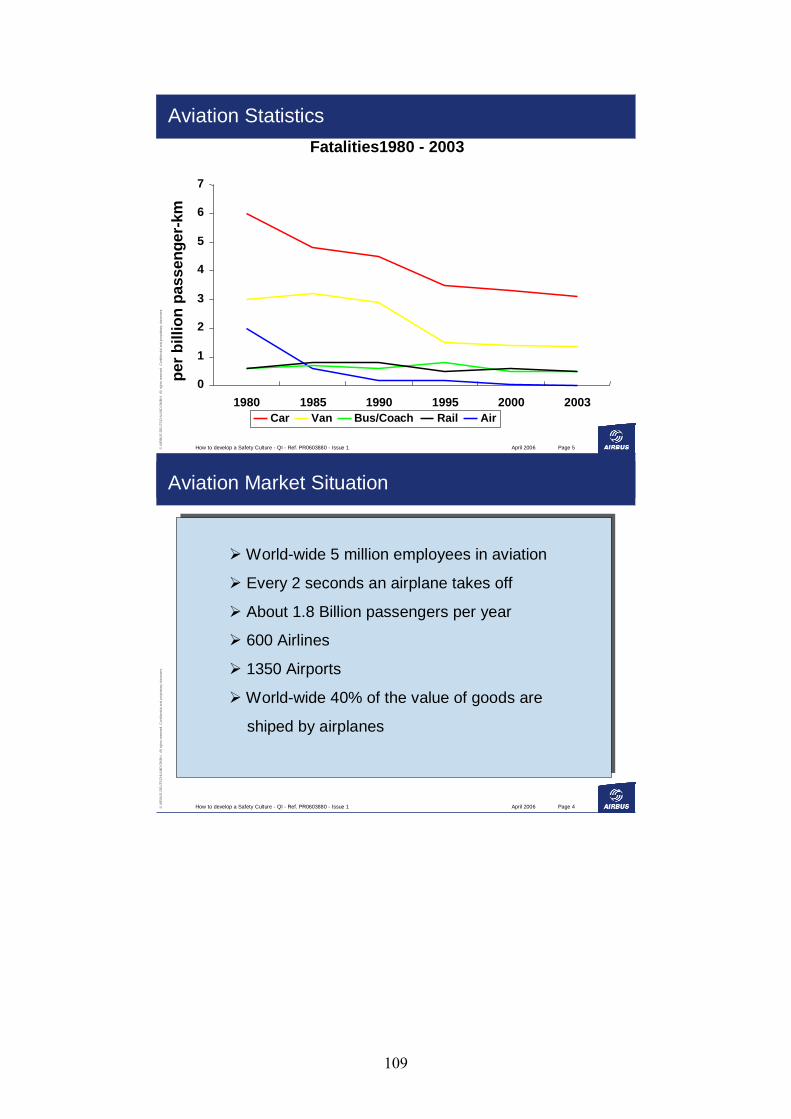
April 2006How to develop a Safety Culture - QI - Ref. PR0603880 - Issue 1 Page 5©A
IRB
US D
EU
TSC
HLA
ND
GM
BH.
All
right
s re
serv
ed. C
onfid
entia
l and
pro
prie
tary
doc
umen
t.
Aviation StatisticsFatalities1980 - 2003
0
1
2
3
4
5
6
7
1980 1985 1990 1995 2000 2003
per b
illio
n pa
ssen
ger-
km
Car Van Bus/Coach Rail Air
April 2006How to develop a Safety Culture - QI - Ref. PR0603880 - Issue 1 Page 4©A
IRB
US D
EU
TSC
HLA
ND
GM
BH.
All
right
s re
serv
ed. C
onfid
entia
l and
pro
prie
tary
doc
umen
t.
World-wide 5 million employees in aviation
Every 2 seconds an airplane takes off
About 1.8 Billion passengers per year
600 Airlines
1350 Airports
World-wide 40% of the value of goods are
shiped by airplanes
Aviation Market Situation
109
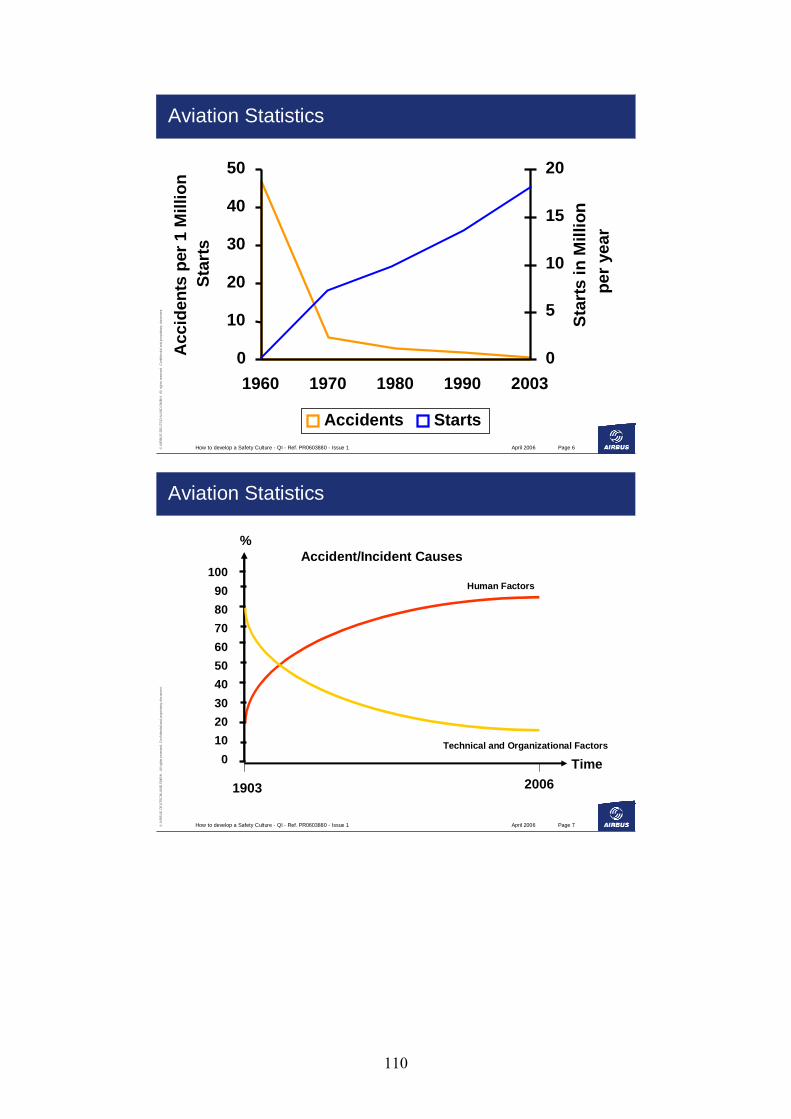
April 2006How to develop a Safety Culture - QI - Ref. PR0603880 - Issue 1 Page 6©A
IRB
US D
EU
TSC
HLA
ND
GM
BH.
All
right
s re
serv
ed. C
onfid
entia
l and
pro
prie
tary
doc
umen
t.
Aviation Statistics
0
10
20
30
40
50
1960 1970 1980 1990 2003
Acc
iden
tspe
r 1 M
illio
n St
arts
0
5
10
15
20
Star
ts in
Mill
ion
per y
ear
Accidents Starts
April 2006How to develop a Safety Culture - QI - Ref. PR0603880 - Issue 1 Page 7©A
IRB
US D
EU
TSC
HLA
ND
GM
BH.
All
right
s re
serv
ed. C
onfid
entia
l and
pro
prie
tary
doc
umen
t.
Human Factors
Aviation Statistics
100908070605040302010
0 Time
1903 2006
%Accident/Incident Causes
Technical and Organizational Factors
110

April 2006How to develop a Safety Culture - QI - Ref. PR0603880 - Issue 1 Page 8©A
IRB
US D
EU
TSC
HLA
ND
GM
BH.
All
right
s re
serv
ed. C
onfid
entia
l and
pro
prie
tary
doc
umen
t.
Aviation Statistics
Aviation has become more and more safe during the last 50 years.
Some experts still forecast a clear increase of the accidents.
Year 2015: - about 2 billion passengers
- about 23000 airplanes
Air traffic control becomes more and more complex.
April 2006How to develop a Safety Culture - QI - Ref. PR0603880 - Issue 1 Page 9©A
IRB
US D
EU
TSC
HLA
ND
GM
BH.
All
right
s re
serv
ed. C
onfid
entia
l and
pro
prie
tary
doc
umen
t.
Management Accountabilities
Success = f (Productivity, Product Safety)
Costs
Time Quality
ProductivityProductivity
Product Liability
Product SafetyProduct Safety
Product Integrity
111
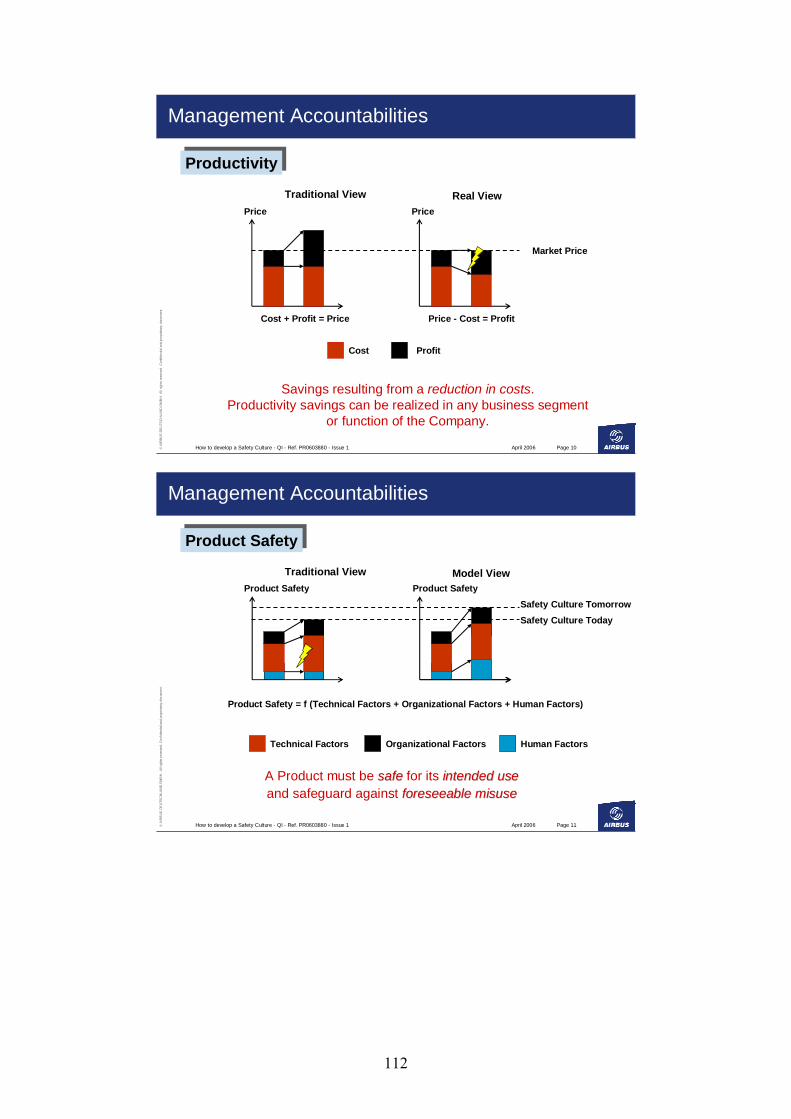
April 2006How to develop a Safety Culture - QI - Ref. PR0603880 - Issue 1 Page 10©A
IRB
US D
EU
TSC
HLA
ND
GM
BH.
All
right
s re
serv
ed. C
onfid
entia
l and
pro
prie
tary
doc
umen
t.
Price
Cost + Profit = Price
Traditional View
ProfitCost
ProductivityProductivity
Market Price
Price
Price - Cost = Profit
Real View
Management Accountabilities
Savings resulting from a reduction in costs. Productivity savings can be realized in any business segment
or function of the Company.
April 2006How to develop a Safety Culture - QI - Ref. PR0603880 - Issue 1 Page 11©A
IRB
US D
EU
TSC
HLA
ND
GM
BH.
All
right
s re
serv
ed. C
onfid
entia
l and
pro
prie
tary
doc
umen
t.
Product SafetyProduct Safety
Safety Culture TodaySafety Culture Tomorrow
Organizational FactorsTechnical Factors Human Factors
Product Safety
Product Safety = f (Technical Factors + Organizational Factors + Human Factors)
Traditional View Model ViewProduct Safety
Management Accountabilities
A Product must be safesafe for its intended useintended useand safeguard against foreseeable misuseforeseeable misuse
112
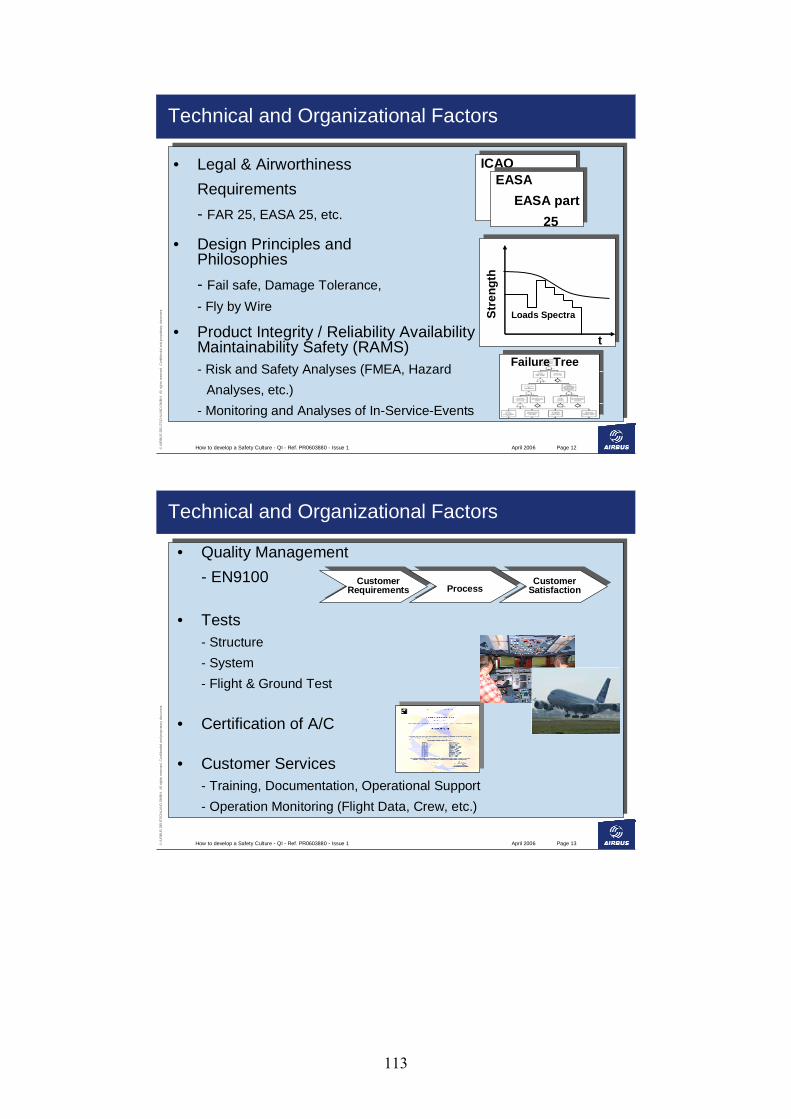
April 2006How to develop a Safety Culture - QI - Ref. PR0603880 - Issue 1 Page 12©A
IRB
US D
EU
TSC
HLA
ND
GM
BH.
All
right
s re
serv
ed. C
onfid
entia
l and
pro
prie
tary
doc
umen
t.
Technical and Organizational Factors
• Legal & Airworthiness Requirements- FAR 25, EASA 25, etc.
• Design Principles and Philosophies- Fail safe, Damage Tolerance,- Fly by Wire
t
Stre
ngth
Loads Spectra
• Product Integrity / Reliability Availability Maintainability Safety (RAMS)- Risk and Safety Analyses (FMEA, Hazard
Analyses, etc.)- Monitoring and Analyses of In-Service-Events
Failure Tree
ICAOICAOEASA
EASA part 25
EASAEASA part
25
April 2006How to develop a Safety Culture - QI - Ref. PR0603880 - Issue 1 Page 13©A
IRB
US D
EU
TSC
HLA
ND
GM
BH.
All
right
s re
serv
ed. C
onfid
entia
l and
pro
prie
tary
doc
umen
t.
• Quality Management- EN9100
• Tests- Structure- System- Flight & Ground Test
• Certification of A/C
• Customer Services- Training, Documentation, Operational Support- Operation Monitoring (Flight Data, Crew, etc.)
Customer Requirements Process
Customer Satisfaction
Technical and Organizational Factors
113
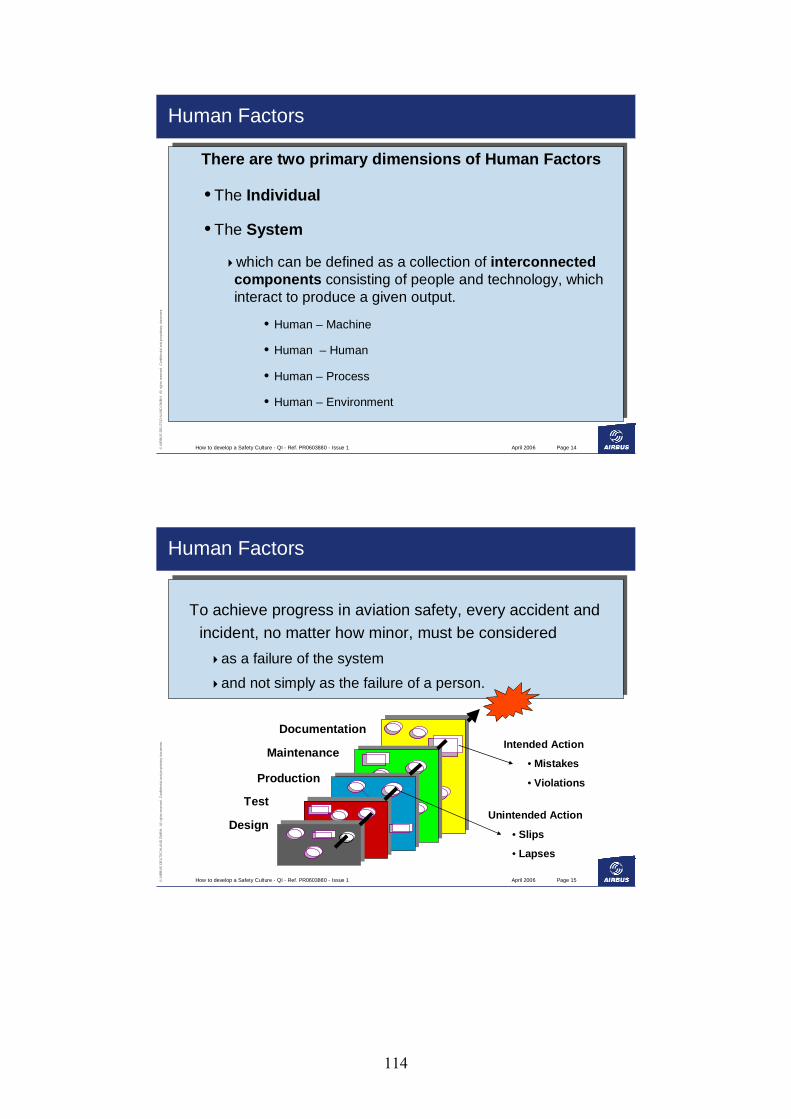
April 2006How to develop a Safety Culture - QI - Ref. PR0603880 - Issue 1 Page 14©A
IRB
US D
EU
TSC
HLA
ND
GM
BH.
All
right
s re
serv
ed. C
onfid
entia
l and
pro
prie
tary
doc
umen
t.There are two primary dimensions of Human Factors
• The Individual
• The System
which can be defined as a collection of interconnected components consisting of people and technology, which interact to produce a given output.
• Human – Machine
• Human – Human
• Human – Process
• Human – Environment
Human Factors
April 2006How to develop a Safety Culture - QI - Ref. PR0603880 - Issue 1 Page 15©A
IRB
US D
EU
TSC
HLA
ND
GM
BH.
All
right
s re
serv
ed. C
onfid
entia
l and
pro
prie
tary
doc
umen
t.
To achieve progress in aviation safety, every accident and incident, no matter how minor, must be considered
as a failure of the system
and not simply as the failure of a person.
Human Factors
Design
Test
Production
Maintenance
Unintended Action
• Slips
• Lapses
Intended Action
• Mistakes
• Violations
Documentation
114
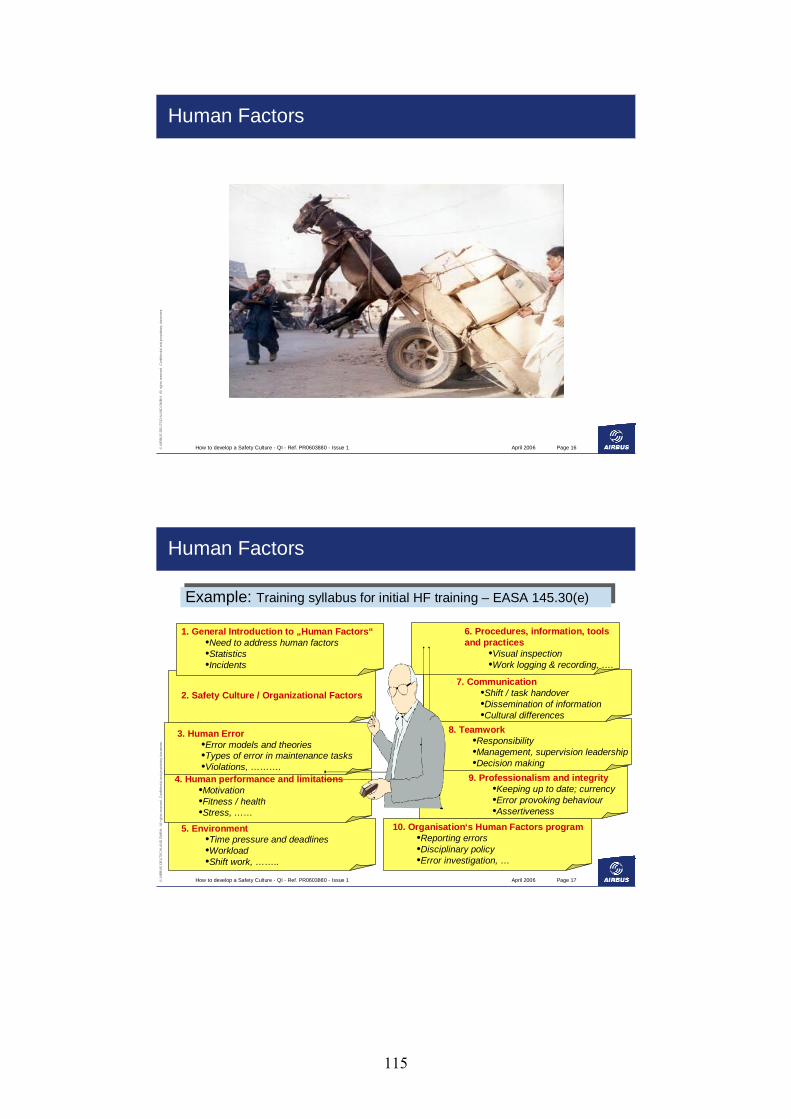
April 2006How to develop a Safety Culture - QI - Ref. PR0603880 - Issue 1 Page 16©A
IRB
US D
EU
TSC
HLA
ND
GM
BH.
All
right
s re
serv
ed. C
onfid
entia
l and
pro
prie
tary
doc
umen
t.
Human Factors
April 2006How to develop a Safety Culture - QI - Ref. PR0603880 - Issue 1 Page 17©A
IRB
US D
EU
TSC
HLA
ND
GM
BH.
All
right
s re
serv
ed. C
onfid
entia
l and
pro
prie
tary
doc
umen
t.
2. Safety Culture / Organizational Factors
5. Environment
6. Procedures, information, tools and practices
7. Communication
4. Human performance and limitations
•Time pressure and deadlines•Workload•Shift work, ……..
•Visual inspection•Work logging & recording, ….
•Shift / task handover•Dissemination of information•Cultural differences
•Motivation•Fitness / health•Stress, ……
Human Factors
Example: Training syllabus for initial HF training – EASA 145.30(e)Example: Training syllabus for initial HF training – EASA 145.30(e)
•Reporting errors•Disciplinary policy•Error investigation, …
•Need to address human factors•Statistics•Incidents
•Error models and theories•Types of error in maintenance tasks•Violations, ……….
•Responsibility•Management, supervision leadership•Decision making
•Keeping up to date; currency•Error provoking behaviour•Assertiveness
10. Organisation‘s Human Factors program
1. General Introduction to „Human Factors“
3. Human Error 8. Teamwork
9. Professionalism and integrity
115
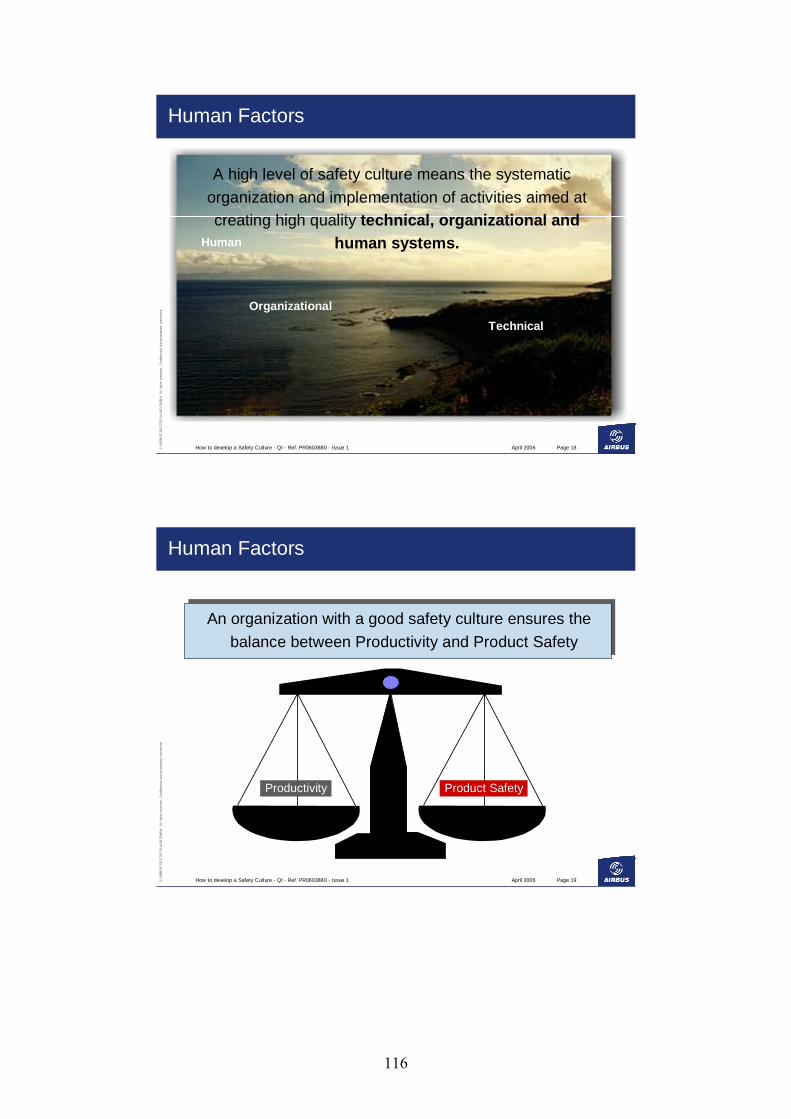
April 2006How to develop a Safety Culture - QI - Ref. PR0603880 - Issue 1 Page 18©A
IRB
US D
EU
TSC
HLA
ND
GM
BH.
All
right
s re
serv
ed. C
onfid
entia
l and
pro
prie
tary
doc
umen
t.
A high level of safety culture means the systematic organization and implementation of activities aimed at creating high quality technical, organizational and
human systems.
TechnicalOrganizational
Human
Human Factors
April 2006How to develop a Safety Culture - QI - Ref. PR0603880 - Issue 1 Page 19©A
IRB
US D
EU
TSC
HLA
ND
GM
BH.
All
right
s re
serv
ed. C
onfid
entia
l and
pro
prie
tary
doc
umen
t.
Productivity Product Safety
An organization with a good safety culture ensures the balance between Productivity and Product Safety
Human Factors
116
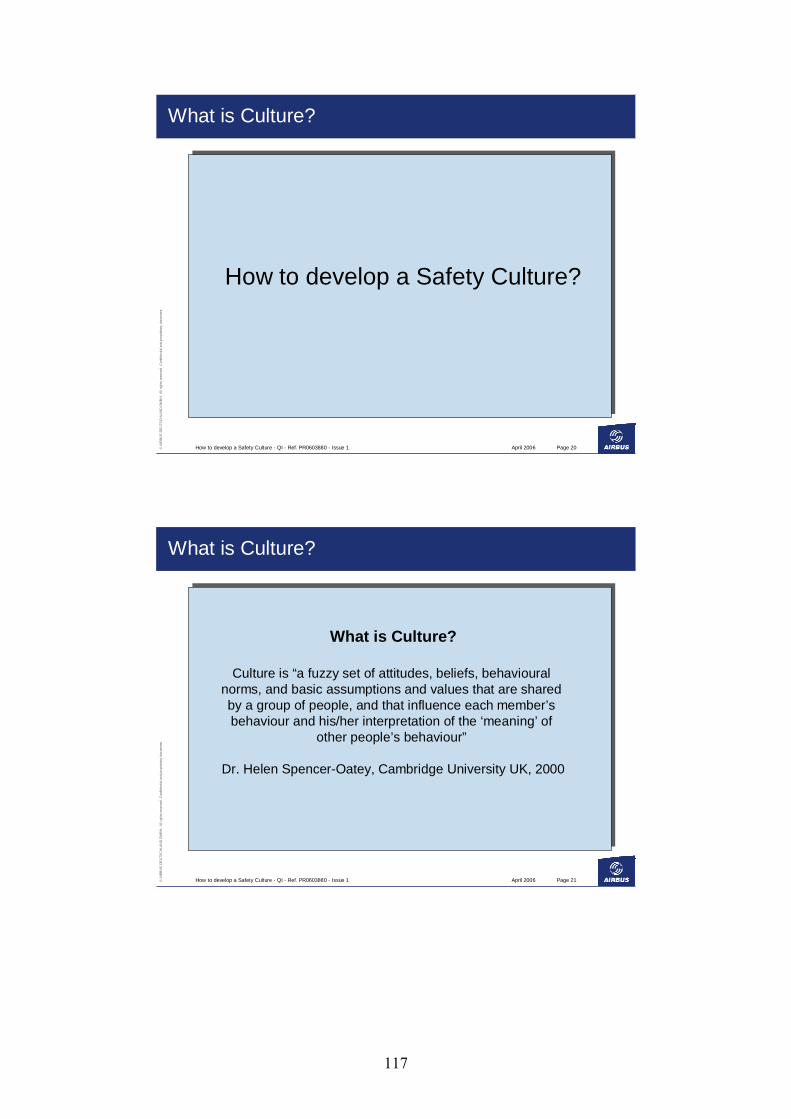
April 2006How to develop a Safety Culture - QI - Ref. PR0603880 - Issue 1 Page 20©A
IRB
US D
EU
TSC
HLA
ND
GM
BH.
All
right
s re
serv
ed. C
onfid
entia
l and
pro
prie
tary
doc
umen
t.
How to develop a Safety Culture?
What is Culture?
April 2006How to develop a Safety Culture - QI - Ref. PR0603880 - Issue 1 Page 21©A
IRB
US D
EU
TSC
HLA
ND
GM
BH.
All
right
s re
serv
ed. C
onfid
entia
l and
pro
prie
tary
doc
umen
t.
What is Culture?
What is Culture?
Culture is “a fuzzy set of attitudes, beliefs, behavioural norms, and basic assumptions and values that are shared by a group of people, and that influence each member’s behaviour and his/her interpretation of the ‘meaning’ of
other people’s behaviour”
Dr. Helen Spencer-Oatey, Cambridge University UK, 2000
117
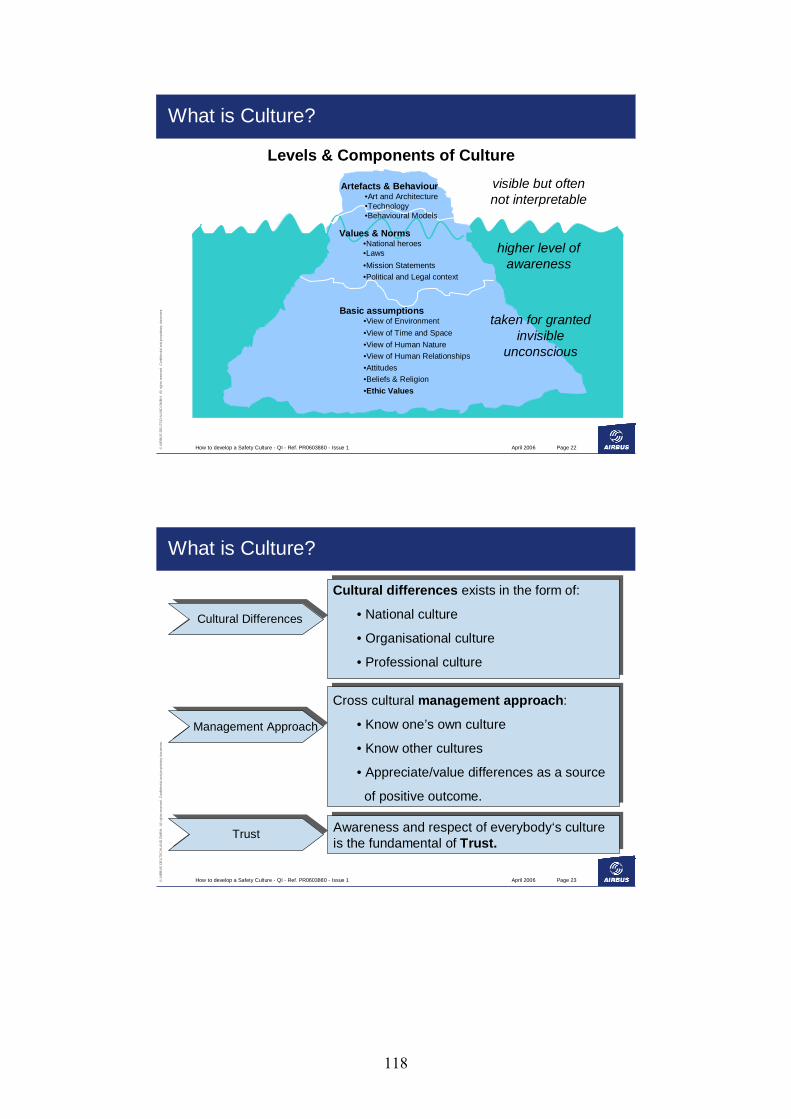
April 2006How to develop a Safety Culture - QI - Ref. PR0603880 - Issue 1 Page 22©A
IRB
US D
EU
TSC
HLA
ND
GM
BH.
All
right
s re
serv
ed. C
onfid
entia
l and
pro
prie
tary
doc
umen
t.
What is Culture?
Basic assumptions •View of Environment•View of Time and Space•View of Human Nature•View of Human Relationships•Attitudes•Beliefs & Religion•Ethic Values
taken for granted invisible
unconscious
Values & Norms •National heroes•Laws•Mission Statements•Political and Legal context
higher level of awareness
Artefacts & Behaviour•Art and Architecture•Technology•Behavioural Models
visible but often not interpretable
Levels & Components of Culture
April 2006How to develop a Safety Culture - QI - Ref. PR0603880 - Issue 1 Page 23©A
IRB
US D
EU
TSC
HLA
ND
GM
BH.
All
right
s re
serv
ed. C
onfid
entia
l and
pro
prie
tary
doc
umen
t.
Awareness and respect of everybody‘s culture is the fundamental of Trust.
Awareness and respect of everybody‘s culture is the fundamental of Trust.
Trust
What is Culture?
Management Approach
Cross cultural management approach:
• Know one’s own culture
• Know other cultures
• Appreciate/value differences as a source
of positive outcome.
Cultural Differences
Cultural differences exists in the form of:
• National culture
• Organisational culture
• Professional culture
118
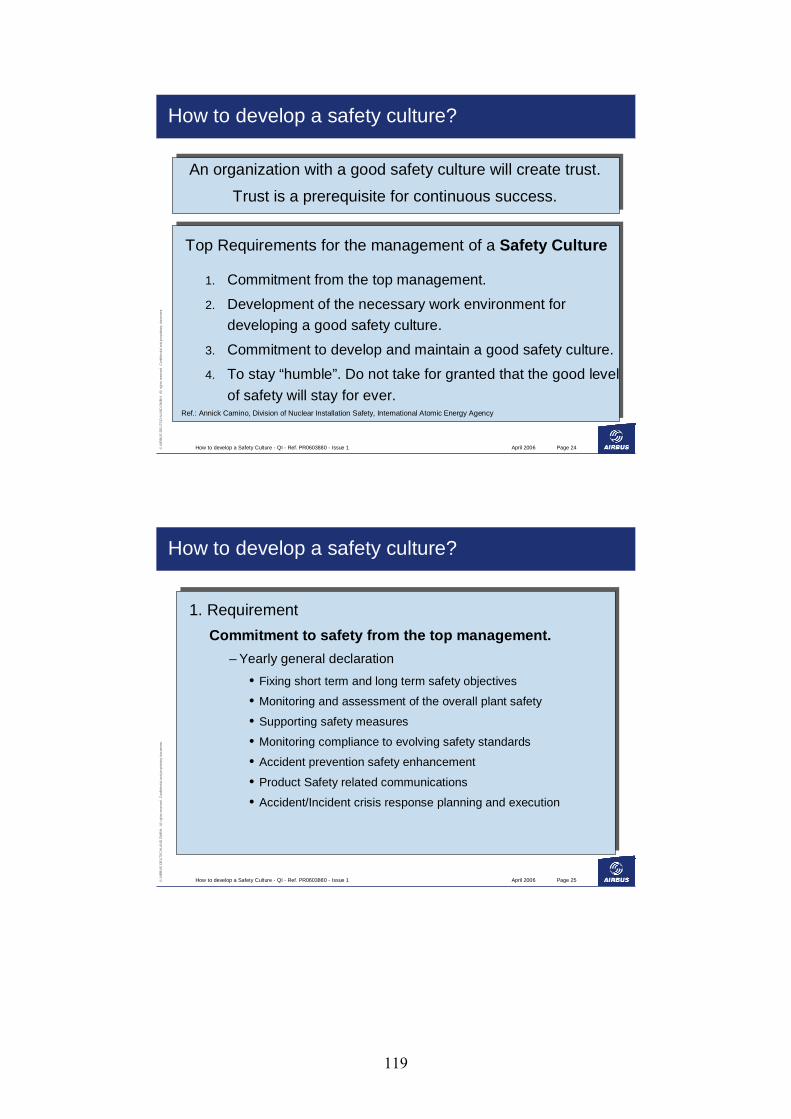
April 2006How to develop a Safety Culture - QI - Ref. PR0603880 - Issue 1 Page 24©A
IRB
US D
EU
TSC
HLA
ND
GM
BH.
All
right
s re
serv
ed. C
onfid
entia
l and
pro
prie
tary
doc
umen
t.
How to develop a safety culture?
Top Requirements for the management of a Safety Culture
1. Commitment from the top management.
2. Development of the necessary work environment for developing a good safety culture.
3. Commitment to develop and maintain a good safety culture.
4. To stay “humble”. Do not take for granted that the good level of safety will stay for ever.
An organization with a good safety culture will create trust.
Trust is a prerequisite for continuous success.
Ref.: Annick Carnino, Division of Nuclear Installation Safety, International Atomic Energy Agency
April 2006How to develop a Safety Culture - QI - Ref. PR0603880 - Issue 1 Page 25©A
IRB
US D
EU
TSC
HLA
ND
GM
BH.
All
right
s re
serv
ed. C
onfid
entia
l and
pro
prie
tary
doc
umen
t.
How to develop a safety culture?
1. RequirementCommitment to safety from the top management.
– Yearly general declaration• Fixing short term and long term safety objectives
• Monitoring and assessment of the overall plant safety
• Supporting safety measures
• Monitoring compliance to evolving safety standards
• Accident prevention safety enhancement
• Product Safety related communications
• Accident/Incident crisis response planning and execution
119
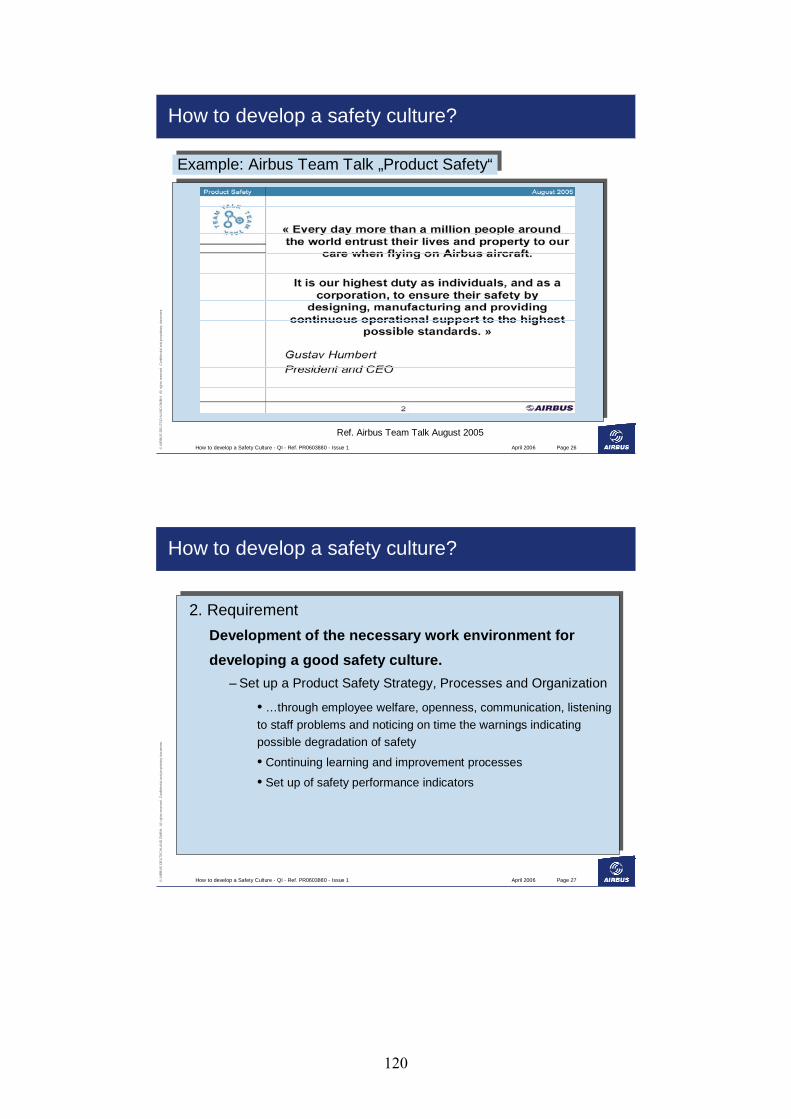
April 2006How to develop a Safety Culture - QI - Ref. PR0603880 - Issue 1 Page 26©A
IRB
US D
EU
TSC
HLA
ND
GM
BH.
All
right
s re
serv
ed. C
onfid
entia
l and
pro
prie
tary
doc
umen
t.
How to develop a safety culture?
Ref. Airbus Team Talk August 2005
Example: Airbus Team Talk „Product Safety“Example: Airbus Team Talk „Product Safety“
April 2006How to develop a Safety Culture - QI - Ref. PR0603880 - Issue 1 Page 27©A
IRB
US D
EU
TSC
HLA
ND
GM
BH.
All
right
s re
serv
ed. C
onfid
entia
l and
pro
prie
tary
doc
umen
t.
2. RequirementDevelopment of the necessary work environment fordeveloping a good safety culture.
– Set up a Product Safety Strategy, Processes and Organization
• …through employee welfare, openness, communication, listening to staff problems and noticing on time the warnings indicating possible degradation of safety
• Continuing learning and improvement processes
• Set up of safety performance indicators
How to develop a safety culture?
120
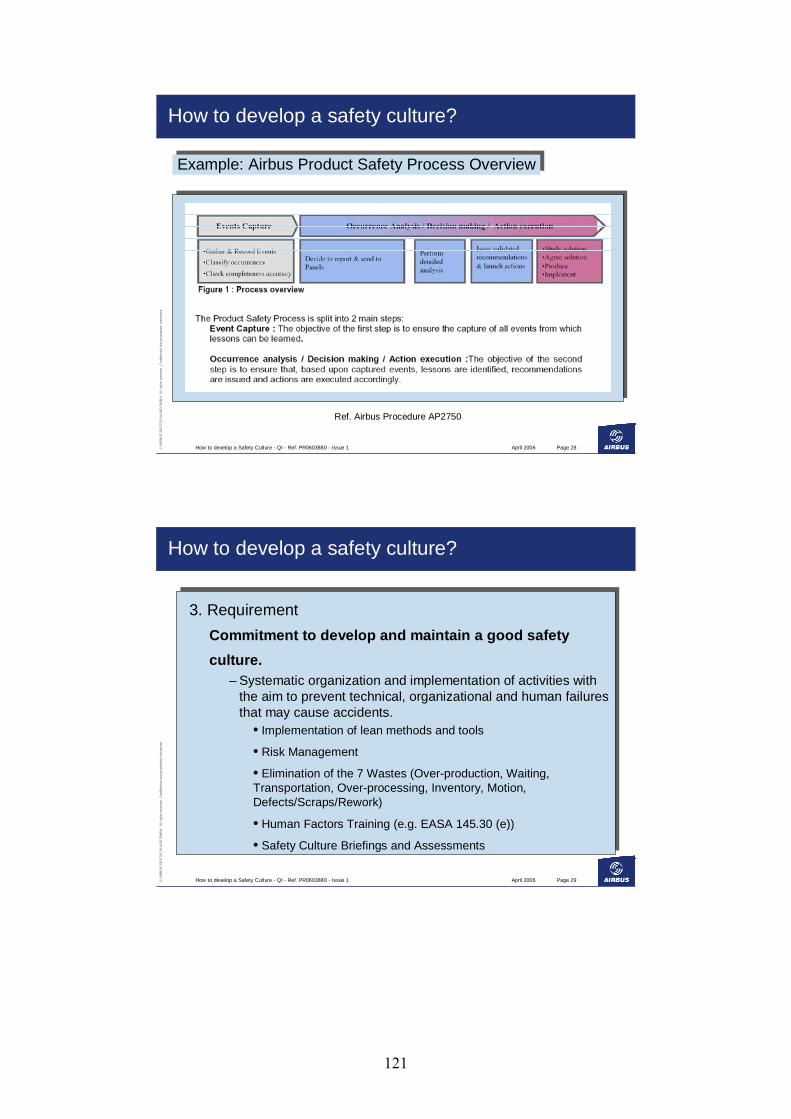
April 2006How to develop a Safety Culture - QI - Ref. PR0603880 - Issue 1 Page 28©A
IRB
US D
EU
TSC
HLA
ND
GM
BH.
All
right
s re
serv
ed. C
onfid
entia
l and
pro
prie
tary
doc
umen
t.
How to develop a safety culture?
Example: Airbus Product Safety Process OverviewExample: Airbus Product Safety Process Overview
Ref. Airbus Procedure AP2750
April 2006How to develop a Safety Culture - QI - Ref. PR0603880 - Issue 1 Page 29©A
IRB
US D
EU
TSC
HLA
ND
GM
BH.
All
right
s re
serv
ed. C
onfid
entia
l and
pro
prie
tary
doc
umen
t.
How to develop a safety culture?
3. RequirementCommitment to develop and maintain a good safetyculture.
– Systematic organization and implementation of activities with the aim to prevent technical, organizational and human failures that may cause accidents.
• Implementation of lean methods and tools
• Risk Management
• Elimination of the 7 Wastes (Over-production, Waiting, Transportation, Over-processing, Inventory, Motion, Defects/Scraps/Rework)
• Human Factors Training (e.g. EASA 145.30 (e))
• Safety Culture Briefings and Assessments
121
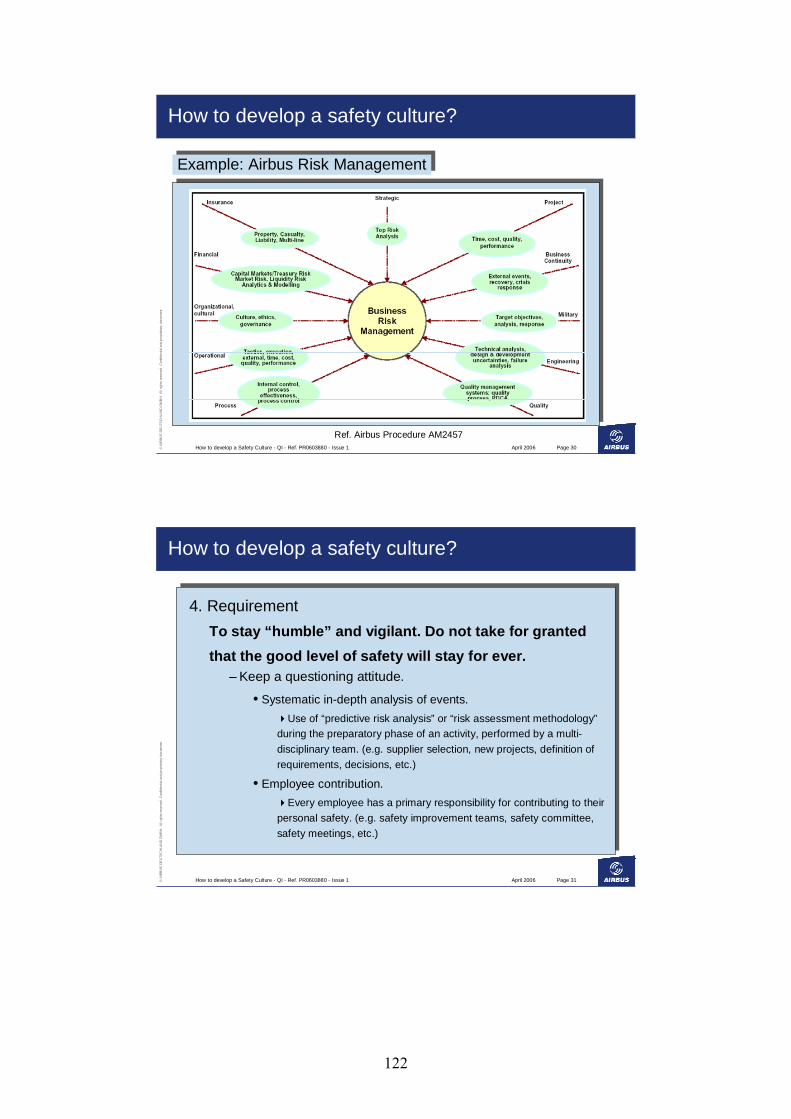
April 2006How to develop a Safety Culture - QI - Ref. PR0603880 - Issue 1 Page 30©A
IRB
US D
EU
TSC
HLA
ND
GM
BH.
All
right
s re
serv
ed. C
onfid
entia
l and
pro
prie
tary
doc
umen
t.Example: Airbus Risk ManagementExample: Airbus Risk Management
Ref. Airbus Procedure AM2457
How to develop a safety culture?
April 2006How to develop a Safety Culture - QI - Ref. PR0603880 - Issue 1 Page 31©A
IRB
US D
EU
TSC
HLA
ND
GM
BH.
All
right
s re
serv
ed. C
onfid
entia
l and
pro
prie
tary
doc
umen
t.
4. RequirementTo stay “humble” and vigilant. Do not take for grantedthat the good level of safety will stay for ever.
– Keep a questioning attitude.
• Systematic in-depth analysis of events.Use of “predictive risk analysis” or “risk assessment methodology”
during the preparatory phase of an activity, performed by a multi-disciplinary team. (e.g. supplier selection, new projects, definition of requirements, decisions, etc.)
• Employee contribution. Every employee has a primary responsibility for contributing to their
personal safety. (e.g. safety improvement teams, safety committee, safety meetings, etc.)
How to develop a safety culture?
122
April 2006How to develop a Safety Culture - QI - Ref. PR0603880 - Issue 1 Page 32©A
IRB
US D
EU
TSC
HLA
ND
GM
BH.
All
right
s re
serv
ed. C
onfid
entia
l and
pro
prie
tary
doc
umen
t.
4. Requirement (contd.)
•Management contribution.To encourage the development of employee attitudes that give them
confidence, without fear of blame, to report fully errors.
•Ability to learn. The enhancement of aviation safety relies on reactive and proactive
prevention.
Errors considered as a learning opportunity, especially human ororganizational errors.
How to develop a safety culture?
April 2006How to develop a Safety Culture - QI - Ref. PR0603880 - Issue 1 Page 33©A
IRB
US D
EU
TSC
HLA
ND
GM
BH.
All
right
s re
serv
ed. C
onfid
entia
l and
pro
prie
tary
doc
umen
t.
How to develop a safety culture?
Even if specifications, capabilities and qualifications are properly
implemented and assessed in the business, there is still a risk of non-quality,
which is purely linked to human performance.
Example: IAQG Human Factors InitiativeExample: IAQG Human Factors Initiative
IAQG: International Aerospace Quality Group
123
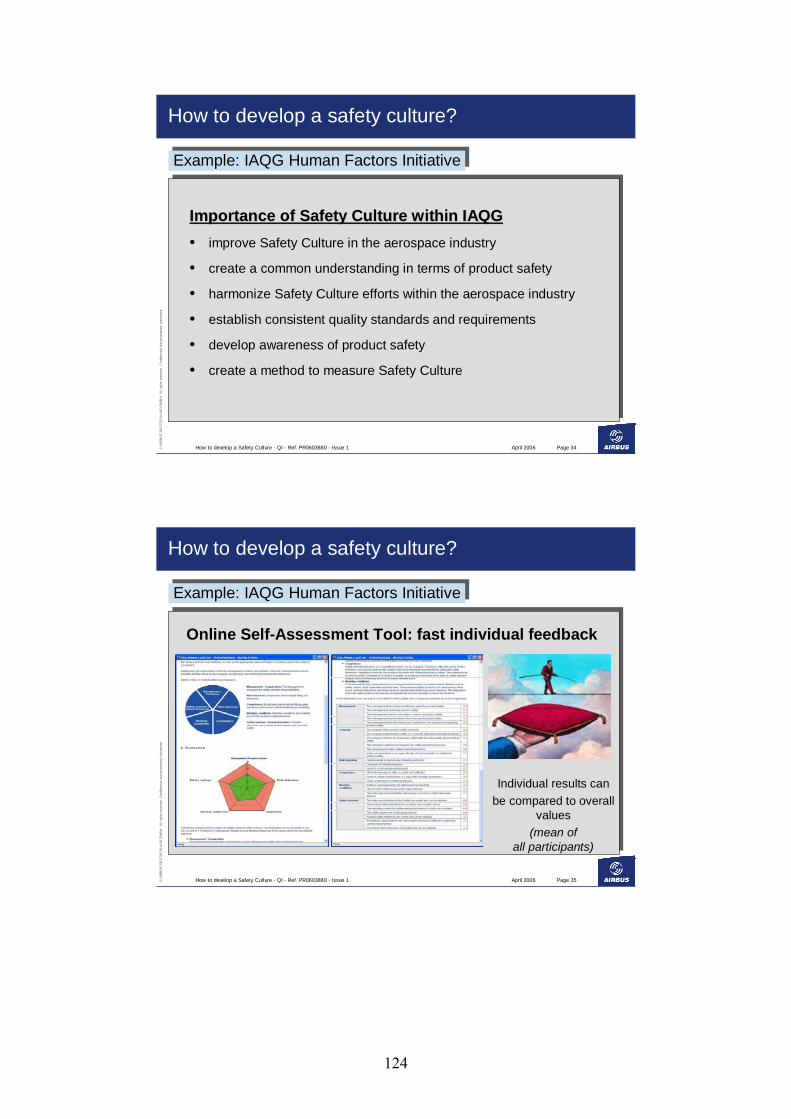
April 2006How to develop a Safety Culture - QI - Ref. PR0603880 - Issue 1 Page 34©A
IRB
US D
EU
TSC
HLA
ND
GM
BH.
All
right
s re
serv
ed. C
onfid
entia
l and
pro
prie
tary
doc
umen
t.
How to develop a safety culture?
ImportanceImportance of of Safety Culture withinSafety Culture within IAQGIAQG• improve Safety Culture in the aerospace industry
• create a common understanding in terms of product safety
• harmonize Safety Culture efforts within the aerospace industry
• establish consistent quality standards and requirements
• develop awareness of product safety
• create a method to measure Safety Culture
Example: IAQG Human Factors InitiativeExample: IAQG Human Factors Initiative
April 2006How to develop a Safety Culture - QI - Ref. PR0603880 - Issue 1 Page 35©A
IRB
US D
EU
TSC
HLA
ND
GM
BH.
All
right
s re
serv
ed. C
onfid
entia
l and
pro
prie
tary
doc
umen
t.
How to develop a safety culture?
Online Self-Assessment Tool: fast individual feedback
Individual results can be compared to overall
values (mean of
all participants)
Example: IAQG Human Factors InitiativeExample: IAQG Human Factors Initiative
124
April 2006How to develop a Safety Culture - QI - Ref. PR0603880 - Issue 1 Page 36©A
IRB
US D
EU
TSC
HLA
ND
GM
BH.
All
right
s re
serv
ed. C
onfid
entia
l and
pro
prie
tary
doc
umen
t.
A safety culture is an informed culture– We must be knowledgeable about safety issues
A safety culture is a just culture– We recognize that we can all make errors– We don’t tolerate intentional malicious violations– We investigate and rectify the reasons for routine violations
A safety culture is a reporting culture– Incidents and safety-related issues must absolutely be reported so that
systemic problems can be identified and corrected
A safety culture is a learning culture– We must learn and act in order to avoid repetition of errors
A Safety Culture is ...
Because human error is inevitable we have to accept this fact and design systems which are error tolerant
Because human error is inevitable we have to accept this fact and design systems which are error tolerant
April 2006How to develop a Safety Culture - QI - Ref. PR0603880 - Issue 1 Page 37©A
IRB
US D
EU
TSC
HLA
ND
GM
BH.
All
right
s re
serv
ed. C
onfid
entia
l and
pro
prie
tary
doc
umen
t.
Safety Culture
125