Embed Size (px)
Citation preview

See discussions, stats, and author profiles for this publication at: https://www.researchgate.net/publication/292608177
ASPECTS OF CHINA’S ECONOMIC DEVELOPMENT
Article in Ecoforum · February 2016
CITATIONS
4READS
116
4 authors, including:
Some of the authors of this publication are also working on these related projects:
a.silagadze View project
Globalization View project
Avtandil Silagadze
Ivane Javakhishvili Tbilisi State University
53 PUBLICATIONS 201 CITATIONS
SEE PROFILE
Tamaz Zubiashvili
Ivane Javakhishvili Tbilisi State University
15 PUBLICATIONS 53 CITATIONS
SEE PROFILE
Tamar Atanelishvili
Ivane Javakhishvili Tbilisi State University
9 PUBLICATIONS 23 CITATIONS
SEE PROFILE
All content following this page was uploaded by Tamaz Zubiashvili on 01 February 2016.
The user has requested enhancement of the downloaded file.

ECOFORUM
[Volume 5, Issue 1 (8), 2016]
47
Avtandil SILAGADZE
Ivane Javakhishvili Tbilisi State University, Georgia
Alexander TVALCHRELIDZE
GEORGIAN ACADEMY OF NATURAL SCIENCES, GEORGIA
Tamaz ZUBIASHVILI
Ivane Javakhishvili Tbilisi State University, Georgia
Tamar ATANELISHVILI
Ivane Javakhishvili Tbilisi State University, Georgia
Abstract
The 25 year period of transition in newly independent post-USSR states did not bring either of them to a desired
target – mid-European level of economy. Against this sad background China represents a unique example of
successful economic reforms, which lead to rapid economic development and accelerated increase of leaving
standards. In spite of structural and legislative changes, the success of China’s economic reforms was
determined by extensive industrialization based on downstream processing of national and imported primary
commodities. Privatization in this sector and support of private businesses was expressed by creation of
corresponding financial instruments and, first of all, by foundation of commodity exchanges of the global
importance. The phase of extensive economic development has not been finished in China yet, however, such
extensive development cannot be sustainable for more than 8-10 years, and the greatest challenge for China will
be a step-by-step construction of a post-industrial economy and society in coming years. Example of China may
show a guideline for the newly independent states: only synergetic amalgamation of, on one hand, a civil society
and, on the other hand, sustainable exploitation of national natural resources and downstream processing of
national primary commodities may ensure irreversible merging of newly independent states into the civilized
world.
Key words: Newly independent states; China; GDP; primary commodity; downstream processing; economic
growth.
JEL Classification: O10, O11, O12
I. INTRODUCTION
Hundreds of articles and monographs have been published on collapse of the USSR and post-Soviet
transformation into newly independent states (NIS); dozens of theories on such transformation, recently
generalized by Kollmorgen (Kollmorgen, 2013), have been launched. However, all of them enter within the
framework proposed by Dorn (Dorn, 1991) in 1991 – from a planned economy to a market economy.
The economic breakdown of the USSR, as cited by Hanke (Hanke, 2004), started with the famous speech
by President Reagan: “…we [e.g. the USA] have an oil weapon, too. The strategic reserve should be used to
bloody…” the USSR. In 1981 the President Reagan’s administration abandoned the “policy of détente” versus
the USSR and persuaded Saudi Arabia to flood the world market with cheap oil at the same time providing inner
market with petroleum from strategic reserves. These measures, known as “a new political economy of oil”
(Morse, 1999), according to a great number of investigations (Hilton, http://wais.stanford.edu/History; Strayer,
1998), ultimately led to the collapse of the USSR.
Dissolution of the USSR immediately led to huge economic crisis in all the new independent states (NIS)
caused by the total economic disintegration of the USSR infrastructure and economic links (Tvalchrelidze,
2011). Such a crisis, foreseen by Brzezinski (Brzezinski, 1998) in 1998, determined a huge poverty, even famine
in the post-Soviet space, and other socialist republics, left alone in front of severe reality, started to construct
their independent statehood (Mankoff, 2010; Silagadze, 2013).
Zbigniew Brzezinski (Brzezinski, 1998), who in the late eighties already predicted collapse of the USSR,
had designed main geostrategic imperatives, which should ensure primacy of the USA in the coming unipolar
ASPECTS OF CHINA’S ECONOMIC DEVELOPMENT

ECOFORUM
[Volume 5, Issue 1 (8), 2016]
48
world. Among others, first, amalgamation of the post-Soviet countries into the international commodity markets
via implementation of global projects like Baku-Tbilisi-Ceyhan oil pipeline, and, second, global expansion of the
USA economic model and financial instruments were mentioned. The USA consecutive administrations
followed these recommendations and included the world financial institutions like the World Bank and the
International Monetary Fund in this global project. Corresponding contribution was also made by the United
Nations Development Programme (UNDP) via launching initial capacity strengthening initiative under the
umbrella of combating poverty. Synergistically, these three institutions were extremely active in the new
independent states (NIS) by creating new national currencies, introducing modern fiscal systems, reforming the
national banks, developing private bank networks, and supporting private businesses. Ultimately, these states
were included into the world financial, mercantile and commodity markets (Silagadse and Tokmazishvili, 2009).
Ultimately, almost all ancient Soviet republics surmounted the most vulnerable phase of poverty and step-by-
step started developing. Fig. 1 and 2 demonstrate year-to-year GDP changes in some selected post-soviet
countries. This index was calculated as a simple increment to GDP value of the corresponding year in current US
Dollars as released by the World Bank Group (Tisdell, 2008) versus the previous year. It may be seen that the
slow economic growth was interrupted twice, in 1999 – due to the Russian finance crisis, and in 2008 – due to
the world economic recessions (Silagadze, 2013). In 2014 the sanctions against Russia also had their important
impact, namely, in commodity exporting countries (see below).
Figure 1. Year-to-Year GDP Change in Azerbaijan, Kazakhstan and Russia
Different NIS started transformation of their economic and social infrastructure using quite different
philosophy. At first glance, three different approaches may be identified (Abbott and Wallance, 2010; Bremmer,
2006; Hinley, 2008; Papava, 2006; Silagadze, 2013):
1. Countries like Georgia, Moldova, partly Ukraine began cardinal reconstruction of their economic and
social infrastructure via massive privatization, reform of the governance and social security systems,
rejuvenation of the banking sector, etc.
2. Countries like Belarus and the great majority of Central Asian republics preserved autocratic regime of
governance.
3. Countries rich in natural resources like Russia, Kazakhstan, Azerbaijan, and Turkmenistan built a
certain type of state capitalism via extensive exploitation of mineral deposits and hydrocarbon fields
and exports of primary commodities.

ECOFORUM
[Volume 5, Issue 1 (8), 2016]
49
Figure 2. Year-to-Year GDP Change in Belarus, Moldova and Georgia
The most picturesque example of the latter approach is President Putin’s politics who step-by-step
substituted the neoliberal economic policy of Eltsin’s administration by a Russian model of the state capitalism.
The main trends of his economic and social reform were as follows (http://www.russiaprofile.org):
1. Strong economic growth based on extensive exploitation of natural resources
2. Foreign-debt reduction
3. Launching of the stabilization fund
4. Fiscal stabilization and tax reform
5. Launching of national projects including healthcare, education, housing, and agriculture
6. State control of strategic industries
7. Reduction of inflation
8. Social reform including increase of pensions and effective social insurance
9. Reduction of unemployment
10. Integration into the world economy.
Hence, neither of these policies brought newly independent states to the desired target – mid-European
level of economy. Fig. 3 displays GDP per capita of NIS as released by the World Bank Group
(Http://data.worldbank.org/indicator/) compared with the mid-European figure. It may be seen that the average
EU GDP per capita is 2.5 – 29.5 times higher than that in different NIS. The conclusion is very simple:
“Something is rotten in the state of Denmark”3 – the newly independent states, despite of a lot of optimistic
opinions (. Roaf, Atoyan, Joshi et al 2014), are moving in the wrong direction. That is why it is extremely
important to analyze a successful experience of economic reforms and elaborate some possible trends of
development for NIS.
3 Shakespeare, “Hamlet”, Act 1, Scene 4.
ECOFORUM
[Volume 5, Issue 1 (8), 2016]
50
Figure 3. Nominal GDP per Capita in NIS compared with EU
II. ECONOMIC DEVELOPMENT IN CHINA
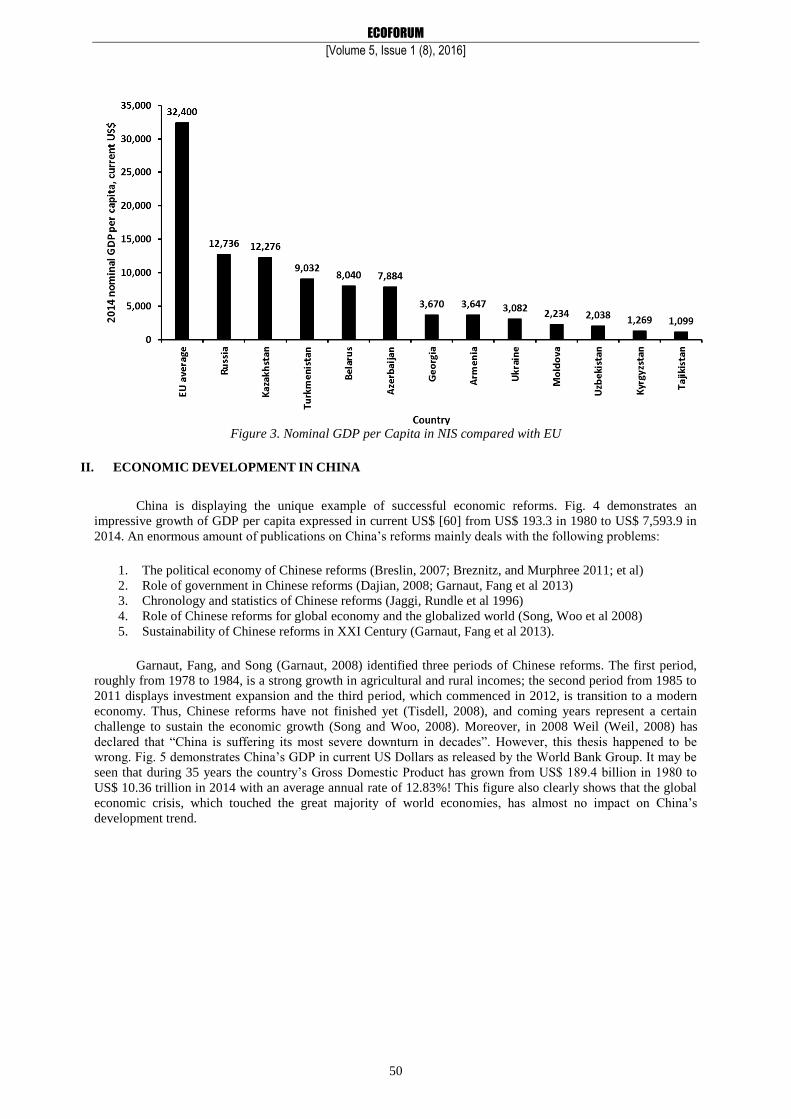
China is displaying the unique example of successful economic reforms. Fig. 4 demonstrates an
impressive growth of GDP per capita expressed in current US$ [60] from US$ 193.3 in 1980 to US$ 7,593.9 in
2014. An enormous amount of publications on China’s reforms mainly deals with the following problems:
1. The political economy of Chinese reforms (Breslin, 2007; Breznitz, and Murphree 2011; et al)
2. Role of government in Chinese reforms (Dajian, 2008; Garnaut, Fang et al 2013)
3. Chronology and statistics of Chinese reforms (Jaggi, Rundle et al 1996)
4. Role of Chinese reforms for global economy and the globalized world (Song, Woo et al 2008)
5. Sustainability of Chinese reforms in XXI Century (Garnaut, Fang et al 2013).
Garnaut, Fang, and Song (Garnaut, 2008) identified three periods of Chinese reforms. The first period,
roughly from 1978 to 1984, is a strong growth in agricultural and rural incomes; the second period from 1985 to
2011 displays investment expansion and the third period, which commenced in 2012, is transition to a modern
economy. Thus, Chinese reforms have not finished yet (Tisdell, 2008), and coming years represent a certain
challenge to sustain the economic growth (Song and Woo, 2008). Moreover, in 2008 Weil (Weil, 2008) has
declared that “China is suffering its most severe downturn in decades”. However, this thesis happened to be
wrong. Fig. 5 demonstrates China’s GDP in current US Dollars as released by the World Bank Group. It may be
seen that during 35 years the country’s Gross Domestic Product has grown from US$ 189.4 billion in 1980 to
US$ 10.36 trillion in 2014 with an average annual rate of 12.83%! This figure also clearly shows that the global
economic crisis, which touched the great majority of world economies, has almost no impact on China’s
development trend.
ECOFORUM
[Volume 5, Issue 1 (8), 2016]
51
Figure 4. GDP per Capita in China in 1980-2014
Figure 5. China’s GDP in 1980-2014
Surprisingly, we know only the sole publication (McKay and Song, 2013) where China’s
industrialization is suggested to be the main engine of the country’s development. However, we were unable to
find any explicit discourse on specific features of such industrial reform.
That is why we tried to deal with the mentioned problem from an absolutely different point of view.

ECOFORUM
[Volume 5, Issue 1 (8), 2016]
52
III. PRIMARY COMMODITIES PRODUCTION IN CHINA
The methodological basement of the analysis below is quite simple. Development of an industrial branch
like metallurgy or machinery needs downstream processing of primary commodities. Morrison in his essay on
China’s economic rise (Morrison, 2015) mentioned this issue in a general form. Hence, the analysis crops out
picturesque figures. For instance, in 2006 among the world 20 top copper smelters only 3 were Chinese. Among
them the most powerful Guixi smelter was characterized by the capacity of 400,000 metric tons per year and had
the 4th world rank (World copper factbook, 2007). By 2014 the capacity of the mentioned smelter has
dramatically increased to 900,000 metric tons per annum and it got the 1st world rank; among the world 20 top
copper smelters 8 happened to be Chinese (World copper factbook, 2014). In 2013 China produced 779 million t
of steel and ensured 48.5% of world steel production (World steel in figures, 2014). Japan, which has the second
world rank in steel production, manufactured only 110.6 million t or 7.04 times less. For comparison, in 2006
China had produced 422.7 million t (World steel in figures, 2007) and in 2003 – 220.1 million t of steel (World
steel in figures, 2004).
Table 1 provides information on primary commodity production in China in 2013 – the last year for
which the ensured information on world energy (BP Statistical Review of World Energy, 2014) and mineral
(Brown, Wrighton et al 2015; Reichl, Schatz et al 2014) production does exist.
Table 1. China’s World Rank and Share in Selected Primary Commodity Production
Commodity World rank % of world production
Oil 4 4.82
Gas 7 3.18
Coal 1 45.00
Uranium 9 2.44
Iron ore 1 45.96
Manganese ore 1 29.36
Bauxite 2 20.43
Refined copper 1 30.90
Refined lead 1 42.62
Refined zinc 1 40.17
Refined nickel 1 35.64
Refined cobalt 1 43.08
Molybdenum 1 40.74
Gold 1 14.74
Silver 2 15.67
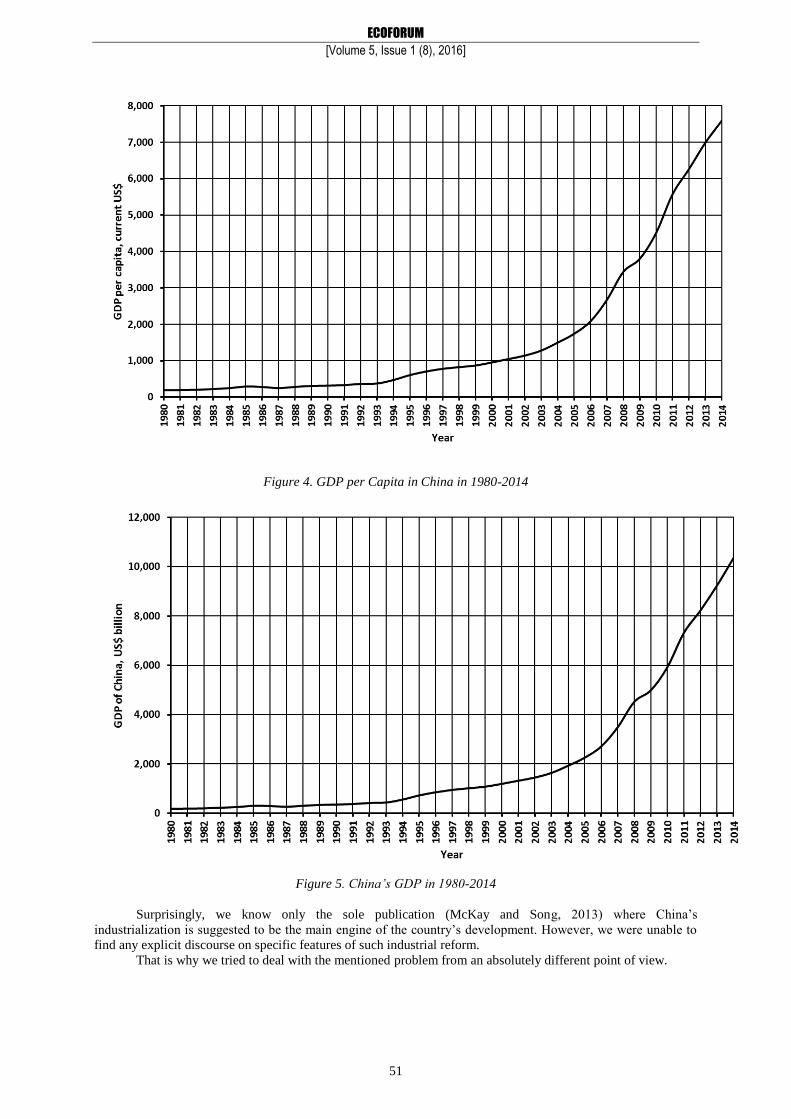
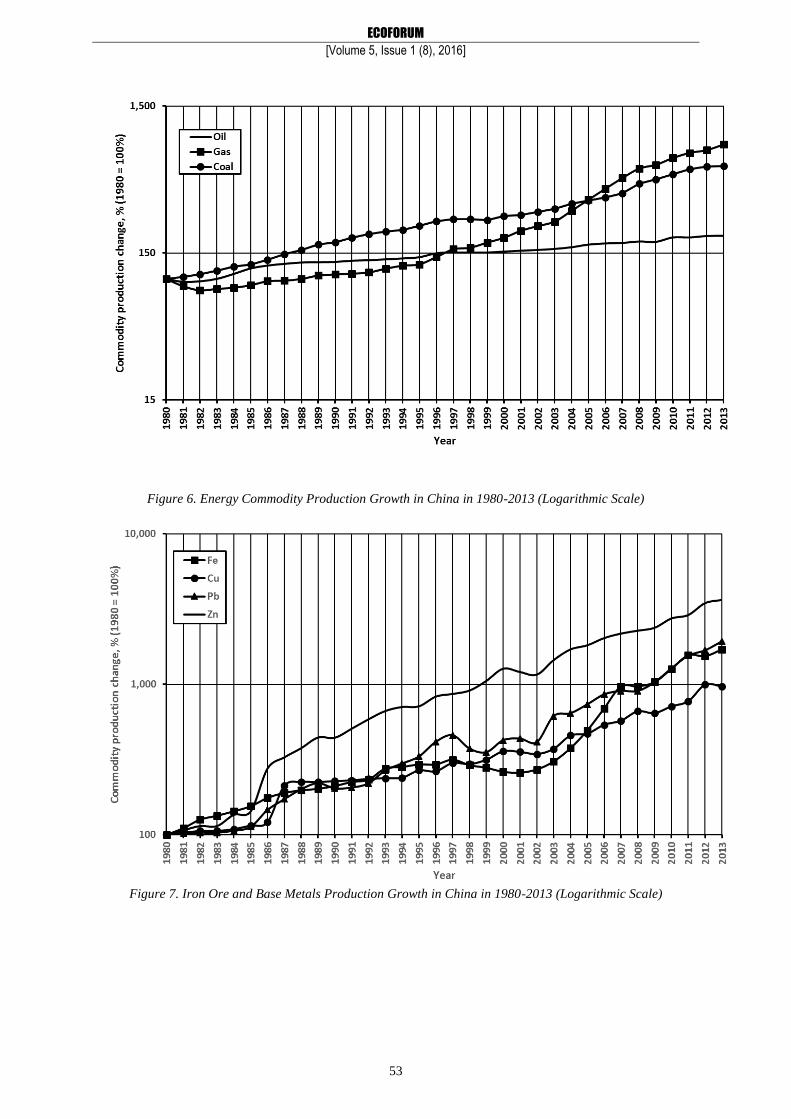
Figures 6-8 describe dynamics of selected commodity production in China in 1980-2013. Statistical data
were borrowed from well-known reviews (BP Statistical Review of World Energy, 2003-2014).
ECOFORUM
[Volume 5, Issue 1 (8), 2016]
53
Figure 6. Energy Commodity Production Growth in China in 1980-2013 (Logarithmic Scale)
Figure 7. Iron Ore and Base Metals Production Growth in China in 1980-2013 (Logarithmic Scale)
ECOFORUM
[Volume 5, Issue 1 (8), 2016]
54
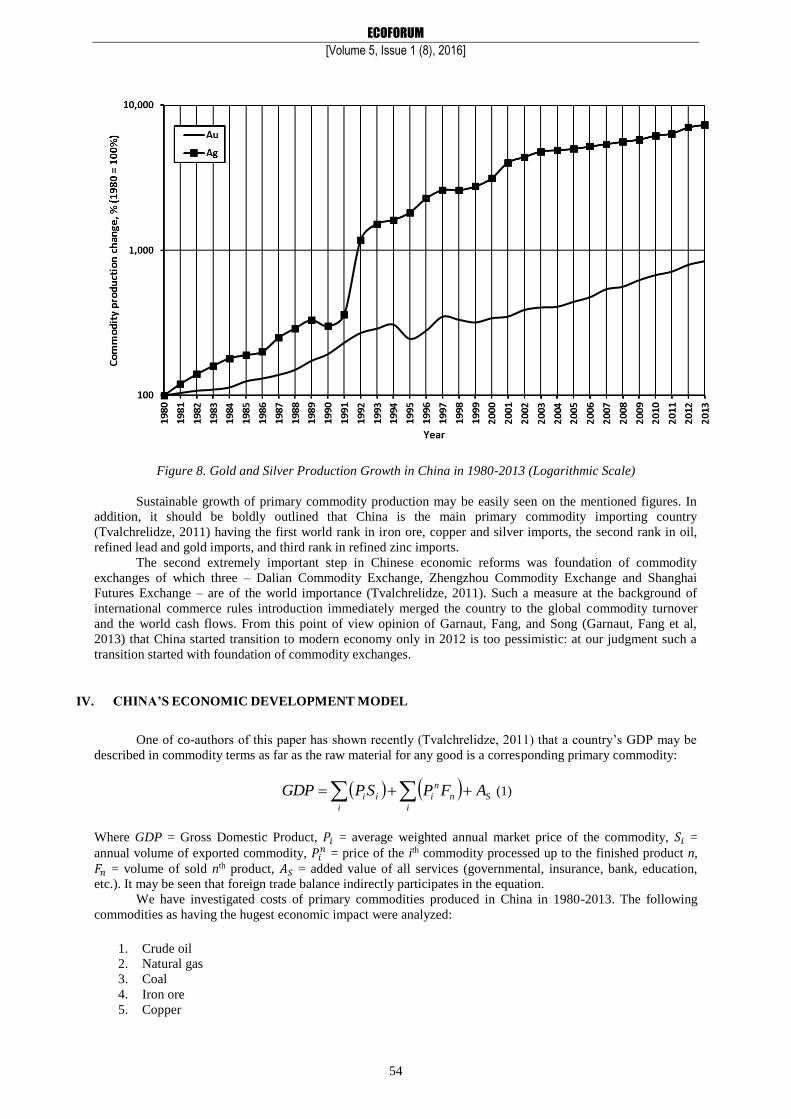
Figure 8. Gold and Silver Production Growth in China in 1980-2013 (Logarithmic Scale)
Sustainable growth of primary commodity production may be easily seen on the mentioned figures. In
addition, it should be boldly outlined that China is the main primary commodity importing country
(Tvalchrelidze, 2011) having the first world rank in iron ore, copper and silver imports, the second rank in oil,
refined lead and gold imports, and third rank in refined zinc imports.
The second extremely important step in Chinese economic reforms was foundation of commodity
exchanges of which three – Dalian Commodity Exchange, Zhengzhou Commodity Exchange and Shanghai
Futures Exchange – are of the world importance (Tvalchrelidze, 2011). Such a measure at the background of
international commerce rules introduction immediately merged the country to the global commodity turnover
and the world cash flows. From this point of view opinion of Garnaut, Fang, and Song (Garnaut, Fang et al,
2013) that China started transition to modern economy only in 2012 is too pessimistic: at our judgment such a
transition started with foundation of commodity exchanges.
IV. CHINA’S ECONOMIC DEVELOPMENT MODEL
One of co-authors of this paper has shown recently (Tvalchrelidze, 2011) that a country’s GDP may be
described in commodity terms as far as the raw material for any good is a corresponding primary commodity:
i i
Sn
n
iii AFPSPGDP (1)
Where GDP = Gross Domestic Product, 𝑃𝑖 = average weighted annual market price of the commodity, 𝑆𝑖 =
annual volume of exported commodity, 𝑃𝑖𝑛 = price of the ith commodity processed up to the finished product n,
𝐹𝑛 = volume of sold nth product, 𝐴𝑆 = added value of all services (governmental, insurance, bank, education,
etc.). It may be seen that foreign trade balance indirectly participates in the equation.
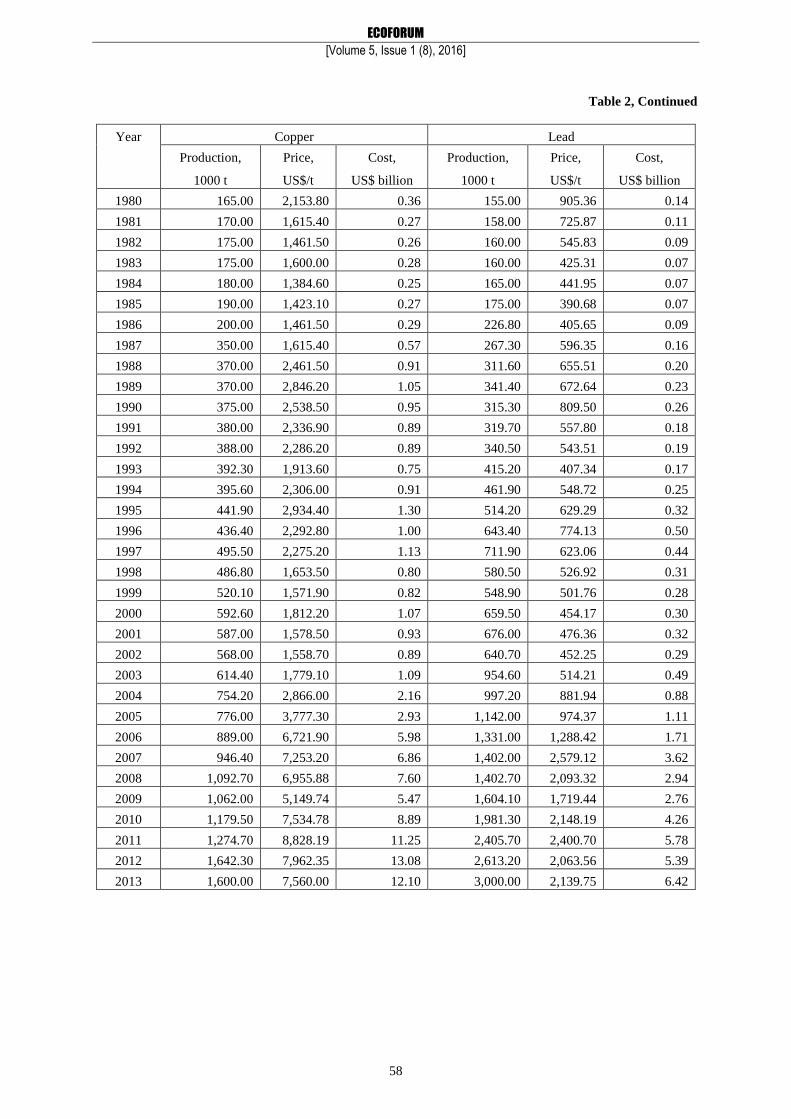
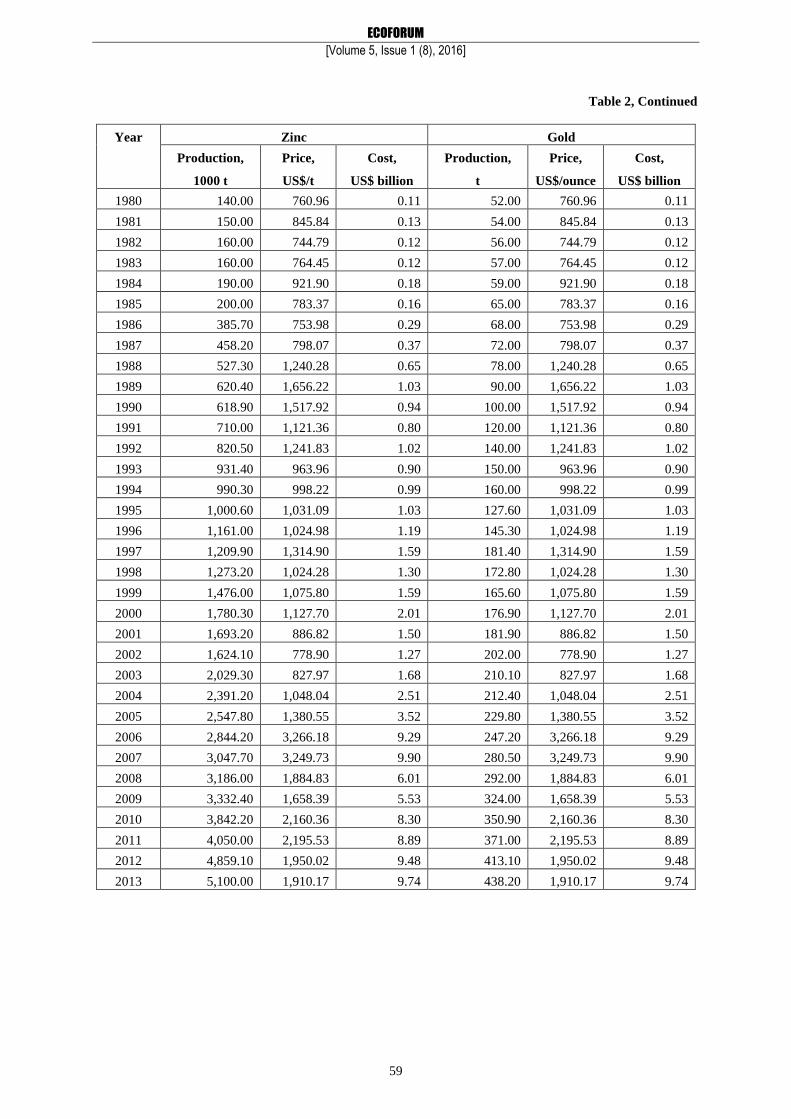
We have investigated costs of primary commodities produced in China in 1980-2013. The following
commodities as having the hugest economic impact were analyzed:
1. Crude oil
2. Natural gas
3. Coal
4. Iron ore
5. Copper

ECOFORUM
[Volume 5, Issue 1 (8), 2016]
55
6. Lead
7. Zinc
8. Gold
9. Silver
The commodity cost was calculated by multiplying average annual world commodity price according to
the IMF prices (http://www.imf.org/external/np/res/commod/index.aspx) and some other sources by the volume
of produced commodity identified in already cited statistical yearbooks. Table 2 provides our calculation results.
Fig. 9 displays interdependence between China’s GDP as released by the World Bank Group
(Feklyunina and White, 2013) and the bulk cost of produced commodities, according to Table 2. Extremely high
value of correlation coefficient (0.9859) allowed us to perform modeling of China’s GDP based on commodity
production. Theoretically (Freedman, 2009), interdependence of two variables in two-dimensional space ii yx ,( )
may be investigated by a regression equation:
iippiii xxxy ...22110, (2)
Where: i = residual of equation (3):
npn
p
xx
xx
x
...
.........
...
1
111
, (3)
and coefficient 𝛽 is determined by last squares method ((Freedman, 2009) meaning that deviation of squares of
points ),( ii yx should be minimum. It is reached by an extremum:
2
1
],([)(
p
n
nnnn xByF
, (4)
In none-linear cases it is possible to compute the values of coefficients, standard errors and residue i .
To do so, we need to know mean values of x and y , the standard deviation of x, the standard deviation of y, and
the correlation between them. Previous modeling have proven that quadratic equations provide the most
appropriate results (Tvalchrelidze, 2011; Tvalchrelidze and Silagadze, 2013). Such computation was realized in
the SPSS system using ANOVA technology.
Results are given on Fig. 10. The quadratic equation displays an extremely close compatibility with real
GDP values. Fig. 11 compares the real GDP of China borrowed from the World Bank Group databank with the
model GDP calculated by the quadratic equation based on the cost of produced selected commodities.
Particularly good interoperability of two curves and very high correlation coefficient demonstrate that
accuracy of calculation is ± 5%.
Table 2. Production and Cost of Selected Commodities in China in 1980-2013
Year Crude oil Natural gas
Production, Price, Cost, Production, Price, Cost,
mln t US$/t US$ billion bln m3 US$/1000 m3 US$ billion
1980 105.95 274.29 29.06 14.27 63.57 0.91
1981 101.22 262.05 26.52 12.74 70.63 0.90
1982 102.12 233.31 23.83 11.93 88.29 1.05
1983 106.07 213.16 22.61 12.21 84.76 1.03
1984 114.61 210.74 24.15 12.43 84.76 1.05
1985 124.90 197.32 24.65 12.93 88.29 1.14
1986 130.69 105.85 13.83 13.76 63.57 0.87
1987 134.14 130.11 17.45 13.89 67.10 0.93
1988 137.05 109.00 14.94 14.26 88.00 1.25

ECOFORUM
[Volume 5, Issue 1 (8), 2016]
56
1989 137.64 134.36 18.49 15.049 89.00 1.34
1990 138.31 169.98 23.51 15.298 104.23 1.59
1991 140.99 148.07 20.88 15.49 117.64 1.82
1992 142.04 141.10 20.04 15.79 102.01 1.61
1993 144.03 122.78 17.68 16.765 93.68 1.57
1994 146.08 114.79 16.77 17.559 82.88 1.46
1995 149.02 122.78 18.30 17.947 87.69 1.57
1996 158.52 149.97 23.77 20.114 89.91 1.81
1997 160.13 136.63 21.88 22.703 98.05 2.23
1998 160.18 87.30 13.98 23.279 83.62 1.95
1999 160.22 121.38 19.45 25.198 66.60 1.68
2000 162.62 200.77 32.65 27.2 90.00 2.45
2001 164.83 168.59 27.79 30.329 110.00 3.34
2002 166.87 167.20 27.90 32.661 115.30 3.77
2003 169.59 202.97 34.42 35.015 144.90 5.07
2004 174.05 276.05 48.05 41.46 154.20 6.39
2005 181.40 366.79 66.54 49.32 209.90 10.35
2006 184.80 427.34 78.97 58.553 280.20 16.41
2007 186.30 470.59 87.67 69.2 286.70 19.84
2008 190.40 670.55 127.67 80.3 412.70 33.14
2009 189.50 392.01 74.29 85.3 304.20 25.95
2010 203.00 521.97 105.96 94.8 286.00 27.11
2011 202.90 638.00 129.45 102.7 374.10 38.42
2012 207.50 633.75 131.50 107.2 393.80 42.22
2013 208.10 668.28 139.07 117.1 396.64 46.45

ECOFORUM
[Volume 5, Issue 1 (8), 2016]
57
Table 2. Continued
Year Coal Iron ore
Production, Price, Cost, Production, Price, Cost,
mln t US$/t US$ billion mln t US$/t US$ billion
1980 125.50 39.94 5.01 85.00 24.00 2.04
1981 130.10 39.94 5.20 94.00 22.00 2.07
1982 134.95 39.94 5.39 107.30 24.00 2.58
1983 142.90 39.94 5.71 113.70 20.00 2.27
1984 152.53 39.94 6.09 121.90 18.00 2.19
1985 157.45 39.94 6.29 131.50 18.00 2.37
1986 169.18 39.94 6.76 149.50 18.00 2.69
1987 185.36 39.94 7.40 161.40 19.00 3.07
1988 196.98 39.94 7.87 167.70 20.00 3.35
1989 215.29 42.08 9.06 171.80 25.00 4.30
1990 223.34 43.48 9.71 179.30 27.00 4.84
1991 239.90 42.80 10.27 190.60 28.32 5.40
1992 253.80 38.53 9.78 197.60 28.32 5.60
1993 263.19 33.68 8.86 234.66 28.32 6.65
1994 270.86 37.18 10.07 240.20 28.32 6.80
1995 289.02 44.50 12.86 249.35 28.32 7.06
1996 310.96 41.25 12.83 249.55 28.48 7.11
1997 319.39 38.92 12.43 268.00 30.06 8.06
1998 320.92 32.00 10.27 246.90 31.14 7.69
1999 314.41 28.79 9.05 237.00 25.52 6.05
2000 334.79 35.99 12.05 223.00 25.57 5.70
2001 341.88 39.03 13.34 220.00 23.87 5.25
2002 358.10 31.65 11.33 231.00 26.04 6.02
2003 375.35 43.60 16.37 261.00 32.30 8.43
2004 407.67 72.08 29.38 320.00 37.92 12.13
2005 428.43 60.54 25.94 420.00 44.50 18.69
2006 449.19 64.11 28.80 588.00 53.88 31.68
2007 478.19 88.79 42.46 824.00 59.64 49.14
2008 560.40 147.67 82.75 824.00 80.00 65.92
2009 594.60 70.66 42.01 880.20 75.00 66.02
2010 647.00 92.50 59.85 1,077.70 140.00 150.88
2011 703.20 121.52 85.45 1,326.90 150.00 199.04
2012 729.00 92.50 67.43 1,309.60 180.00 235.73
2013 736.00 98.00 72.13 1,451.00 160.00 232.16
ECOFORUM
[Volume 5, Issue 1 (8), 2016]
58
Table 2, Continued
Year Copper Lead
Production, Price, Cost, Production, Price, Cost,
1000 t US$/t US$ billion 1000 t US$/t US$ billion
1980 165.00 2,153.80 0.36 155.00 905.36 0.14
1981 170.00 1,615.40 0.27 158.00 725.87 0.11
1982 175.00 1,461.50 0.26 160.00 545.83 0.09
1983 175.00 1,600.00 0.28 160.00 425.31 0.07
1984 180.00 1,384.60 0.25 165.00 441.95 0.07
1985 190.00 1,423.10 0.27 175.00 390.68 0.07
1986 200.00 1,461.50 0.29 226.80 405.65 0.09
1987 350.00 1,615.40 0.57 267.30 596.35 0.16
1988 370.00 2,461.50 0.91 311.60 655.51 0.20
1989 370.00 2,846.20 1.05 341.40 672.64 0.23
1990 375.00 2,538.50 0.95 315.30 809.50 0.26
1991 380.00 2,336.90 0.89 319.70 557.80 0.18
1992 388.00 2,286.20 0.89 340.50 543.51 0.19
1993 392.30 1,913.60 0.75 415.20 407.34 0.17
1994 395.60 2,306.00 0.91 461.90 548.72 0.25
1995 441.90 2,934.40 1.30 514.20 629.29 0.32
1996 436.40 2,292.80 1.00 643.40 774.13 0.50
1997 495.50 2,275.20 1.13 711.90 623.06 0.44
1998 486.80 1,653.50 0.80 580.50 526.92 0.31
1999 520.10 1,571.90 0.82 548.90 501.76 0.28
2000 592.60 1,812.20 1.07 659.50 454.17 0.30
2001 587.00 1,578.50 0.93 676.00 476.36 0.32
2002 568.00 1,558.70 0.89 640.70 452.25 0.29
2003 614.40 1,779.10 1.09 954.60 514.21 0.49
2004 754.20 2,866.00 2.16 997.20 881.94 0.88
2005 776.00 3,777.30 2.93 1,142.00 974.37 1.11
2006 889.00 6,721.90 5.98 1,331.00 1,288.42 1.71
2007 946.40 7,253.20 6.86 1,402.00 2,579.12 3.62
2008 1,092.70 6,955.88 7.60 1,402.70 2,093.32 2.94
2009 1,062.00 5,149.74 5.47 1,604.10 1,719.44 2.76
2010 1,179.50 7,534.78 8.89 1,981.30 2,148.19 4.26
2011 1,274.70 8,828.19 11.25 2,405.70 2,400.70 5.78
2012 1,642.30 7,962.35 13.08 2,613.20 2,063.56 5.39
2013 1,600.00 7,560.00 12.10 3,000.00 2,139.75 6.42
ECOFORUM
[Volume 5, Issue 1 (8), 2016]
59
Table 2, Continued
Year Zinc Gold
Production, Price, Cost, Production, Price, Cost,
1000 t US$/t US$ billion t US$/ounce US$ billion
1980 140.00 760.96 0.11 52.00 760.96 0.11
1981 150.00 845.84 0.13 54.00 845.84 0.13
1982 160.00 744.79 0.12 56.00 744.79 0.12
1983 160.00 764.45 0.12 57.00 764.45 0.12
1984 190.00 921.90 0.18 59.00 921.90 0.18
1985 200.00 783.37 0.16 65.00 783.37 0.16
1986 385.70 753.98 0.29 68.00 753.98 0.29
1987 458.20 798.07 0.37 72.00 798.07 0.37
1988 527.30 1,240.28 0.65 78.00 1,240.28 0.65
1989 620.40 1,656.22 1.03 90.00 1,656.22 1.03
1990 618.90 1,517.92 0.94 100.00 1,517.92 0.94
1991 710.00 1,121.36 0.80 120.00 1,121.36 0.80
1992 820.50 1,241.83 1.02 140.00 1,241.83 1.02
1993 931.40 963.96 0.90 150.00 963.96 0.90
1994 990.30 998.22 0.99 160.00 998.22 0.99
1995 1,000.60 1,031.09 1.03 127.60 1,031.09 1.03
1996 1,161.00 1,024.98 1.19 145.30 1,024.98 1.19
1997 1,209.90 1,314.90 1.59 181.40 1,314.90 1.59
1998 1,273.20 1,024.28 1.30 172.80 1,024.28 1.30
1999 1,476.00 1,075.80 1.59 165.60 1,075.80 1.59
2000 1,780.30 1,127.70 2.01 176.90 1,127.70 2.01
2001 1,693.20 886.82 1.50 181.90 886.82 1.50
2002 1,624.10 778.90 1.27 202.00 778.90 1.27
2003 2,029.30 827.97 1.68 210.10 827.97 1.68
2004 2,391.20 1,048.04 2.51 212.40 1,048.04 2.51
2005 2,547.80 1,380.55 3.52 229.80 1,380.55 3.52
2006 2,844.20 3,266.18 9.29 247.20 3,266.18 9.29
2007 3,047.70 3,249.73 9.90 280.50 3,249.73 9.90
2008 3,186.00 1,884.83 6.01 292.00 1,884.83 6.01
2009 3,332.40 1,658.39 5.53 324.00 1,658.39 5.53
2010 3,842.20 2,160.36 8.30 350.90 2,160.36 8.30
2011 4,050.00 2,195.53 8.89 371.00 2,195.53 8.89
2012 4,859.10 1,950.02 9.48 413.10 1,950.02 9.48
2013 5,100.00 1,910.17 9.74 438.20 1,910.17 9.74

ECOFORUM
[Volume 5, Issue 1 (8), 2016]
60
Table 2, Continued
Year Silver Bulk cost,
Production, Price, Cost, US$ billion
t US$/ounce US$ billion
1980 50.00 20.98 0.03 38.68
1981 60.00 10.49 0.02 36.02
1982 70.00 7.92 0.02 34.00
1983 80.00 11.43 0.03 32.90
1984 90.00 8.15 0.02 34.70
1985 95.00 6.13 0.02 35.62
1986 100.00 5.50 0.02 25.65
1987 125.00 7.02 0.03 31.01
1988 145.00 6.53 0.03 30.31
1989 165.00 5.50 0.03 36.63
1990 150.00 4.83 0.02 43.06
1991 180.00 4.06 0.02 41.65
1992 590.00 3.94 0.07 40.75
1993 760.00 4.31 0.11 38.43
1994 810.00 5.29 0.14 39.37
1995 910.00 5.20 0.15 44.18
1996 1,140.00 5.20 0.19 50.20
1997 1,300.00 4.99 0.21 49.89
1998 1,299.00 5.54 0.23 38.17
1999 1,379.00 5.22 0.23 40.62
2000 1,569.00 4.95 0.25 58.07
2001 2,013.00 4.37 0.28 54.34
2002 2,200.00 4.60 0.33 53.79
2003 2,400.00 4.58 0.35 70.36
2004 2,450.00 6.66 0.52 104.82
2005 2,500.00 7.31 0.59 132.95
2006 2,600.00 11.55 0.97 178.60
2007 2,700.00 13.38 1.16 226.93
2008 2,800.00 14.99 1.35 335.56
2009 2,900.00 14.67 1.37 233.51
2010 3,085.00 20.19 2.00 381.06
2011 3,191.00 35.12 3.60 500.63
2012 3,516.00 31.15 3.52 530.51
2013 3,669.00 23.79 2.81 540.75

ECOFORUM
[Volume 5, Issue 1 (8), 2016]
61
Figure 9. Interdependence between China’s GDP and Bulk Cost of Selected Produced Commodities
Figure 10. China’s GDP Model

ECOFORUM
[Volume 5, Issue 1 (8), 2016]
62
Figure 11. Real and Model GDP of China in 1980-2013
The only exception is the year 2009, the year of the world economic crisis, and we are sure that its
impact on China’s GDP was much more severe than announced by the World Bank. The model hereto allows to
formulate several conclusions:
1. In spite of structural and legislative changes the success of China’s economic reforms was determined
by extensive industrialization based on downstream processing of national and imported primary
commodities;
2. Privatization in this sector and support of private businesses was expressed by creation of
corresponding financial instruments and, first of all, by foundation of commodity exchanges of the
global importance;
3. The phase of extensive economic development is not finished in China yet: graphs on Figures 6-8 do
not display any tendency of asymptotic approach to a limit;
4. However, such extensive development cannot be sustainable for more than 8-10 years, and the greatest
challenge for China will be a step-by-step construction of a post-industrial economy and society in
coming years.
V. LESSONS TO BE STUDIED
25 years of transition in newly independent post-USSR states did not bring either of them to a desired
target – mid-European level of economy. The experience of these years clearly demonstrated that even
successful reforms of governance and the society based on liberalization and total privatization without extensive
development of industrial branches are unable to ensure rapid economic development.
On the other hand, countries, which decided to launch extensive exploitation of natural resources like
hydrocarbons and metals and exports of primary commodities, happened to be extremely vulnerable and
dependent on world commodity prices. Moreover, artificial decrease of the latter, and, first of all, of crude oil
was used at least three times during the recent 35 years for intensification of international pressure against
Russia.
Against this sad background China represents a unique example of successful economic reforms, which
lead to rapid economic development and accelerated increase of leaving standards. Despite of all governmental
and structural changes like adoption of a neoliberal economic approach and development of economic
regionalism, the basic idea of Chinese reforms consists in extensive development of downstream processing of
primary commodities. Such an industrialization was simultaneously followed by introduction of financial
instruments for commodity markets and by foundation of commodity exchanges of global importance. Just

ECOFORUM
[Volume 5, Issue 1 (8), 2016]
63
synergy of these two measures determined at our opinion fundamental success of the Chinese reforms.
However, the ultimate target of such reforming should be step-by-step construction of a post-industrial
economy.
Example of China may show a guideline for the newly independent states – in addition to basic reforms
of society, social insurance, governance, banking system, etc., industrial branches of primary commodity
downstream processing should be developed and governmentally supported. Of course, such branches should be
based on the national resource base. Only synergetic amalgamation of, on one hand, a civil society and, on the
other hand, sustainable exploitation of national natural resources and downstream processing of national primary
commodities may ensure irreversible merging of newly independent states to the civilized world.
VI. ACKNOWLEDGEMENT
The authors are sincerely grateful to the Shota Rustaveli National Science Foundation (Georgia) for
financial support for this study.
VII. REFERENCES
1. Abbott, P. and Wallance, C. (2010). Explaining economic and social transformations in post-Soviet Russia, Ukraine and Belarus.
European Societies, Vol. 12(5), pp. 653-674.
2. Asian development outlook 2015. (2015). Mandaluyong City: Asian Development Bank, 305 p.
3. Azerbaijan economy. http://www.azerbaijans.com/content_716_en.html. 4. Basilia, T., Silagadze, A., Chikvaidze, T. (2001). Post-socialist Transformation: The Economy of the XXI-st century. "Aradani", Tbilisi.
544 p.
5. BP Statistical Review of World Energy. (2003). London: BP International, 44 p. 6. BP Statistical Review of World Energy. (2010). London: BP International, 50 p.
7. BP Statistical Review of World Energy. (2011). London: BP International, 49 p.
8. BP Statistical Review of World Energy. (2012). London: BP International, 48 p. 9. BP Statistical Review of World Energy. (2013). London: BP International, 48 p.
10. BP Statistical Review of World Energy. (2014). London: BP International, 48 p.
11. Bremmer, J. (2006). The post-Soviet nations after independence. In L.W. Barrington (ed.): Making and Protecting the Nation in Postcolonial and Post-communist States. Ann Arbor, Michigan: The University of Michigan Press, pp. 141-161.
12. Breslin, S. (2007). China and the global political economy. N.Y. Palgrave and MacMillan, 256 p.
13. Breznitz, D. and Murphree, M. (2011). Run of the Red Queen: government, Innovation, globalization, and economic growth in China. New Haven, Conn.: Yale University Press, 278 pp.
14. Brown, T.J., Bide, T., Walters, A.S., Idoine, N.E., Shaw, R.A., Hannis, S.D., Lasty, P.A.J., and Kendall, R. (2011). World mineral
production 2005-09. Keyworth, Nottingham: British Geological Survey, 118 p. 15. Brown, T.J., Idoine, N., Raycraft, E.R.,Shaw, R.A., Deady, E.A.,Rippingale, J.,Bide, T.,Wrighton, C.E., and Rodley, J. (2014). World
mineral production 2008-12. Keyworth, Nottingham: British Geological Survey, 126 p.
16. Brown, T.J.,Shaw, R.A.,Bide, T.,Petavratzi, E., Raycraft, E.R., and Walters, A.S. (2013). World mineral production 2007-11. Keyworth, Nottingham: British Geological Survey, 85 p.
17. Brown, T.J.,Walters, A.S., Idoine, N., Shaw, R.A.,Wrighton, C.E., and Bide, T. (2012). World mineral production 2006-10. Keyworth,
Nottingham: British Geological Survey, 87 p. 18. Brown, T.J., Wrighton, C.E., Raycraft, E.R., Shaw, R.A., Deady, E.A., Rippingale, J., Bide, T., and Idoine, N. (2015). World mineral
production 2009-13. Keyworth, Nottingham: British Geological Survey, 88 p.
19. Brzezinski, Z. (1998). The great chessboard: American primacy and its geostrategic imperatives. N.Y.: Perseus Books Group, 251 p. 20. Combating poverty and making globalization work for all (2006). U.N. Focus, Vol. 23, August, pp. 1-12.
21. Dajian, Z. (2008). Background, pattern and policy of China for developing circular economy. Chinese Journal of Population, Resources
and Environment, Vol. 6, No 4, pp. 1-6. 22. Dorn, J.A. (1991). From plan to market: the post-Soviet challenge. Cato Journal, Vol. 11, No 2, pp. 175-193.
23. Freedman, D.A. (2009). Statistical models: theory and practice. Berkeley: University of California, 424 pp.
24. Garnaut, R. (2008). Thirty years of Chinese reform and economic growth: challenges and how it has changed world development. Canberra: The Australian National University, 19 p.
25. Garnaut, R., Fang, C and Song, L. (2013). China’s new strategy for long-term growth and development. In: Ross Garnaut, Cai Fang and
Ligang Song (eds) China: A New Model for Growth and Development. Canberra: ANU E Press, pp. 1-16. 26. Hanke, S.H. (2004). Oil and politics. Forbes, August 16.
27. Hetherington, L.E., Brown, T.J., Benham, A.J., Bide, T., Lusty P.A.J., Hards, V.L., Hannis, S.D., and Idoine, N.E. (2008). World mineral
production 2002-06. Keyworth, Nottingham: British Geological Survey, 114 p. 28. Hilton, R. The collapse of the Soviet Union and Ronald Reagan.
http://wais.stanford.edu/History/history_ussrandreagan.htm.
29. Hinley, B. (2008). Kazakhstan and the world economy: an assessment of Kazakhstan’s trade policy and pending accession to the WTO.
Brussels: Jan Tumlir Policy Essays, European Center for International Political Economy, No 1, 52 p.
30. IMF primary commodity prices. http://www.imf.org/external/np/res/commod/index.aspx. 31. Jaggi, G., Rundle, M., Rosen, D., and Takahashi, Y. (1996). China’s economic reforms. Chronology and statistics. Working Paper 96-5.
Washington, D C: Institute for International Economics, 39 p.
32. Jia, R. (2013). Essays on the political economics of China’s development. Doctoral Dissertation. Stockholm: Institute for International Economic Studies, Stockholm University, 239 p.
33. Kollmorgen, R. (2013). Theories of post-communist transformation. Approaches, debates, and problems of theory building in the second

ECOFORUM
[Volume 5, Issue 1 (8), 2016]
64
decade of research. Studies of Transition States and Societies, Vol. 5, No 2, pp. 88-105.
34. List of sovereign states in Europe by GDP (nominal) per capita.
https://en.wikipedia.org/wiki/List_of_sovereign_states_in_Europe_by_GDP_%28nominal%29_per_capita. 35. Lofty, G.J., Hillier, J.A., Cooke, S.A., Linley, K.A., and Singh, H.R. (1992). World mineral statistics 1986-90. Vol. 1: Metals & Energy.
Keyworth, Nottingham: British Geological Survey, 216 p.
36. Lofty, G.J., Hillier, J.A., Linley, K.A., and Singh, H.R. (1993). World mineral statistics 1987-91. Vol. 1: Metals & Energy. Keyworth, Nottingham: British Geological Survey, 186 p.
37. Lofty, G.J., Sharp, N.E., Hillier, J.A., Burton, E.M., Mitchell, D.C., and Cooke, S.A. (1988). World mineral statistics 1982-86.
Keyworth, Nottingham: British Geological Survey, 384 p. 38. Mankoff, J. (2010). The Russian economic crisis. N.Y.: Council on Foreign Relations, Inc., 44 p.
39. McKay, H. and Song, L. (2013). China’s new strategy for long-term growth and development. In: Ross Garnaut, Cai Fang and Ligang
Song (eds) China: A New Model for Growth and Development. Canberra: ANU E Press, pp. 75-96. 40. Morrison, W. M. (2015). China’s economic rise: history, trends, challenges, and implications for the United States. CRS Report RL
33534. Washington, DC: Congressional Research Service, 47 p.
41. Morse, E.L. (1999). New political economy of oil. Journal of International Affairs, Vol. 53, 1-29. 42. Özyurt, S. (2010). China’s economic outlook after 30 years of reform. Montpellier: Laboratoire Montpelléraind’Economie Théoriqueet
Appliquée, UnitéMixte de Recherche, 25 p.
43. Papava, V. (2006). The political economy of Georgia’s Rose Revolution. In: East European Democratization, London – Tokyo – New
York: Elsevier, pp. 657-667.
44. Political factors of economic growth and regional development in transition economies (2013). Proceedings of the 6th International
Conference on Globalization. Edited by LuděkKrtička. Ostrava: University of Ostrava, 207 p. 45. Post-Soviet states: two decades of transition & transformation. Edited by A.P. Tulsiram. New Delhi: KW Publishers Pvt, Ltd, 368 p.
46. Putin’s economy – eight years on. http://www.russiaprofile.org.
47. Reichl, C., Schatz, M., and Zsak, G. (2014). World – mining – data. Vol. 29. Vienna: International Organizing Committee for theWorld Mining Congresses, 253 p.
48. Roaf, J., Atoyan, R., Joshi, B., Krogulski, K. and an IMF staff team. (2014). 25 years of transition. Post-Communist Europe and the IMF.
Washington, D.C. : International Monetary Fund, 72 p. 49. Silagadze, A. (2013). Priorities for the Economy of Postcommunist Georgia in the Context of the World Financial Crisis.Problems of
Economic Transition, Vol. 56, pp. 3-16.
50. Silagadse, A., Tokmazishvili, M. (2009). Challenges of the Post-Communist Financial-Currency Policy. Nova publisher. New-York, USA.
51. Silagadse, A., Tokmazishvili, M., Atanelishvili, T. (2013). POST-COMMUNIST ECONOMIC DEVELOPMENT: OBSTACLES AND
PROSPECTS (A GEORGIAN CASE-STUDY) J. The Caucasus& Globalization. Vol.7, Issue 3-4, pp. 72–81. CA&CC Press, Sweden. 52. Song, L., and Woo, W.T. (2008). China’s dilemmas in the 21st Century. In: Ligang Song and Wing Thye Woo (eds) China’s Dilemma:
Economic Growth, the Environment and Climate Change. Canberra: ANU E Press, Asia Pacific Press, Brookings Institution Press and
Social Sciences Academic Press (China), pp. 1-12. 53. South Caucasus – 20 Years of Independence. Bonn: Friedrich-Ebert-Stiftung, 360 p.
54. Stockwell, L.E., Hillier, J.A., Mills, A.J., and White, R. (2000). World mineral statistics 1994-98. Keyworth, Nottingham: British
Geological Survey, 305 p. 55. Stockwell, L.E., Hillier, J.A., Mills, A.J., and White, R. (2002). World mineral statistics1996-2000. Keyworth, Nottingham: British
Geological Survey, 314 p. 56. Strayer, R.W. (1998). Why did the Soviet Union collapse? Understanding historical changes. New York, M.E. Sharpe, 219 p.
57. Taylor, L.E., Hillier, J.A., and Benham, A.J. (2005). World mineral production 1999-2003. Keyworth, Nottingham: British Geological
Survey, 88 p. 58. The Baku-Tbilisi-Ceyhan Pipeline: oil window to the West (2005). Edited by S.F. Starr & S.E. Cornell. Vienna: the Central Asia –
Caucasus Institute, Silk Road Studies Program, 150 p.
59. The international economic crisis and the post-Soviet states (2013). Edited by V. Feklyunina and S. White. N.Y.: Rutledge, 325 p. 60. The World Bank Group. Database. Http://data.worldbank.org/indicator/.
61. Tisdell, C. (2008). Thirty Years of Economic Reform and Openness in China: Retrospect and Prospect. Working Paper No 51. Brisbane:
University of Queensland, Series Economic Theory, Applications and Issues, 25 p. 62. Tvalchrelidze, A.G. (2011). Economics of commodities and commodity markets. N.Y.: Nova Science Publishers, Inc., 906 p.
63. Tvalchrélidzé, A. and Gogobéridzé, I. (1995). Desintegratióneconomica e integratión: los Estatos de la ex URSS ayer y mañana.
Cuadrenios Americanos. Nueva Época. Vol. 5, pp. 209-215. 64. Tvalchrelidze, A. and Silagadze, A. (2011). Problems of European commodity security and sustainable development of Central Asia –
Caucasus Region. Central Asia and the Caucasus, Vol. 12, Issue 4, pp. 110-127.
65. Tvalchrelidze, A. and Silagadze, A. (2013). Macroeconomic model for oil-exporting countries. Central Asia and the Caucasus, Vol. 14, pp. 118-145.
66. Ünay, S. (2013). From engagement to contention: China in the global political economy. Perception, Vol. XVIII, No 1, pp. 129-153.
67. Wang, X. (2008). Rethinking thirty years of reform in China. Implications for economic performance. In: Ligang Song and Wing Thye Woo (eds) China’s Dilemma: Economic Growth, the Environment and Climate Change. Canberra: ANU E Press, Asia Pacific Press,
Brookings Institution Press and Social Sciences Academic Press (China), pp. 153-169.
68. Weil, R. (2008). A House Divided: China after 30 Years of ‘Reforms’. Economic & Political Weekly, December, 27, pp. 61-69. 69. World copper factbook 2007 (2007). Lisbon: International Copper Study Group, 66 p.
70. World copper factbook 2014 (2014). Lisbon: International Copper Study Group, 63 p.
71. World steel in figures. 2004 Edition (2004). Brussels: International Iron and Steel Institute, 21 p. 72. World steel in figures 2007 (2008). Brussels: World Steel Association, 16 p.
73. World steel in figures 2014 (2015). Brussels and Beijing: World Steel Association, 32 p.
74. Zhao, S. (2010). The China Model: can it replace the Western model of modernization? Journal of Contemporary China, Vol. 19(65), pp. 419-436.
75. Silagadze, A. and Zubiashvili, T. (2015). The Concept of Drinking Water Business Development. Refereed International Journal of Business
and Management Studies (IJBMS), Vol. 4, No 1. 2015, USA. pp. 299-307. http://www.universitypublications.net/ijbms/0401/index.html
View publication statsView publication stats