Embed Size (px)
Citation preview
JENA ECONOMIC RESEARCH PAPERS
# 2010 – 027
Human Capital Diversity and Product Innovation:
A Micro-Level Analysis
by
René Söllner
www.jenecon.de
ISSN 1864-7057
The JENA ECONOMIC RESEARCH PAPERS is a joint publication of the Friedrich Schiller University and the Max Planck Institute of Economics, Jena, Germany. For editorial correspondence please contact [email protected]. Impressum: Friedrich Schiller University Jena Max Planck Institute of Economics Carl-Zeiss-Str. 3 Kahlaische Str. 10 D-07743 Jena D-07745 Jena www.uni-jena.de www.econ.mpg.de © by the author.
Human Capital Diversity and Product Innovation:
A Micro-Level Analysis
René Söllner∗
April 19, 2010
Abstract
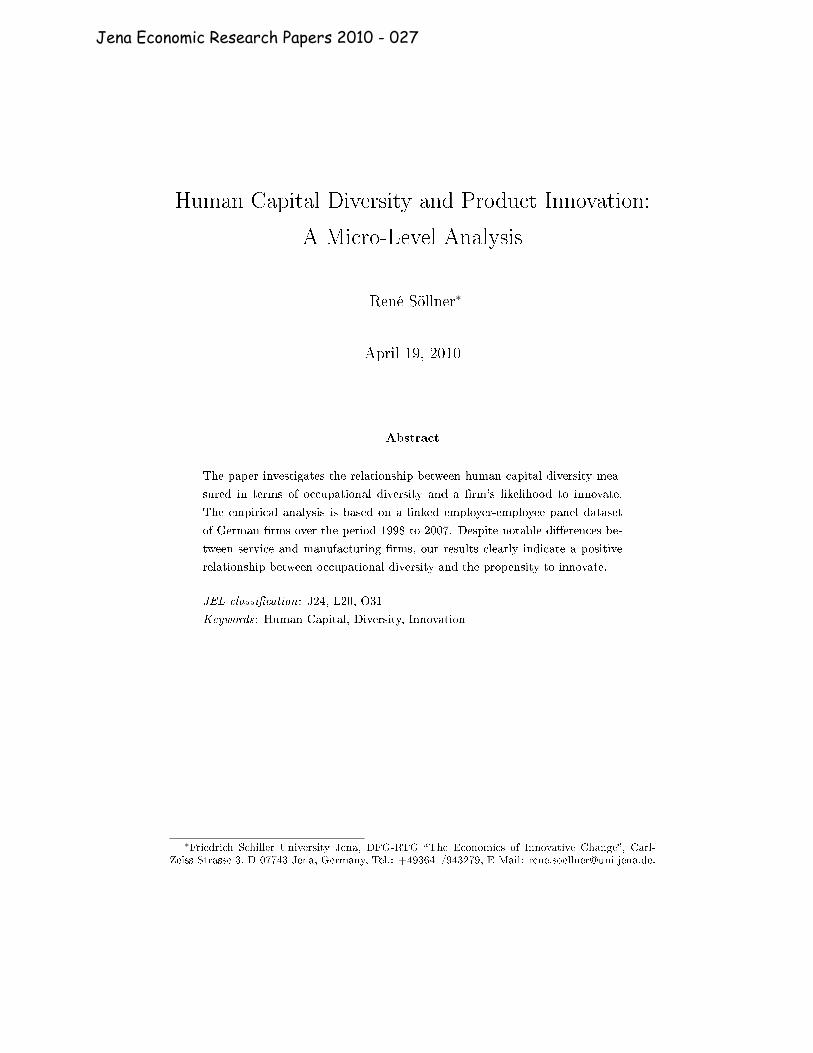
The paper investigates the relationship between human capital diversity mea-
sured in terms of occupational diversity and a �rm's likelihood to innovate.
The empirical analysis is based on a linked employer-employee panel dataset
of German �rms over the period 1998 to 2007. Despite notable di�erences be-
tween service and manufacturing �rms, our results clearly indicate a positive
relationship between occupational diversity and the propensity to innovate.
JEL classi�cation: J24, L20, O31
Keywords: Human Capital, Diversity, Innovation
∗Friedrich Schiller University Jena, DFG-RTG �The Economics of Innovative Change�, Carl-Zeiss-Strasse 3, D-07743 Jena, Germany, Tel.: +493641/943279, E-Mail: [email protected].
Jena Economic Research Papers 2010 - 027
1 Introduction
Since the pioneering work of Edith Penrose (1959), it has been known that perfor-
mance di�erentials between �rms can be attributed to di�erences in resources and
capabilities (see Wernerfelt, 1984; Rumelt, 1984; Barney, 1986). According to Hitt
et al. (2001), these resources can be classi�ed into two broad categories: intangible
and tangible. Tangible resources mainly refer to the physical and �nancial assets
that a �rm possesses. Intangible resources can be associated with internal human
capital assets in terms of skills, knowledge, and technological capabilities. Since in-
tangible resources are socially complex and can hardly be imitated by competitors,
they constitute strategically the most crucial resources (see Barney, 1991; Peteraf,
1993; among others). The economic literature has long been recognized that human
capital endowments (including education, experience, and skills) provide the basis
for a �rm's competitiveness (Bartel, 1989; Senker and Brady, 1989; Howell and Wol�,
1991; Prais, 1995; Pennings et al., 1998; Black and Lynch, 1996; Hitt et al., 2001).
The conventional wisdom is that a �rm's stock of knowledge embodied in its human
capital resources a�ects economic performance through productivity increases and
the creation of innovation. This line of reasoning can be found in Welch (1970),
who argues that better educated workers have an enhanced ability to acquire and
to decode information about costs and productive characteristics of inputs. Further,
increases in human capital facilitate the adaptation to technological change (Nelson
and Phelps, 1966; Bartel and Sicherman, 1998), and lead to a faster accumulation
and transfer of knowledge (Grant, 1996).
While it is well accepted in the literature that a �rm's stock of human capital ex-
erts a positive in�uence on economic performance and innovation, surprisingly, only
little is known about the way in which the composition of human capital may a�ect
innovative performance. The basic claim we have is that a diverse human capital
pool becomes increasingly important in a business environment which is shaped by
competitive advantages arising from innovative activities. Studies show that diver-
sity among team members is related to greater knowledge, creativity and innovation
(Watson et al., 1993; Maimunah and Lawrence, 2008). In the empirical analysis of
this paper, we take a closer look at this issue. The goal is to assess a potential
relationship between the diversity of a �rm's human capital measured in terms of
occupational diversity and the propensity to innovate. In order to do so, we employ
a rich dataset of German manufacturing and service �rms over time period 1998 to
2
Jena Economic Research Papers 2010 - 027
2007. The contribution of this section is substantive. To the best of our knowledge,
there is no previous study that investigates the impact of occupational diversity on
a �rms' propensity to innovate using such a rich dataset. Another novel aspect of
the section is to bring together two so far rather parallel existing research streams.
Arguments for a positive relationship between workforce diversity and �rm perfor-
mance in terms of innovative output can be found in the economics of innovation but
also in the human resource management literature. We are not aware of any other
study that takes arguments of both research strands explicitly into account.
The results of the current paper can brie�y be summarized. The empirical analy-
sis shows that there is positive relationship between a �rm's human capital diversity
(measured in terms of occupational diversity) and the probability of innovation. Fur-
ther, by using di�erent innovative performance measures, we can detect di�erences
between service and manufacturing �rms. The remainder of this paper is as follows.
After this introductory section (section 1), we will give a short overview about the
theoretical background and related literature on that topic (section 2). A description
of the dataset and of the underlying estimation strategy is presented in section 3.
Section 4 reports the results of the empirical analysis. Section 5 concludes.
2 Literature Review
In the evolutionary economics literature, diversity is often considered to be among the
central factors explaining economic performance. According to Giuri et al. (2002),
due to increases in the complexity of products, the last few decades have been char-
acterized by a growing technological diversi�cation of �rms and industries. Evolu-
tionary theory suggests that maintaining positions in a diverse range of technologies
is essential for long-run economic success (Dosi, 1982; Nelson and Winter, 1982).
More recently, Breschi et al. (2003) has observed that �rms need to span their in-
novative activities over more than one technology. In particular, technology-based
�rms need to diversify in order to attain sustained economic growth (Suzuki and Ko-
dama, 2004). Since innovations are often designed to solve unrelated problems, �rms
that are more technologically diversi�ed are better able to capture technological op-
portunities (Nelson, 1959), and to obtain higher cross-fertilization between di�erent,
although related technologies (Granstrand, 1996). Based on organizational learn-
ing research, Quintana-Garcia and Benavides-Velasco (2008) test how technological
3
Jena Economic Research Papers 2010 - 027
diversi�cation enables organizations to improve their innovative capacity. Their re-
sults show that a diversi�ed technology portfolio positively and signi�cantly a�ects a
�rm's competence to innovate. Implementing new technologies into the �rm's knowl-
edge system seems to facilitate the search for complementarities and novel solutions,
the generation of new ideas, and the avoidance of learning traps. This general �nding
can be linked to the concept of 'absorptive capacity' (Cohen and Levinthal, 1989,
1990), suggesting that prior knowledge confers an ability to recognize the value of
new information and to incorporate and apply it for commercial uses. Cohen and
Levinthal (1990) argue that the absorptive capacity of a �rm is likely to increase
with the broadness of the internal knowledge structure as re�ected by the diversity
of skills and capabilities of the workforce. Firms exhibiting a diverse human capital
structure among their employees are more likely to innovate, since di�erent points of
view, educational backgrounds, and experiences facilitate complex problem solving,
the generation of new ideas and novel combinations (Quintana-Garcia and Benavides-
Velasco, 2008). In an empirical study on creativity and innovation, Van der Vegt and
Janssen (2003) show that an individual's innovative behavior is the complex product
of his relationships with fellow team members and the team context. This �nding
is consistent with the theoretical framework developed by Woodman et al. (1993)
explaining organizational creativity by complex interactions of persons in a social
setting. The authors highlight that diversity rather than homogeneity among group
member is important in fostering creative group outcomes.
The relation between the diversity of human capital being manifested in the variety
of knowledge, experiences and skills among employees and a �rm's economic per-
formance has been the subject of a considerable amount of research. In particular,
the human resource management literature is replete with discussion of the impact
of workforce heterogeneity. Most of the existing literature has been focused on the
e�ects of diversity in the top management teams. For instance, Hambrick et al.
(1996), examining 32 U.S. airlines over eight years, �nd that top management teams
being diverse in terms of functional backgrounds, education, and company tenure,
exhibit strikingly positive e�ects on corporate outcomes. Using a sample of 84 For-
tune 500 food and oil companies, observed over the period 1967 to 1981, Murray
(1989) tests how occupational heterogeneity of top management groups impinges on
the short-term and on the long-term performance of �rms. Along with Hambrick
and Mason (1984), Murray shows that there is a potential trade-o�. In the short-
run, heterogeneity in management groups reduces performance due to an increase in
the likelihood of misunderstandings and mistrust (Tuckman, 1965). In the long-run,
4
Jena Economic Research Papers 2010 - 027
however, heterogeneous management groups do have an advantage of greater creativ-
ity and enhanced adaptability which positively a�ects performance (Katz, 1982). In
a study by Smith et al. (1994), top management team heterogeneity with respect to
educational levels was found to be positively associated with a �rm's return on in-
vestment and growth in sales. Kildu� et al. (2000) di�erentiate between demographic
diversity in top management teams (measured by variables such as age, gender, and
race) and cognitive diversity, which is obtained through direct questionnaire measures
of attitudinal and normative di�erences between individuals. Concerning the e�ects
of demographic and cognitive diversity on performance, Kildu� et al. (2000) �nd
mixed results. Only one demographic diversity measure (age heterogeneity) and one
of the cognitive diversity measures (interpretative ambiguity) signi�cantly positively
a�ect overall �rm performance.
In his literature review of research analyzing the general impact of team diversity
on performance, Horwitz (2005) states that the relationship is not yet clearly un-
derstood. While some studies allude towards a positive e�ect of diversity (e.g., Cox
and Blake, 1991; Nemeth, 1986; Iranzo et al., 2008), others stress the negative ef-
fects on performance (e.g., O'Reilly et al., 1989; Wiersema and Bantel, 1992; Wagner
et al., 1984). Studies suggesting a positive impact of team and workforce diver-
sity put forward the argument that groups consisting of heterogeneous members
enhance creativity, innovation, and problem solving, thus generating more informed
decisions. Nemeth (1986) �nds that heterogeneous teams incorporating minority
members more carefully think about an issue, and generate more creative ideas than
homogeneous teams. Pelled et al. (1999) observe that team diversity in terms of
education and company tenure in�uence the quality of debates and thus positively
a�ect the decision-making process. Examining the relationship between a culturally
diverse workforce and organizational performance, Richard (2000) demonstrates that
cultural diversity does in fact add to �rm value, and contributes to a �rm's compet-
itive advantage. Using a dataset of Italian manufacturing �rms, Iranzo et al. (2008)
show that a �rm's productivity is positively related to the dispersion of skills within
the �rm. Though many studies seem to support the conclusion that diversity is ben-
e�cial for performance, organization theorists recently emphasize the potential costs
associated with heterogeneity. As noted by Horwitz (2005), workforce diversity can
be a double-edged sword. The greater the amount of diversity in a group, the less
integrated the group is likely to be (O'Reilly et al., 1989), and the higher the level
of dissatisfaction and tensions (e.g., Wagner et al., 1984). Intragroup con�ict, mis-
communication, and lack of trust lead to increased transaction costs. Accordingly,
5
Jena Economic Research Papers 2010 - 027
homogeneous groups may likely to be more productive than heterogeneous groups
because of mutual attraction of group members with similar characteristics. An em-
pirical study by Wiersema and Bantel (1992) �nds that homogeneity with respect to
demographic traits leads to a shared language among individuals that enhances the
communication frequency and integration. The researchers note that homogeneous
teams, in general, perform better than their heterogeneous counterparts on tasks
requiring coordinated activities among team members.
As pointed out by Williams and O'Reilly (1998), the con�icting empirical �ndings of
studies analyzing a relation between diversity and �rm performance might stem from
di�erences in de�ning performance measures. While most of the previous studies rely
on performance measures such as productivity, return on investment, or sales, the
current study takes a closer look at the relationship between diversity and innova-
tive performance. Studies focusing on the e�ect of diversity on innovative outcomes
of �rms are scarce. In a study of the top management groups of banks, Bantel
and Jackson (1989) �nd that the more diverse the group was in terms of functional
background, the larger the amount of administrative innovation. However, they do
not �nd any relationship between functional heterogeneity of the top management
team and the number of technical innovations the bank made. A �eld study of top
management teams in �nancial service corporations by Pitcher and Smith (2001)
supports the idea that diversity exerts a positive in�uence on innovation. The e�ect
of task interdependence and group diversity on the innovative behavior of individual
team members in a Dutch multinational �nancial service �rm is analyzed by Van der
Vegt and Janssen (2003). Their results do not indicate a relationship between group
diversity and innovative behavior. A study of 45 product teams by Ancona and
Caldwell (1992) reveals that functional diversity has a negative direct e�ect on inno-
vation and team-rated performance, but it has a positive indirect e�ect on innovation
through its association with an increased rate of communication with those outside
the project group. Zajac et al. (1991) investigate how diversity a�ects the innova-
tiveness of internal corporate joint ventures. Their empirical �ndings suggest that
less age diversity is signi�cantly positively related to innovation.
A shortcoming of a number of previous studies that try to explore a relationship
between diversity and innovation is the restricted focus on the diversity of the top
management team (e.g., Bantel and Jackson, 1989; Pitcher and Smith, 2001). Al-
though organizational leaders may be of importance, we would rather suggest that a
�rm's propensity to innovate is determined by the diversity of skills and capabilities
6
Jena Economic Research Papers 2010 - 027
of the entire workforce. The broadness of the knowledge base constitutes a �rm's
absorptive capacity (Cohen and Levinthal, 1989, 1990) and, hence, its ability to gen-
erate innovation. Since the broadness of the internal knowledge structure is re�ected
by the collective skills and abilities of all employees, it is not su�cient to just analyze
the diversity of a particular organizational group. In contrast to other studies, we
will therefore focus on the diversity of entire workforce rather than on the diversity
of the top management team.
Employees di�er with respect to a large set of dimensions. Consequently, di�erent
types of diversity exist. As described by Kildu� et al. (2000), the di�erent types
of diversity can be classi�ed into two broad categories: i) diversity on observable
attributes, such as age, gender, race, or organizational tenure, and ii) diversity with
respect to relatively unobservable attributes, such as attitudes, values, and beliefs.
In order to measure the extent of diversity among employees, we rely on measurable
characteristics.1 As previously mentioned, a type of diversity that is of particular
relevance for the generation of innovation is the diversity of skills and knowledge (Mil-
liken and Martins, 1996). Knowledge allows individuals to recognize the value of new
information, to incorporate and to use it (Cohen and Levinthal, 1990). Bantel and
Jackson (1989) point out that knowledge facilitates the identi�cation of problems,
as well as the detection and evaluation of feasible solutions. Regarding di�erences
in knowledge, the presence of individuals with di�ering points of view, diverse abili-
ties and perspectives guarantees the consideration of a larger set of problems and a
larger set of potential solutions. Since innovation is an interactive process (Lundvall,
1988), which requires diverse knowledge bases among those who interact, knowledge
(or human capital) diversity among employee should generally positively a�ect the
generation of innovation in a �rm. The question is, however, how to obtain an ap-
propriate measure of human capital diversity? According to Bantel and Jackson
(1989) and Merton et al. (1957), the functional or occupational background shapes a
person's cognitive and attitudinal perspectives. It also a�ects how problems are for-
mulated, and what types of solutions are generated. In this line of reasoning, we claim
that occupational diversity acts as an appropriate measure for the heterogeneity of
perspectives, skills, and abilities within a �rm's workforce. As cross-functional com-
munication is considered to be a precursor to innovation (Shrivastava and Souder,
1985), and groups composed of individuals having a variety of skills, knowledge,
and perspectives are in general more e�ective when solving complex, non-routine
1 Hambrick and Mason (1984) consider observable attributes to be convenient proxies for unob-servable attributes.
7
Jena Economic Research Papers 2010 - 027
problems (Shaw, 1976; Wanous and Youtz, 1986), we expect occupational diversity
to be positively related to a �rm's propensity to innovate.
Diversity of employees in terms of their occupational background has already been
acknowledged to be a factor in�uencing a �rm's likelihood to innovate (Bantel and
Jackson, 1989; Pitcher and Smith, 2001). A general drawback of these studies is,
however, that they merely consider the occupational diversity of the top management
team. Related studies take a broader perspective by focusing on the entire workforce,
but they predominantly concentrate on diversity types such as age, gender, ethnicity,
or educational diversity that a�ect innovation (Van der Vegt and Janssen, 2003; Zajac
et al., 1991; Ostergaard et al., 2009; Laursen et al., 2005; Drach-Zahavy and Somech,
2001; Watson et al., 1993).
3 Data and Methodology
The empirical analysis is based on the linked employer-employee dataset (LIAB)
provided by the Institute for Employment Research (IAB) of the German Federal
Employment Agency.2 The dataset contains both establishment-level data of an an-
nual panel survey of about 16,000 German businesses, and linked individual data
of employees. The information of individuals includes all employees covered by the
social security system. From the available cross-sections of the dataset, we utilize
the period 1998 to 2007. Since the data are based on o�cial employment statistics
derived from social security, they can be regarded as highly reliable. For the pur-
pose of the current study, the LIAB dataset is well suited. Besides establishment
information about innovative activities and other relevant characteristics (e.g., size,
exports, pro�tability), the data contain rich information on the occupational back-
ground3, education, work experience, age etc. of employees in the establishment.
Consequently, the question how human capital diversity impinges on the innovative
behavior of businesses can adequately be addressed.
Dependent Variable. We employ two di�erent innovative performance measures.
First, we construct a binary variable indicating whether a business introduced an
2 A detail description of the dataset can be found in Alda et al. (2005).3 In fact, the data allow a distinction between 336 di�erent occupations at a three-digit classi�-
cation level.
8
Jena Economic Research Papers 2010 - 027
innovation during the two preceding years.4 A value of 1 is assigned if a success in
one of the following innovation categories was reported: i) an improvement of an
existing product; ii) the introduction of product that was new to the business but
known to the market; iii) the creation of a completely new product (i.e., new to the
business and new to the market). If one of these criteria is ful�lled, we denote this as
a general product innovation being implemented. In a second model speci�cation, a
value of 1 for the dependent variable is assigned if and only if a business successfully
introduced a completely new product (i.e., product improvements and the introduc-
tion of products already known to the market are not considered). In the latter case,
we speak of fundamental product innovation or the generation of market novelties.
Independent Variables. We are basically interested in a relation between occupational
diversity (presumably re�ecting the diversity of human capital) and the propensity
to innovate. In our analysis, we calculate a Shannon (1948) entropy index to account
for the occupational diversity of a business. The entropy index for establishment i is
de�ned as
occ_divi =∑j
sij · ln (1/sij) (1)
where sij denotes the employment share of occupation j, j=1,...,J , in total employ-
ment.5
In the previous section, we pointed out that other types of diversity are likely to a�ect
the innovative behavior of �rms. Zajac et al. (1991), for instance, �nd that diversity
in age exerts a negative e�ect on innovative performance. The opposite result is
detected by Ostergaard et al. (2009). In order to account for the age diversity in the
workforce, we calculate a coe�cient of variation. Referring back to Allison (1978),
4 Note that questions about product innovations are subject of the LIAB panel survey only everythree years. The questions regarding innovative activities correspond to the two precedingyears. Thus, although the corresponding panel consist of data collected for the time period 1998to 2007, the data structure only allows the application of 3 periods. The dependent variablerefers to innovative output for the years 1999 to 2001, 2002 to 2004, and 2005 to 2007, and theindependent variables refer to the years 1998, 2001, and 2004 respectively.
5 Employment shares of occupations are obtained at a three-digit classi�cation level. In orderto rule out that the results depend the level of aggregation, human capital diversity was alsocalculated at a two-digit occupational level. Further, a Her�ndahl-based diversi�cation indexwas computed, which takes the form 1 −
∑s2ij , where sij denotes the employment share of
occupation j in business i. It turned out that none of this alternative speci�cations lead toqualitative changes of the results.
9
Jena Economic Research Papers 2010 - 027
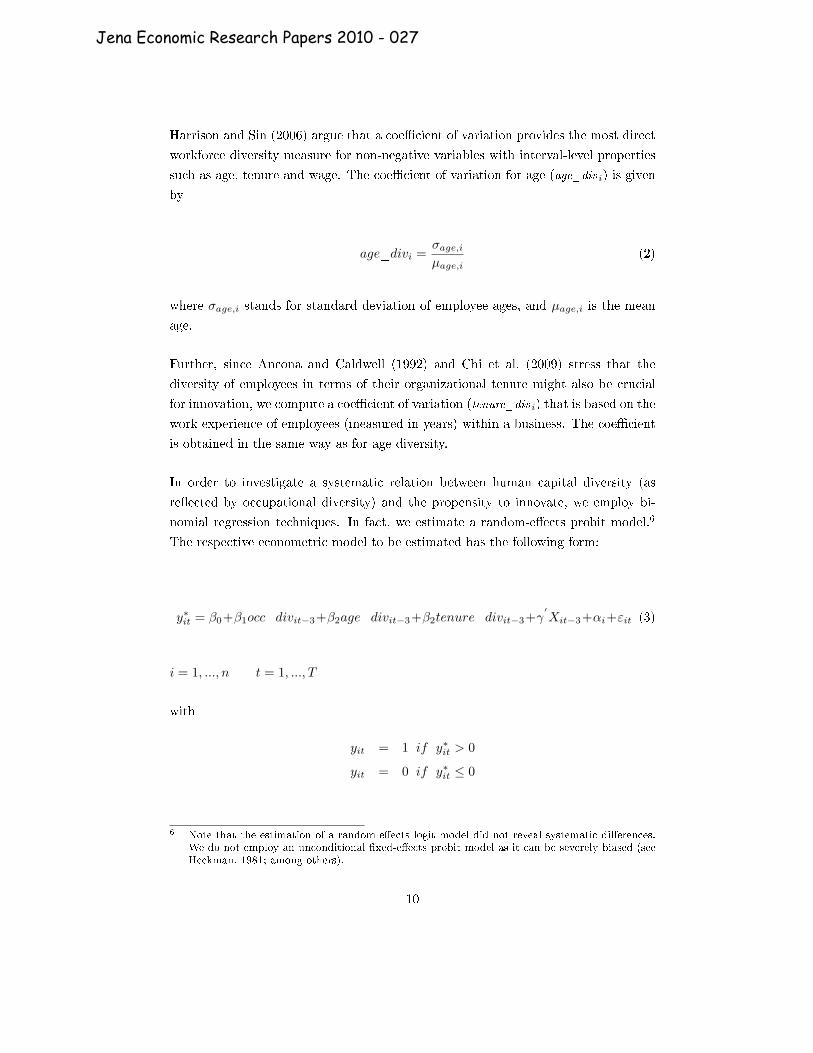
Harrison and Sin (2006) argue that a coe�cient of variation provides the most direct
workforce diversity measure for non-negative variables with interval-level properties
such as age, tenure and wage. The coe�cient of variation for age (age_div i) is given
by
age_divi =σage,iµage,i
(2)
where σage,i stands for standard deviation of employee ages, and µage,i is the mean
age.
Further, since Ancona and Caldwell (1992) and Chi et al. (2009) stress that the
diversity of employees in terms of their organizational tenure might also be crucial
for innovation, we compute a coe�cient of variation (tenure_div i) that is based on the
work experience of employees (measured in years) within a business. The coe�cient
is obtained in the same way as for age diversity.
In order to investigate a systematic relation between human capital diversity (as
re�ected by occupational diversity) and the propensity to innovate, we employ bi-
nomial regression techniques. In fact, we estimate a random-e�ects probit model.6
The respective econometric model to be estimated has the following form:
y∗it = β0+β1occ_divit−3+β2age_divit−3+β2tenure_divit−3+γ′Xit−3+αi+εit (3)
i = 1, ..., n t = 1, ..., T
with
yit = 1 if y∗it > 0
yit = 0 if y∗it ≤ 0
6 Note that the estimation of a random-e�ects logit model did not reveal systematic di�erences.We do not employ an unconditional �xed-e�ects probit model as it can be severely biased (seeHeckman, 1981; among others).
10
Jena Economic Research Papers 2010 - 027
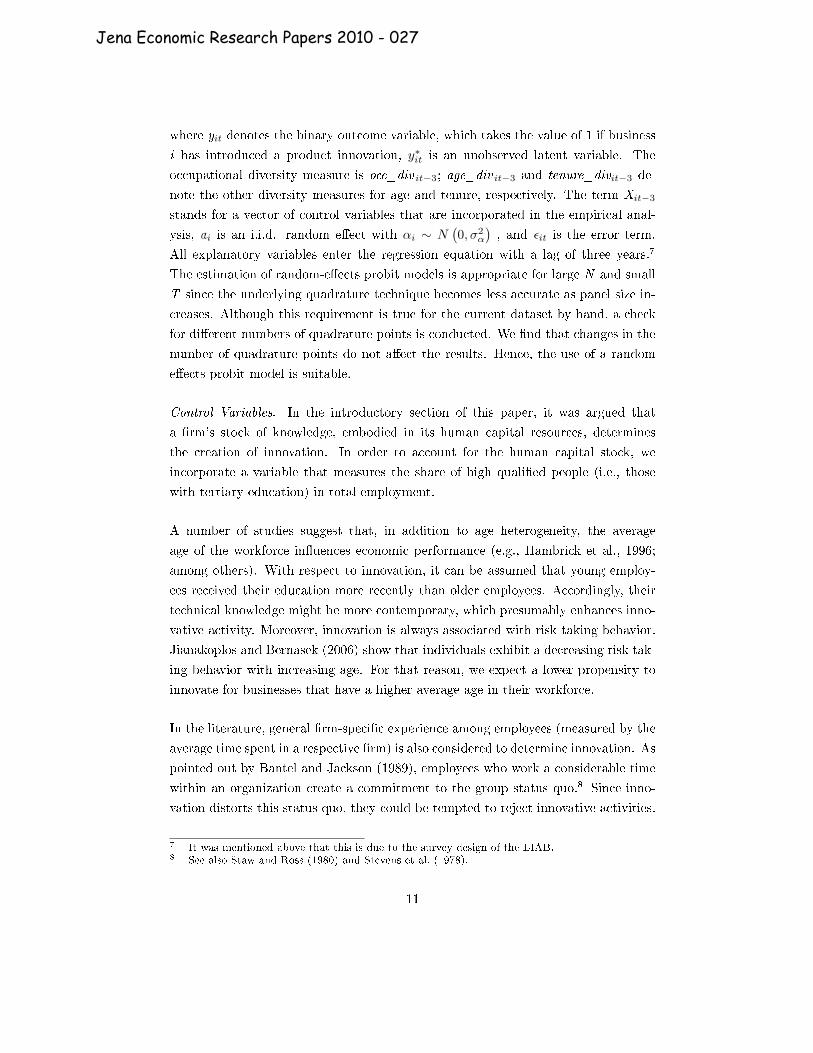
where yit denotes the binary outcome variable, which takes the value of 1 if business
i has introduced a product innovation, y∗it is an unobserved latent variable. The
occupational diversity measure is occ_div it−3; age_div it−3 and tenure_divit−3 de-
note the other diversity measures for age and tenure, respectively. The term Xit−3
stands for a vector of control variables that are incorporated in the empirical anal-
ysis, αi is an i.i.d. random e�ect with αi ∼ N(0, σ2
α
), and εit is the error term.
All explanatory variables enter the regression equation with a lag of three years.7
The estimation of random-e�ects probit models is appropriate for large N and small
T since the underlying quadrature technique becomes less accurate as panel size in-
creases. Although this requirement is true for the current dataset by hand, a check
for di�erent numbers of quadrature points is conducted. We �nd that changes in the
number of quadrature points do not a�ect the results. Hence, the use of a random
e�ects probit model is suitable.
Control Variables. In the introductory section of this paper, it was argued that
a �rm's stock of knowledge, embodied in its human capital resources, determines
the creation of innovation. In order to account for the human capital stock, we
incorporate a variable that measures the share of high quali�ed people (i.e., those
with tertiary education) in total employment.
A number of studies suggest that, in addition to age heterogeneity, the average
age of the workforce in�uences economic performance (e.g., Hambrick et al., 1996;
among others). With respect to innovation, it can be assumed that young employ-
ees received their education more recently than older employees. Accordingly, their
technical knowledge might be more contemporary, which presumably enhances inno-
vative activity. Moreover, innovation is always associated with risk taking behavior.
Jianakoplos and Bernasek (2006) show that individuals exhibit a decreasing risk tak-
ing behavior with increasing age. For that reason, we expect a lower propensity to
innovate for businesses that have a higher average age in their workforce.
In the literature, general �rm-speci�c experience among employees (measured by the
average time spent in a respective �rm) is also considered to determine innovation. As
pointed out by Bantel and Jackson (1989), employees who work a considerable time
within an organization create a commitment to the group status quo.8 Since inno-
vation distorts this status quo, they could be tempted to reject innovative activities.
7 It was mentioned above that this is due to the survey design of the LIAB.8 See also Staw and Ross (1980) and Stevens et al. (1978).
11
Jena Economic Research Papers 2010 - 027
Hence, a negative relation between innovation and average tenure across employees
is expected.
Further, we suspect that �rm size (measured by the logarithm of number of em-
ployees) enhances innovation. The assumption of a positive relation between size
and innovation dates back to Schumpeter (1942). A majority of works con�rm the
hypothesis of an increase of innovative activity with �rm size, although there are
arguments that support the opposite hypothesis (Holmstrom, 1989). More favor-
able conditions to �nance innovations, better access to human capital resource, or
the exploitation of scale e�ects can be reasons for the expected positive relationship
between size and innovation.
Since the pioneering work of Pakes and Grilliches (1980), it has been argued in the
literature that there is a positive connection between innovative input and innovative
output (see also Hausman et al., 1984). We assume that businesses are particularly
innovative if they devote resources to the development of new products. In order to
account for this, we include a binary variable in our analysis that has the value 1 if
an establishment reported to be explicitly engaged in R&D activities (e.g., due to
the existence of a R&D division). Of course, R&D intensity measured by the ratio
of R&D expenditures (or R&D employees) to sales would better re�ect innovative
activity on the �rm-level. However, the LIAB dataset of the Institute for Employment
Research (IAB) does not contain information on the amount of R&D expenditures
or the number of R&D employees. Thus, R&D activity has to be implemented as a
binary variable.
Nowadays, exporting plays an increasing role in company strategies, as markets be-
come more globalized. Firms involved in international trade are exposed to inter-
national competition forces. In this context, we expect innovation to be a critical
source for the competitive advantage and long-run economic success. Hence, a posi-
tive relation between export intensity and the propensity to innovate is assumed. We
measure an establishment's export intensity by the share of sales exported in total
sales and include this variable in our econometric model.
Also �nancial endowments might in�uence innovative activities. To a certain extent,
the outcome of innovative activities is uncertain. Since potential capital investors
such as banks could be deterred by the risk of innovative projects, businesses often
have to rely on their own �nancial resources. Consequently, more pro�table �rms
12
Jena Economic Research Papers 2010 - 027
should be more inclined to conduct innovative ventures as they have the required
monetary resources. In order to control for that, we construct a binary variable
capturing the pro�tability of a business. A value of 1 is assigned when a business
has assessed its pro�tability to be better than 3 on a scale from 1 to 5. A value
of 1 for the respective binary variable means that that pro�tability was rated as
`good' or `very good'. Unfortunately, the dataset does not enable us to construct
a continuous pro�tability measure, since the required information on intermediate
inputs is lacking.
In addition, we incorporate a dummy variable in our regression equation that ac-
counts for di�erences between East- and West German �rms. The variable has the
binary outcome 1 when an establishment is located in East-Germany and 0 otherwise.
A summary of variable de�nitions is reported in Table 1.
13
Jena Economic Research Papers 2010 - 027
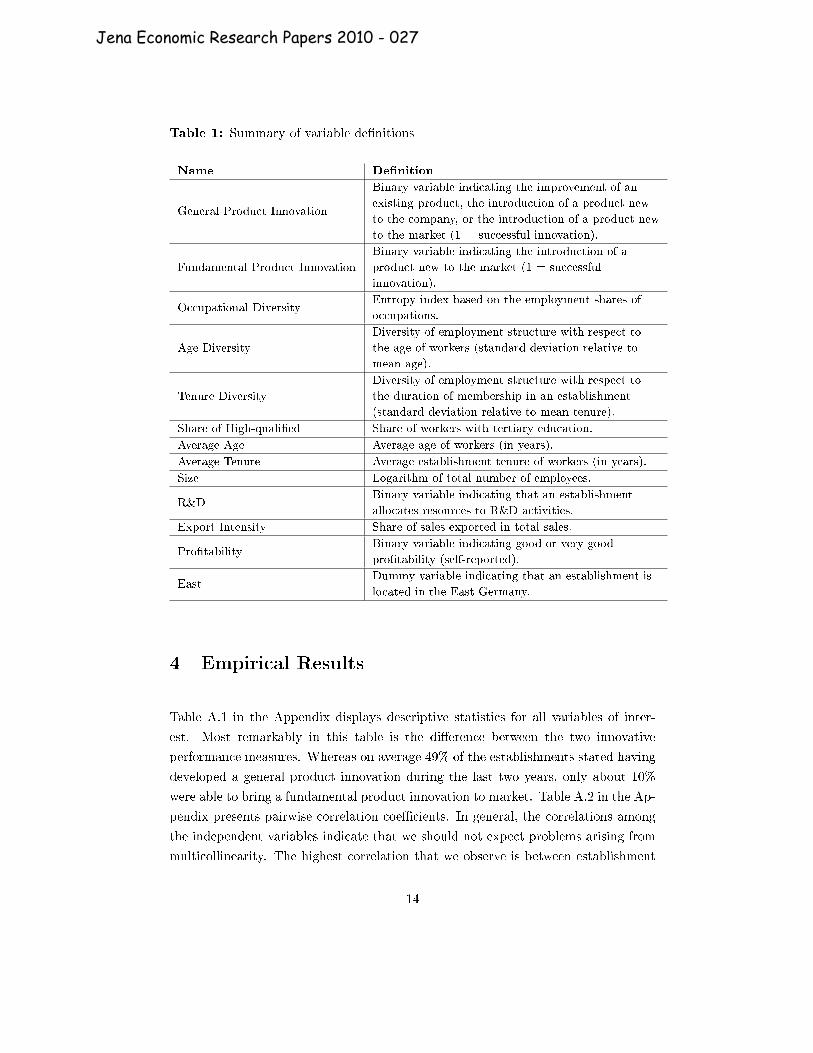
Table 1: Summary of variable de�nitions
Name De�nition
General Product Innovation
Binary variable indicating the improvement of an
existing product, the introduction of a product new
to the company, or the introduction of a product new
to the market (1 = successful innovation).
Fundamental Product Innovation
Binary variable indicating the introduction of a
product new to the market (1 = successful
innovation).
Occupational DiversityEntropy index based on the employment shares of
occupations.
Age Diversity
Diversity of employment structure with respect to
the age of workers (standard deviation relative to
mean age).
Tenure Diversity
Diversity of employment structure with respect to
the duration of membership in an establishment
(standard deviation relative to mean tenure).
Share of High-quali�ed Share of workers with tertiary education.
Average Age Average age of workers (in years).
Average Tenure Average establishment tenure of workers (in years).
Size Logarithm of total number of employees.
R&DBinary variable indicating that an establishment
allocates resources to R&D activities.
Export Intensity Share of sales exported in total sales.
Pro�tabilityBinary variable indicating good or very good
pro�tability (self-reported).
EastDummy variable indicating that an establishment is
located in the East Germany.
4 Empirical Results
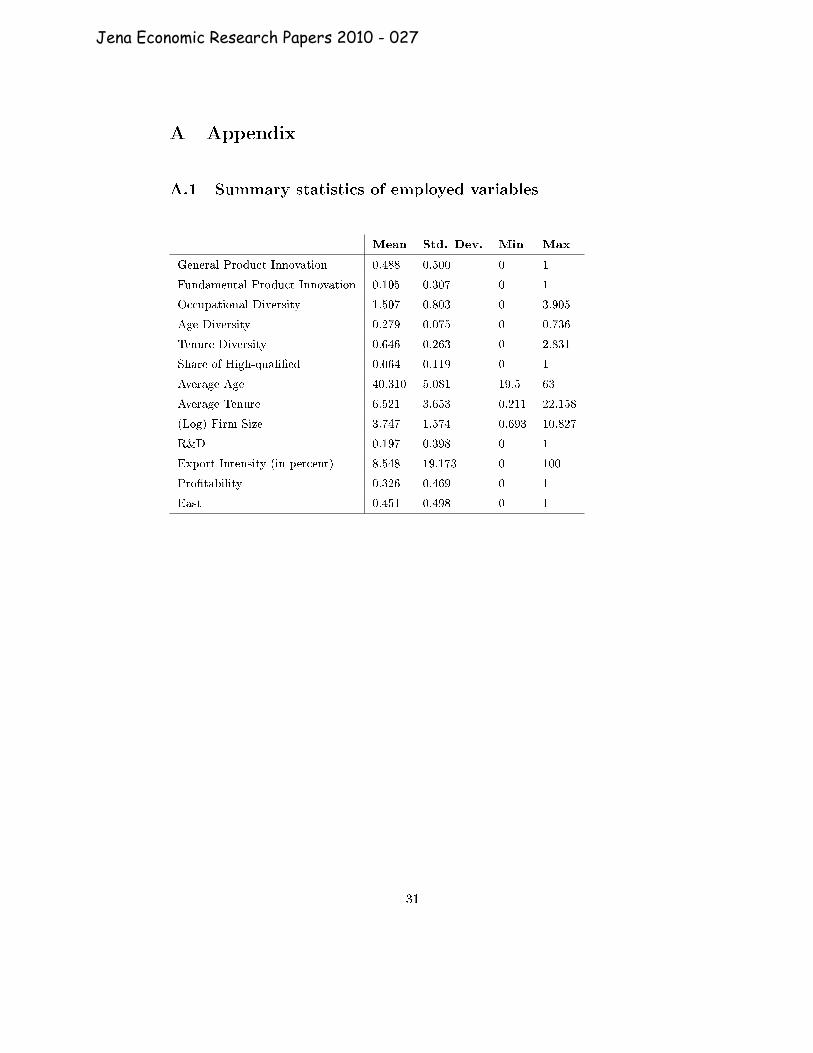
Table A.1 in the Appendix displays descriptive statistics for all variables of inter-
est. Most remarkably in this table is the di�erence between the two innovative
performance measures. Whereas on average 49% of the establishments stated having
developed a general product innovation during the last two years, only about 10%
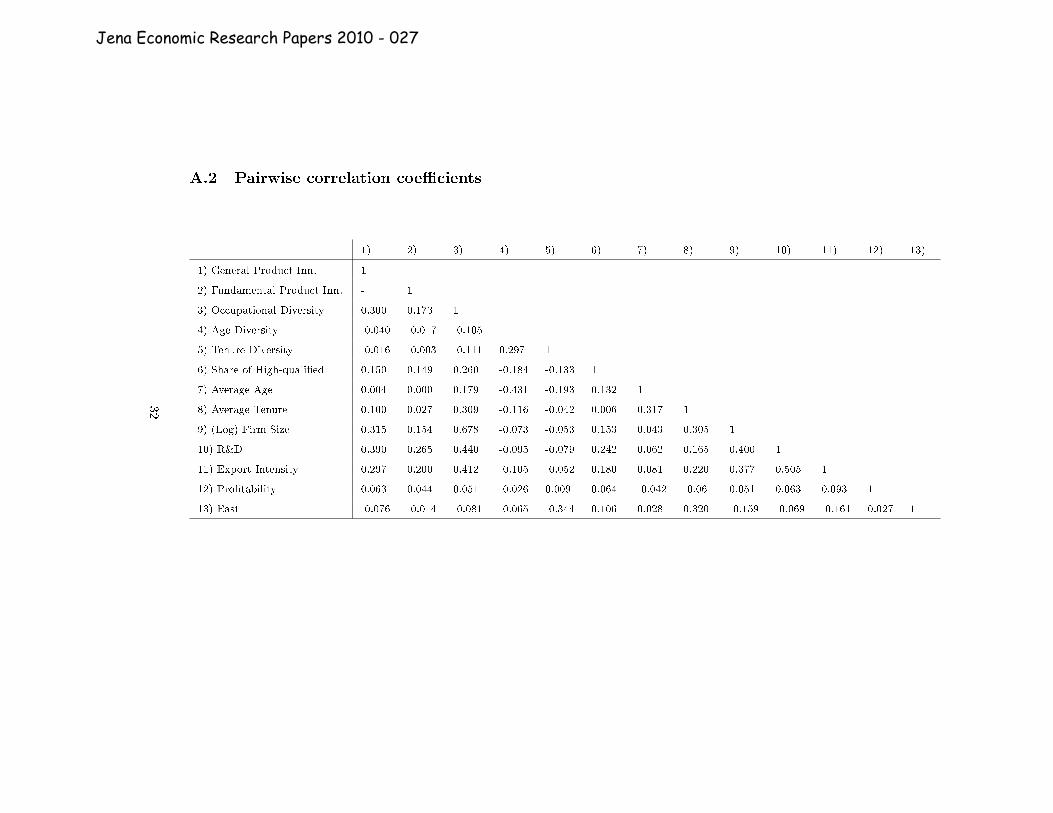
were able to bring a fundamental product innovation to market. Table A.2 in the Ap-
pendix presents pairwise correlation coe�cients. In general, the correlations among
the independent variables indicate that we should not expect problems arising from
multicollinearity. The highest correlation that we observe is between establishment
14
Jena Economic Research Papers 2010 - 027
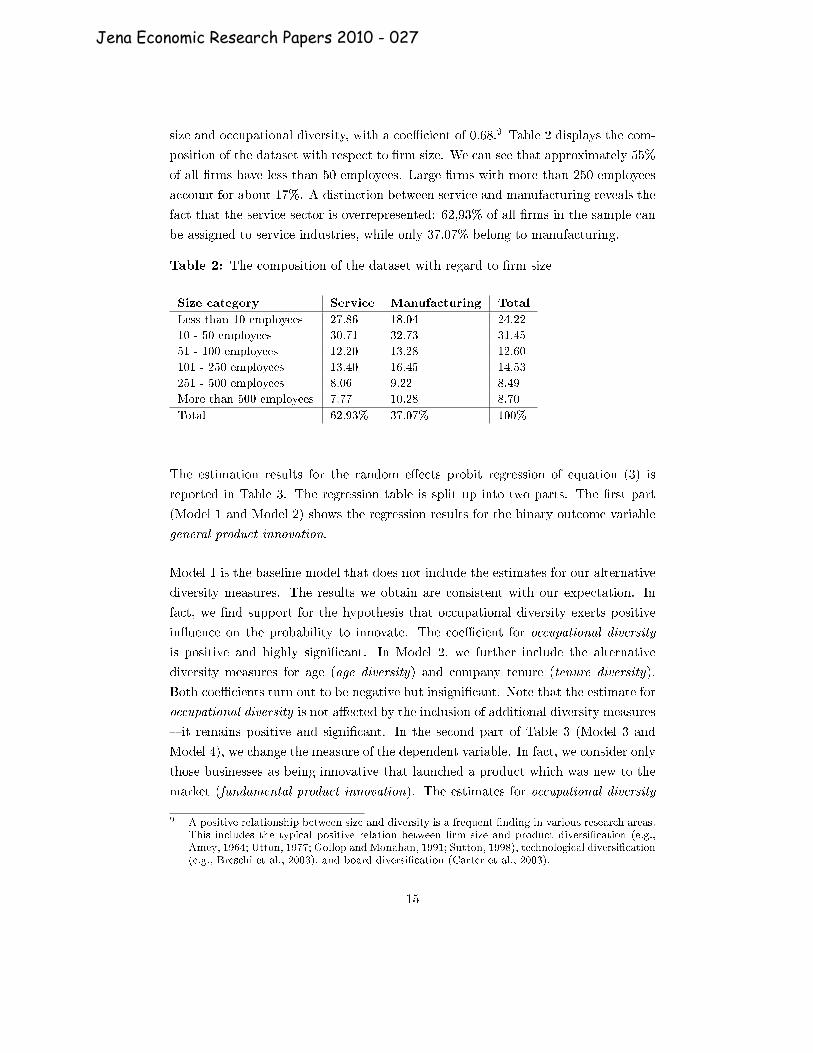
size and occupational diversity, with a coe�cient of 0.68.9 Table 2 displays the com-
position of the dataset with respect to �rm size. We can see that approximately 55%
of all �rms have less than 50 employees. Large �rms with more than 250 employees
account for about 17%. A distinction between service and manufacturing reveals the
fact that the service sector is overrepresented: 62,93% of all �rms in the sample can
be assigned to service industries, while only 37.07% belong to manufacturing.
Table 2: The composition of the dataset with regard to �rm size
Size category Service Manufacturing Total
Less than 10 employees 27.86 18.04 24.22
10 - 50 employees 30.71 32.73 31.45
51 - 100 employees 12.20 13.28 12.60
101 - 250 employees 13.40 16.45 14.53
251 - 500 employees 8.06 9.22 8.49
More than 500 employees 7.77 10.28 8.70
Total 62.93% 37.07% 100%
The estimation results for the random e�ects probit regression of equation (3) is
reported in Table 3. The regression table is split up into two parts. The �rst part
(Model 1 and Model 2) shows the regression results for the binary outcome variable
general product innovation.
Model 1 is the baseline model that does not include the estimates for our alternative
diversity measures. The results we obtain are consistent with our expectation. In
fact, we �nd support for the hypothesis that occupational diversity exerts positive
in�uence on the probability to innovate. The coe�cient for occupational diversity
is positive and highly signi�cant. In Model 2, we further include the alternative
diversity measures for age (age diversity) and company tenure (tenure diversity).
Both coe�cients turn out to be negative but insigni�cant. Note that the estimate for
occupational diversity is not a�ected by the inclusion of additional diversity measures
� it remains positive and signi�cant. In the second part of Table 3 (Model 3 and
Model 4), we change the measure of the dependent variable. In fact, we consider only
those businesses as being innovative that launched a product which was new to the
market (fundamental product innovation). The estimates for occupational diversity
9 A positive relationship between size and diversity is a frequent �nding in various research areas.This includes the typical positive relation between �rm size and product diversi�cation (e.g.,Amey, 1964; Utton, 1977; Gollop and Monahan, 1991; Sutton, 1998), technological diversi�cation(e.g., Breschi et al., 2003), and board diversi�cation (Carter et al., 2003).
15
Jena Economic Research Papers 2010 - 027
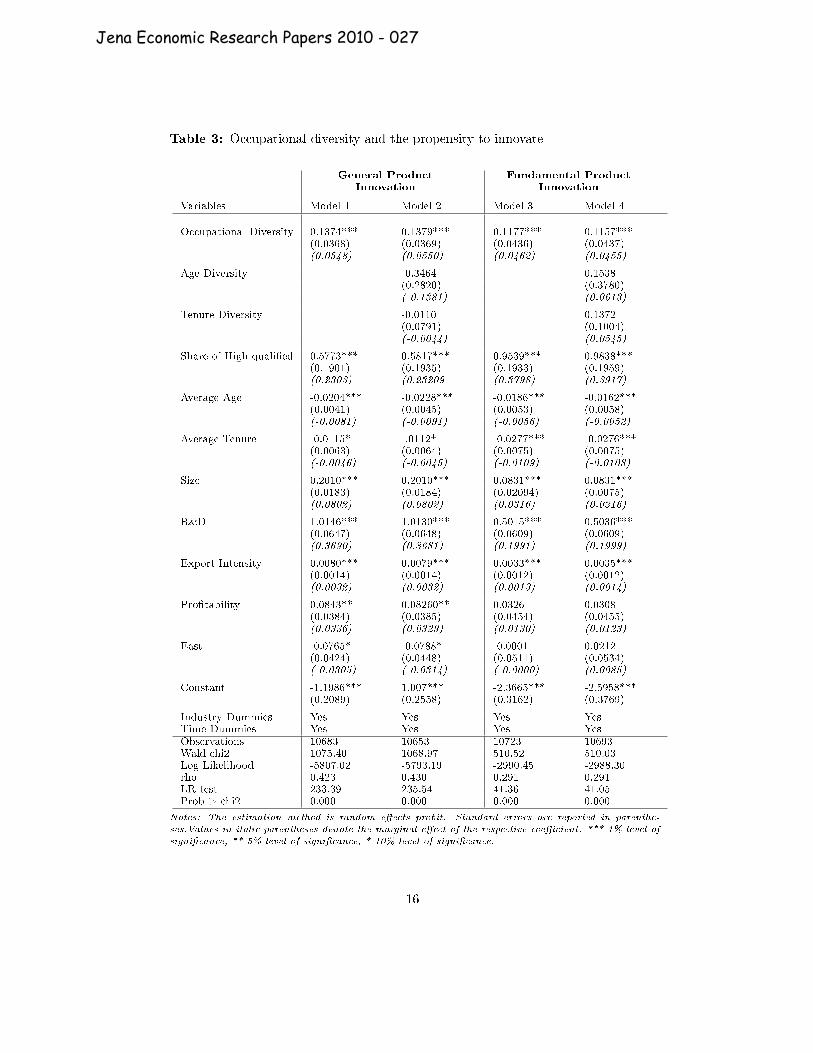
Table 3: Occupational diversity and the propensity to innovate
General ProductInnovation
Fundamental ProductInnovation
Variables Model 1 Model 2 Model 3 Model 4
Occupational Diversity 0.1374*** 0.1379*** 0.1177*** 0.1157***(0.0368) (0.0369) (0.0436) (0.0437)(0.0548) (0.0550) (0.0462) (0.0455)
Age Diversity -0.3464 0.1538(0.2820) (0.3780)(-0.1381) (0.0613)
Tenure Diversity -0.0110 0.1372(0.0791) (0.1004)(-0.0044) (0.0545)
Share of High-quali�ed 0.5773*** 0.5817*** 0.9539*** 0.9838***(0.1901) (0.1935) (0.1933) (0.1959)(0.2303) (0.23209 (0.3798) (0.3917)
Average Age -0.0204*** -0.0228*** -0.0186*** -0.0162***(0.0041) (0.0045) (0.0053) (0.0058)(-0.0081) (-0.0091) (-0.0056) (-0.0052)
Average Tenure -0.0115* -.0112* -0.0277*** -0.0276***(0.0063) (0.0064) (0.0075) (0.0075)(-0.0046) (-0.0045) (-0.0109) (-0.0108)
Size 0.2010*** 0.2010*** 0.0831*** 0.0831***(0.0183) (0.0184) (0.02094) (0.0075)(0.0802) (0.0802) (0.0316) (0.0316)
R&D 1.0146*** 1.0130*** 0.5015*** 0.5036***(0.0647) (0.0648) (0.0609) (0.0609)(0.3690) (0.3681) (0.1991) (0.1999)
Export Intensity 0.0080*** 0.0079*** 0.0033*** 0.0035***(0.0014) (0.0014) (0.0012) (0.0012)(0.0032) (0.0032) (0.0013) (0.0014)
Pro�tability 0.0843** 0.08260** 0.0326 0.0308(0.0384) (0.0385) (0.0454) (0.0455)(0.0336) (0.0329) (0.0130) (0.0123)
East -0.0765* -0.0788* -0.0001 0.0212(0.0424) (0.0448) (0.0511) (0.0534)(-0.0305) (-0.0314) (-0.0000) (0.0085)
Constant -1.1986*** 1.007*** -2.3665*** -2.5958***(0.2089) (0.2558) (0.3162) (0.3769)
Industry Dummies Yes Yes Yes YesTime Dummies Yes Yes Yes YesObservations 10683 10653 10723 10693Wald chi2 1075.40 1068.97 510.52 510.03Log Likelihood -5807.02 -5793.19 -2990.45 -2988.30rho 0.423 0.430 0.291 0.291LR-test 233.39 235.54 41.36 41.05Prob > chi2 0.000 0.000 0.000 0.000
Notes: The estimation method is random e�ects probit. Standard errors are reported in parenthe-
ses.Values in italic parentheses denote the marginal e�ect of the respective coe�cient. *** 1% level of
signi�cance, ** 5% level of signi�cance, * 10% level of signi�cance.
16
Jena Economic Research Papers 2010 - 027
are in line with the previous regressions. We obtain highly signi�cant and positive
coe�cients.10 Compared to Model 2, the coe�cients for age and tenure diversity in
Model 4 change their signs, but still remain insigni�cant. In addition to parameter
estimates, Table 3 displays a number of regression diagnostics. In this respect, the
estimates of rho are of particular interest, since they show the proportion of the
total variance contributed by the panel-level variance component. All estimates of
rho are well above zero. This indicates that the panel-level variance component is
of importance and that a random e�ects probit model provides much more precise
estimates than just a simple cross-sectional probit analysis.
With respect to the control variables, we see that most of the estimated coe�cients
do only slightly change across the model speci�cations (Model 1 to Model 4). The
estimates are fully in line with our expectation. We identify a positive and signi�cant
e�ect for the share of high-quali�ed on the likelihood to innovate. Indeed, a marginal
e�ect of about 0.23 in Model 1 and Model 2 suggests that, on average, a 1% increase
in the share of high-quali�ed workers increases the probability to innovate by 23%.
With a value of 0.38 and 0.39, the marginal e�ect in Model 3 and Model 4 is even
larger. This �nding con�rms the results of a number of other studies (see Rammer
et al., 2005; Dakhli and De Clercq, 2003; among others), and indicates that human
capital is a critical source for innovation. An increasing age of the workforce tends
to slow down innovative activities. The respective coe�cients for average age are
negative and highly signi�cant, which could be interpreted as a sign for the impor-
tance of young professionals with contemporary technical knowledge, and who are
more favorable towards risk-taking than their older counterparts (Bantel and Jack-
son, 1989). However, the marginal e�ects for the estimated coe�cients suggest that
the impact of average age on the likelihood to innovate is rather small.
Average tenure turns out to be negative and signi�cant which could mean that
an older workforce might be more reluctant to changes accompanied by innovative
activities. Alternatively, this �nding could hint to a technological 'lock-in' of the older
workforce to incumbent technologies, preventing the adoption of potentially superior
alternatives. The coe�cients for size are positive and statistically highly signi�cant
across all four models. This result is in accordance with a number of empirical studies
10 We also performed tests for a curvilinear relationship between occupational diversity and in-novation by incorporating squared terms in the estimations. The insigni�cant coe�cients weobtained do not support the existence of a non-linear (e.g., inverted U-shaped ) relationship.We further included interaction e�ects between occupational diversity and the share of high-quali�ed workers, and between occupational diversity and �rm size in the regressions. Again,none of the estimated coe�cients turned out to be signi�cant.
17
Jena Economic Research Papers 2010 - 027
(Dosi, 1988; Acs and Audretsch, 1988, 1991), and could suggest that large �rms have
better capital resources to �nance innovation, and/or a higher potential to acquire
quali�ed labor necessary to facilitate the generation of new ideas. Not surprisingly,
R&D activities (R&D) increase the likelihood of product innovation substantially.
The respective coe�cients are all positive and signi�cant, con�rming the �nding of
studies, which state that R&D activity is a catalyst for innovation (Audretsch, 1995;
Kleinknecht, 1996; Freeman and Soete, 1997).
Also, involvement in international trade (export intensity) seems to be bene�cial for
product innovation. There are, at least, two possible explanations for this result.
Either innovation becomes more and more a necessary element to resist competitive
forces in international markets or, due to learning e�ects from foreign competitors,
exporting businesses are more successful in bringing novel products to the market.
There are slight di�erences with respect to the coe�cients for pro�tability between
the regressions with general product innovation as outcome variable (Model 1 and
Model 2) and the models with fundamental product innovation as the dependent
variable (Model 3 and Model 4). For Model 1 and Model 2, we obtain positive and
signi�cant estimates. The signi�cance, however, vanishes for Model 3 and Model 4.
One interpretation is that economic success and respective �nancial resources are,
in general, useful for innovation, but in order to 'keep with the pace' of competitors
regarding the creation of market novelties, pro�tability does not matter. The coe�-
cients for our variable indicating East German establishments (east) are negative, but
only weakly signi�cant in Model 1 and Model 2. This could indicate that businesses
in East-Germany exhibit a slightly lower tendency to produce product innovation.
Next, we want to present a robustness check for our main result that occupational
diversity is strongly related to the likelihood to innovate. In order to do so, we split
up the dataset into service and manufacturing industries and run separate regres-
sions for both groups. The separation is considered to be important since research
has uncovered crucial di�erences between service and manufacturing with respect
to innovation and product development (Gri�n, 1997; Sirilli and Evangelista, 1998;
Evangelista, 2000; Miles, 2004; Tether, 2003). Detailed results of the analysis are
shown in Table 4.
18
Jena Economic Research Papers 2010 - 027
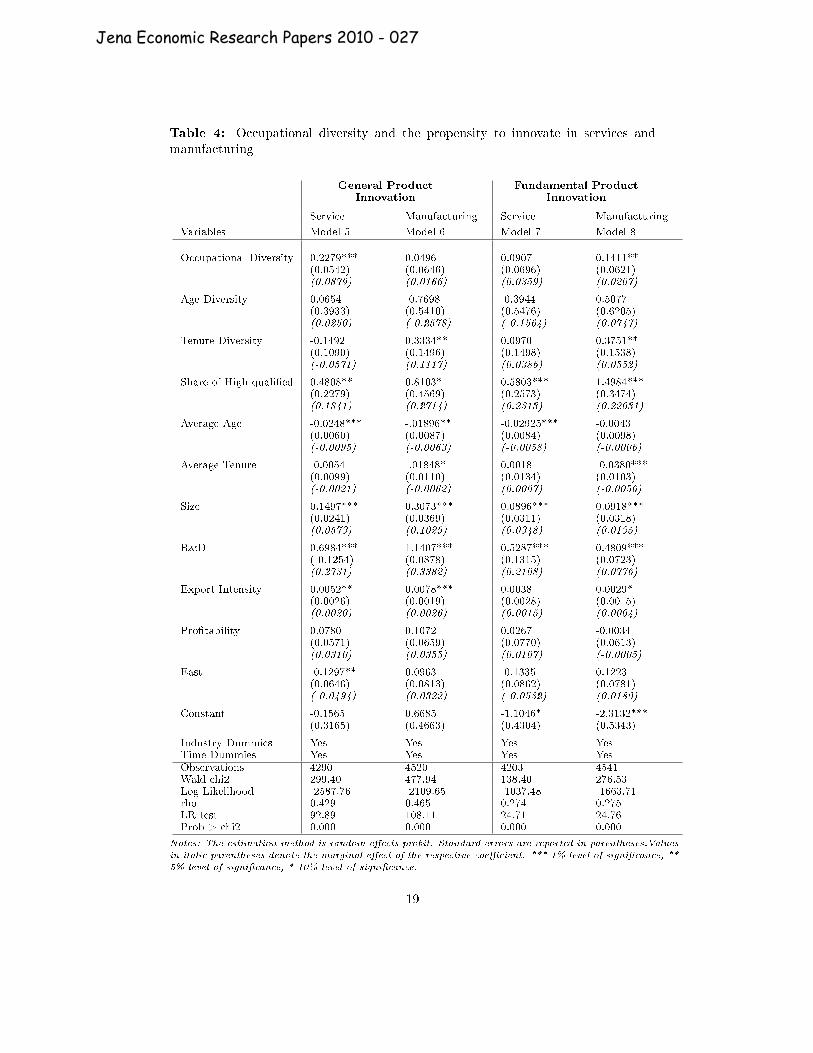
Table 4: Occupational diversity and the propensity to innovate in services andmanufacturing
General ProductInnovation
Fundamental ProductInnovation
Service Manufacturing Service Manufacturing
Variables Model 5 Model 6 Model 7 Model 8
Occupational Diversity 0.2279*** 0.0496 0.0907 0.1411**(0.0542) (0.0646) (0.0696) (0.0621)(0.0879) (0.0166) (0.0359) (0.0207)
Age Diversity 0.0654 -0.7698 -0.3944 0.5077(0.3933) (0.5410) (0.5476) (0.6205)(0.0250) (-0.2578) (-0.1564) (0.0747)
Tenure Diversity -0.1492 0.3334** 0.0970 0.3751**(0.1090) (0.1496) (0.1498) (0.1538)(-0.0571) (0.1117) (0.0386) (0.0552)
Share of High-quali�ed 0.4808** 0.8103* 0.5803*** 1.4984***(0.2279) (0.4569) (0.2573) (0.3474)(0.1841) (0.2714) (0.2313) (0.22031)
Average Age -0.0248*** -.01896** -0.02925*** -0.0043(0.0060) (0.0087) (0.0084) (0.0098)(-0.0095) (-0.0063) (-0.0058) (-0.0006)
Average Tenure -0.0054 -.01848* 0.0018 -0.0380***(0.0099) (0.0110) (0.0134) (0.0103)(-0.0021) (-0.0062) (0.0007) (-0.0056)
Size 0.1497*** 0.3073*** 0.0896*** 0.0918***(0.0241) (0.0369) (0.0311) (0.0318)(0.0573) (0.1029) (0.0348) (0.0135)
R&D 0.6984*** 1.1407*** 0.5287*** 0.4809***( 0.1254) (0.0878) (0.1315) (0.0723)(0.2731) (0.3382) (0.2108) (0.0776)
Export Intensity 0.0052** 0.0078*** 0.0038 0.0029*(0.0026) (0.0019) (0.0028) (0.0015)(0.0020) (0.0026) (0.0015) (0.0004)
Pro�tability 0.0780 0.1072 0.0267 -0.0034(0.0571) (0.0659) (0.0770) (0.0613)(0.0310) (0.0355) (0.0107) (-0.0005)
East -0.1297** 0.0963 -0.1335 0.1223(0.0646) (0.0813) (0.0862) (0.0781)(-0.0494) (0.0322) (-0.0532) (0.0180)
Constant -0.1565 0.6685 -1.1046* -2.3132***(0.3165) (0.4663) (0.4304) (0.5343)
Industry Dummies Yes Yes Yes YesTime Dummies Yes Yes Yes YesObservations 4290 4520 4203 4541Wald chi2 299.40 477.94 138.40 276.53Log Likelihood -2587.76 -2109.65 -1037.48 -1663.71rho 0.429 0.465 0.274 0.275LR-test 92.89 108.11 24.71 24.76Prob > chi2 0.000 0.000 0.000 0.000
Notes: The estimation method is random e�ects probit. Standard errors are reported in parentheses.Values
in italic parentheses denote the marginal e�ect of the respective coe�cient. *** 1% level of signi�cance, **
5% level of signi�cance, * 10% level of signi�cance.
19
Jena Economic Research Papers 2010 - 027
In general, Table 4 con�rms the �ndings of the previous regressions. Model 5 just
mirrors the results of Table 3. For businesses in the service sector, we �nd a positive
and signi�cant e�ect of occupational diversity on the propensity to innovate. Other
types of diversity seem to be of minor importance. All other control variables keep
their signs, but some such as pro�tability and average tenure lose in statistical sig-
ni�cance. If we have a look at manufacturing (Model 6), we see that occupational
diversity in not longer signi�cant. This result is puzzling and certainly deserves
further investigation. Actually, we expected to �nd a positive relationship between
human capital diversity and innovation in manufacturing. Instead, a positive and
signi�cant coe�cient for the heterogeneity of employees in terms of their company
tenure (tenure diversity) is observed. High tenure diversity suggests that employ-
ees entered an establishment at di�erent points in time. As a consequence, people
may not share the same social network within the organization (Chi et al., 2009).
As knowledge, experiences, and perspectives in the same social network are often
similar and redundant (Granovetter, 1973), a workforce with high levels of tenure
diversity is more likely to possess distinct and non-redundant perspectives. This can
lead to more innovative ideas and solutions (De Dreu and West, 2001), which facil-
itate the generation of innovation. We now shift the attention towards the e�ects
of workforce heterogeneity on the likelihood of generating market novelties (Model
7 and Model 8). Regarding service businesses (Model 7), we do not observe any
signi�cant impact of diversity: neither occupational nor age or tenure diversity seem
to facilitate the creation of fundamental product innovation. The picture is changing
if we pay attention to businesses in manufacturing industries (Model 8). The posi-
tive and signi�cant estimates for occupational diversity and tenure diversity imply a
positive e�ect of workforce diversity on new product development. The absence of
a signi�cant e�ect of human capital diversity (occupational diversity) on fundamen-
tal product innovation (Model 7) might be partly due to peculiarities of innovative
processes in service industries. In contrast to manufacturing, innovation in services
less often results from internal knowledge generating activities (Sheehan, 2006), and
has an incremental nature (Djellal and Gallouj, 2001). Furthermore, innovation in
service industries is largely dependent upon adopting externally developed technolo-
gies that enhance e�ciency (Tether, 2003). The minor importance of fundamental
product innovation and the reliance on external sources for innovation support the
insigni�cant e�ect of our human capital diversity measure in Model 7. This does
not mean that human capital diversity does not matter in services at all. A cer-
tain amount of innovative activities in service �rms are oriented to the adaptation of
services to the wide range of users' needs (Hipp and Grupp, 2005). Diverse human
20
Jena Economic Research Papers 2010 - 027
capital resources certainly constitute a crucial asset for this interactive and complex
activity, and would explain why a positive and signi�cant impact of occupational
diversity on general product innovation in Model 5 is observed.
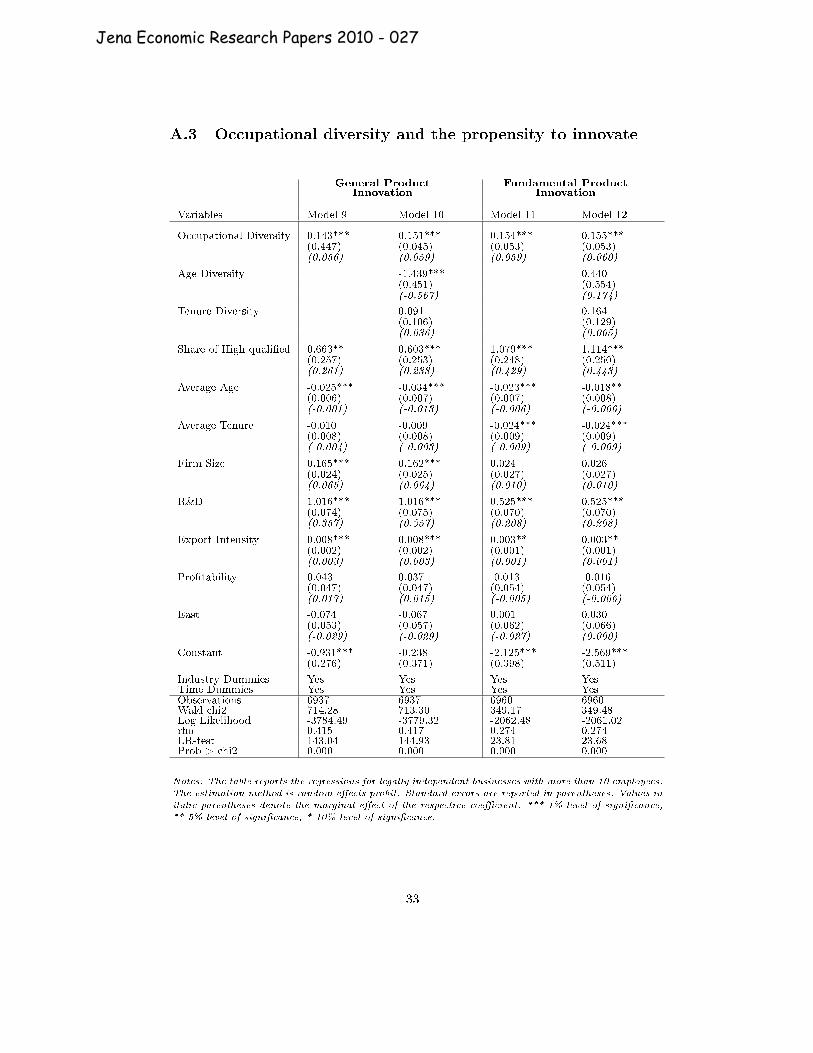
In Table A.3 of the Appendix, we o�er a further robustness check. So far, the
econometric model was estimated for the entire sample of establishments and sep-
arately for sub-samples of businesses in service and manufacturing industries. In
Table A.3 of the Appendix, the random e�ects probit estimation is performed after
the exclusion of subsidiaries and establishments with fewer than 10 employees. The
remaining sample now encompasses only larger businesses, which can be regarded as
legally independent entities. Regression Table A.3 does not reveal systematic di�er-
ences compared to Table 3. The estimated coe�cients for occupational diversity are
positive and signi�cant across all model speci�cations (Model 9 to Model 12). Inter-
estingly, we obtain a negative and signi�cant coe�cient for age diversity with regard
to the binary outcome variable general product innovation (Model 10). According
to Zajac et al. (1991), this �nding might be due to a greater con�ict potential and
less social cohesion in an age diverse workforce that negatively impinges on innova-
tion. Note, however, that a negative relation between age diversity and innovation is
not present in Model 12, where the interest is set to the generation of fundamental
product innovation. With respect to tenure diversity, we do not �nd any signi�cant
e�ect on innovation. The coe�cient in both Model 10 and Model 12 is positive but
insigni�cant. Compared to regression Table 3, the estimates of the control variables
yield only minor changes. Most notably is the positive but insigni�cant coe�cient
for size (Model 13 and Model 14) which was highly signi�cant before (see Table 3).
Also average tenure partly turns out to be insigni�cant (Model 11 and Model 12).
This, however, is not too surprising, since the respective estimates were only weakly
signi�cant in the regressions based on the entire sample of establishments. In a nut-
shell, the results of the robustness checks are consistent with the previous �ndings,
suggesting that links between occupational diversity and product innovation found
above are well-grounded.
5 Conclusions
The aim of the study was to analyze the relationship between occupational diver-
sity and the propensity to innovate. As innovation is an interactive process, which
21
Jena Economic Research Papers 2010 - 027
requires the combination of diverse knowledge bases and di�erent points of views,
occupational diversity (human capital diversity) among employees should positively
a�ect the generation of innovation in a �rm. The empirical analysis of this paper
has indeed shown that occupational diversity is positively related to the propensity
to innovate. Besides occupational diversity, we also incorporated other types of di-
versity measures in our framework. It turned out that a greater heterogeneity of
the workforce with regard to work experience can also be bene�cial for innovation.
Note that this result could only be observed for businesses in manufacturing indus-
tries. On the basis of our �ndings, we can derive an important implication for �rms.
Our results suggest that companies implementing workforce diversity policies may
gain a long-term competitive advantage, which arises from an increased likelihood to
innovate.
However, at the present stage of analysis, the �ndings of this paper should cautiously
be interpreted. One open question for discussion is whether a positive association
between occupational diversity and innovation can be identi�ed as a causal e�ect. We
cannot per se exclude reverse causality, since successful innovation may enable �rms
to acquire a more diverse workforce. One of the major tasks on the research agenda
will therefore be to reveal a causal relationship between occupational diversity and
innovation.
Acknowledgements
We would like to thank Florian Noseleit and Viktor Slavtchev for their helpful comments and sug-
gestions. The �nancial support by the German Science Foundation (DFG) is highly acknowledged.
22
Jena Economic Research Papers 2010 - 027
References
Acs, J. Z. and Audretsch, D. B. (1991), Innovation and Technological Change: An
International Comparison, University of Michigan Press, Ann Arbor.
Acs, Z. J. and Audretsch, D. B. (1988), `Innovation in large and small �rms: An
empirical analysis', American Economic Review 78, 678�690.
Alda, H., Bender, S. and Gartner, H. (2005), `The linked employer-employee dataset
of the IAB (LIAB)', IAB Discussion Paper No. 200506, Institute for Employment
Research, Nuremberg, Germany.
Allison, P. D. (1978), `Measures of inequality', American Sociological Review 43, 865�
880.
Amey, L. R. (1964), `Diversi�ed manufacturing business', Journal of the Royal Sta-
tistical Society 127, 251�290.
Ancona, D. and Caldwell, F. F. (1992), `Demography and design: Predictors of new
product team performance', Organization Science 3, 321�341.
Audretsch, D. B. (1995), Innovation and Industry Evolution, MIT Press, Cambridge,
MA.
Bantel, K. and Jackson, S. (1989), `Top management and innovations in banking:
Does the composition of the top team make a di�erence', Strategic Management
Journal 10, 107�124.
Barney, J. B. (1986), `Strategic factor markets', Management Science 32, 1231�1241.
Barney, J. B. (1991), `Firm resources and sustained competitive advantage', Journal
of Management 17, 99�129.
Bartel, A. (1989), `Formal employee training programs and their impact on labor
productivity: Evidence from a human resource survey', NBER Working Papers
No. 3026, National Bureau of Econimic Research.
Bartel, A. P. and Sicherman, N. (1998), `Technological change and the skill acquisi-
tion of young workers', Journal of Labor Economics 16, 718�755.
Black, S. E. and Lynch, L. M. (1996), `Human-capital investments and productivity',
American Economic Review 86, 263�267.
23
Jena Economic Research Papers 2010 - 027
Breschi, S., Lissoni, F. and Malerba, F. (2003), `Knowledge-relatedness in �rm tech-
nological diversi�cation', Research Policy 32, 69�87.
Carter, D. A., Simkins, B. J. and Simpson, W. G. (2003), `Corporate governance,
board diversity, and �rm value', The Financial Review 38, 33�53.
Chi, N., Huang, Y. and Lin, S. (2009), `A double-edged sword? Exploring the curvi-
linear relationship between organizational tenure diversity and team innovation:
The moderating role of team-oriented HR practices', Group and Organization Man-
agement 34, 698�726.
Cohen, W. M. and Levinthal, D. A. (1989), `Innovation and learning: The two faces
of R&D', Economic Journal 99, 569�596.
Cohen, W. M. and Levinthal, D. A. (1990), `Absorptive capacity: A new perspective
on learning and innovation', Administrative Science Quarterly 35, 128�152.
Cox, T. H. and Blake, S. (1991), `Managing cultural diversity: Implications for
organizational competitiveness', The Executive 5, 45�56.
Dakhli, M. and De Clercq, D. (2003), `Human capital, social capital, and innovation:
A multi country study', Vlerick Leuven Gent Working Paper 2003/18.
De Dreu, C. K. W. and West, M. A. (2001), `Minority dissent and team innovation:
The importance of team participation in decision making', Journal of Applied
Psychology 86, 1191�1201.
Djellal, F. and Gallouj, F. (2001), `Patterns of innovation organisation in service
�rms: Postal survey results and theoretical models', Science and Public Policy
28, 57�67.
Dosi, G. (1982), `Technological paradigms and technological trajectories: A suggested
interpretation of the determinants and directions of technical change', Research
Policy 11, 147�162.
Dosi, G. (1988), `Sources, procedures, and microeconomic e�ects of innovation', Jour-
nal of Economic Literature 26, 1120�1171.
Drach-Zahavy, A. and Somech, A. (2001), `Understanding team innovation: The
role of team processes and structures', Group Dynamics: Theory, Research, and
Practice 5, 111�123.
24
Jena Economic Research Papers 2010 - 027
Evangelista, R. (2000), `Sectoral patterns of technological change in services', Eco-
nomics of Innovation and New Technology 9, 183�221.
Freeman, C. and Soete, L. (1997), The Economics of Industrial Innovation, MIT
Press, Cambridge, MA.
Giuri, P., Hagedoorn, J. and Mariani, M. (2002), `Technological diversi�cation and
strategic alliances', LEM Working Paper No. 2002/04, Sant'Anna School of Ad-
vanced Studies, Pisa.
Gollop, F. M. and Monahan, J. L. (1991), `A generalized index of diversi�cation:
Trends in U.S. manufacturing', The Review of Economics and Statistics 73, 318�
330.
Granovetter, M. S. (1973), `The strength of weak ties', American Journal of Sociology
78, 1360�1380.
Granstrand, O. (1996), `Towards a theory of technology-based �rm', Research Policy
27, 465�489.
Grant, R. M. (1996), `Towards a knowledge-based theory of the �rm', Strategic Man-
agement Journal 17, 109�122.
Gri�n, A. (1997), `PDMA research on new product development practices: Updating
trends and benchmarking best practice', Journal of Product Innovation Develop-
ment 14, 427�458.
Hambrick, D. C., Cho, T. S. and Chen, M. (1996), `The in�uence of top-management
team heterogeneity on �rms' competitive moves', Administrative Science Quarterly
41, 659�684.
Hambrick, D. C. and Mason, P. A. (1984), `Upper echelons: The organization as a
re�ection of its top managers', Academy of Management Review 9, 193�206.
Harrison, D. A. and Sin, D. J. (2006), What is diversity and how should it be mea-
sured?, in A. M. Konrad, P. Prasad and J. K. Pringle, eds, `Handbook of Work
Place Diversity', SAGE Publications, London, pp. 191�216.
Hausman, J., Hall, B. H. and Griliches, Z. (1984), `Research on new economet-
ric models for count data with an application to the patents-R&D relationship',
Econometrica 52, 909�938.
25
Jena Economic Research Papers 2010 - 027
Heckman, J. J. (1981), The incidental parameters problem and the problem of initial
conditions in estimating a discrete time-discrete data stochastic process, in C. F.
Manski and D. McFadden, eds, `Structural Analysis of Discrete Panel Data with
Econometric Applications', MIT Press, Cambridge, pp. 179�195.
Hipp, C. and Grupp, H. (2005), `Innovation in the service sector: The demand for
service-speci�c innovation measurement concepts and typologies', Research Policy
34, 517�535.
Hitt, M. A., Bierman, L., Shimizu, K. and Kochar, R. (2001), `Direct and moderating
e�ects of of human capital on strategy and performance in professional service
�rms: A resource-based perspective', Academy of Management Journal 44, 13�28.
Holmstrom, B. (1989), `Agency costs and innovation', Journal of Economic Behavior
& Organization 12, 305�327.
Horwitz, S. K. (2005), `The compositional impact of team diversity on performance:
Theoretical considerations', Human Resource Development Review 4, 219�245.
Howell, D. R. and Wol�, E. N. (1991), `Trends in the growth and distribution of
skills in the U.S. workplace, 1960-1985', Industrial and Labor Relations Review
44, 486�502.
Iranzo, S., Schivardi, F. and Tosetti, E. (2008), `Skill dispersion and �rm produc-
tivity: An analysis with employer-employee matched data', Journal of Labor Eco-
nomics 26, 247�285.
Jianakoplos, N. A. and Bernasek, A. (2006), `Financial risk taking by age and birth
cohort', Southern Economic Journal 72, 981�100.
Katz, R. (1982), `The e�ects of group longevity on project communication and per-
formance', Administrative Science Quarterly 27, 81�104.
Kildu�, M., Angelmar, R. and Mehra, A. (2000), `Top-management team hetero-
geneity and performance: The role of cognitions', Organization Science 11, 21�34.
Kleinknecht, A. (1996), Determinants of Innovation, Macmillan Press, London.
Laursen, K., Mahnke, V. and Vejrup-Hansen, P. (2005), `Do di�erences make a
di�erence? The impact of human capital diversity, experience and compensation
on �rm performance in engineering consulting', DRUID Working Paper No. 05-04.
26
Jena Economic Research Papers 2010 - 027
Lundvall, B. A. (1988), Innovation as an interactive process: From user-producer
interaction to the national system of innovation, in G. Dosi, C. Freeman, R. R.
Nelson, G. Silverberg and L. Soete, eds, `Technical Change and Economic Theory',
Pinter Publishers, London, pp. 349�369.
Maimunah, I. and Lawrence, A. (2008), `Workforce diversity: A human resource
development perspective towards organizational performance', European Journal
of Social Sciences 6, 244�225.
Merton, R. K., Reader, G. G. and Kendall, P. L. (1957), The Student-Physician:
Introductory Studies in the Sociology of Medical Education, Harvard University
Press, Cambridge, MA.
Miles, I. (2004), Innovation in services, in J. Fagerberg, D. C. Mowery and R. R. Nel-
son, eds, `The Handbook of Innovation', Oxford University Press, Oxford, pp. 433�
458.
Milliken, F. J. and Martins, L. L. (1996), `Searching for common threads: Under-
standing the multiple e�ects of diversity in organizational groups', Academy of
Management Review 21, 402�433.
Murray, A. I. (1989), `Top management team heterogeneity and �rm performance',
Strategic Management Journal 10, 125�141.
Nelson, R. R. (1959), `The simple economics of basic scienti�c research', Journal of
Political Economy 67, 297�306.
Nelson, R. R. and Phelps, E. (1966), `Investment in humans, technological di�usion,
and economic growth', American Economic Review 56, 69�75.
Nelson, R. R. and Winter, S. G. (1982), An Evolutionary Theory of Economic
Change, Harvard University Press, Cambridge, MA.
Nemeth, C. J. (1986), `Di�erential contributions of majority and minority in�uence',
Psychological Review 93, 23�32.
O'Reilly, C. A., Caldwell, D. F. and Barnett, W. P. (1989), `Work group demography,
social integration, and turnover', Administrative Science Quarterly 34, 21�37.
Ostergaard, C. R., Timmermanns, B. and Kristinsson, K. (2009), `Beyond techno-
logical diversi�cation: The impact of employee diversity on innovation', DRUID
Working Paper No. 09-03.
27
Jena Economic Research Papers 2010 - 027
Pakes, A. and Grilliches, Z. (1980), `Patents and R&D at the �rm level: A �rst
report', Economic Letters 5, 377�381.
Pelled, L. H., Eisenhardt, K. and Xin, K. (1999), `Exploring the black box: An
analysis of work group diversity, con�ict, and performance', Administrative Science
Quarterly 44, 1�28.
Pennings, J., Lee, K. and v. Witteloostuijn, A. (1998), `Human capital, social capital,
and �rm dissolution', Academy of Management Journal 41, 425�440.
Penrose, E. T. (1959), The Theory of the Growth of the Firm, Oxford University
Press, Oxford.
Peteraf, M. A. (1993), `The cornerstones of competitive advantage: A resource-based
view', Strategic Management Journal 14, 179�191.
Pitcher, P. and Smith, A. (2001), `Top management team heterogeneity: Personality,
power, and proxies', Organization Science 12, 1�18.
Prais, S. (1995), Productivity, Education and Training: An International Perspective,
Cambridge University Press, UK.
Quintana-Garcia, C. and Benavides-Velasco, C. A. (2008), `Innovative competence,
exploration and exploitation: The in�uence of technological diversi�cation', Re-
search Policy 37, 492�507.
Rammer, C., Peters, B., Schmidt, T., Aschho�, B., Doherr, T. and Niggemann, H.
(2005), Innovationen in Deutschland: Ergebnisse der Innovationserhebung in der
deutschen Wirtschaft, Nomos-Verlagsgesellschaft, Baden-Baden.
Richard, O. C. (2000), `Racial diversity, business strategy, and �rm performance: A
resource-based view', The Academy of Management Journal 43, 164�177.
Rumelt, R. P. (1984), Towards a strategic theory of the �rm, in R. B. Lamb, ed.,
`Competitive Strategic Management', Prentice Hall, Englewood Cli�s, NJ, pp. 556�
570.
Schumpeter, J. A. (1942), Capitalism, Socialism and Democracy, George Allen and
Unwin, London.
Senker, P. and Brady, T. (1989), Corporate strategy: Skills, education and training,
in M. Dodgson, ed., `Technology Strategy and the Firm: Management and Public
Policy', SPRU Publication, Longman, pp. 155�169.
28
Jena Economic Research Papers 2010 - 027
Shannon, C. E. (1948), `A mathematical theory of communication', Bell System
Technical Journal 27, 623�656.
Shaw, M. E. (1976), Dynamics: The Psychologyof Small Group Behavior, McGraw-
Hill, New York.
Sheehan, J. (2006), `Understanding service sector innovation', Communications of
the ACM 49, 42�47.
Shrivastava, P. and Souder, W. (1985), Phase transfer models for technological in-
novation, in R. B. Lamp, ed., `Advances in Strategic Management', JAI Press,
Greenwich, pp. 135�147.
Sirilli, G. and Evangelista, R. (1998), `Technological innovation in services and man-
ufacturing: Results from Italian surveys', Research Policy 27, 881�899.
Smith, K. G., Smith, K. A., Olian, J. D., Sims, H. P., O'Bannon, D. P. and Scully,
J. (1994), `Top management team demography and process: The role of social
integration and communication', Administrative Science Quarterly 39, 412�438.
Staw, B. M. and Ross, J. (1980), `Commitment in an experimenting society: A study
of the attribution of leadership from administrative scenarios', Journal of Applied
Psychology 65, 249�260.
Stevens, J. M., Beyer, J. M. and Trice, H. M. (1978), `Assessing personal role, and
organizational predictors of managerial commitment', Academy of Management
Journal 21, 380�396.
Sutton, J. (1998), Technology and Market Structure, MIT Press, Cambridge, MA.
Suzuki, J. and Kodama, F. (2004), `Technological diversity of persistent innovators
in Japan: Two case studies of large Japanese �rms', Research Policy 33, 531�549.
Tether, B. (2003), `The sources and aims of innovation in services: Variety between
and within sectors', Economics of Innovation and New Technology 12, 481�505.
Tuckman, B. W. (1965), `Developmental sequence in small groups', Psychological
Bulletin 63, 384�399.
Utton, M. A. (1977), `Large �rm diversi�cation in British manufacturing industry',
The Economic Journal 87, 96�113.
Van der Vegt, G. and Janssen, O. (2003), `Joint impact of interdependence and group
diversity on innovation', Journal of Management 29, 729�751.
29
Jena Economic Research Papers 2010 - 027
Wagner, G. W., Pfe�er, J. and O'Reilly, C. A. (1984), `Organizational demogra-
phy and turnover in top-management groups', Administrative Science Quarterly
29, 74�92.
Wanous, J. P. and Youtz, M. A. (1986), `Solution diversity and the quality of group
decisions', Academy of Management Journal 29, 149�158.
Watson, E., Kumar, K. and Michaelsen, L. (1993), `Cultural diversity's impact on
interaction process and performance: Comparing homogeneity and diverse task
groups', Academy of Management Journal 36, 590�603.
Welch, F. (1970), `Education in production', Journal of Political Economy 78, 35�59.
Wernerfelt, B. (1984), `A resource-based view of the �rm', Strategic Management
Journal 5, 171�180.
Wiersema, M. F. and Bantel, K. A. (1992), `Top management team demography and
corporate strategic change', Academy of Management Journal 35, 91�121.
Williams, K. and O'Reilly (1998), Demography and diversity in organizations: A
review of 40 years of research, in B. Staw and L. Cummings, eds, `Research in
Organizational Behavior', JAI Press, Greenwich, pp. 77�140.
Woodman, R. W., Gri�n, R. W. and Sawyer, J. E. (1993), `Toward a theory of
organizational creativity', Academy of Management Review 18, 293�321.
Zajac, E. J., Golden, B. R. and Shortell, S. M. (1991), `New organizational forms for
enhancing innovation: The case of internal corporate joint ventures', Management
Science 37, 170�184.
30
Jena Economic Research Papers 2010 - 027
A Appendix
A.1 Summary statistics of employed variables
Mean Std. Dev. Min Max
General Product Innovation 0.488 0.500 0 1
Fundamental Product Innovation 0.105 0.307 0 1
Occupational Diversity 1.507 0.803 0 3.905
Age Diversity 0.279 0.075 0 0.736
Tenure Diversity 0.646 0.263 0 2.831
Share of High-quali�ed 0.064 0.119 0 1
Average Age 40.310 5.081 19.5 63
Average Tenure 6.521 3.653 0.211 22.158
(Log) Firm Size 3.747 1.574 0.693 10.827
R&D 0.197 0.398 0 1
Export Intensity (in percent) 8.548 19.173 0 100
Pro�tability 0.326 0.469 0 1
East 0.451 0.498 0 1
31
Jena Economic Research Papers 2010 - 027
A.2 Pairwise correlation coe�cients
1) 2) 3) 4) 5) 6) 7) 8) 9) 10) 11) 12) 13)
1) General Product Inn. 1
2) Fundamental Product Inn. - 1
3) Occupational Diversity 0.300 0.173 1
4) Age Diversity -0.040 -0.017 -0.105 1
5) Tenure Diversity -0.016 -0.003 -0.111 0.297 1
6) Share of High-quali�ed 0.150 0.149 0.260 -0.184 -0.133 1
7) Average Age 0.004 0.000 0.179 -0.431 -0.193 0.132 1
8) Average Tenure 0.100 0.027 0.309 -0.116 -0.042 0.006 0.317 1
9) (Log) Firm Size 0.315 0.154 0.678 -0.073 -0.053 0.153 0.043 0.305 1
10) R&D 0.390 0.265 0.440 -0.095 -0.079 0.242 0.062 0.165 0.400 1
11) Export Intensity 0.297 0.200 0.412 -0.105 -0.052 0.180 0.081 0.220 0.377 0.505 1
12) Pro�tability 0.063 0.044 0.051 -0.026 0.009 0.064 -0.042 -0.061 0.051 0.063 0.093 1
13) East -0.076 -0.014 -0.081 -0.065 -0.344 0.106 0.028 0.320 -0.159 -0.069 -0.161 0.027 1
32
Jena Economic Research Papers 2010 - 027
A.3 Occupational diversity and the propensity to innovate
General ProductInnovation
Fundamental ProductInnovation
Variables Model 9 Model 10 Model 11 Model 12
Occupational Diversity 0.143*** 0.151*** 0.154*** 0.155***(0.447) (0.045) (0.053) (0.053)(0.056) (0.059) (0.059) (0.060)
Age Diversity -1.439*** 0.440(0.451) (0.554)(-0.567) (0.174)
Tenure Diversity 0.091 0.164(0.106) (0.129)(0.036) (0.065)
Share of High-quali�ed 0.663** 0.603*** 1.079*** 1.114***(0.257) (0.253) (0.248) (0.250)(0.261) (0.238) (0.429) (0.443)
Average Age -0.025*** -0.034*** -0.023*** -0.018**(0.006) (0.007) (0.007) (0.008)(-0.001) (-0.013) (-0.006) (-0.006)
Average Tenure -0.010 -0.009 -0.024*** -0.024***(0.008) (0.008) (0.009) (0.009)(-0.004) (-0.003) (-0.009) (-0.009)
Firm Size 0.165*** 0.162*** 0.024 0.026(0.024) (0.025) (0.027) (0.027)(0.065) (0.064) (0.010) (0.010)
R&D 1.016*** 1.016*** 0.525*** 0.525***(0.074) (0.075) (0.070) (0.070)(0.357) (0.357) (0.208) (0.208)
Export Intensity 0.008*** 0.008*** 0.003** 0.003**(0.002) (0.002) (0.001) (0.001)(0.003) (0.003) (0.001) (0.001)
Pro�tability 0.043 0.037 -0.013 -0.016(0.047) (0.047) (0.054) (0.054)(0.017) (0.015) (-0.005) (-0.006)
East -0.074 -0.067 0.001 0.030(0.053) (0.057) (0.062) (0.066)(-0.029) (-0.029) (-0.027) (0.000)
Constant -0.931*** -0.238 -2.125*** -2.569***(0.276) (0.371) (0.398) (0.511)
Industry Dummies Yes Yes Yes YesTime Dummies Yes Yes Yes YesObservations 6937 6937 6960 6960Wald chi2 714.28 713.30 349.17 349.48Log Likelihood -3784.49 -3779.32 -2062.48 -2061.02rho 0.415 0.417 0.274 0.274LR-test 143.04 144.93 23.81 23.68Prob > chi2 0.000 0.000 0.000 0.000
Notes: The table reports the regressions for legally independent businesses with more than 10 employees.
The estimation method is random e�ects probit. Standard errors are reported in parentheses. Values in
italic parentheses denote the marginal e�ect of the respective coe�cient. *** 1% level of signi�cance,
** 5% level of signi�cance, * 10% level of signi�cance.
33
Jena Economic Research Papers 2010 - 027