Embed Size (px)
Citation preview
HUMAN CAPITAL AND INNOVATION IN DEVELOPING COUNTRIES: A FIRM LEVEL STUDY
Annelies van Uden, Joris Knoben, Patrick Vermeulen
Creating knowledge for societyNijmegen, August 2014
STRAT14-01
Working paper

HUMAN CAPITAL AND INNOVATION IN DEVELOPING COUNTRIES: A FIRM LEVEL STUDY
Annelies van Uden1 [email protected]
Joris Knoben
Patrick Vermeulen
Radboud University Nijmegen Institute for Management Research
P.O. Box 9108 6500 HK Nijmegen
The Netherlands
---WORKING PAPER JUNE 2014---
This is a working paper from the Co-ordinated Country Case Studies: Innovation and
Growth, Raising Productivity in Developing Countries research programme, funded by the
UK’s Department for International Development (DFID).
1 Please send all comments to the first author.

HUMAN CAPITAL AND INNOVATION IN DEVELOPING COUNTRIES: A FIRM LEVEL STUDY
ABSTRACT
In this paper we examine whether human capital endowments of firms and additional practices of
firms, such as formal training and employee slack time, have a positive relation with the innovative
output of firms. This paper contributes to the literature on factors that influence innovation at the firm
level and the literature about human capital and innovation at the national level. Furthermore, we
study this relation in developing countries, while most studies about innovation have been done in
developed countries. We empirically tested this relation in Kenya, Tanzania and Uganda with data
stemming from the Enterprise Surveys of the World Bank. Our results show a positive relation
between human capital and innovation. The role of practices of firms such as offering formal training
and employee slack time in particular are conducive for innovative output. These findings have
important implications for policy makers and managers within developing countries.
INTRODUCTION
Innovation is widely believed to be a key factor for economic growth (Schumpeter, 1934;
Solow, 1956), especially in developing countries (Crespi & Zuniga, 2011; Lee & Kang, 2007; Robson,
et al., 2009). It is therefore crucially important to understand the determinants of innovation at the
country level, but also at the level at which innovations are developed, namely the firm. Studies at the
national level highlight, among other factors, human capital as a driving force for innovation (e.g.
Dakhli & De Clercq, 2004). At the firm level, however, this determinant of innovation has received
scarce attention (Schneider et al., 2010). Instead, most firm level studies focused on the role of R&D
activities, technology acquisition, firm size and age as determinants of innovation (Hirsch-Kreinsen et
al., 2005; Shefer & Frenkel, 2005). The few studies that have considered the role of human capital as a
key factor fostering innovation at the firm level have mostly taken place in developed countries (e.g.
Grimpe & Sofka, 2009; Liu & Buck, 2007). Yet, there is a striking dearth of such studies in
developing countries. This is surprising because stimulating education levels and building human
capital is the cornerstone of many development initiatives and policies in developing countries
(UNCTAD, 2014). As such, firm level studies in developing countries regarding the relation between
human capital and innovation are much needed.
First, a firm level approach is needed because it is not necessarily possible to generalize macro
level evidence to the micro level, due to the risk of ecological fallacies (Beugelsdijk, 2007; Robinson,
1950). Studies on human capital in developing countries often focus on the impact on economic
growth, the growth of total factor productivity (Benhabib & Spiegel, 1994; Goedhuys, Janz, &
Mohnen, 2008) or foreign direct investment (Noorbakhsh et al., 2001). However, these studies are
mostly at the country level and shed little light on the relationship between human capital and
innovation at the firm level. Firm level studies that have looked at this relationship focus almost
exclusively on firms in developed economies. For instance, Leiponen (2005) and Vinding (2006)
examine the impact of education of employees on innovation and find a positive relation (in Finland
and Denmark respectively). Schneider et al., (2010) consider the relation between innovation and the
educational level of employees and training provided by firms in Germany and found a positive
relation as well.

Second, studies in developing countries are needed, because an increasing body of literature
provides evidence that innovation and productivity are key factors to grow out of poverty (Crespi &
Zuniga, 2011; Hegde & Shapira, 2007; Lee & Kang, 2007; Robson et al., 2009). However, firms in
developing countries operate “substantially below the technology frontier, with lower levels of human
capital” (Goedhuys et al., 2008), which means that those countries can catch up by technology
acquisition and imitation (Bell & Pavitt, 1993; Katz, 1986). Therefore, a focus solely on R&D
investments is unlikely to tell the whole story in developing economies (Crespi & Zuniga, 2011). The
lack of formal R&D expenditures and technology investments in most developing countries can partly
be explained by the poor supply of human capital (Chaminade & Vang, 2006). Yet, the role of human
capital in innovation has received limited attention in developing countries. Some studies take the
human capital endowments of the firm into account, but their measures of human capital are often
restricted to formal schooling (see for instance Robson et al., 2009). We argue that not only the human
capital endowments of a firm (such as the level of education of employees) play a role, but that a firm
can also invest in human capital by offering formal training or by providing slack time to employees.
These firm-level practices could, next to the level of schooling, increase the level of human capital
within the firm and influence the innovative output of that firm. Hence, this study extends the above-
mentioned studies by taking into account other factors that could improve human capital within the
firm and by applying these arguments at the firm level in developing countries.
We investigate the relationship between human capital and innovation in three developing
countries in the East African region: Kenya, Tanzania and Uganda. We use the Enterprise Surveys of
the World Bank, which are harmonized questionnaires conducted in the manufacturing and services
sectors in several developing countries. The latest version (from 2013) also consists of data about the
innovative output of firms and human capital.
Our study has two significant contributions. First, we contribute to the literature about human
capital and innovation by an in-depth investigation of the different aspects of human capital within a
firm. We show how these distinct aspects of human capital are conducive for innovation. We do not
only examine the human capital endowments, but also the practices of firms to improve the level of
human capital and the interaction between certain aspects. Second, we contribute to the literature by
analyzing the role of human capital in firms in developing countries.
THEORY AND HYPOTHESES
Human capital and innovation
Human capital refers to the skills, abilities and knowledge of individuals (Becker, 1964). In general, it
has been argued that human capital is an important source of competitive advantages for firms and
nations ( Dakhli & De Clercq, 2004; Gimeno et al., 1997).
In this study, we specifically focus on the role of human capital for innovation at the firm
level, because it is conducive for the development of new knowledge (Smith et al., 2005) and it
supports the ability of firms to absorb knowledge (Cohen & Levinthal, 1990). This knowledge can be
accumulated by R&D conducted within the firm or can be derived from the skills and abilities of
employees (Zahra & George, 2002), which we refer to as human capital. Notwithstanding the role of
R&D, we specifically consider the role of human capital for innovation. Previous studies already
showed the positive effect of R&D on innovation in developed economies (e.g. Amara et al., 2008;
Raymond & St-Pierre, 2010) and in developing countries (e.g. Goedhuys, 2007; Shefer & Frenkel,
2005), but the role of human capital in innovation is studied less explicitly and few empirical studies
focus on the relation between human capital and innovative output (Schneider et al., 2010). The
relation between human capital and innovation has mainly been studied at the national level (e.g.
Dakhli & De Clercq, 2004) or, it is used as a control variable in studies at the firm level (e.g.
Goedhuys & Veugelers, 2012).
Yet, Schneider et al. (2010) argue that a firm level approach is needed to better understand the
relation between human capital and innovation. Their empirical results indeed show that better trained
employees will provide firms with more innovative output. Similarly, in the context of developing
countries, Mahemba & Bruijn (2003) showed the importance of training for the innovative
performance of firms, while Robson et al. (2009) do not find a positive relation between training and
innovation in Ghana. However, most studies using human capital focus predominantly on formal
education or years of schooling as a measure of human capital (Marvel & Lumpkin, 2007). We aim for

a more sophisticated measure of human capital and argue that human capital within a firm does not
only consists of the level of education or schooling, but also consists of firm level practices that are
geared towards the development of human capital within the firm. We consider the role of practices
like formal training and providing employees with slack time as ways to improve the level of human
capital within the firm. As such, these practices positively affect the innovative performance of these
firms.
Employee schooling
Employee schooling refers to the level of schooling that employees of the firm possess. The level of
schooling of employees within a firm may benefit the firm, because education enhances the ability to
understand, create and process information quicker compared to individuals without education (Nelson
& Phelps, 1966). Furthermore, a workforce that has a certain level of schooling is better able to absorb
knowledge and exploit opportunities compared to a workforce without any schooling (cf. Cohen &
Levinthal, 1990). Previous research in the agricultural sector in developing countries shows a positive
relation between education and innovation (e.g. Knight et al.,2003). Liu & Buck (2007) included the
level of schooling to explain innovative output in China and found a significant effect as well. Hence,
the level of schooling within a firm could be conducive in absorbing knowledge and transforming this
knowledge into innovation. Therefore, we propose the following hypothesis:
H1: The higher the share of employees with at least secondary schooling within a firm, the
higher its probability to produce innovative output.
Formal training
We consider formal training as another crucial element of human capital within a firm. Formal
training is the extra training that employees receive from the firm in order to instruct employees in
specific processes and learn them specific skills and abilities. This increases the human capital of the
firm by updating knowledge and capabilities of employees (Cohen & Levinthal, 1990). Furthermore, if
a firm would like to introduce a new product or service, the employees should learn new skills in order

to produce these new products and services. Therefore, training of employees enhances the success of
innovation (Freel, 2005). Especially in low- and medium-technology industries training seems to be
crucial for innovation (Santamaría et al., 2009). Yet, empirical evidence is not conclusive about the
role of formal training. For instance, Caloghirou et al., (2004) do not find a significant effect of formal
training in developed countries, while Santamaría et al. (2009) find a significant effect of training on
innovation in Spain. Goedhuys (2007) does not find a significant relation between training and product
innovation in Tanzania. However, we expect that the relation will be positive and significant in
developing countries, because formal training of employees can compensate for the lower degree of
education of employees (Goedhuys & Srholec, 2010). Hence, we propose the following hypothesis.
H2: A firm that provides formal training to its employees has a higher probability to
produce innovative output compared to firms that do not provide formal training.
Employee slack time
Employee slack time refers to human resources that are not necessary for the daily operations of a firm
(Bourgeois, 1981). This employee slack is the time that employees can spend on other explorative
activities instead of their daily activities, because it is the excess time that employees have. The effect
of slack resources in general on innovation is still a point of discussion (Anderson et al., 2014). Some
find a inverted U-shape relation of slack resources on innovation (Herold et al., 2006; Nohria &
Gulati, 1996), while others find an negative relation (Latham & Braun, 2009) or do not find a
significant effect (Alpkan et al., 2010; Mousa & Chowdhury, 2014).
We focus on employee slack time in particular, because it is an element of building human
capital within a firm; it gives employees the opportunity to develop themselves and obtain new skills
and knowledge. Positive effects show that slack time gives employees the opportunity to explore new
domains and activities, which might result in new ideas about innovative products and services
(Nohria & Gulati, 1996). During this time, employees have the opportunity to be creative, which can
lead to innovation (Amabile, 1996). Hence, the basic idea of the positive relation is that employee
slack time gives employees the opportunity to develop their own ideas during working hours, which
may eventually result in innovative output. Negative effects show that slack time is a waste of
resources (Williamson, 1963) and may interrupt certain processes (Mosakowksi, 2002), which could
result in a negative impact on innovation.
There is some anecdotal evidence about Google, where employees spend 10% of their
working time on a self-chosen project, which shows a positive relation between slack time and
innovation. Another company that implements slack time for its employees is 3M. Employees have to
spend 15% of their time own projects or ideas. Garud et al. (2011) identify this 15% rule as one of the
key characteristics of the company that fosters innovative output.
Employee slack time enhances the creativity of employees. It has been argued that especially
in low- and medium technology industry, creativity is one of the drivers of innovation instead of
technological knowledge (Santamaría et al., 2009). Most developing countries have a comparative
advantage in low- and medium technology industries (Goedhuys et al., 2014), which indicates that
creativity is an even more important factor in those countries. Hence, we expect the following relation:
H3: A firm that gives slack time to its employees has a higher probability to produce
innovate output compared to firms that do not give slack time to their employees.
Formal training and employee slack
There is reason to believe that a combination of human capital development practices in firms could
influence the result of those practices. In most studies there is an implicit assumption that if factors
spur innovation, the higher the level of that factor, the higher the innovative output (Anderson et al.,
2014). However, it could be that combinations of factors have less favorable results and do not
reinforce each other. Therefore, more research is needed to indicate how different variables interact
with each other (Anderson et al., 2014).
We argue that the combination of formal training and employee slack time may have
counterproductive effects. Employees that receive formal training are provided with information and
guidelines how they have to proceed in their work. We argued that this training helps employees to
successful implement innovations. However, if employees receive formal training they will be trained

in terms of procedures and guidelines, which could diminish their creativity. During training sessions,
codified knowledge will be transmitted to employees in the formalized structure of the training. These
formalized structures can result in more rigidities which can limit creativity (Klijn & Tomic, 2010).
The slack time that employees receive to develop themselves and come up with innovative ideas is
based on the assumption that some spare time will enhance creative thinking and result in new ideas
(Amabile, 1996). Therefore, we expect that the effect of employee slack time on innovation diminishes
if the firm provides formal training to its employees as well. Thus, the combination of formal training
and employee slack time can result in less favorable results. This results in the following hypothesis:
H4: Employee slack time in combination with formal training within a firm diminishes
each other’s effect on the probability to produce innovative output.
Employee schooling and employee slack
The education of employees provides a certain level of basic knowledge for individuals. It has been
argued that a certain level of knowledge can contribute to creativity (Amabile, 1996; Ford, 1996).
Education gives individuals the opportunity to receive a certain kind of general knowledge, while
formal training provides employees with specific guidelines and routines. Hence, we expect that the
combination of employee schooling and employee slack time has a different effect than the
combination of formal training and employee slack time.
Employee slack time gives employees the opportunity to develop their skills and come up with
innovative ideas. It seems therefore reasonable to argue that employees that already have a certain
level of knowledge will come up with more creative ideas during their slack time than individuals
without this level of knowledge. While the knowledge component and the time available for creativity
has been widely recognized theoretically, empirical studies on the interaction between the knowledge
base of employees and time related to creativity remains scarce (Anderson et al., 2014). We expect
that employee slack time and formal education will reinforce each other’s positive effect on
innovation. This results in the following hypothesis:

H5: Employee slack time in combination with the amount of employee schooling within a
firm strengthens each other’s effect on the probability to produce innovative output.
DATA AND METHODS
Data The data that we use to test our theoretical ideas stems from the Enterprise Surveys 2013 conducted in
Kenya, Tanzania and Uganda. The Enterprise Surveys have been developed by the World Bank to
collect data that can be harmonized among developing countries. Since 2002, the World Bank has
conducted interviews with top managers and business owners of 130,000 firms in 135 economies.
Ideally, the population consists of all eligible firms within the country, based on the population
that is registered in their statistical offices. Sometimes, other lists have been used to come up with the
population. The World Bank uses stratified random sampling as sampling methodology. The strata
that have been used are firm size, business sector and geographic region within a country.2 This
resulted in a representative sample for the countries and industries involved. In total 2076 firms have
been surveyed in our sample, 713 from Kenya, 723 from Tanzania and 640 located in Uganda.
Dependent Variable
To operationalize a firm’s innovation outcomes, we used self-reported measures of innovativeness that
were developed for the Community Innovation Survey (CIS) (Brouwer & Kleinknecht, 1996).
Specifically, to measure whether companies are innovative we utilized two sequential questions. First,
respondents were asked “Did you introduce new or significantly improved products or services to the
market in the last three years?”. A three-year period was chosen to avoid bias resulting from
measuring accidental or one-off innovation. Respondents answering in the affirmative to this question
were subsequently asked “Was this new or significantly improved product or service also new to your
main market?”. Companies answering ‘yes’ on both questions were coded with a ‘1’ all other
companies with a ‘0 ‘. This measurement is in line with generally accepted definitions of incremental
and radical innovation and prior research has shown that this perception based measure of innovation
2 For more information about the methodology and sampling see www.enterprisesurveys.org.

outcomes is highly reliable and correlates heavily with other (objective) measures of innovation
outcomes (Hagedoorn & Cloodt, 2003).
Independent Variables
Employee Schooling. The level of education of the employees was measured by asking the
respondents “What percentage of your full-time workers has completed their high school?”. The
resulting variable ranges between 0 and 100 by design.
Formal training. The presence of formal training practices within the company was assessed
by asking “In the last fiscal year did your company offer formal training programs to your full-time
permanent employees?”. Companies answering ‘yes’ to this question were coded with a ‘1’ all other
companies with a ‘0 ‘.
Employee Slack. The presence of the practice of giving employees slack time to work on
creative new ideas was measured by asking “During the last three years, did your establishment give
employees time to work on new ideas?”. Companies answering ‘yes’ to this question were coded with
a ‘1’ all other companies with a ‘0 ‘.
Control Variables
Size. We control for the size of the company as generally bigger companies have more
resources at their disposal can more easily free up personnel and resources for innovative activities
(Hansen, 1992). The size of the company was measured by the natural log of the number of full-time
permanent employees of the company.
Age. We control for the age of the company as it is often argued that older companies are more
inert and less flexible and will therefore be less likely to innovate (Hansen, 1992). A company’s age
was determined by asking for the year of establishment of the company and subtracting this from the
year in which the survey was performed (i.e. 2013).
Subsidiary. We also control for whether the company as an independent economic unit or part
of a larger organizational entity. We do so by asking the question “Is your establishment part of a
larger firm?”. Companies answering ‘yes’ to this question were coded with a ‘1’ all other companies
with a ‘0 ‘.
R&D. A firm’s internal capacity to generate and process knowledge is also likely to impact on
its innovation outcomes (Cohen & Levinthal, 1989). As such, we included a dummy variable that took
the value ‘1’ if the responding firm indicated that in the last three year it had spend any money on
formal R&D activities and ‘0’ in all other cases.
Foreign presence or foreign owned. We used a question about the percentage of the company
that is owned by private foreign individuals, companies or organizations to construct two control
variables. First, for any company that answered any value greater than 0% to the above question we
coded the control variable ‘foreign presence’ as ‘1’ and ‘0’ otherwise. Second, for any company that
answered any value greater than 50% we coded the control variable ‘foreign owned’ as ‘1’ and ‘0’
otherwise. We control for foreign presence and foreign ownership because firms in emerging
economies often highly benefit from technological knowledge available from their international
headquarter and research labs (Isobe et al., 2000).
Country and industry dummies. Finally, we include dummy variables to control for
differences between countries (Uganda being the reference category) and between industries (services
being the reference category).
Analyses
Our dependent variable has a discrete distribution. We therefore employed logistic regression analysis
to estimate the effects of our independent variables on the likelihood of a firm being innovative. The
basic form of a logistic regression equation is represented in equation 1. To make this function
estimable it is transformed into equation 2.
𝑌 =𝑒𝑏0+𝑏1𝑋1+𝑏𝑛𝑋𝑛+𝜀
1 + 𝑒𝑏0+𝑏1𝑋1+𝑏𝑛𝑋𝑛+𝜀 (1)
𝑙𝑜𝑔 �𝑌
1 − 𝑌�= 𝑏0 + 𝑏1𝑋1 + 𝑏𝑛𝑋𝑛 + 𝜀 (2)

As is evident from equation 1 and 2, logistic models are highly non-linear. Therefore, formal
hypothesis tests using logistic regression models have to take into account that the strength and
direction of effects depend on the values of all other variables in the model. We follow
recommendations by Hoetker (2007) and estimated average marginal effects across all observed
values for the other variables in the model. This approach improves on the common practice of setting
all other variables at their mean. The latter can be problematic because the mean ignores the actual
dispersion of values. In addition, in the case of categorical variables, the mean tends to be a value for
which the variable is not defined.
We used improvement of overall model fit to identify appropriate models for hypothesis tests
based on log-likelihood ratio tests (Long & Freese, 2006). For our formal hypothesis tests, we report
conditional effect specific relevant values of the independent variables (Bowen & Wiersema, 2004;
Long & Freese, 2006). In addition, we provide graphs that show their effects across the full observed
range of variable values.
RESULTS
Table 1 reports pooled descriptive statistics and correlations. The descriptive statistics indicate that
41% of the firms in our sample report to be innovative. Only 23% of the firms performed any formal
R&D in the last three years. However, a surprisingly large share of 44% of the firms formally offers
their employees time to work on new and creative ideas. As such, it seems like a large part of the R&D
is done informally. Finally 34% of the companies offered formal training to their personnel and for the
average firm about 53% of the personnel at least holds a high school degree.
Insert Table 1 here
Table 2 reports the results of the binary logistic regressions performed to test our hypotheses. Models
1 through 3 are hierarchical logistic regression. Model 1 is the baseline model including only the
control variables. Model 2 adds to direct effects of the three independent variables to the model,
whereas model three adds to interaction effects between employee slack and the two other independent

variables. Models 4-5 and 6-7 are identical to model 2 and 3 except that models 4 and 5 include only
manufacturing firms, whereas models 6 and 7 include only service firms.
Insert Table 2 here
With regard to the control variables most results are as expected. Firms size has a positive effect on the
likelihood of being innovative, whereas firm age has a negative effect. R&D has the expected positive
effect, but the size of the effect is surprisingly small. Marginal effect analyses reveal that the
difference in the likelihood of being innovative between firms that do perform R&D and firms that do
not is only 7.2%. Compared to the effect sizes of some of the human capital variables we will discuss
later, this effect is modest indeed. This further underlines the notion that formal R&D is relatively
unimportant as a driver of innovation in developing countries.
The main effects of our independent variables are highly similar across all models. With
regard to the interaction effects, comparing model 3 to 2 reveals that the full model (model 3) has a
superior model fit. However, comparing models 4-5 and 6-7 reveals that this superior model fit is
completely driven by a better model fit for the manufacturing firms. For the service firms, the
interaction effects are insignificant. As such, we will be interpreting the interaction effects separately
for both industries.
Employee schooling has a marginally significant effect on a firm’s likelihood of being
innovative. Moreover, the effect is very small. Marginal effects analyses reveal that a one standard
deviation increase in employee schooling increases the likelihood of being innovative by about 1%-
point. So even though we find some statistical support for our hypothesis 1 we conclude that employee
schooling is a relatively unimportant determinant of firm innovation.
We find very strong support for our hypothesis that formal training is of influence on a firm’s
innovativeness (hypothesis 2). The size of the effect of this variable is depicted in Figure 1. Having a
formal training program makes the likelihood of a firm being innovative increase from 23% to 47%,
which is more than a doubling.

The same conclusion holds for firms that offer their employees slack time to work on new and
creative ideas. Figure 1 reveals that the size of this effect is even more profound than that of formal
training. Offering employees slack time results in an increase in the likelihood of being innovative
from 23% to 54%. These findings offer strong support for hypothesis 3.
In hypothesis 4 we predicted that offering both formal training and employee slack would be
counterproductive as formal training might reduce individual creativity which employee slack relies
on. We find some support for this hypothesis but only in the manufacturing industry. The effect size
analysis reported in Figure 1 clearly reveals the differences between the manufacturing and the service
industries in this regard. Individually, the effects of formal training and employee slack are bigger in
the manufacturing industry than in the service industry. The effect of using both formal training and
employee slack, however, is bigger in the service industry. It is important to note, however, that even
in the manufacturing industry firms offering both formal training and employee slack are better off
than firms offering only one of the two. So even though the two diminish each other’s effect in the
manufacturing industry it is not the case that there is a formal trade-off between the two practices.
In hypothesis 5 we predicted that having more educated employees and offering employee
slack would be reinforce each other’s positive effects. We find evidence of the opposite, but only in
the manufacturing industry. Effect size analyses reported in Figure 2 reveal that for firms that offer
employee slack the effect of employee schooling actually turns negative. This is an intriguing finding
to which we will get back in detail in the discussion section. However, it is important to note that, for
any value of employee schooling, offering employee slack will increase a firm’s likelihood of being
innovative (i.e. the black line is always above the grey line in Figure 2). However, for firms that
already offer employee slack, a strategy of hiring more educated employees might have negative
consequences for the innovativeness.
DISCUSSION
In general, our results support the idea that human capital and innovation are closely related. The
findings indicate that all direct effects of our independent variables, namely employee schooling,
employee slack time and formal training, have a positive relation with innovation.

However, our study also revealed a few surprising results. For instance, the effect of employee
schooling on innovation is not as strong as the effects of formal training and employee slack time. This
implies that firm-specific practices are very conducive for innovation in developing countries.
Furthermore, the interaction between secondary schooling and employee slack time has a different
effect than we initially anticipated. Below, we briefly review our main findings and provide policy
implications and suggestions for further research.
Direct effects
The positive relation between employee schooling and innovation evident from our analysis, is in line
with Knight et al.'s (2003) study on the farming sector and the results found at the national level of
Dakhli & De Clercq (2004). Robson et al. (2009) also introduced higher levels of education, which
showed an even more significant effect on some sorts innovation, but not on product and services
innovations. Unfortunately, we did not have access to data about higher levels of education, we would
expect the effect between schooling and innovation to be stronger if higher levels of education had
been introduced. This is a limitation of our study and could be interesting for future research. Our
results indicate that schooling has a positive relation with innovation in developing countries, but that
firm-specific practices (providing employee slack time and formal training) have a more profound
effect.
Our results also show that formal training has a strong positive effect on innovation. One
explanation for this strong positive effect could be that, especially in developing countries, formal
training supports innovation and compensates for lower levels of education of employees. This is in
line with previous studies in developing countries (e.g. Goedhuys and Srholec, 2010) that argued that
formal training often supplements the lower degree of education in developing countries. Other studies
were not conclusive as to the effect of formal training on innovation. Freel (2005) and Santamaría, et
al. (2009), for instance, found a positive effect, while Caloghirou et al. (2004) and Robson et al.
(2009) did not find an effect at all. Our study adds to the limited number of studies about the effect of
training on innovation.
Our results reveal that an even stronger effect exists for employee slack time on innovation
(compared to formal training and schooling), which implies that, in developing countries, employee
slack time is pivotal for innovative output. However, previous studies that empirically examined the
role of slack resources for innovation in developed countries showed contradicting results (Anderson
et al., 2014). Our study shows that employee slack time has a positive relation with innovation in
developing countries(Greve, 2003)(Greve, 2003)(Greve, 2003)(Greve, 2003)(Greve, 2003). This is in
line with the suggestion that slack time results in opportunities to explore new domains and activities
which can result in new ideas about innovation (Nohria & Gulati, 1996) and that, theoretically, time
supports creative thinking (Shalley & Gilson, 2004) and can eventually result innovative output
(Amabile, 1996).
In summary, the direct effect of all variables indicate a positive relation between human
capital and innovation. The limited effect of educational level compared to the effect of formal
training and employee slack could indicate that these firm-specific practices complement the low
human capital endowments of the employees of the firm.
Interaction effects
We also hypothesized two interaction effects. We found that the combination of formal training and
employee slack partly cancel each other out in the manufacturing industry, which could mean that the
creativity related to employee slack time is diminished by formal training. The combination of these
two practices has then less favorable results, because formal training may enforce employees with
certain guidelines that are not conducive for creativity. Yet, in both manufacturing and services,
providing both practices to employees does increase the likelihood of innovation taking place. Until
now, there has been a lack of studies examining the interaction effect between these variables
(Anderson et al., 2014). Our results give some insight into the interaction between formal training and
employee slack time provided by firms.
The combination of employee slack time and employee schooling overall gives a higher
innovative output. However, the higher the percentage of employees with secondary schooling, the
lower the effect of employee slack time on innovation, which contradicts our expectation that
secondary schooling and employee slack time would reinforce each other. This could imply that
employees who did not attend secondary education have other characteristics that are even more
beneficial in combination with employee slack time. Initially, we argued that education results in a
basic level of knowledge that is conducive for creativity. However, another way in which employees
could acquire knowledge is by job experience (Marvel & Lumpkin, 2007; Tierney & Farmer, 2002). It
could be that employees without secondary education have spent more time working and therefore
have more job experience and expertise related to the job. This expertise could enhance creativity
(Amabile, 1988) and therefore the effect of slack time could be higher for employees without
secondary schooling. Further research should investigate this line of reasoning based on data available
on the expertise of employees within the firm compared to the level of secondary education within the
firm. Our result reveals that the combination of employee slack time and formal training diminish each
other’s effect in the manufacturing industry, which adds to the literature about the interaction between
multiple factors that are conducive to creativity and results in innovation (Anderson et al., 2014).
The forgoing discussion shows that human capital is of significant importance to spur
innovative output in developing countries. In particular the role firms play in improving the level of
human capital within the firm by specific practices such as providing formal training and employee
slack time. This implies that especially in developing countries, firms can enhance their innovative
output by giving employees the ability to develop themselves by formal training or employee slack
time.
Policy Implications
Our results reveal that firm level practices, such as formal training and employee slack time, have a
more profound impact on innovation than traditional factors like schooling and R&D. This indicates
that policymakers, who would like to promote innovation at the firm level, should stimulate
investments in formal training and employee slack time. Policymakers could introduce tax advantages
or subsidies that are favorable for firms that introduce these practices. For example, in Kenya there are
policies that encourage in-house R&D activities of firms (Technopolis Group, 2014). Our study points
out that policies directed towards encouraging formal training or slack time may be more beneficial for
innovative output than policies focusing on R&D expenditures.
The results of our study have managerial implications as well. Managers, who wish to improve
innovative output, seem to be better off when introducing formal training or employee slack time, than
by increasing R&D expenditures. For future studies, it could be an interesting approach to investigate
the causality between human capital and innovation in developing countries. Due to data limitations in
our study it was not possible to conduct analyses using panel data. Such an analysis would give an
indication about the causality between human capital and innovation.
REFERENCES
Alpkan, L., Bulut, C., Gunday, G., Ulusoy, G., & Kilic, K. (2010). Organizational support for intrapreneurship and its interaction with human capital to enhance innovative performance. Management Decision, 48(5), 732–755. doi:10.1108/00251741011043902
Amabile, T. M. (1996). Creativity and Innovation in Organizations. Harvard Business School.
Amara, N., Landry, R., Becheikh, N., & Ouimet, M. (2008). Learning and novelty of innovation in established manufacturing SMEs. Technovation, 28(7), 450–463. doi:10.1016/j.technovation.2008.02.001
Anderson, N., Potocnik, K., & Zhou, J. (2014). Innovation and Creativity in Organizations: A State-of-the-Science Review, Prospective Commentary, and Guiding Framework. Journal of Management, 40(5), 1297–1333. doi:10.1177/0149206314527128
Anderson, Neil, Potocnik, K., & Zhou, J. (2014). Innovation and Creativity in Organizations: A State-of-the-Science Review, Prospective Commentary, and Guiding Framework. Journal of Management, 40(5), 1297–1333. doi:10.1177/0149206314527128
Becker, G. (1964). Human Capital. New York: National Bureau of Economic Research.
Bell, M., & Pavitt, P. (1993). Technological accumulation and industrial growth: Contrasts between developed and developing countries. Industrial and Corporate Change, 2(2), 157–211.
Benhabib, J., & Spiegel, M. M. (1994). Monetarv. Journal of Monetary Economics, 34, 143–173.
Beugelsdijk, S. (2007). The Regional Environment and a Firm’s Innovative Performance: A Plea for a Multilevel Interactionist Approach. Economic Geography, 83(2), 181–199. doi:10.1111/j.1944-8287.2007.tb00342.x
Bourgeois, L. J. (1981). On the Measurement of Organizational Slack. The Academy of Management Review, 6(1), 29–39.
Bowen, H. P., & Wiersema, M. F. (2004). Bouwen Wiersema 2004.pdf. Research Methodology in Strategy and Management, 1, 87–134.
Brouwer, E., & Kleinknecht, A. H. (1996). Determinants of Innovation: A Microeconometric Analysis of Three Alternative Innovative Output Indicators. Determinants of Innovation: The Message from New Indicators. MacMillan Press: Basingstoke.
Caloghirou, Y., Kastelli, I., & Tsakanikas, A. (2004). Internal capabilities and external knowledge sources: complements or substitutes for innovative performance? Technovation, 24(1), 29–39. doi:10.1016/S0166-4972(02)00051-2
Chaminade, C., & Vang, J. (2006). INNOVATION POLICY FOR ASIAN SMEs : EXPLORING CLUSTER DIFFERENCES. Handbook of Research on Asian Business (pp. 1–33). Cheltenham, UK and Northampton, MA USA: Edward Elgar.
Cohen, W. M., & Levinthal, D. A. (1989). Innovation and Learning: The Two Faces of R&D. The Economic Journal, 99(397), 569–596.
Cohen, W. M., & Levinthal, D. A. (1990). Absorptive Capacity : A New Perspective on Learning and Innovation. Administrative Science Quarterly, 35, 128 – 152.
Coleman, J. S. (1988). Social Capital in the Creation of Human Capital. American Journal of Sociology, 94, s95–s120.
Crespi, G., & Zuniga, P. (2011). Innovation and Productivity: Evidence from Six Latin American Countries. World Development, 40(2), 273–290. doi:10.1016/j.worlddev.2011.07.010
Dakhli, M., & De Clercq, D. (2004). Human capital, social capital, and innovation: a multi-country study. Entrepreneurship & Regional Development, 16(2), 107–128. doi:10.1080/08985620410001677835
Ford, C. M. (1996). A Theory of Individual Creative Action in Multiple Social Domains. The Academy of Management Review, 21(4), 1112–1142. doi:10.2307/259166
Freel, M. S. (2005). Patterns of innovation and skills in small firms. Technovation, 25(2), 123–134. doi:10.1016/S0166-4972(03)00082-8
Garud, R., Gehman, J., & Kumaraswamy, A. (2011). Complexity Arrangements for Sustained Innovation: Lessons from 3M Corporation. Organization Studies, 32(6), 737–767. doi:10.1177/0170840611410810
Gimeno, J., Folta, T. B., Cooper, A. C., & Woo, C. Y. (1997). Survival of the Fittest? Human Entrepreneurial Capital and the Persistence of Firms Underperforming. Administrative Science Quartely, 42(4), 750–783.
Goedhuys, M. (2007). Learning, product innovation, and firm heterogeneity in developing countries; Evidence from Tanzania. Industrial and Corporate Change, 16(2), 269–292. doi:10.1093/icc/dtm003
Goedhuys, M., Janz, N., & Mohnen, P. (2008). What drives productivity in Tanzanian manufacturing firms: technology or business environment? The European Journal of Development Research, 20(2), 199–218. doi:10.1080/09578810802060785

Goedhuys, M., Janz, N., & Mohnen, P. (2014). Knowledge-based productivity in “low-tech” industries: evidence from firms in developing countries. Industrial and Corporate Change, 23(1), 1–23. doi:10.1093/icc/dtt006
Goedhuys, M., & Srholec, M. (2010). Understanding multilevel interactions in economic development.
Goedhuys, M., & Veugelers, R. (2012). Innovation strategies, process and product innovations and growth: Firm-level evidence from Brazil. Structural Change and Economic Dynamics, 23(4), 516–529. doi:10.1016/j.strueco.2011.01.004
Greve, H. R. (2003). A Behavioral Theory of R&D Expenditures and Innovations: Evidence from Shipbuilding. The Academy of Management Journal, 46(6), 685–702.
Grimpe, C., & Sofka, W. (2009). Search patterns and absorptive capacity: Low- and high-technology sectors in European countries. Research Policy, 38(3), 495–506. doi:10.1016/j.respol.2008.10.006
Hagedoorn, J., & Cloodt, M. (2003). Measuring innovative performance: is there an advantage in using multiple indicators? Research Policy, 32(8), 1365–1379. doi:10.1016/S0048-7333(02)00137-3
Hegde, D., & Shapira, P. (2007). Knowledge, technology trajectories, and innovation in a developing country context: evidence from a survey of Malaysian firms. International Journal of Technology Management, 40(4), 349–370.
Herold, D. M., Jayaraman, N., & Narayanaswanny, C. R. (2006). What is the Relationship hetween Organizational Slack and Innovation? Journal of Managerial Issues, XVIII(3), 372–392.
Hirsch-Kreinsen, H., Jacobson, D., Laestadius, S., & Smith, K. (2005). Low and medium technology industries in the knowledge economy: the analytical issues. In H. Hirsch-Kreinsen, D. Jacobson, & S. Laestadius (Eds.), Low-tech Innovation in the Knowledge Economy (pp. 11–30). Frankfurt amMai: Peter Lang.
Hoetker, G. (2007). The use of logit and probit models in strategic management research: Critical issues. Strategic Management Journal, 28, 331–343. doi:10.1002/smj
Isobe, T., Makino, S., & Montgomery, D. B. (2000). Resource Commitment, Entry Timing, and Market Performance of Foreign Direct Investments in Emerging Economies: The Case of Japanese International Joint Ventures in China. The Academy of Management Journal, 43(3), 468–484.
Katz, M. (1986). An analysis of cooperative research and development. Rand Journal of Economics, 17, 527–543.
Klijn, M., & Tomic, W. (2010). A review of creativity within organizations from a psychological perspective. Journal of Management Development, 29(4), 322–343. doi:10.1108/02621711011039141
Knight, J., Weir, S., & Woldehanna, T. (2003). The role of education in facilitating risk-taking and innovation in agriculture. Journal of Development Studies, 39(6), 1–22. doi:10.1080/00220380312331293567

Latham, S. F., & Braun, M. (2009). Managerial Risk, Innovation, and Organizational Decline. Journal of Management, 35(2), 258–281. doi:10.1177/0149206308321549
Lee, K., & Kang, S.-M. (2007). Innovation Types and Productivity Growth: Evidence from Korean Manufacturing Firms. Global Economic Review, 36(4), 343–359. doi:10.1080/12265080701694512
Leiponen, A. (2005). Skills and innovation. International Journal of Industrial Organization, 23(5-6), 303–323. doi:10.1016/j.ijindorg.2005.03.005
Liu, X., & Buck, T. (2007). Innovation performance and channels for international technology spillovers: Evidence from Chinese high-tech industries. Research Policy, 36(3), 355–366. doi:10.1016/j.respol.2006.12.003
Long, J. S., & Freese, J. (2006). Regression models for categorical dependent variables using Stata. College Station, TX: Stata corporation.
Mahemba, C. M., & Bruijn, E. J. De. (2003). Innovation Activities by Small and Medium-sized Manufacturing Enterprises in Tanzania. Creativity and Innovation Management, 12(3), 162–173. doi:10.1111/1467-8691.00279
Marvel, M. R., & Lumpkin, G. T. (2007). Technology Entrepreneurs’ Human Capital and Its Effect on Innovation Radicalness. Entrepreneurship Theory and Practice, (November), 807–828.
Mosakowksi, E. (2002). Overcoming resource disadvantages in entrepreneurial firms: when less is more. In M. Hitt, D. Ireland, D. Sexton, & M. Camp (Eds.), Strategic entrepreneurship: creating an integrated mindset (pp. 106–126). Oxford: Blackwell.
Mousa, F.-T., & Chowdhury, J. (2014). Organizational slack effects on innovation: the moderating roles of CEO tenure and compensation. Journal of Business Economics and Management, 15(2), 369–383. doi:10.3846/16111699.2013.839476
Nelson, R. R., & Phelps, E. S. (1966). Investment in Humans , Technological Diffusion , and Economic Growth. The American Economic Review, 56(1/2), 69–75.
Nohria, N., & Gulati, R. (1996). Is Slack Good or Bad for Innovation. The Academy of Management Journal, 39(5), 1245–1264.
Noorbakhsh, F., Paloni, A., & Youssef, A. L. I. (2001). Human Capital and FDI Inflows to Developing Countries: New Empirical Evidence. World Development, 29(9), 1593–1610.
Raymond, L., & St-Pierre, J. (2010). R&D as a determinant of innovation in manufacturing SMEs: An attempt at empirical clarification. Technovation, 30(1), 48–56. doi:10.1016/j.technovation.2009.05.005
Robinson, W. S. (1950). Ecological correlations and the behavior of individuals. Sociological Review, 15, 351–357.
Robson, P. J. a., Haugh, H. M., & Obeng, B. A. (2009). Entrepreneurship and innovation in Ghana: enterprising Africa. Small Business Economics, 32(3), 331–350. doi:10.1007/s11187-008-9121-2

Santamaría, L., Nieto, M. J., & Barge-Gil, A. (2009). Beyond formal R&D: Taking advantage of other sources of innovation in low- and medium-technology industries. Research Policy, 38(3), 507–517. doi:10.1016/j.respol.2008.10.004
Schneider, L., Günther, J., & Brandenburg, B. (2010). Innovation and skills from a sectoral perspective: a linked employer–employee analysis. Economics of Innovation and New Technology, 19(2), 185–202. doi:10.1080/10438590902872887
Schumpeter, J. A. (1934). The theory of economic development. Cambridge: MA: Harvard University Press.
Shalley, C. E., & Gilson, L. L. (2004). What leaders need to know: A review of social and contextual factors that can foster or hinder creativity. The Leadership Quarterly, 15(1), 33–53. doi:10.1016/j.leaqua.2003.12.004
Shefer, D., & Frenkel, A. (2005). R&D, firm size and innovation: an empirical analysis. Technovation, 25(1), 25–32. doi:10.1016/S0166-4972(03)00152-4
Smith, K. G., Collins, C. J., & Clark, K. D. (2005). Existing Knowledge, Knowledge Creation Capability, and the Rate of New Product Introduction in High-Technology Firms. Academy of Management Journal, 48(2), 346–357. doi:10.5465/AMJ.2005.16928421
Solow, R. (1956). A contribution to the theory of economic growth. Quarterly Journal of Economics, 70(1), 65–94.
Technopolis Group. (2014). Policy Issues Report: Kenya (pp. 1–26).
Tierney, P., & Farmer, S. M. (2002). Creative Self-Efficacy: Its Potential Antecedents and Relationship To Creative Performance. Academy of Management Journal, 45(6), 1137–1148. doi:10.2307/3069429
UNCTAD. (2014). World Investment Report 2014 (pp. 1–265). Geneva.
Vinding, L. A. (2006). Absorptive capacity and innovative performance: A human capital approach. Economics of Innovation and New Technology, 15(4-5), 507–517. doi:10.1080/10438590500513057
Williamson, O. E. (1963). A model of rational managerial behavior. A behavioral theory of the firm (pp. 237–252). Englewood Cliffs: Prentice-Hall.
Zahra, S. A., & George, G. (2002). Absorptive capacity: A review, reconceptualization, and extension. Academy of Management Journal, 27(2), 185–203.
.
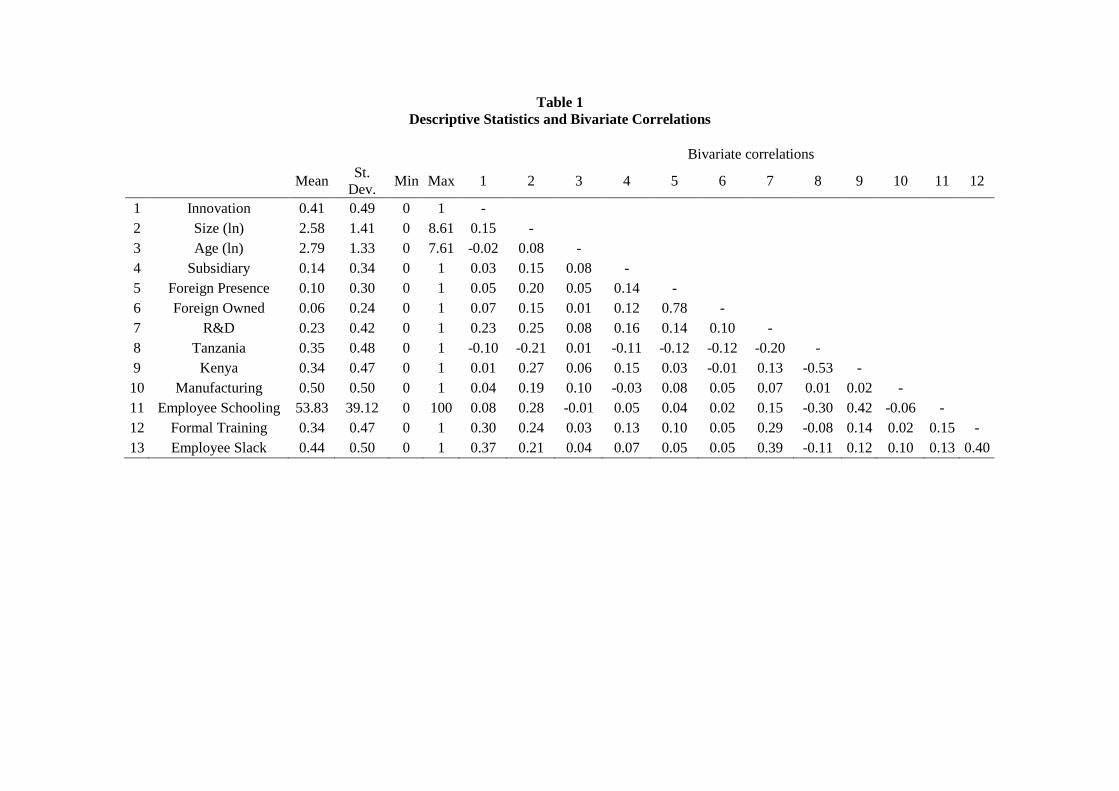
Table 1 Descriptive Statistics and Bivariate Correlations
Bivariate correlations
Mean St.
Dev. Min Max 1 2 3 4 5 6 7 8 9 10 11 12
1 Innovation 0.41 0.49 0 1 - 2 Size (ln) 2.58 1.41 0 8.61 0.15 - 3 Age (ln) 2.79 1.33 0 7.61 -0.02 0.08 - 4 Subsidiary 0.14 0.34 0 1 0.03 0.15 0.08 - 5 Foreign Presence 0.10 0.30 0 1 0.05 0.20 0.05 0.14 - 6 Foreign Owned 0.06 0.24 0 1 0.07 0.15 0.01 0.12 0.78 - 7 R&D 0.23 0.42 0 1 0.23 0.25 0.08 0.16 0.14 0.10 - 8 Tanzania 0.35 0.48 0 1 -0.10 -0.21 0.01 -0.11 -0.12 -0.12 -0.20 - 9 Kenya 0.34 0.47 0 1 0.01 0.27 0.06 0.15 0.03 -0.01 0.13 -0.53 -
10 Manufacturing 0.50 0.50 0 1 0.04 0.19 0.10 -0.03 0.08 0.05 0.07 0.01 0.02 - 11 Employee Schooling 53.83 39.12 0 100 0.08 0.28 -0.01 0.05 0.04 0.02 0.15 -0.30 0.42 -0.06 - 12 Formal Training 0.34 0.47 0 1 0.30 0.24 0.03 0.13 0.10 0.05 0.29 -0.08 0.14 0.02 0.15 - 13 Employee Slack 0.44 0.50 0 1 0.37 0.21 0.04 0.07 0.05 0.05 0.39 -0.11 0.12 0.10 0.13 0.40
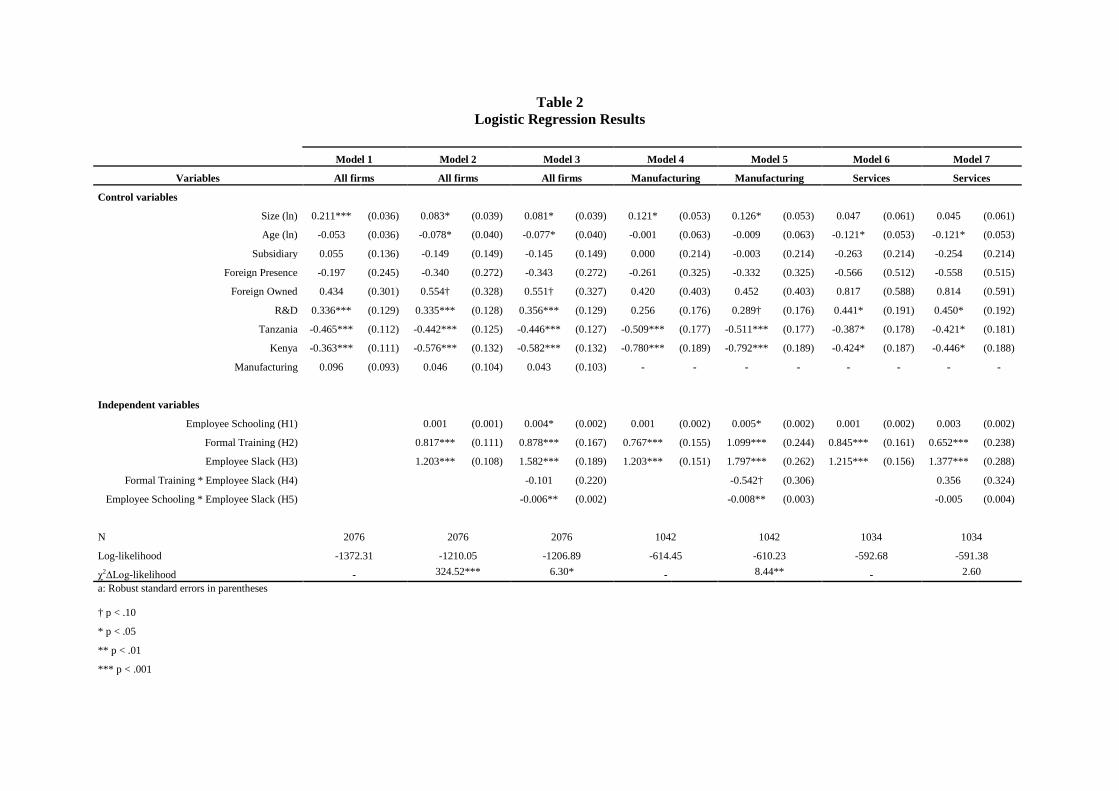
Table 2 Logistic Regression Results
Model 1 Model 2 Model 3 Model 4 Model 5 Model 6 Model 7
Variables All firms All firms All firms Manufacturing Manufacturing Services Services
Control variables Size (ln) 0.211*** (0.036) 0.083* (0.039) 0.081* (0.039) 0.121* (0.053) 0.126* (0.053) 0.047 (0.061) 0.045 (0.061)
Age (ln) -0.053 (0.036) -0.078* (0.040) -0.077* (0.040) -0.001 (0.063) -0.009 (0.063) -0.121* (0.053) -0.121* (0.053)
Subsidiary 0.055 (0.136) -0.149 (0.149) -0.145 (0.149) 0.000 (0.214) -0.003 (0.214) -0.263 (0.214) -0.254 (0.214)
Foreign Presence -0.197 (0.245) -0.340 (0.272) -0.343 (0.272) -0.261 (0.325) -0.332 (0.325) -0.566 (0.512) -0.558 (0.515)
Foreign Owned 0.434 (0.301) 0.554† (0.328) 0.551† (0.327) 0.420 (0.403) 0.452 (0.403) 0.817 (0.588) 0.814 (0.591)
R&D 0.336*** (0.129) 0.335*** (0.128) 0.356*** (0.129) 0.256 (0.176) 0.289† (0.176) 0.441* (0.191) 0.450* (0.192)
Tanzania -0.465*** (0.112) -0.442*** (0.125) -0.446*** (0.127) -0.509*** (0.177) -0.511*** (0.177) -0.387* (0.178) -0.421* (0.181)
Kenya -0.363*** (0.111) -0.576*** (0.132) -0.582*** (0.132) -0.780*** (0.189) -0.792*** (0.189) -0.424* (0.187) -0.446* (0.188)
Manufacturing 0.096 (0.093) 0.046 (0.104) 0.043 (0.103) - - - - - - - -
Independent variables Employee Schooling (H1)
0.001 (0.001) 0.004* (0.002) 0.001 (0.002) 0.005* (0.002) 0.001 (0.002) 0.003 (0.002)
Formal Training (H2)
0.817*** (0.111) 0.878*** (0.167) 0.767*** (0.155) 1.099*** (0.244) 0.845*** (0.161) 0.652*** (0.238)
Employee Slack (H3)
1.203*** (0.108) 1.582*** (0.189) 1.203*** (0.151) 1.797*** (0.262) 1.215*** (0.156) 1.377*** (0.288)
Formal Training * Employee Slack (H4)
-0.101 (0.220)
-0.542† (0.306)
0.356 (0.324)
Employee Schooling * Employee Slack (H5)
-0.006** (0.002)
-0.008** (0.003)
-0.005 (0.004)
N 2076 2076 2076 1042 1042 1034 1034
Log-likelihood -1372.31 -1210.05 -1206.89 -614.45 -610.23 -592.68 -591.38
χ2∆Log-likelihood - 324.52*** 6.30* - 8.44** - 2.60 a: Robust standard errors in parentheses
† p < .10 * p < .05 ** p < .01 *** p < .001
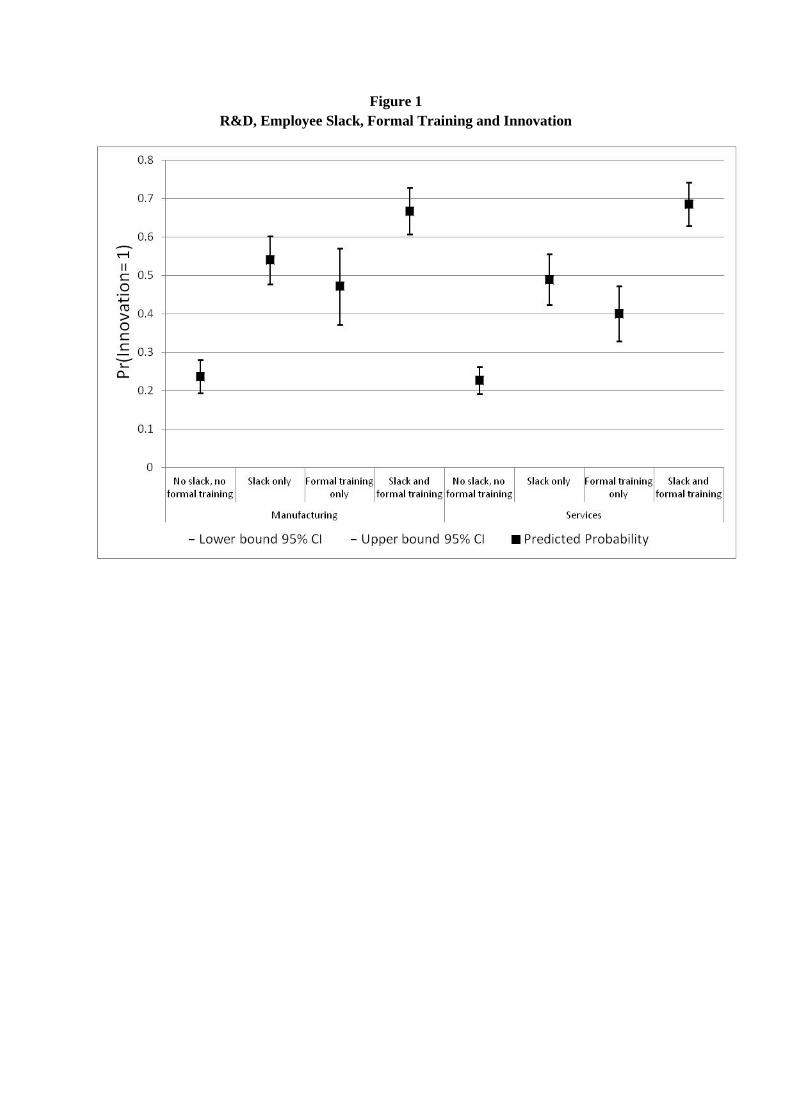
Figure 1 R&D, Employee Slack, Formal Training and Innovation

Figure 2 Schooling, Employee Slack and Innovation for Manufacturing Firms

More information about the working paper series is available at the website of the Institute for Management Research: www.ru.nl/imr
Contact details
Annelied van UdenInstitute for Management ResearchP.O. Box 91086500 HK NijmegenThe NetherlandsTel: + 31 (0) 24 – 36 11436E-mail: [email protected]