Embed Size (px)
Citation preview
1
BULGARI GROUP
FRANCESCO TRAPANI – Chief Executive OfficerFLAVIA SPENA – Chief Financial and Organization Officer
RENATA CASARO – Head of IR
HSBC LUXURY CONFERENCE
Paris, June 3rd 2009
2
22.8
9.9%
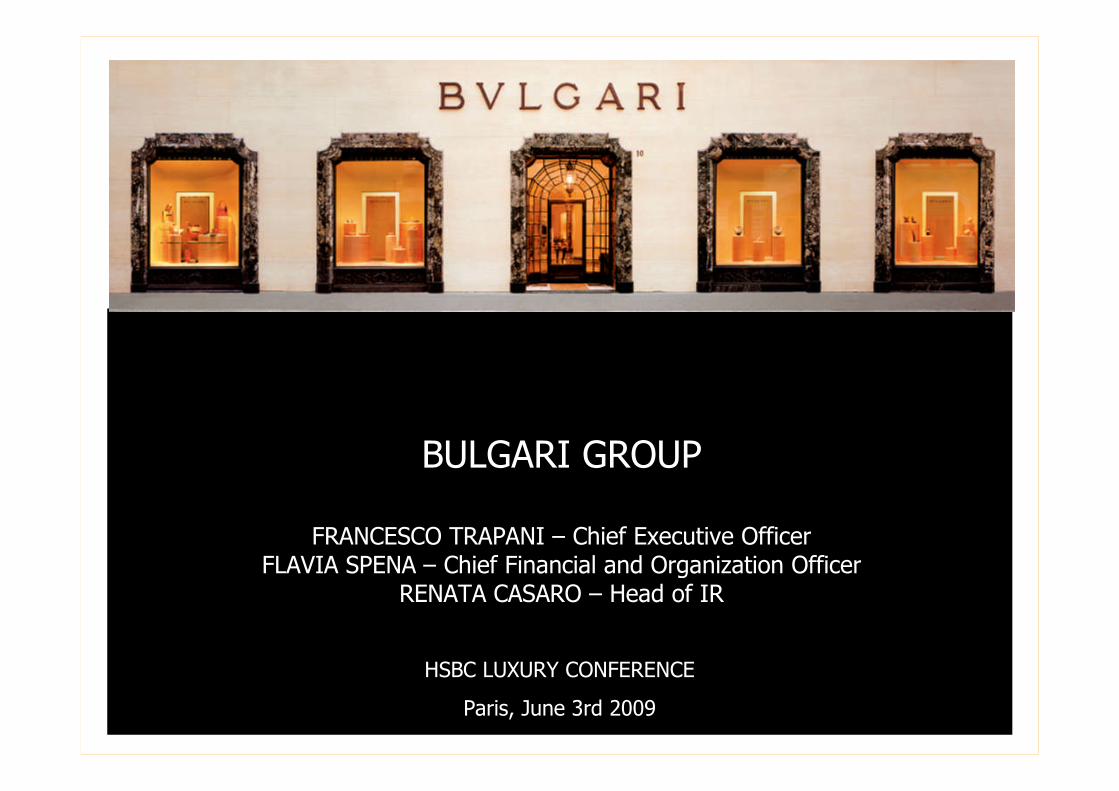
(29.3)
-16.5%
NET PROFIT (LOSS)
% on Sales
21.9
9.4%
(23.8)
-13.4%
EBIT(OPERATING LOSS)
% on Sales
-26.1%155.5
67.1%
115.0
64.6%
CONTRIBUTION MARGIN
% on Sales
-23.1%
-30.6%
231.7178.1REVENUES
REVENUES – AT COMP. FX
Q1 2009/Q12008
%
DELTA
Q1 2008
EUR M.
Q1 2009
EUR M.
EUR M.
Q1 2009 RELEASEFINANCIAL HIGHLIGHTS
* = Revenues in Directly Operated Stores decreased Mid Single-Digit at current exchange rates during Q1 09
DOS: - MSD*
3
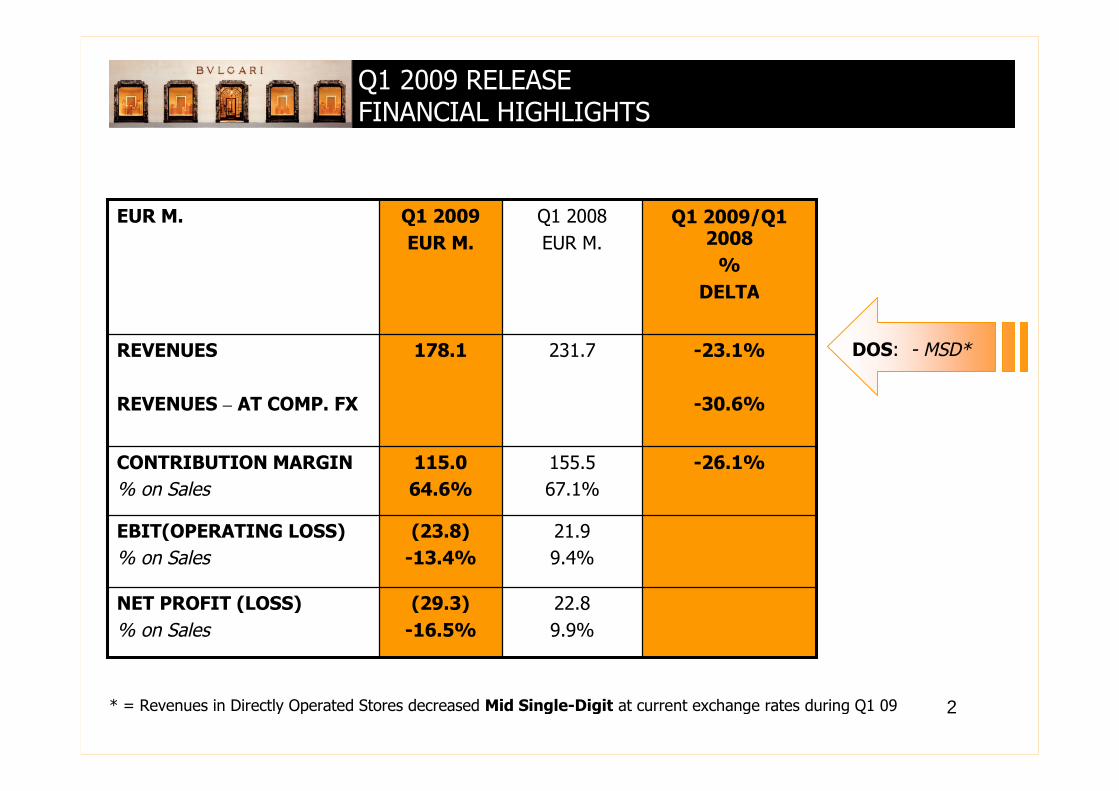
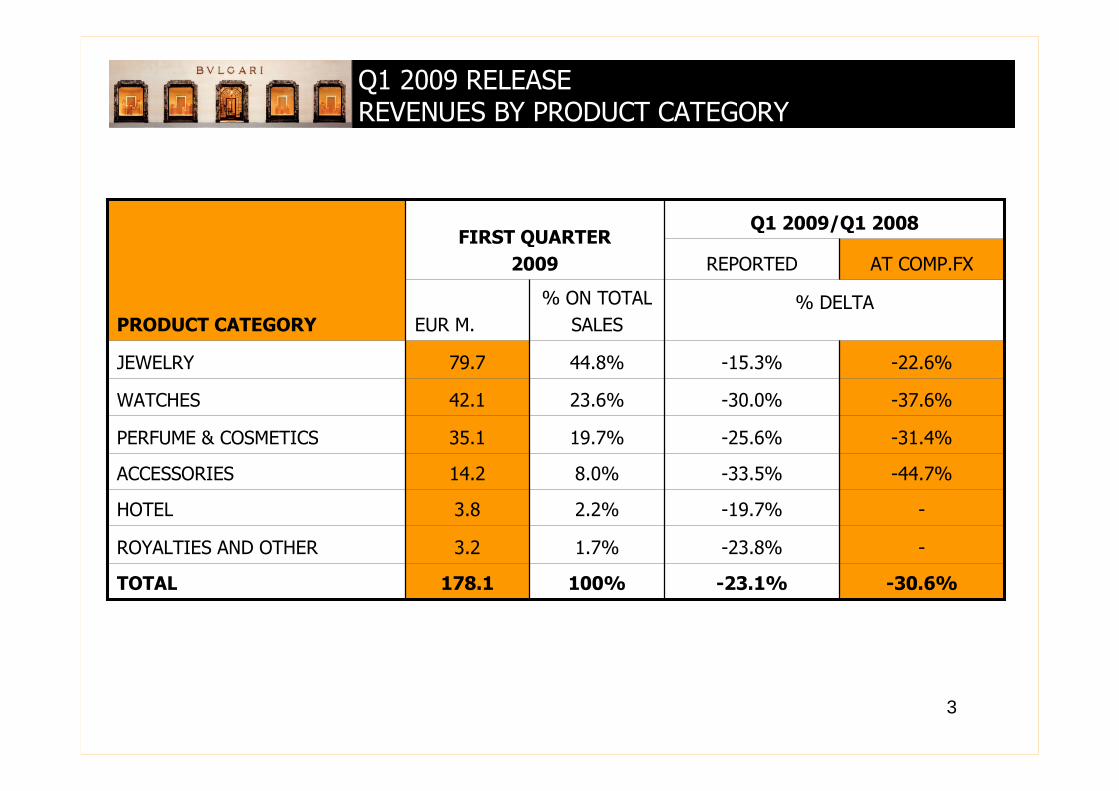
-44.7%-33.5%8.0%14.2ACCESSORIES
% ON TOTAL
SALESEUR M.% DELTA
-30.6%-23.1%100%178.1TOTAL
--23.8%1.7%3.2ROYALTIES AND OTHER
--19.7%2.2%3.8HOTEL
-31.4%-25.6%19.7%35.1PERFUME & COSMETICS
-37.6%-30.0%23.6%42.1WATCHES
-22.6%-15.3%44.8%79.7JEWELRY
AT COMP.FXREPORTED
Q1 2009/Q1 2008FIRST QUARTER
2009
PRODUCT CATEGORY
Q1 2009 RELEASEREVENUES BY PRODUCT CATEGORY
4
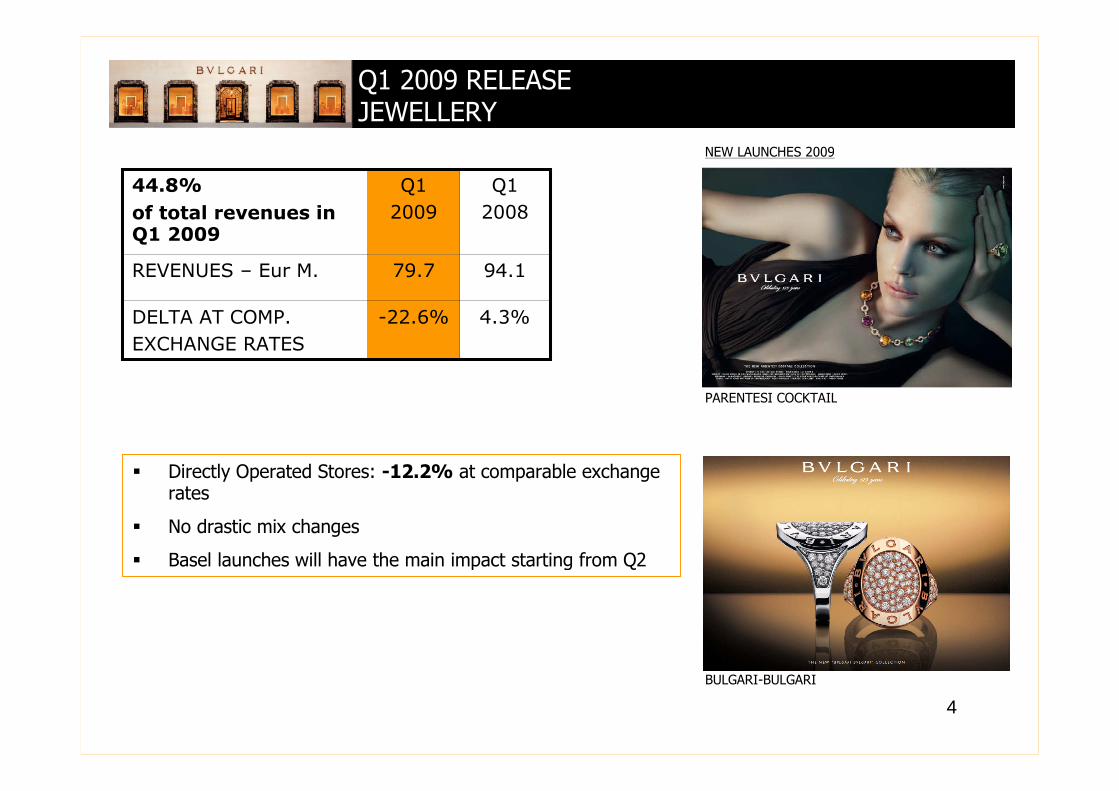
-22.6%
79.7
Q1
2009
Q1
2008
44.8%
of total revenues inQ1 2009
4.3%
94.1
DELTA AT COMP.
EXCHANGE RATES
REVENUES – Eur M.
PARENTESI COCKTAIL
Q1 2009 RELEASEJEWELLERY
BULGARI-BULGARI
Directly Operated Stores: -12.2% at comparable exchangerates
No drastic mix changes
Basel launches will have the main impact starting from Q2
NEW LAUNCHES 2009
5
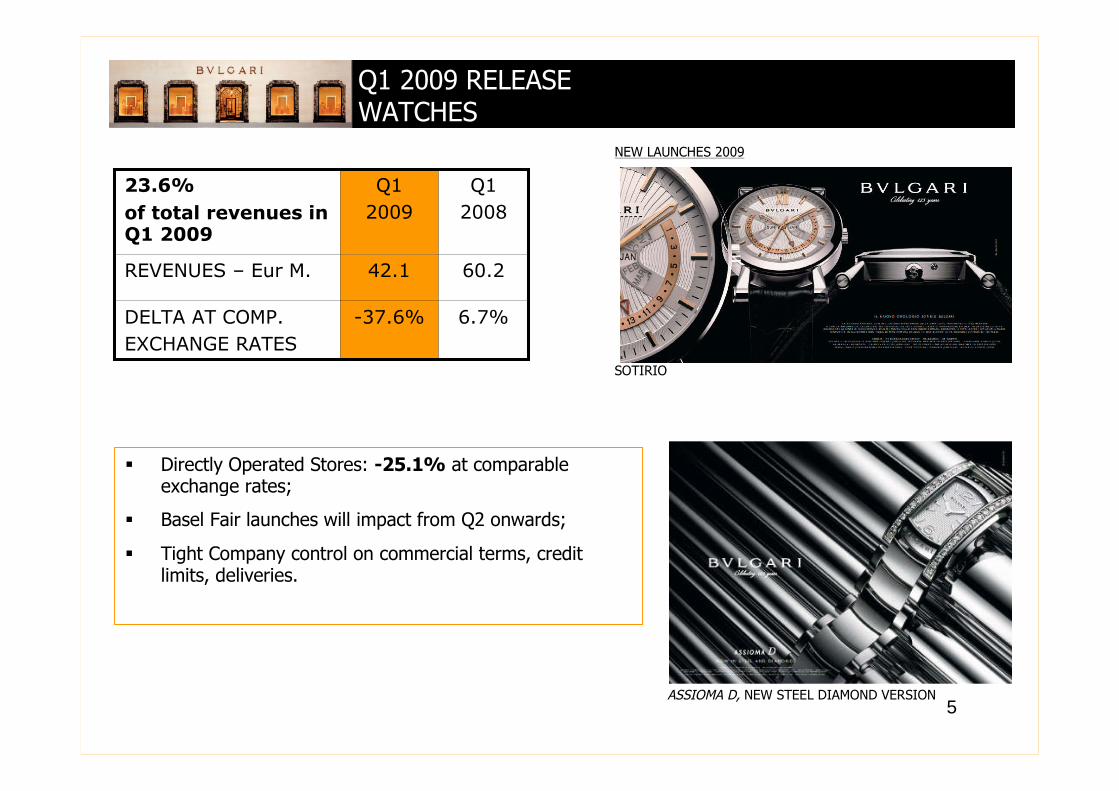
-37.6%
42.1
Q1
2009
Q1
2008
23.6%
of total revenues inQ1 2009
6.7%
60.2
DELTA AT COMP.
EXCHANGE RATES
REVENUES – Eur M.
SOTIRIO
Q1 2009 RELEASEWATCHES
Directly Operated Stores: -25.1% at comparableexchange rates;
Basel Fair launches will impact from Q2 onwards;
Tight Company control on commercial terms, creditlimits, deliveries.
ASSIOMA D, NEW STEEL DIAMOND VERSION
NEW LAUNCHES 2009
6
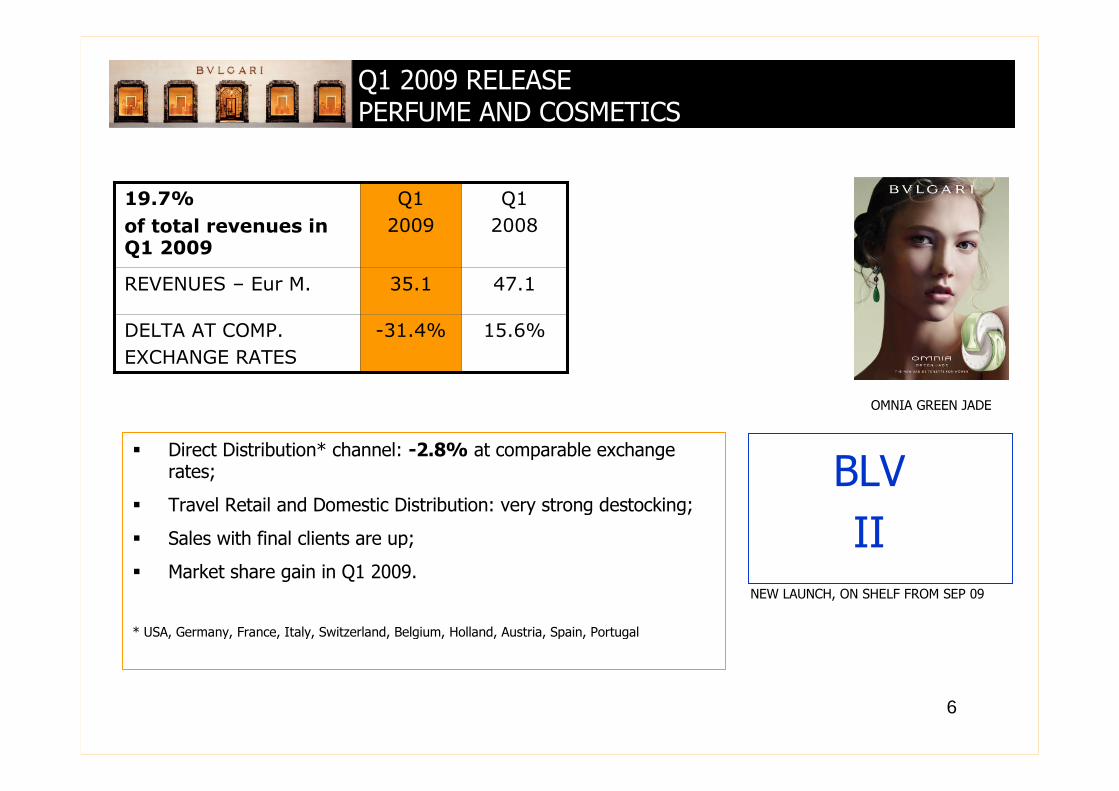
-31.4%
35.1
Q1
2009
Q1
2008
19.7%
of total revenues inQ1 2009
15.6%
47.1
DELTA AT COMP.
EXCHANGE RATES
REVENUES – Eur M.
NEW LAUNCH, ON SHELF FROM SEP 09
OMNIA GREEN JADE
Q1 2009 RELEASEPERFUME AND COSMETICS
Direct Distribution* channel: -2.8% at comparable exchangerates;
Travel Retail and Domestic Distribution: very strong destocking;
Sales with final clients are up;
Market share gain in Q1 2009.
* USA, Germany, France, Italy, Switzerland, Belgium, Holland, Austria, Spain, Portugal
BLV
II
7
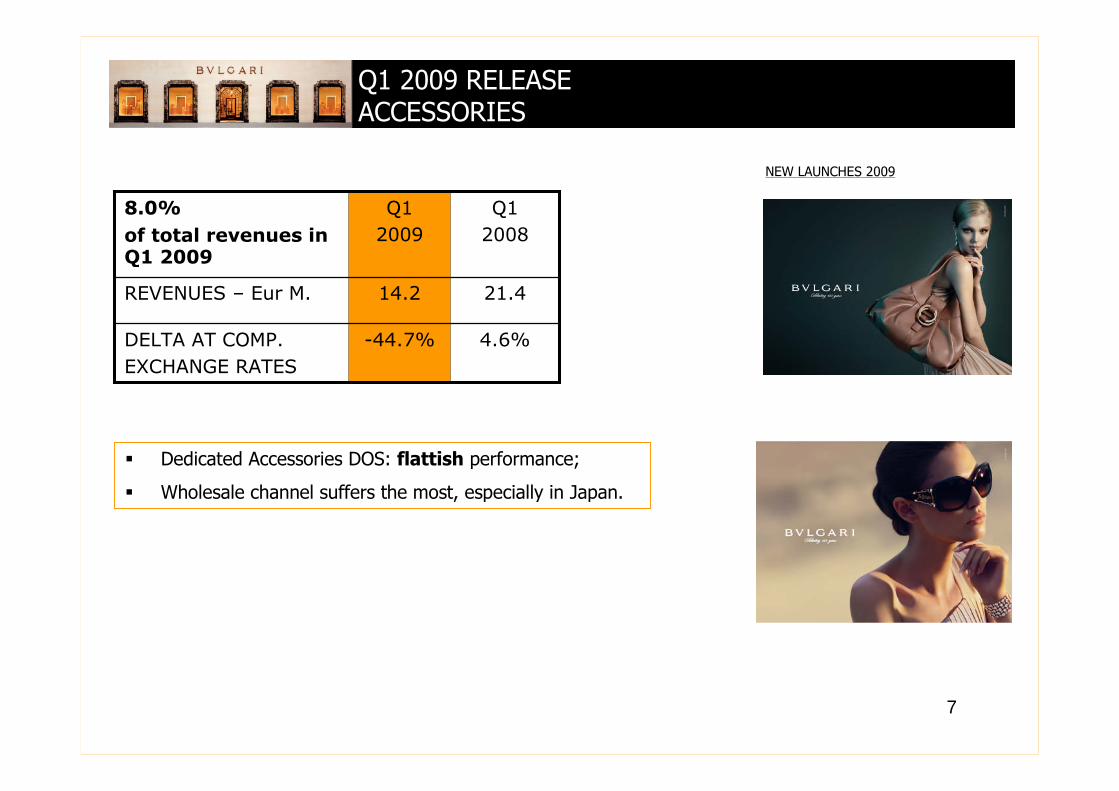
-44.7%
14.2
Q1
2009
Q1
2008
8.0%
of total revenues inQ1 2009
4.6%
21.4
DELTA AT COMP.
EXCHANGE RATES
REVENUES – Eur M.
Q1 2009 RELEASEACCESSORIES
Dedicated Accessories DOS: flattish performance;
Wholesale channel suffers the most, especially in Japan.
NEW LAUNCHES 2009
8
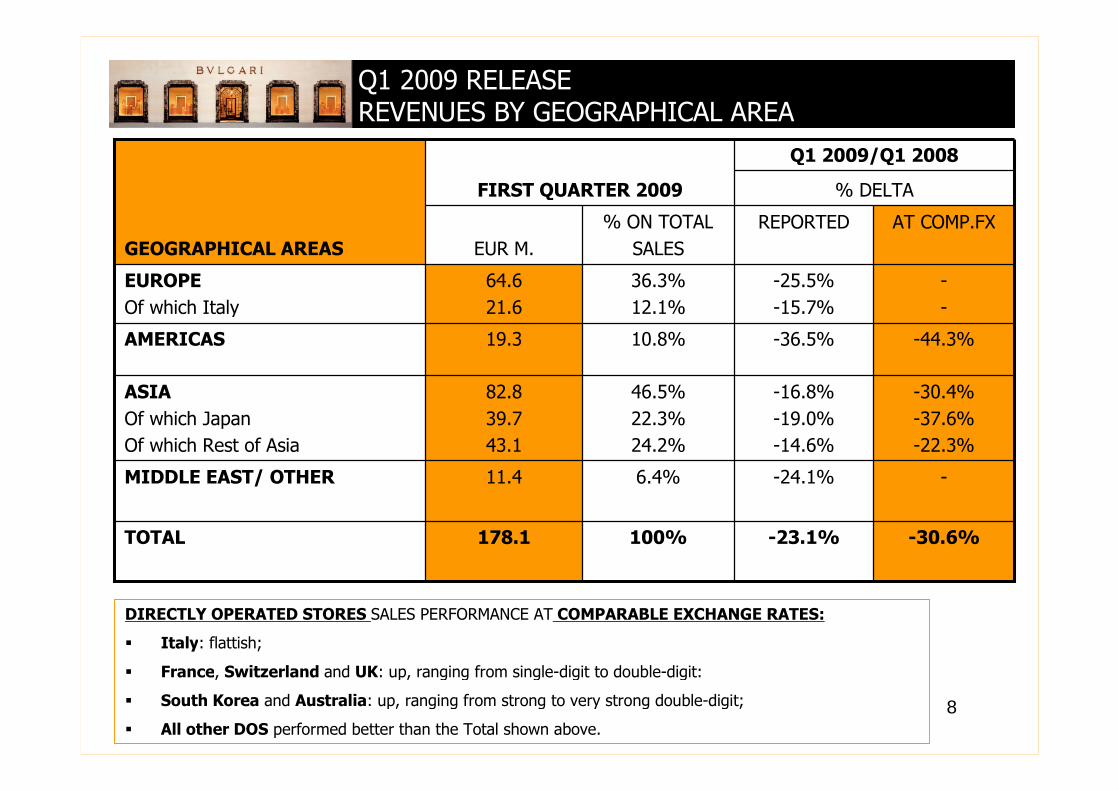
AT COMP.FX
-30.6%
-
-30.4%
-37.6%
-22.3%
-44.3%
-
-
-23.1%
-24.1%
-16.8%
-19.0%
-14.6%
-36.5%
-25.5%
-15.7%
REPORTED
% DELTA
Q1 2009/Q1 2008
100%178.1TOTAL
6.4%11.4MIDDLE EAST/ OTHER
46.5%
22.3%
24.2%
82.8
39.7
43.1
ASIA
Of which Japan
Of which Rest of Asia
10.8%19.3AMERICAS
36.3%
12.1%
64.6
21.6
EUROPE
Of which Italy
% ON TOTAL
SALESEUR M.
FIRST QUARTER 2009
GEOGRAPHICAL AREAS
Q1 2009 RELEASEREVENUES BY GEOGRAPHICAL AREA
DIRECTLY OPERATED STORES SALES PERFORMANCE AT COMPARABLE EXCHANGE RATES:
Italy: flattish;
France, Switzerland and UK: up, ranging from single-digit to double-digit:
South Korea and Australia: up, ranging from strong to very strong double-digit;
All other DOS performed better than the Total shown above.
9
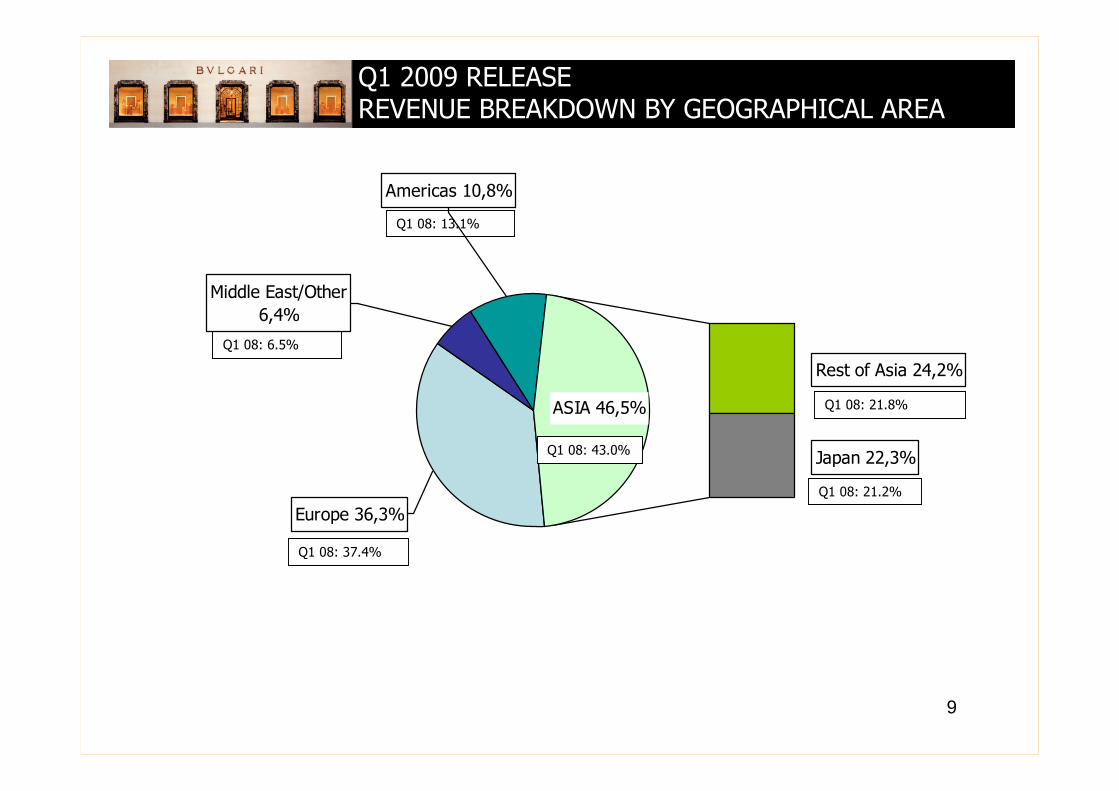
Rest of Asia 24,2%
Japan 22,3%
ASIA 46,5%
Americas 10,8%
Middle East/Other
6,4%
Europe 36,3%
Q1 2009 RELEASEREVENUE BREAKDOWN BY GEOGRAPHICAL AREA
Q1 08: 37.4%
Q1 08: 6.5%
Q1 08: 13.1%
Q1 08: 43.0%
Q1 08: 21.2%
Q1 08: 21.8%
10
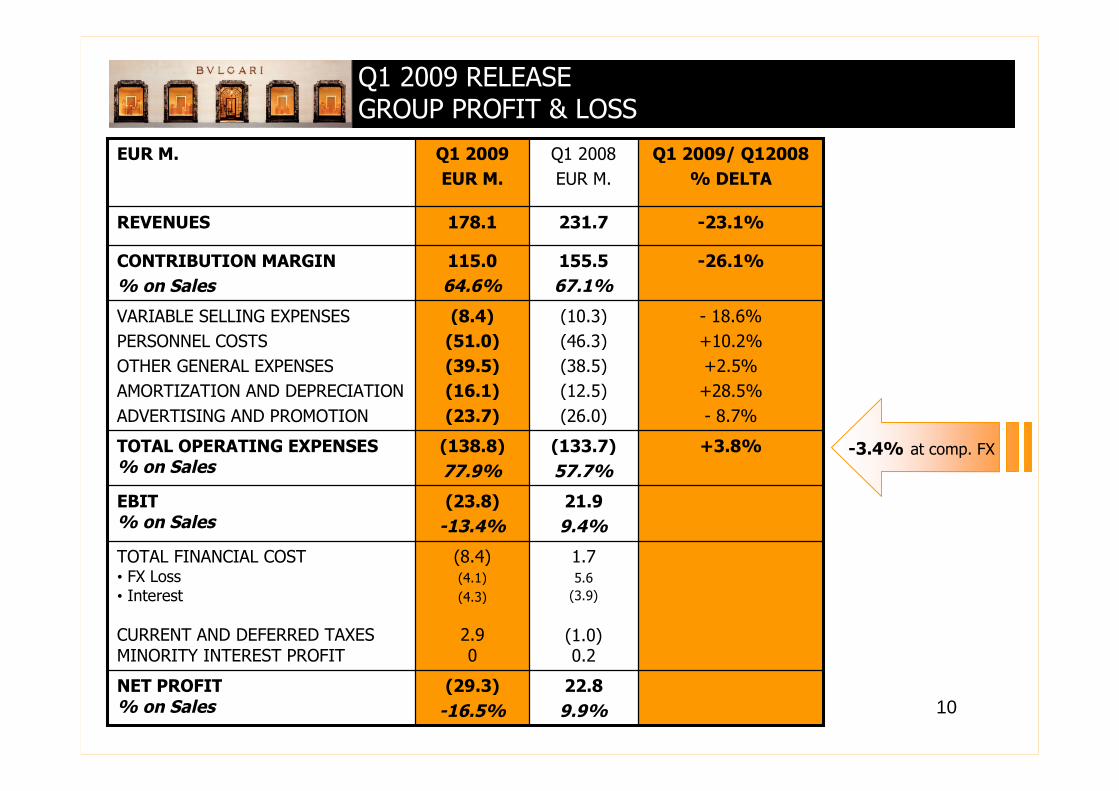
+3.8%(133.7)
57.7%
(138.8)
77.9%
TOTAL OPERATING EXPENSES% on Sales
21.9
9.4%
(23.8)
-13.4%
EBIT% on Sales
1.75.6
(3.9)
(1.0)0.2
(8.4)(4.1)
(4.3)
2.90
TOTAL FINANCIAL COST• FX Loss• Interest
CURRENT AND DEFERRED TAXESMINORITY INTEREST PROFIT
(29.3)
-16.5%
(8.4)
(51.0)
(39.5)
(16.1)
(23.7)
115.0
64.6%
178.1
Q1 2009
EUR M.
- 18.6%
+10.2%
+2.5%
+28.5%
- 8.7%
-26.1%
-23.1%
Q1 2009/ Q12008
% DELTA
(10.3)
(46.3)
(38.5)
(12.5)
(26.0)
VARIABLE SELLING EXPENSES
PERSONNEL COSTS
OTHER GENERAL EXPENSES
AMORTIZATION AND DEPRECIATION
ADVERTISING AND PROMOTION
22.8
9.9%
NET PROFIT% on Sales
155.5
67.1%
CONTRIBUTION MARGIN
% on Sales
231.7REVENUES
Q1 2008
EUR M.
EUR M.
Q1 2009 RELEASEGROUP PROFIT & LOSS
-3.4% at comp. FX
11
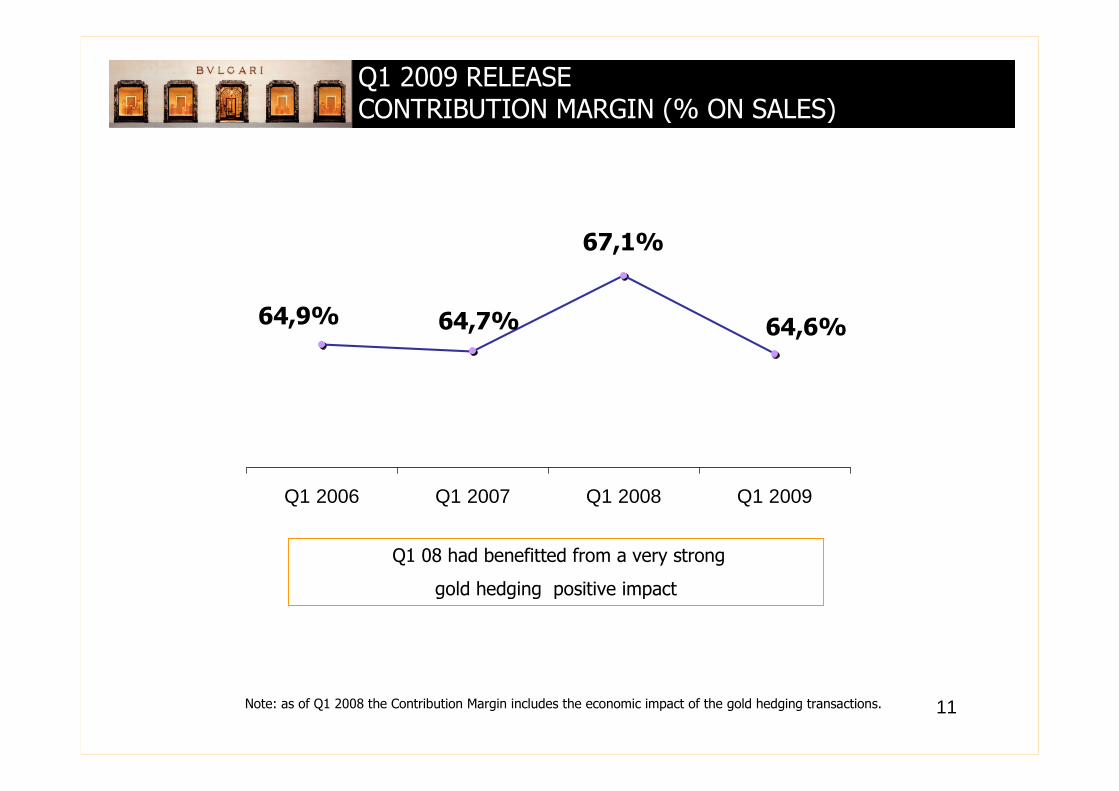
64,7%
67,1%
64,6%64,9%
Q1 2006 Q1 2007 Q1 2008 Q1 2009
Q1 2009 RELEASECONTRIBUTION MARGIN (% ON SALES)
Note: as of Q1 2008 the Contribution Margin includes the economic impact of the gold hedging transactions.
Q1 08 had benefitted from a very strong
gold hedging positive impact
12
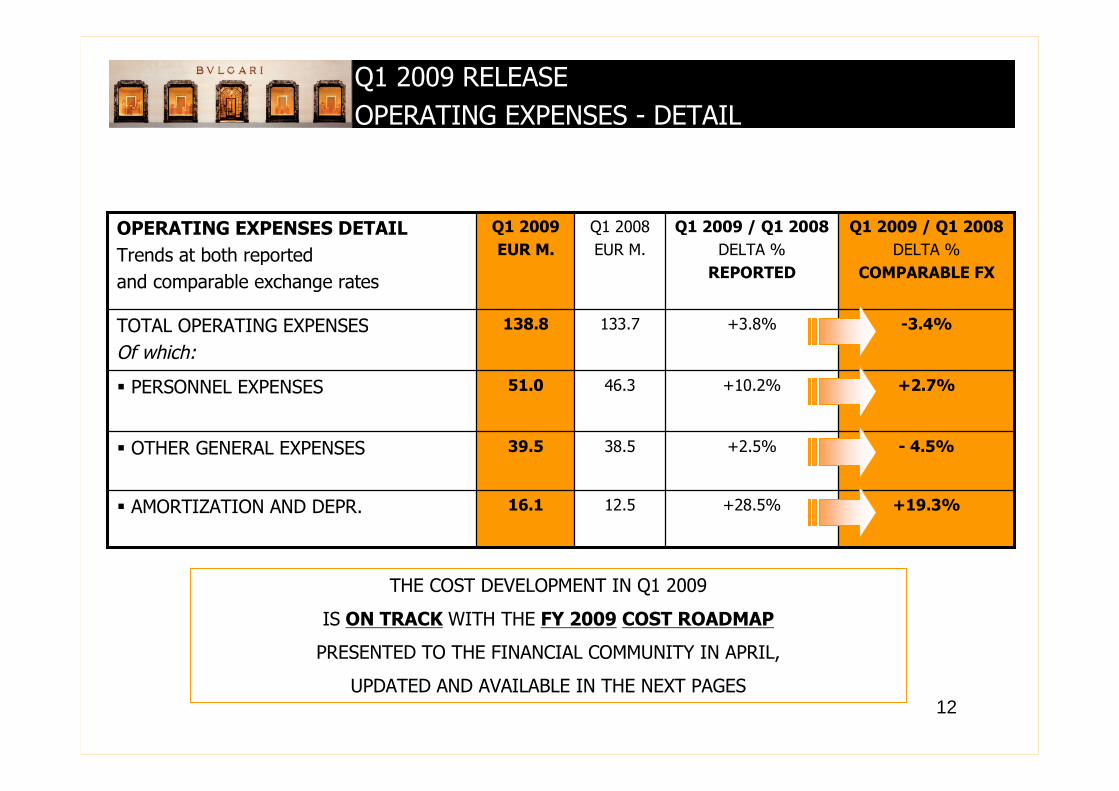
-3.4%+3.8%133.7138.8TOTAL OPERATING EXPENSES
Of which:
+28.5%
+2.5%
+10.2%
Q1 2009 / Q1 2008
DELTA %
REPORTED
- 4.5%38.539.5 OTHER GENERAL EXPENSES
+19.3%12.516.1 AMORTIZATION AND DEPR.
+2.7%46.351.0 PERSONNEL EXPENSES
Q1 2009 / Q1 2008
DELTA %
COMPARABLE FX
Q1 2008
EUR M.
Q1 2009
EUR M.
OPERATING EXPENSES DETAIL
Trends at both reported
and comparable exchange rates
Q1 2009 RELEASE
OPERATING EXPENSES - DETAIL
THE COST DEVELOPMENT IN Q1 2009
IS ON TRACK WITH THE FY 2009 COST ROADMAP
PRESENTED TO THE FINANCIAL COMMUNITY IN APRIL,
UPDATED AND AVAILABLE IN THE NEXT PAGES
13
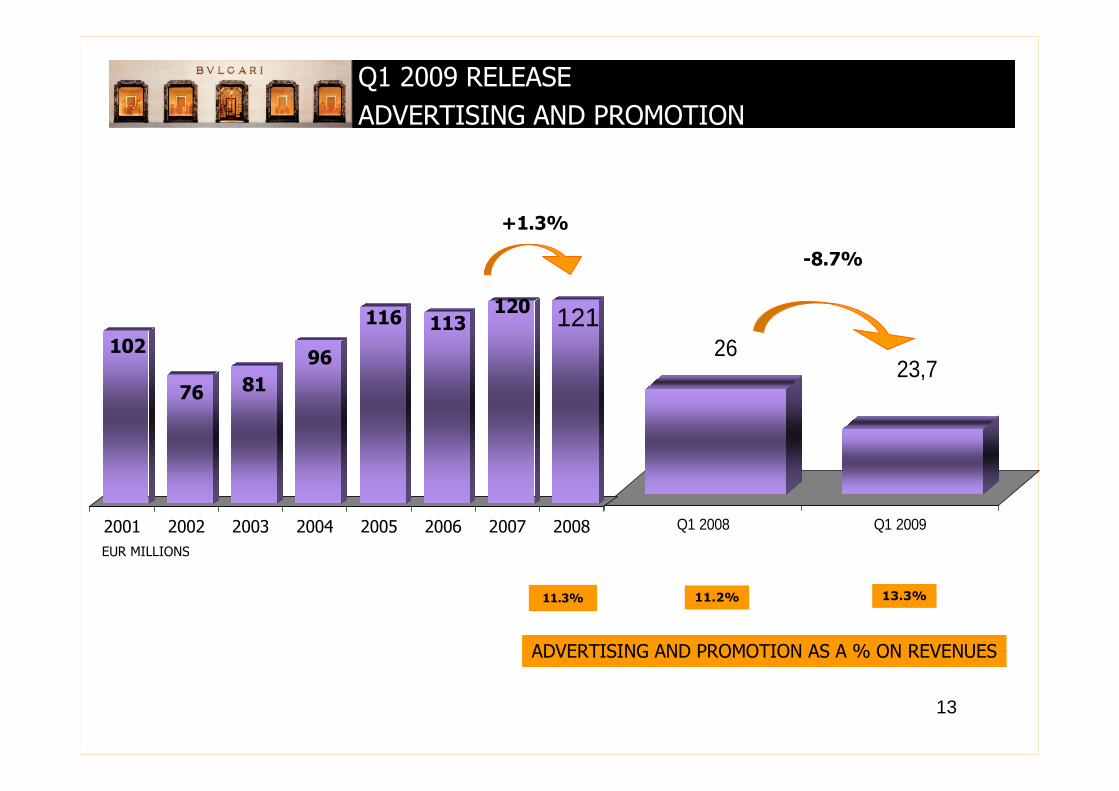
2623,7
Q1 2008 Q1 2009
11.2%
Q1 2009 RELEASE
ADVERTISING AND PROMOTION
102
76 81
96
116 113120
121
2001 2002 2003 2004 2005 2006 2007 2008
ADVERTISING AND PROMOTION AS A % ON REVENUES
+1.3%
11.3% 13.3%
-8.7%
EUR MILLIONS

14
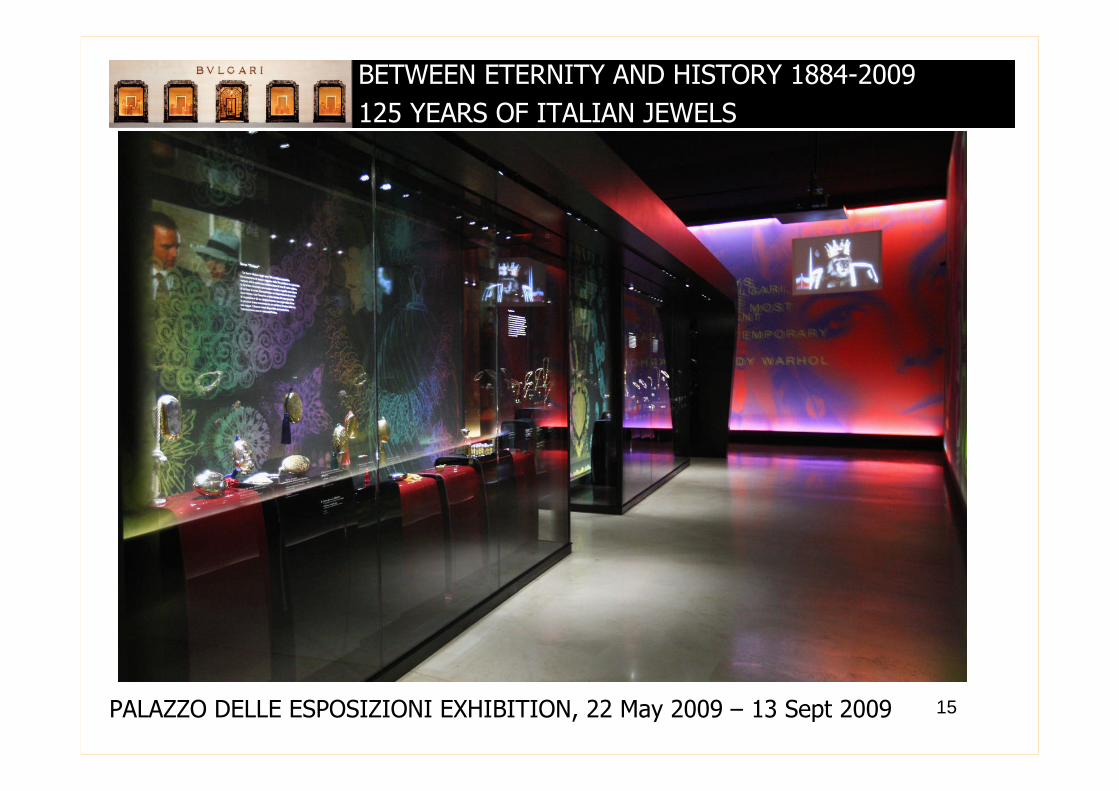
BETWEEN ETERNITY AND HISTORY 1884-2009
125 YEARS OF ITALIAN JEWELS
PALAZZO DELLE ESPOSIZIONI EXHIBITION, 22 May 2009 – 13 Sept 2009
15
BETWEEN ETERNITY AND HISTORY 1884-2009
125 YEARS OF ITALIAN JEWELS
PALAZZO DELLE ESPOSIZIONI EXHIBITION, 22 May 2009 – 13 Sept 2009

16
BETWEEN ETERNITY AND HISTORY 1884-2009
125 YEARS OF ITALIAN JEWELS
OPENING – JESSICA ALBA
17
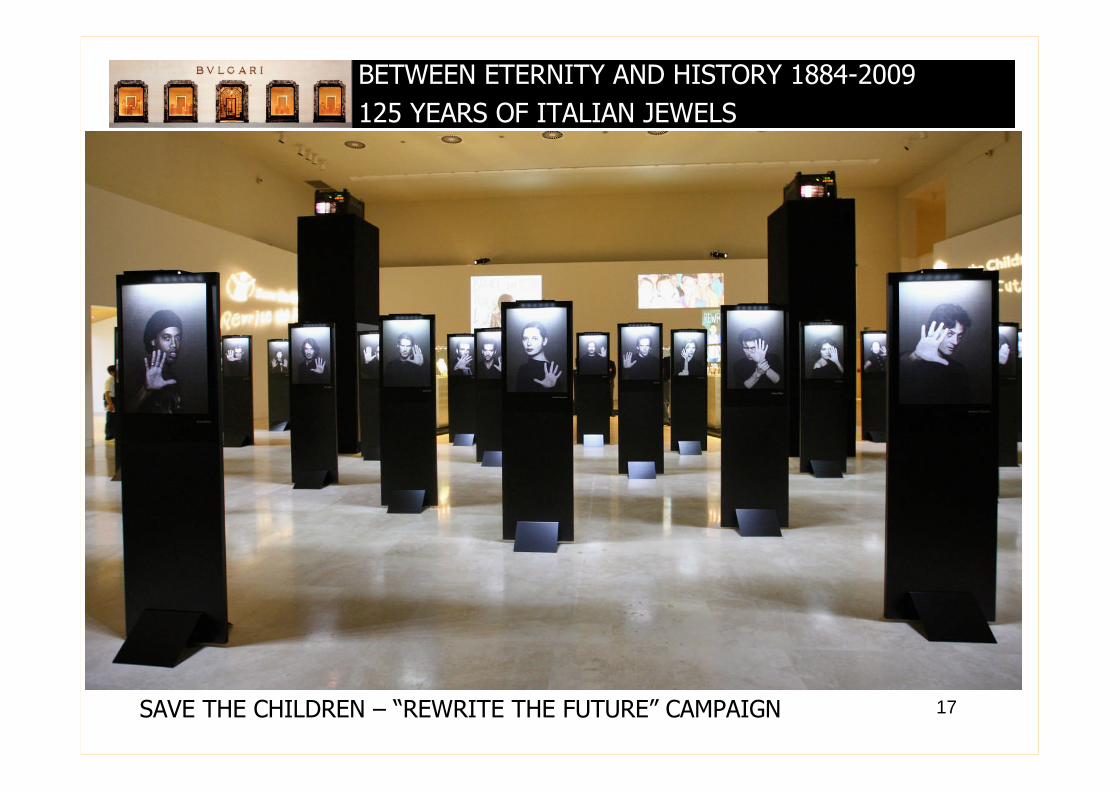
BETWEEN ETERNITY AND HISTORY 1884-2009
125 YEARS OF ITALIAN JEWELS
SAVE THE CHILDREN – “REWRITE THE FUTURE” CAMPAIGN
18
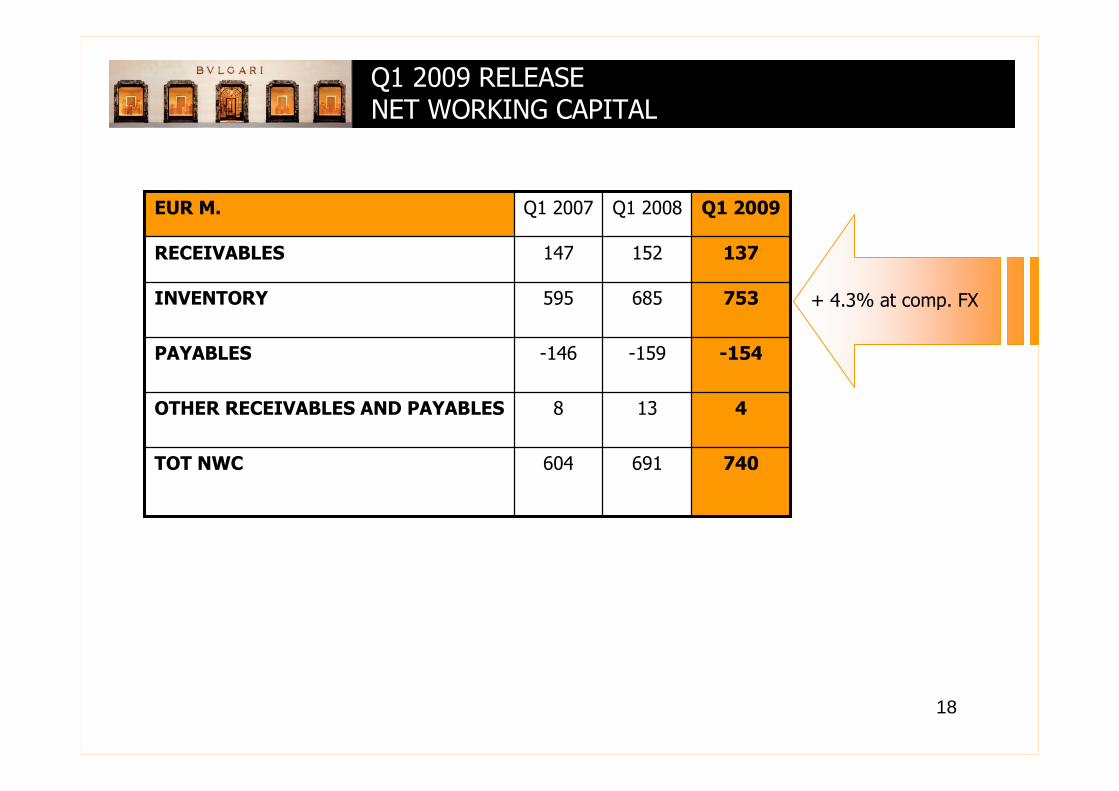
Q1 2009 RELEASENET WORKING CAPITAL
691
13
-159
685
152
Q1 2008
604
8
-146
595
147
Q1 2007
-154PAYABLES
740
4
753
137
Q1 2009
TOT NWC
OTHER RECEIVABLES AND PAYABLES
INVENTORY
RECEIVABLES
EUR M.
+ 4.3% at comp. FX
19
(184.8)
(43.9)
26.7
0.0
(19.4)
(16.0)
0.0
(1.4)
(2.0)
(86.6)
35.5
(140.9)
MARCH
2008
(80.6)
(33.7)
(9.5)
0.0
(6.5)
(12.2)
(2.8)
(0.6)
9.1
(51.3)
33.6
(46.9)
MARCH2007
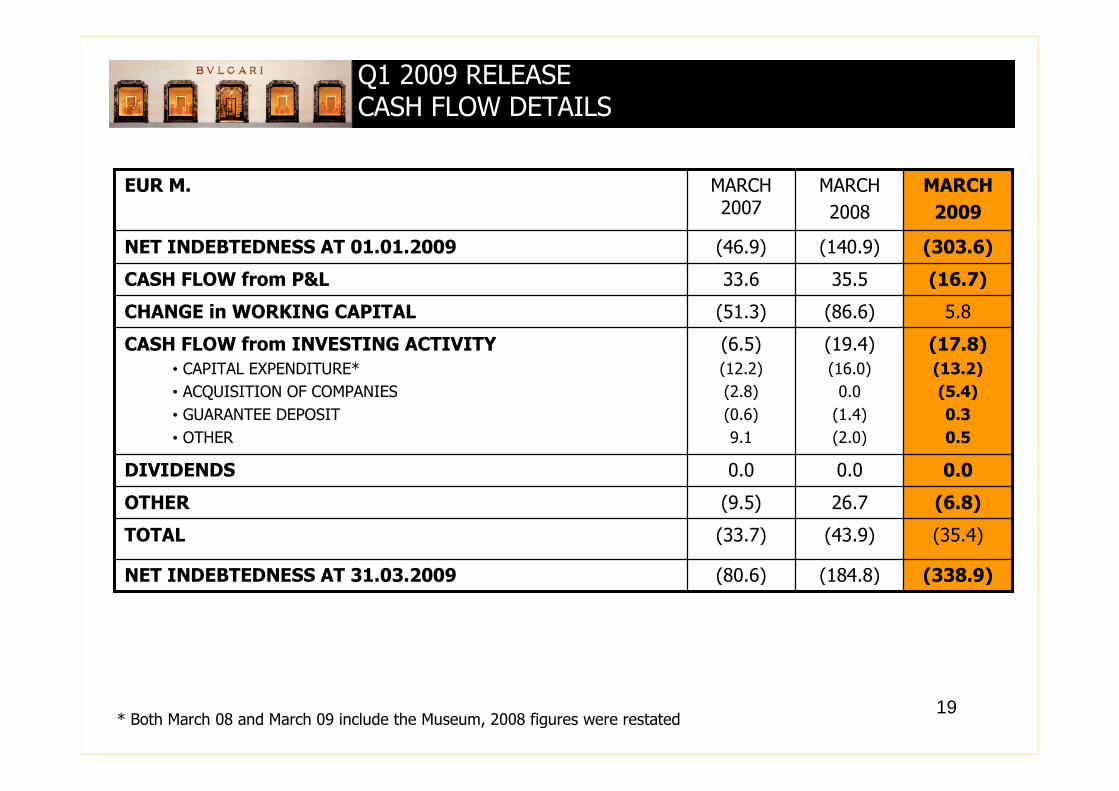
(35.4)TOTAL
(338.9)NET INDEBTEDNESS AT 31.03.2009
(6.8)OTHER
0.0DIVIDENDS
(16.7)CASH FLOW from P&L
5.8CHANGE in WORKING CAPITAL
(17.8)
(13.2)
(5.4)
0.3
0.5
CASH FLOW from INVESTING ACTIVITY
• CAPITAL EXPENDITURE*
• ACQUISITION OF COMPANIES
• GUARANTEE DEPOSIT
• OTHER
(303.6)
MARCH
2009
NET INDEBTEDNESS AT 01.01.2009
EUR M.
Q1 2009 RELEASECASH FLOW DETAILS
* Both March 08 and March 09 include the Museum, 2008 figures were restated
20
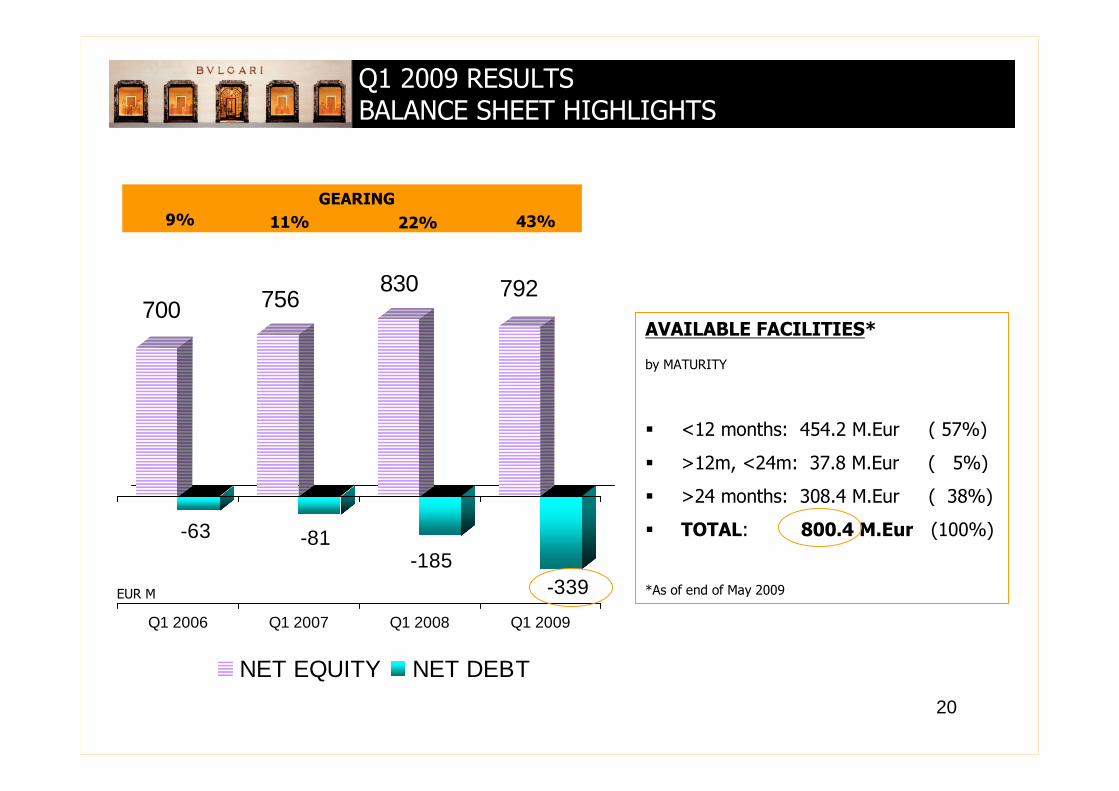
700
-63
756
-81
830
-185
792
-339
Q1 2006 Q1 2007 Q1 2008 Q1 2009
NET EQUITY NET DEBT
GEARING
9% 11%
Q1 2009 RESULTSBALANCE SHEET HIGHLIGHTS
22% 43%
AVAILABLE FACILITIES*
by MATURITY
<12 months: 454.2 M.Eur ( 57%)
>12m, <24m: 37.8 M.Eur ( 5%)
>24 months: 308.4 M.Eur ( 38%)
TOTAL: 800.4 M.Eur (100%)
*As of end of May 2009EUR M
21
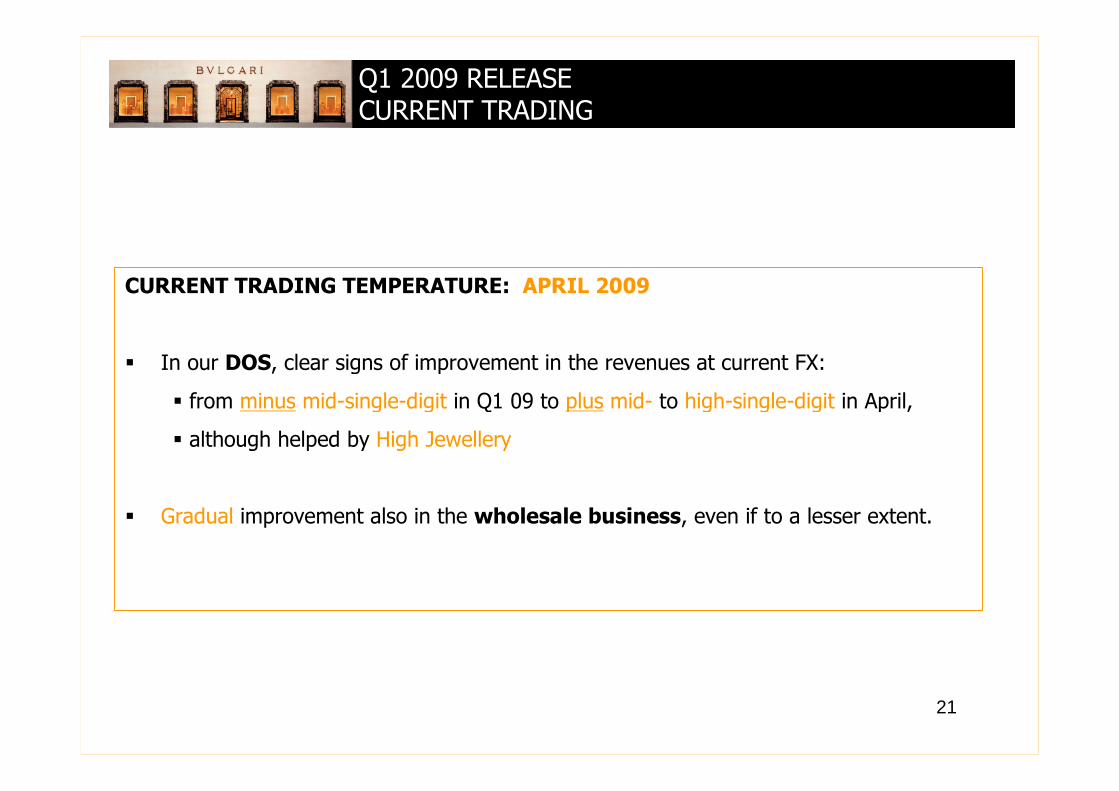
Q1 2009 RELEASECURRENT TRADING
CURRENT TRADING TEMPERATURE: APRIL 2009
In our DOS, clear signs of improvement in the revenues at current FX:
from minus mid-single-digit in Q1 09 to plus mid- to high-single-digit in April,
although helped by High Jewellery
Gradual improvement also in the wholesale business, even if to a lesser extent.
22
COSTS ROADMAP FOR 2009
AND
SELL-SIDE ANALYSTS’ FY2009 CONSENSUS*
*calculated on 25 broker estimates received from May 13 to May 25 2009
23
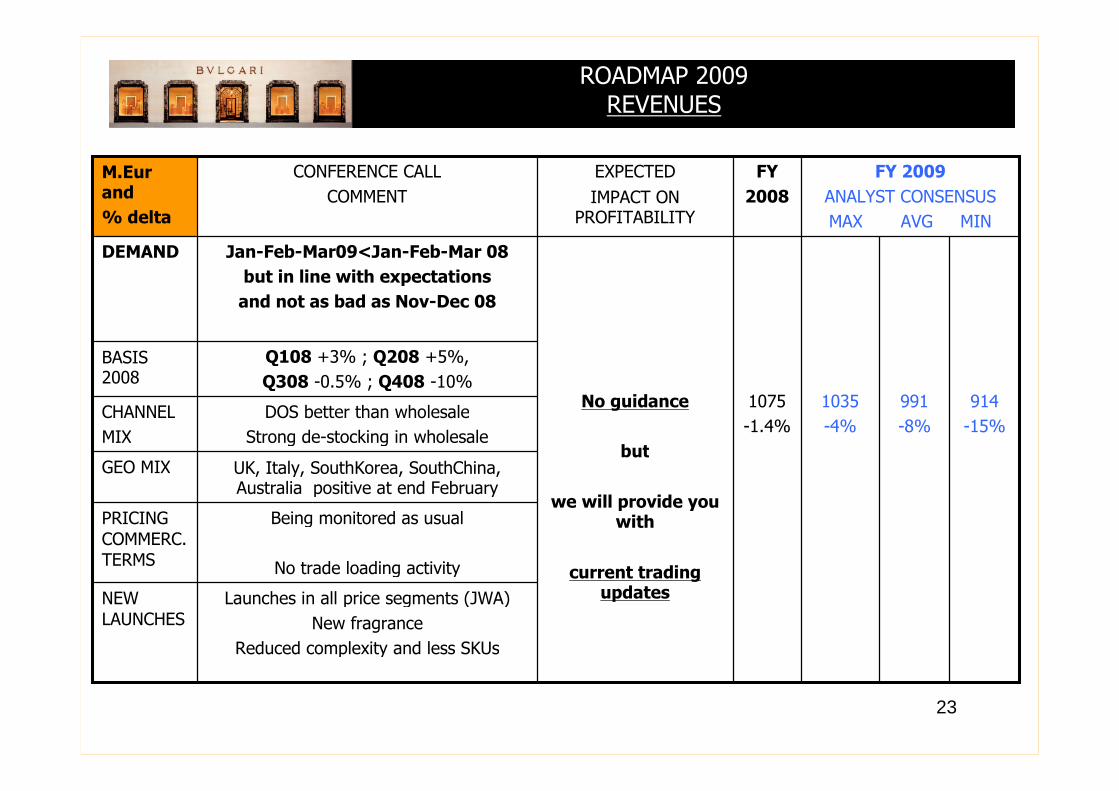
ROADMAP 2009REVENUES
991
-8%
1035
-4%
1075
-1.4%
FY
2008
Launches in all price segments (JWA)
New fragrance
Reduced complexity and less SKUs
Being monitored as usual
No trade loading activity
UK, Italy, SouthKorea, SouthChina,Australia positive at end February
DOS better than wholesale
Strong de-stocking in wholesale
Q108 +3% ; Q208 +5%,
Q308 -0.5% ; Q408 -10%
Jan-Feb-Mar09<Jan-Feb-Mar 08
but in line with expectations
and not as bad as Nov-Dec 08
CONFERENCE CALL
COMMENT
No guidance
but
we will provide youwith
current tradingupdates
EXPECTED
IMPACT ONPROFITABILITY
914
-15%
FY 2009
ANALYST CONSENSUS
MAX AVG MIN
NEWLAUNCHES
BASIS2008
CHANNEL
MIX
GEO MIX
PRICINGCOMMERC.TERMS
DEMAND
M.Eurand
% delta
24
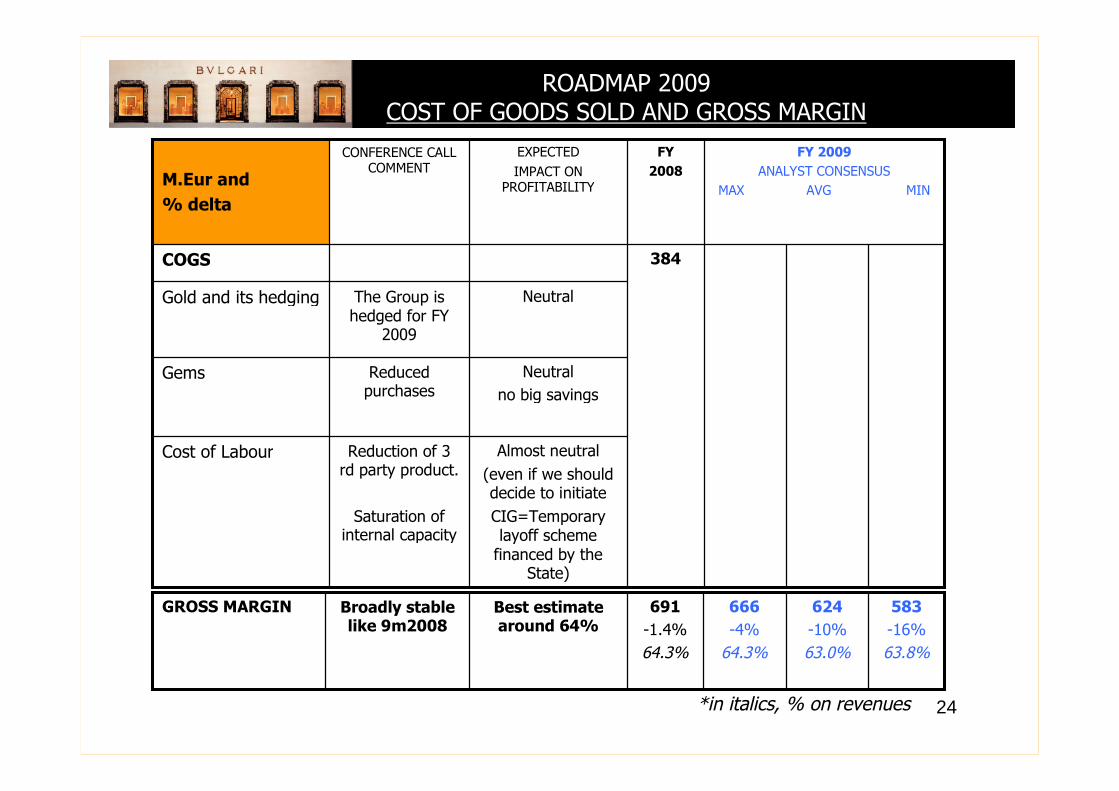
ROADMAP 2009COST OF GOODS SOLD AND GROSS MARGIN
NeutralThe Group ishedged for FY
2009
Gold and its hedging
384
FY
2008
Reduction of 3rd party product.
Saturation ofinternal capacity
Reducedpurchases
CONFERENCE CALLCOMMENT
Almost neutral
(even if we shoulddecide to initiate
CIG=Temporarylayoff scheme
financed by theState)
Neutral
no big savings
EXPECTED
IMPACT ONPROFITABILITY
FY 2009
ANALYST CONSENSUS
MAX AVG MIN
Gems
Cost of Labour
COGS
M.Eur and
% delta
624
-10%
63.0%
666
-4%
64.3%
691
-1.4%
64.3%
Broadly stablelike 9m2008
Best estimatearound 64%
583
-16%
63.8%
GROSS MARGIN
*in italics, % on revenues
25
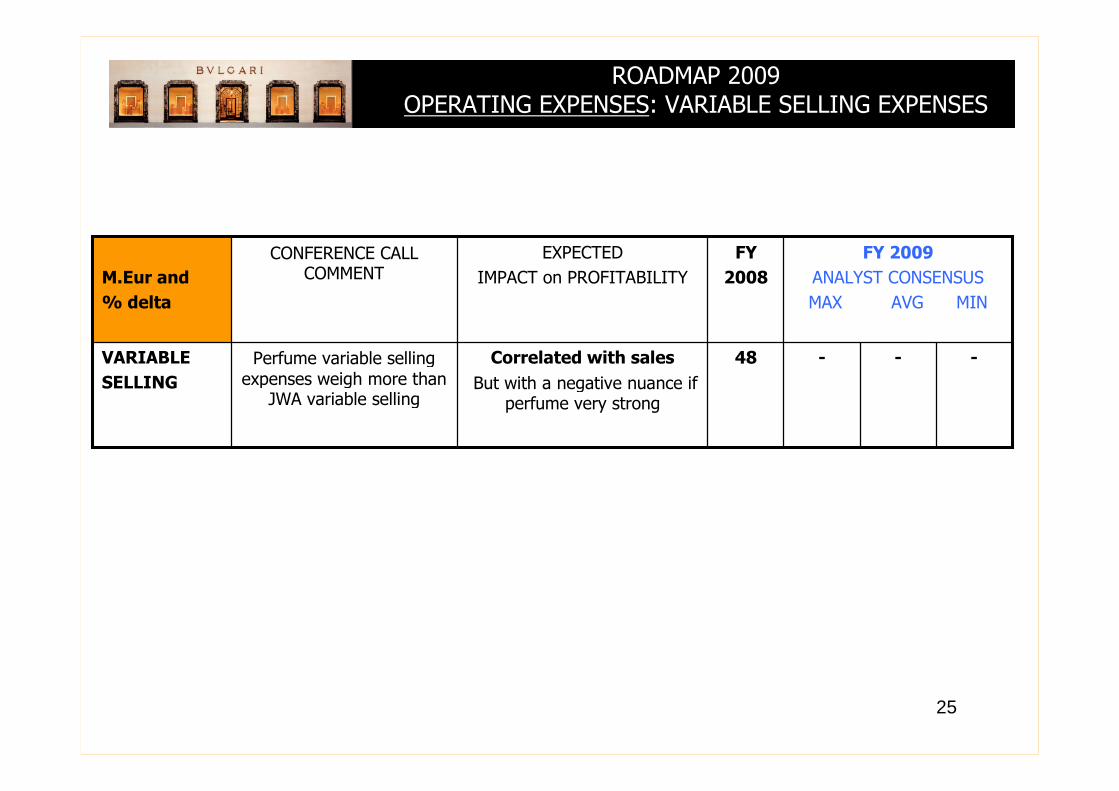
ROADMAP 2009OPERATING EXPENSES: VARIABLE SELLING EXPENSES
---48Correlated with sales
But with a negative nuance ifperfume very strong
VARIABLE
SELLING
Perfume variable sellingexpenses weigh more than
JWA variable selling
CONFERENCE CALLCOMMENT
FY
2008
EXPECTED
IMPACT on PROFITABILITY
FY 2009
ANALYST CONSENSUS
MAX AVG MIN
M.Eur and
% delta
26
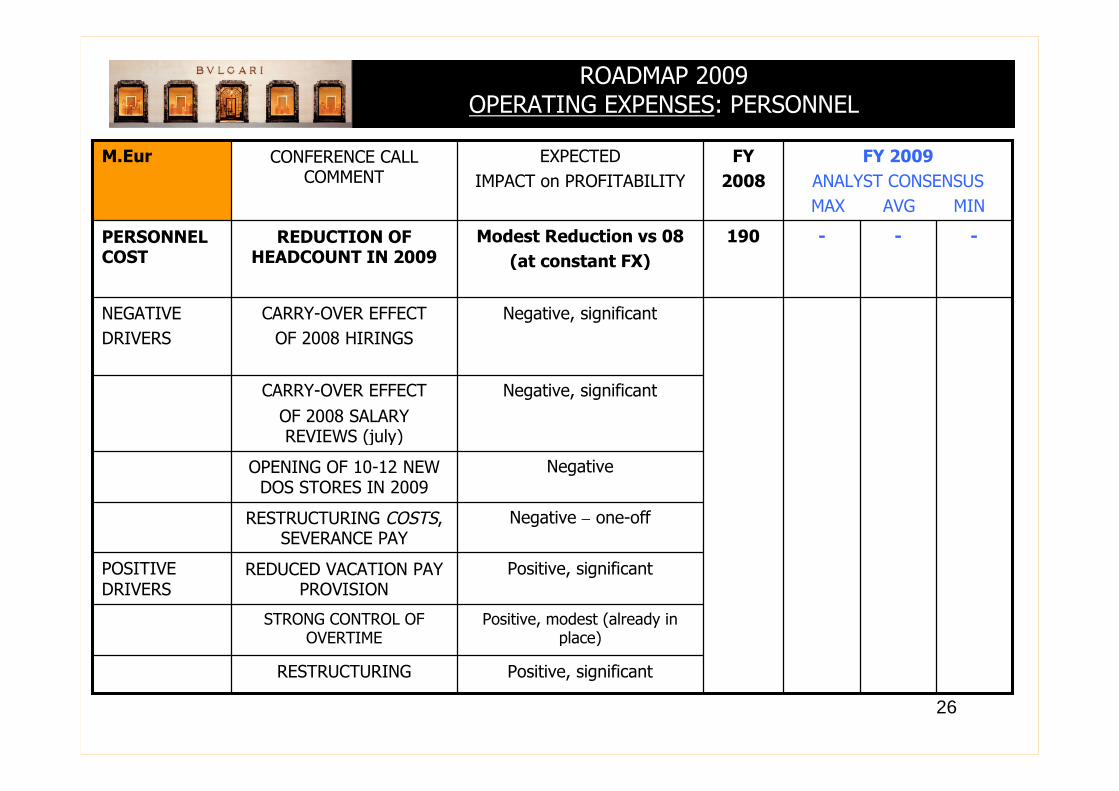
ROADMAP 2009OPERATING EXPENSES: PERSONNEL
---190Modest Reduction vs 08
(at constant FX)
REDUCTION OFHEADCOUNT IN 2009
PERSONNELCOST
RESTRUCTURING
STRONG CONTROL OFOVERTIME
REDUCED VACATION PAYPROVISION
RESTRUCTURING COSTS,SEVERANCE PAY
OPENING OF 10-12 NEWDOS STORES IN 2009
CARRY-OVER EFFECT
OF 2008 SALARYREVIEWS (july)
CARRY-OVER EFFECT
OF 2008 HIRINGS
CONFERENCE CALLCOMMENT
FY
2008
Positive, significant
Positive, modest (already inplace)
Positive, significant
Negative – one-off
Negative
Negative, significant
Negative, significant
EXPECTED
IMPACT on PROFITABILITY
FY 2009
ANALYST CONSENSUS
MAX AVG MIN
POSITIVEDRIVERS
NEGATIVE
DRIVERS
M.Eur
27
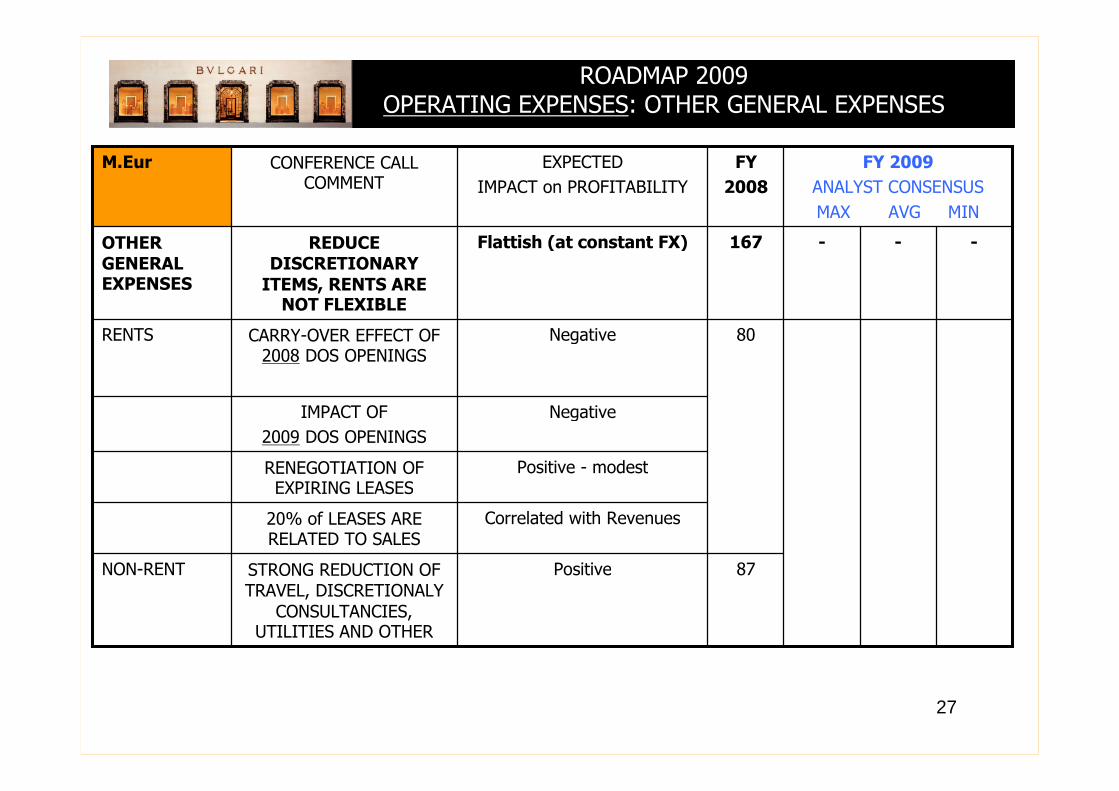
ROADMAP 2009OPERATING EXPENSES: OTHER GENERAL EXPENSES
87
---167Flattish (at constant FX)REDUCEDISCRETIONARY
ITEMS, RENTS ARENOT FLEXIBLE
OTHERGENERALEXPENSES
STRONG REDUCTION OFTRAVEL, DISCRETIONALY
CONSULTANCIES,UTILITIES AND OTHER
20% of LEASES ARERELATED TO SALES
RENEGOTIATION OFEXPIRING LEASES
IMPACT OF
2009 DOS OPENINGS
CARRY-OVER EFFECT OF2008 DOS OPENINGS
CONFERENCE CALLCOMMENT
80
FY
2008
Positive
Correlated with Revenues
Positive - modest
Negative
Negative
EXPECTED
IMPACT on PROFITABILITY
FY 2009
ANALYST CONSENSUS
MAX AVG MIN
NON-RENT
RENTS
M.Eur
28
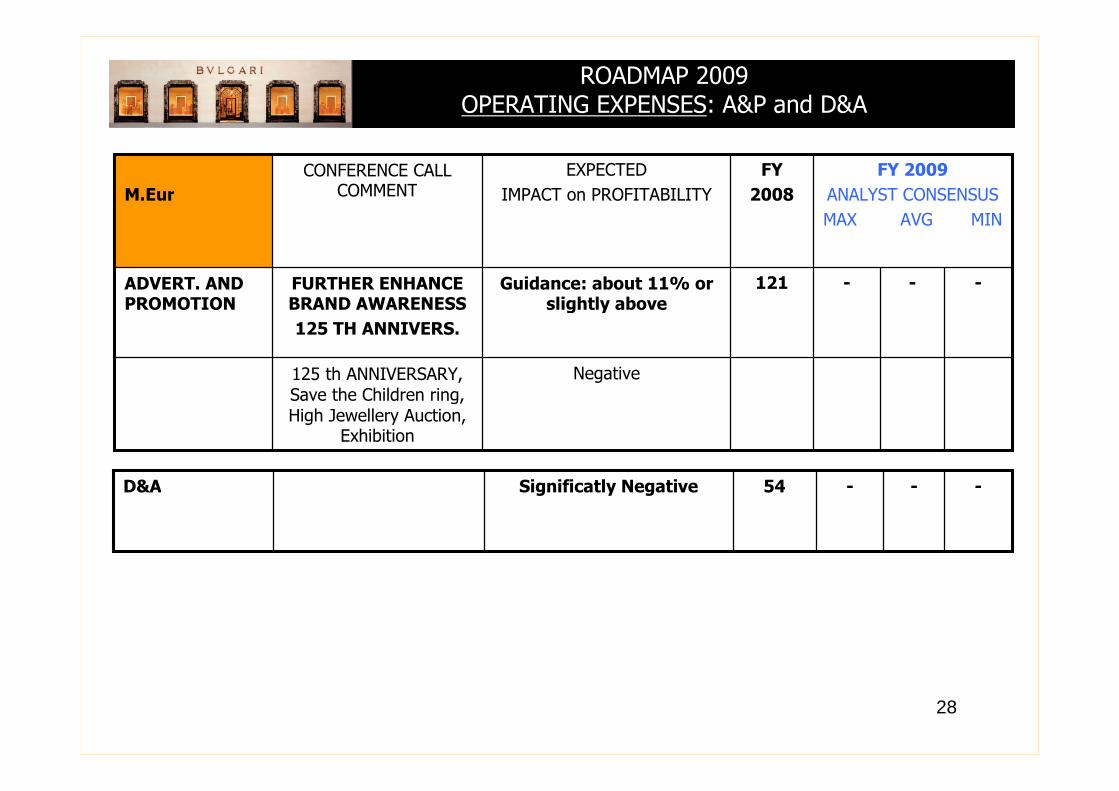
ROADMAP 2009OPERATING EXPENSES: A&P and D&A
---121Guidance: about 11% orslightly above
FURTHER ENHANCEBRAND AWARENESS
125 TH ANNIVERS.
ADVERT. ANDPROMOTION
125 th ANNIVERSARY,Save the Children ring,High Jewellery Auction,
Exhibition
CONFERENCE CALLCOMMENT
FY
2008
Negative
EXPECTED
IMPACT on PROFITABILITY
FY 2009
ANALYST CONSENSUS
MAX AVG MIN
M.Eur
---54Significatly NegativeD&A
29
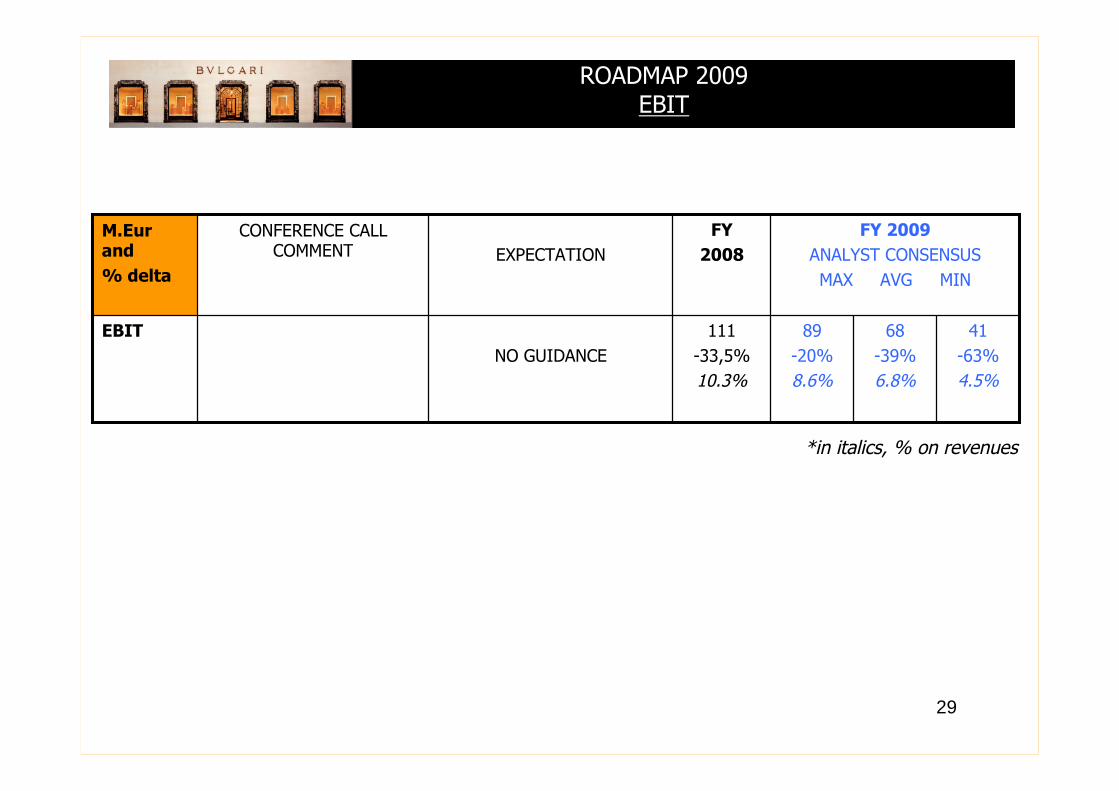
ROADMAP 2009EBIT
68
-39%
6.8%
89
-20%
8.6%
111
-33,5%
10.3%
FY
2008
CONFERENCE CALLCOMMENT
NO GUIDANCE
EXPECTATION
41
-63%
4.5%
FY 2009
ANALYST CONSENSUS
MAX AVG MIN
EBIT
M.Eurand
% delta
*in italics, % on revenues
30
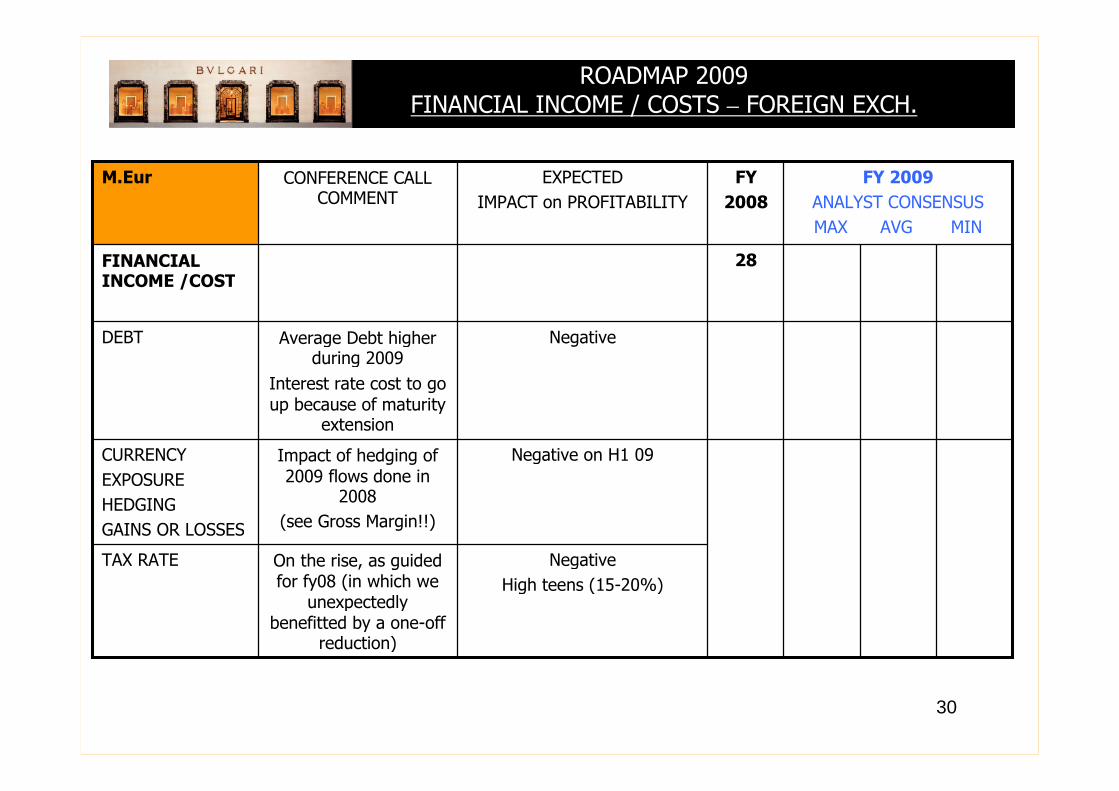
ROADMAP 2009FINANCIAL INCOME / COSTS – FOREIGN EXCH.
28FINANCIALINCOME /COST
NegativeAverage Debt higherduring 2009
Interest rate cost to goup because of maturity
extension
DEBT
On the rise, as guidedfor fy08 (in which we
unexpectedlybenefitted by a one-off
reduction)
Impact of hedging of2009 flows done in
2008
(see Gross Margin!!)
CONFERENCE CALLCOMMENT
FY
2008
Negative
High teens (15-20%)
Negative on H1 09
EXPECTED
IMPACT on PROFITABILITY
FY 2009
ANALYST CONSENSUS
MAX AVG MIN
TAX RATE
CURRENCY
EXPOSURE
HEDGING
GAINS OR LOSSES
M.Eur
31
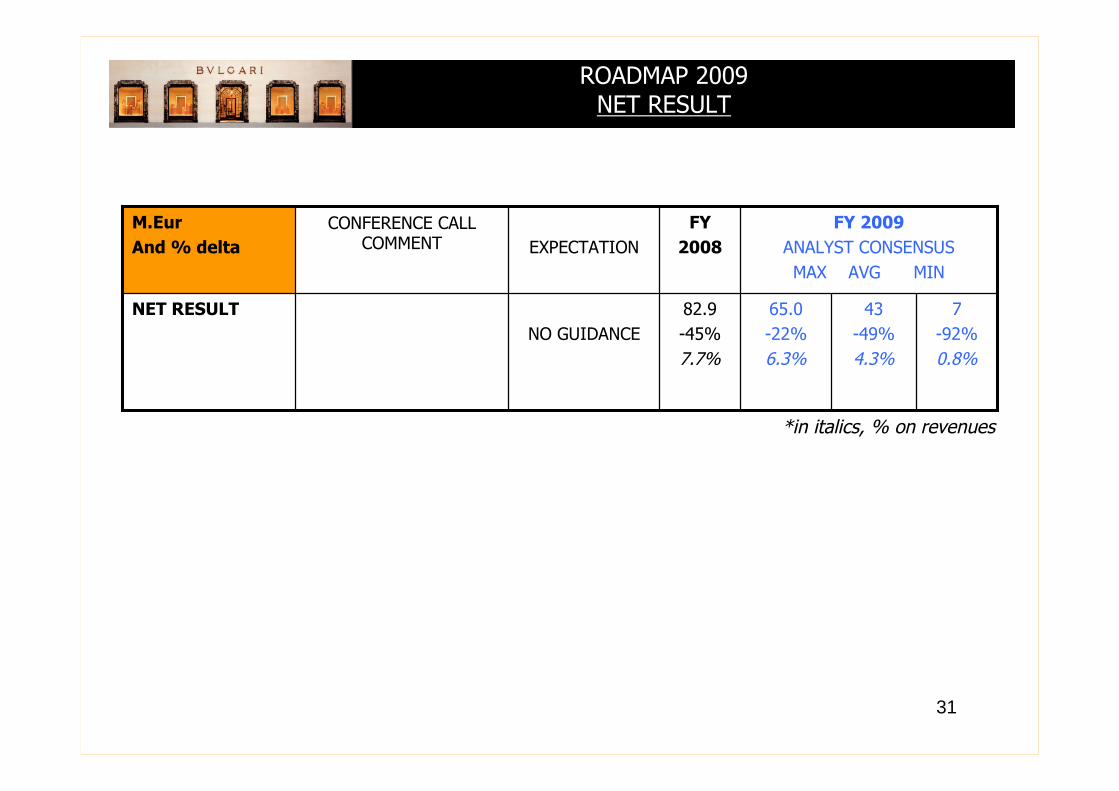
ROADMAP 2009NET RESULT
43
-49%
4.3%
65.0
-22%
6.3%
82.9
-45%
7.7%
FY
2008
CONFERENCE CALLCOMMENT
NO GUIDANCE
EXPECTATION
7
-92%
0.8%
FY 2009
ANALYST CONSENSUS
MAX AVG MIN
NET RESULT
M.Eur
And % delta
*in italics, % on revenues
32
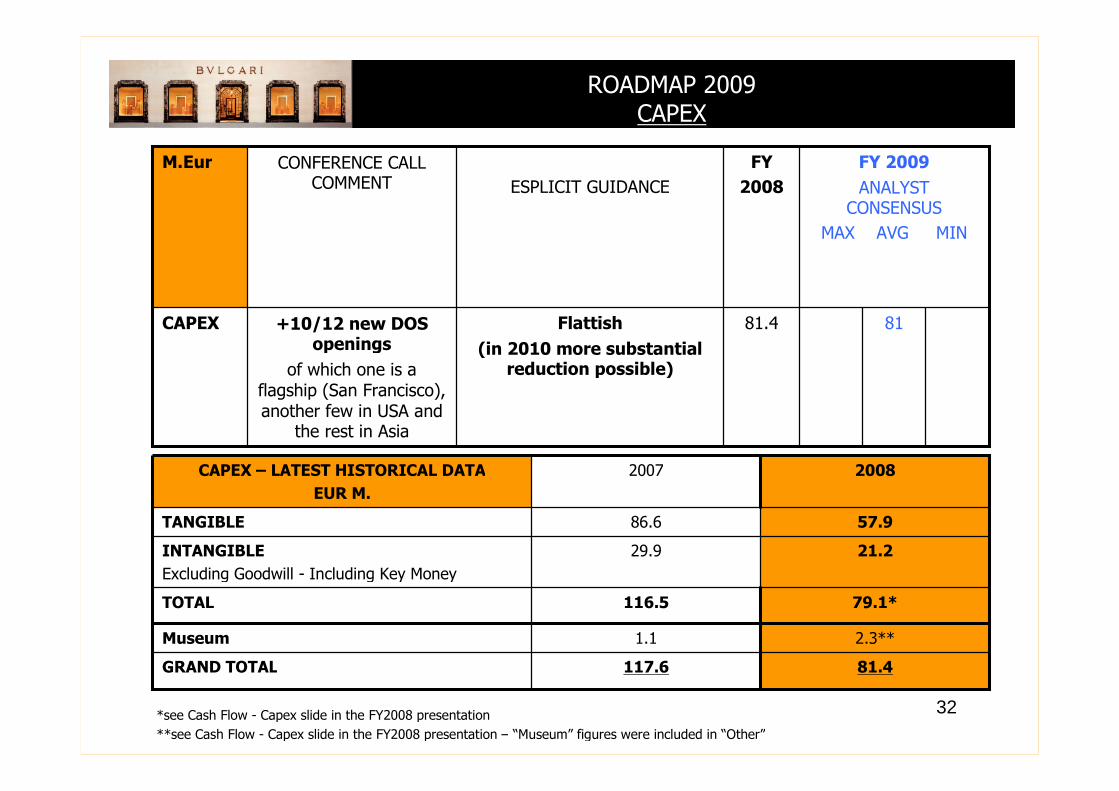
ROADMAP 2009CAPEX
8181.4
FY
2008
+10/12 new DOSopenings
of which one is aflagship (San Francisco),another few in USA and
the rest in Asia
CONFERENCE CALLCOMMENT
Flattish
(in 2010 more substantialreduction possible)
ESPLICIT GUIDANCE
FY 2009
ANALYSTCONSENSUS
MAX AVG MIN
CAPEX
M.Eur
2.3**1.1Museum
79.1*116.5TOTAL
117.6
29.9
86.6
2007
81.4
21.2
57.9
2008
INTANGIBLE
Excluding Goodwill - Including Key Money
GRAND TOTAL
TANGIBLE
CAPEX – LATEST HISTORICAL DATA
EUR M.
*see Cash Flow - Capex slide in the FY2008 presentation
**see Cash Flow - Capex slide in the FY2008 presentation – “Museum” figures were included in “Other”
33
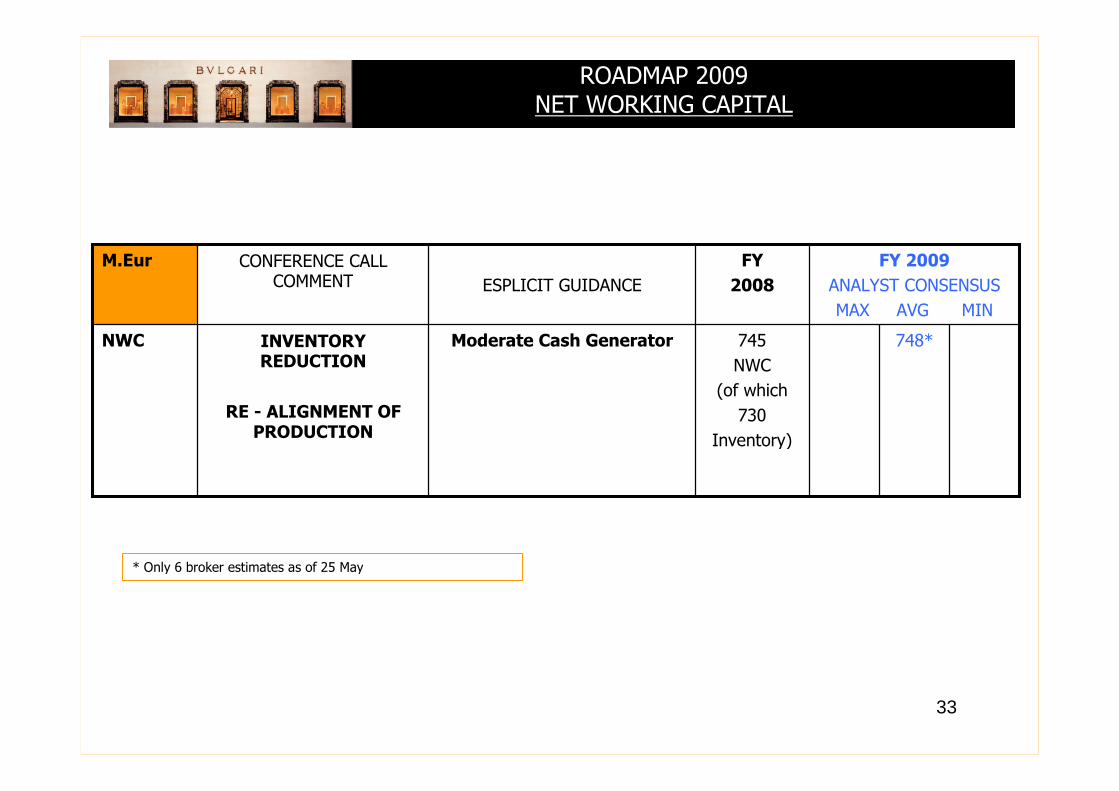
ROADMAP 2009NET WORKING CAPITAL
748*745
NWC
(of which
730
Inventory)
FY
2008
INVENTORYREDUCTION
RE - ALIGNMENT OFPRODUCTION
CONFERENCE CALLCOMMENT
Moderate Cash Generator
ESPLICIT GUIDANCE
FY 2009
ANALYST CONSENSUS
MAX AVG MIN
NWC
M.Eur
* Only 6 broker estimates as of 25 May
34
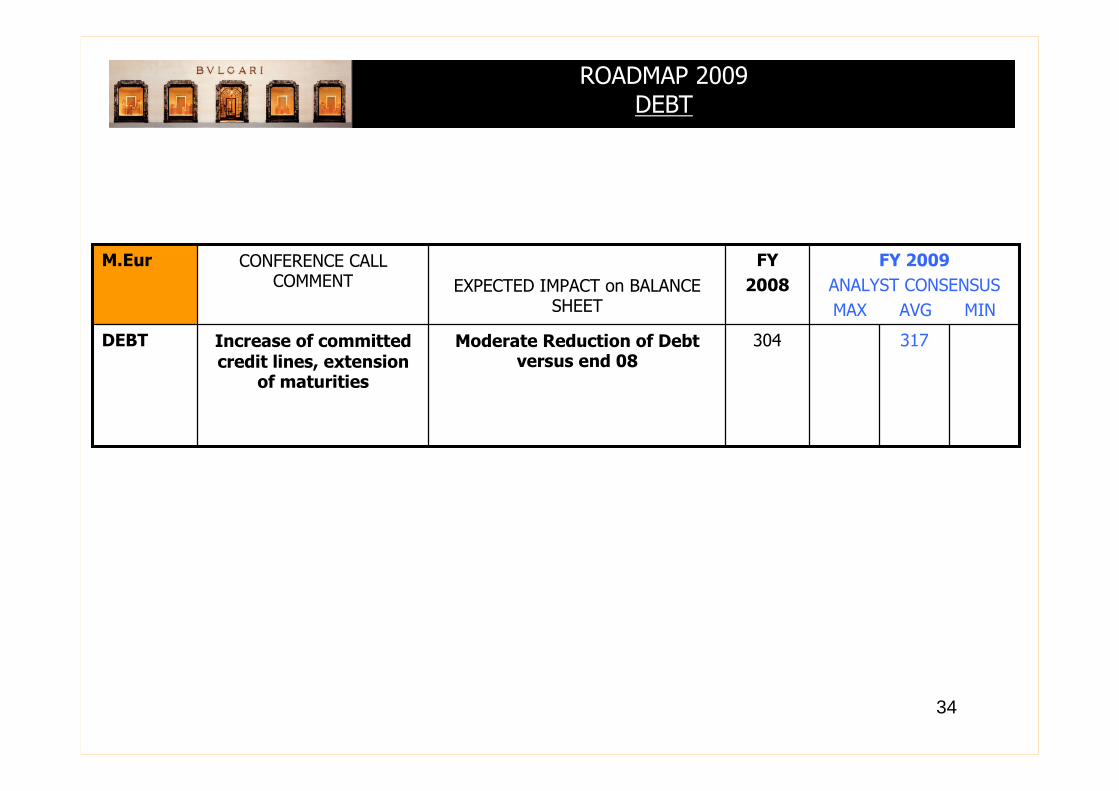
ROADMAP 2009DEBT
317304
FY
2008
Increase of committedcredit lines, extension
of maturities
CONFERENCE CALLCOMMENT
Moderate Reduction of Debtversus end 08
EXPECTED IMPACT on BALANCESHEET
FY 2009
ANALYST CONSENSUS
MAX AVG MIN
DEBT
M.Eur
35
ENDEND
QUESTION & ANSWERS
36
BVLGARI NEWSFLOWBVLGARI NEWSFLOW
BULGARI INVESTOR RELATIONS WEBSITES:http://ir.bulgari.com
http://ir.mobi.bulgari.com
BULGARI CORPORATE WEBSITEhttp://www.bulgari.com
NEXT IR EVENTS• June 3 2009 – HSBC Luxury Goods Conference - Paris
• July 30 2009 – H1 2009 Results - Conference Call 18.00 CET
37
DISCLAIMER
This document is for institutional investors only and is not available to private customers. This document isbeing supplied to a limited number of recipients and it may not be distributed, published or reproduced in wholeor in part or disclosed by recipients to any other person.Under no circumstances shall this document constitute an offer to sell, an invitation to acquire or the solicitationof an offer to buy securities in any jurisdiction.
Each investor contemplating purchasing securities issued by Bulgari S.p.A or any of its subsidiaries should makeits own independent investigation of the financial condition and affairs, and its own appraisal of thecreditworthiness, of Bulgari S.p.A or any of its subsidiaries and should carefully consider the high risks involvedin purchasing these securities.
This document contains certain forward looking statements and key financial goals which reflect management’scurrent views, estimates, and objectives. The forward looking statements and key financial goals involve certainrisks and uncertainties that could cause actual results to differ materially from those contained in the forwardlooking statements and key financial goals.
Potential risks and uncertainties include, amongst other things, internal, industry and external factors, such asgeneral economic conditions
38
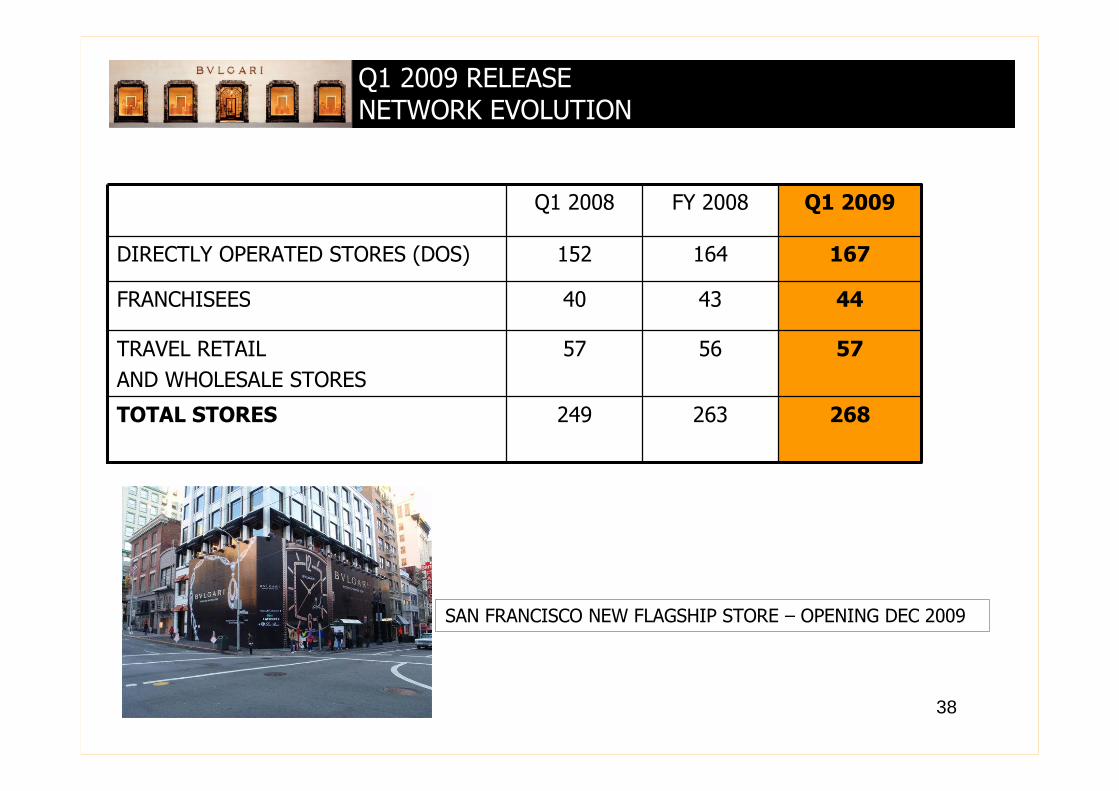
263
56
43
164
FY 2008
249
57
40
152
Q1 2008
268
57
44
167
Q1 2009
TRAVEL RETAIL
AND WHOLESALE STORES
DIRECTLY OPERATED STORES (DOS)
FRANCHISEES
TOTAL STORES
Q1 2009 RELEASENETWORK EVOLUTION
SAN FRANCISCO NEW FLAGSHIP STORE – OPENING DEC 2009