Embed Size (px)
Citation preview
[EXAS IRANSPORTATION [NSTITUTE
DEVELOPMENT DF A SINBLE-SLCIPE
CONCRETE ME·DIAN BARRIER
By·
W. Lynn Beason, H.E. Ross, Jr.,
H.S. Perera, Wanda L. Campise and D.L. Bullard, Jr.
REPORT NO. ·&42SCDK-1
TEXAS TRANSPORTATION INSTITUTE
THE TEXAS A&M UNIVERSITY SYSTEM
COLLEGE STATION, TEXAS
STATE DIEPARTMENT OF HIGHWAYS
AND PUBLIC TRANSPORTATION
DEVELOPMENT OF A SINGLE-SLOPE CONCRETE MEDIAN BARRIER
by
W. Lynn Beason, H.E. Ross, Jr., H.S. Perera, Wanda Campise, and D.L. Bullard,Jr.
Research Report No. 9429CDK-1
Sponsored by State Department of Highways and Public Transportation
June 1989
Texas Transportation Institute The Texas A&M University System College Station, Texas 77843
METRIC (SI*) CONVERSIO-N FACTORS APPROXIMATE C.ONVERSIONS TO S1 UNITS APPROXI·MATE CONVERSIONS TO Sl UNITS
8ylnbol When You K..- Multlptr·ly To Flftcl Symbol Symbol WMn You Know Multiply By To Find Sytllbol
LENGTH w LENGTH .. =. =
1 1 h 2.S4
1111 t . . - ~ :: mm mltllmetres 0.039 inches tn
n nc es m me res mm ~ m metres 3.28 feet ft ft feet 0.304 metres m ... yd rd 0 91
.. . t = " m metres 1.09 yard.s yd ya s • • m•res m • _ = 1 2 ·
I II 1 81 • kll t k __: 3 km kl ometres 0.6 1 miles ml
m m es • ·omeres m ~ ~ ::::-:-----
-:: §-- ~ AREA AREA -.. - ~
- mm2 miiUmetres squared 0.0018 square Inches ln2
In• square lnchea 046.2 mlllhnetres squared mm• : :: !: ma metres squared 10. 7fU square feet ft1
tt• square feet 0.0929 metres squared m• -::::; =-- = kmJ kilometres squared 0.39 square miles ml2
yd1 square yards 0.838 metres squared m• .. - ;:: ha hectores (10 000 ml) · 2.53 acres ac - .. ml1 square miles 2..59 kilometres squared km2 - _ -
~: ac acres 0.385 hectares ha ~ s- ~ MASS (weight) ...
• ~ ~ ... 0 grams 0.0353 ounces oz MASS· (weight) __.::§ g._ ~ kg kilograms 2.205 pounds lb
__; = ... Mg meaagrams (1 000 kg) 1.103 short tons T oz ounces 28.35 grams g -lb pounds 0.454 kilograms kg • - = o
T short tons (2000 tb) o~907 megagrams Mg ___=:= ~ ... VOLUME .. -= g- ml mUIIUtres 0.034 fluid ounces fl oz .., ~ • L lUres 0.264 gallons gal
VOLUME -:::: - ... m1 metres cubed 35.31'5 cubic feet ft'
fl oz fluid ounces 29.57 mUUUtres mL = .. m• metres cubed 1.308 cubic yards yd*
gal gallons 3.785 lltres L =--tt• cubic teet 0.0328 metres cubed m• "" _ ... TEMPERATURE (exact) yd1 cubic yards 0.0765 metres cubed m' • •
NOTE: Volumes greater than 1000L shall be shown In ma. ~ OC Celsius . 9/5 (then Fahrenheit oF _ .. temperature add 32) temperature
OF °F 32 98.8 212
TEMPERATURE (exact) ~· = - -.w, ' . ' ~' ' ·14;0 I e. ' l!O I 1 . 1~1 I I
1~1. I. I ~.J. ':tl' -·- S . { i I I i· .1 I I· 1 i : _ § u -.-o -20 o 20 40 . eo ao 100
°F Fahrenheit 5/9 (after CelsJua oc oc. . 37 · oc temperature . subtracting 32) temperature These factors conform to the requirement of FHWA Order 5190.1A.
• Sl Is the symbol for the lnternaUonal System of Measurements
DISCLAIMER
The contents of this report reflect the views of the authors, who are responsible for the opinions, findings, and conclusions presented herein. The contents do not necessarily reflect the official view or polici,es of the Texas State Department of Highways and Public Transportation (SOHPT}. This report does not constitute a standard, specification, or regulation.
KEY WORDS
Concrete Median Barrier, Crash Test(s}, Construction, Safety
ACKNOWLEDGMENTS
This research study was conducted under the sponsorship of the SDHPT. Messrs. Mark Marek, Harold Cooner, and Gary Humes of the SOHPT worked closely with the researchers. Their comments, suggestions, and cooperative spirit were appreciated.
iii
DEVELOPMENT OFA SINGLE-SLOPE CONCRETE MEDIAN BARRIER
ABSTRACT
A single-slope concrete median barrier (CMB) has been developed for use as either a permanent concrete median barrier or as a temporary construction zone barrier. The new barrier is designed to meet accepted criteria for the performance of longitudinal barriers. The new singleslope CMB is designed to be used in applications where the New Jersey CMB would be employed. The primary advantage of the new single-slope CMB is that the pavement adjacent to the new barrier can be overlaid several times without changing the performance of the barrier. This should help to reduce the maintenance costs associated with the use of permanent CMB' s. Results of four crash tests are presented which show that the performance of the new single-slope CMB is roughly equivalent to the performance of the New Jersey CMB. These tests were conducted with the new single-slope CMB deployed in both the permanent and temporary configurations.
iv
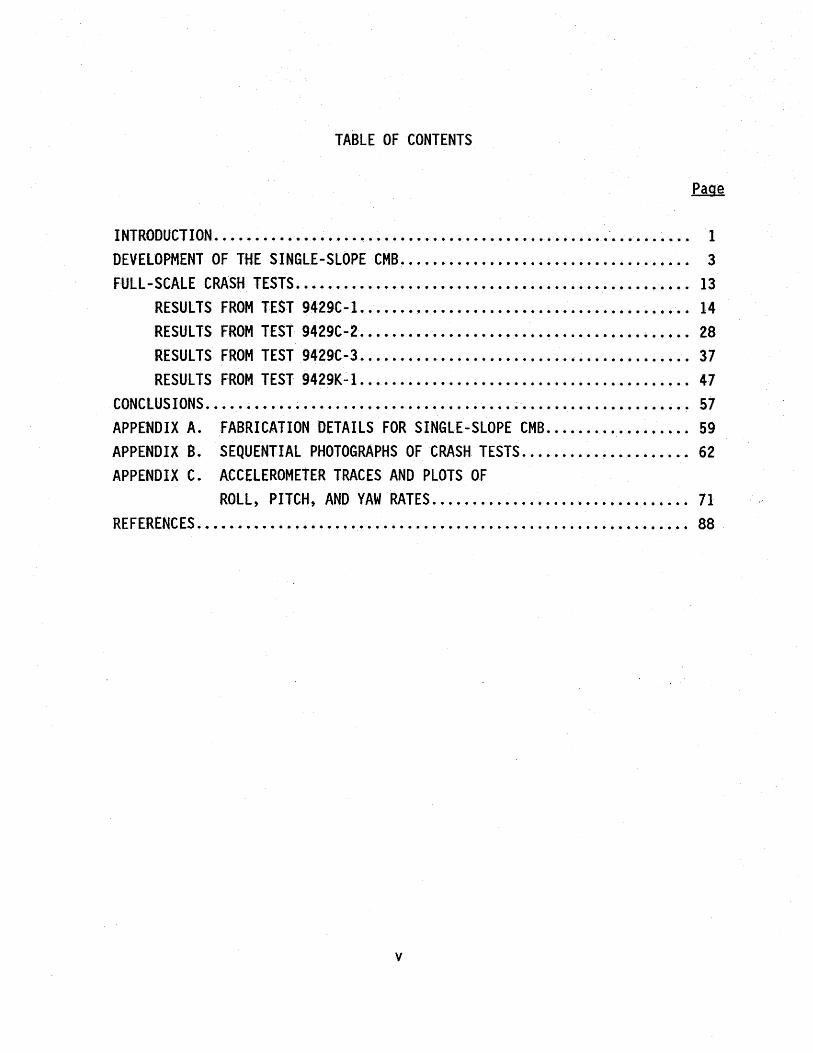
TABLE OF CONTENTS
INTRODUCTION •••••....••••.•... ~ . . . . • . . . • . • . . . • . • • . . . . . . . . . . • . . • • .. . . . • . . . 1
DEVELOPMENT OF THE SINGLE-SLOPE CMB .................•••.....•.....•.... 3 F-Ull-SCALE CRA-.SH TES-T-S • .••. _ .................................... _ •..• , . . • . 13
RESULTS FROM TEST 9429C-l.. . . • • . • . . . • . . . . . . . . • . . . . . . . . . . .. . . . • . . . • . 14 RESULTS FROM TEST 9429C-2 •......••.........•............•......... 28 RESULTS FROM TEST 94 29C-3 . . . . . . . . . . • . . . . . . . . . . . . . . . • . . . . . . • . . . . . . . 3 7 RESULTS FROM TEST 9429K-l .......•................ ~················ 47
CONC LUS I O·NS • ••••.••••••••••••••••• -•••••••••••• -. • • • • • .• • • • • • • • . • • • • • • • • • • • 57
APPENDIX A. FABRICATION DETAILS FOR SINGLE-SLOPE CMB •••••••••••••••••• 59 APPENDIX B. SEQUENTIAL PHOTOGRAPHS OF CRASH TESTS .............•.•..... 62 APPENDIX C. ACCELEROMETER TRACES AND PLOTS OF
ROLL, PITCH, AND YAW RATES .............•....•..•........•. 71 .REFER.E.N·CES •• •••••••••••••••• ~ • .• • • • • • • .• • • • • • • • • • • • • • • • • • • . • • • • • .• • • • • • • • • 88
v
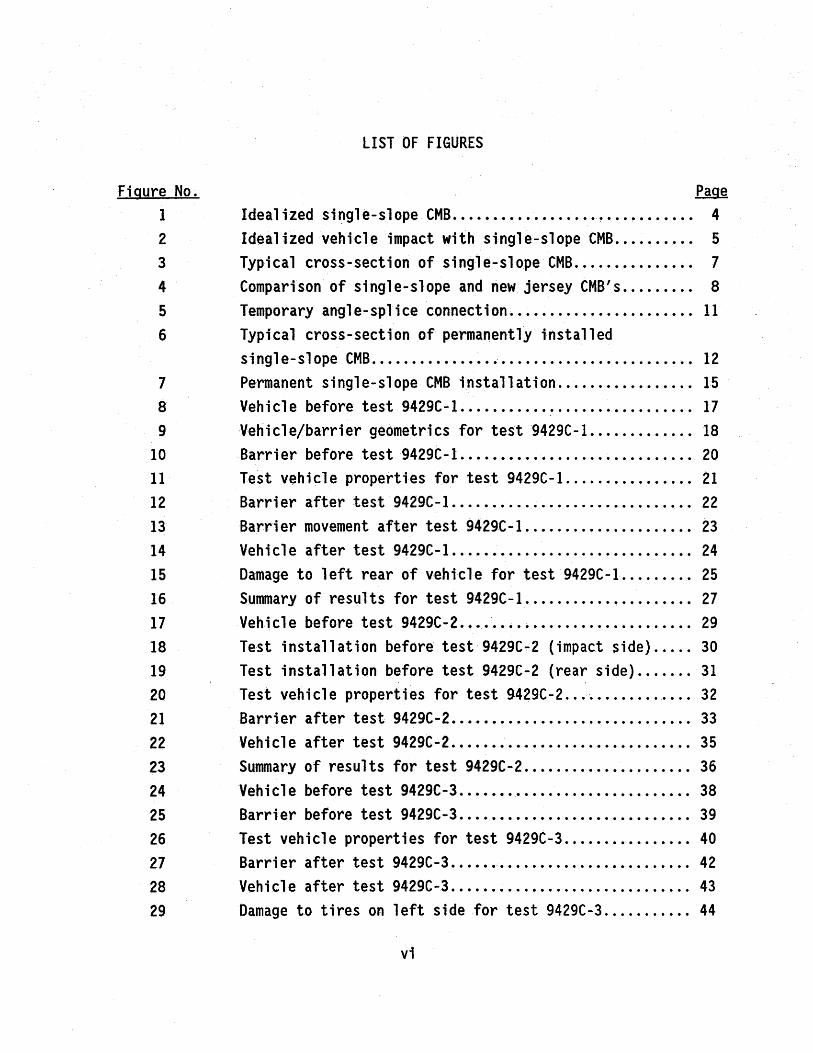
Figure No. 1
2
3
4
5
6
LIST OF FIGURES
Page Idealized single-slope CMB ...•..•....•..............••.. 4 Idealized vehicle impact with single-slope CMB •......... 5 Typical cross-section of single-slope CMB ..............• 7 Comparison of single-slope and new jersey CMB's ......... 8 Temporary angle-splice connection ............•.•........ 11 Typical cross-section of permanently installed single-slope CMB ............... ~ ........................ 12
7 Permanent single-slope CMB installation ................. 15 8 Vehicle before test 9429C~1 ............................. 17 9 Vehicle/barrier geometries for test 9429C-1 ............. 18
10 Barrier before test 9429C-1 ........•.................... 20 11 Test vehicle properties for test 9429C-l ................ 21 12 Barrier after test 9429C-l ...........................•.. 22 13 Barrier movement after test 9429C-l ..................... 23 14 Vehicle after test 9429C-1 ...•.•.....•.................. 24 15 Damage to left rear of vehicle for test 9429C-1 ..•...... 25 16 Summary of results for test 9429C-1 ..................... 27 17 Vehicle before test 9429C-2 ..•...•.•.•.................. 29 18 Test installation before test 9429C~2 (impact side) .. 4 •• 30 19 Test installation before test 9429C-2 (rear side) ....... 31
. .
20 Test vehicle properties for test 9429C-2 ................ 32 21 Barrier after test 9429C-2 •...•......................... 33 22 Vehicle after test 9429C-2 .•.......•.......• 4 ••••••••••• 35 23 Summary of results for test 9429C-2 ..................... 36 24 Vehicle before test 9429C-3 ............................. 38 25 Barrier before test 9429C-3 ............................. 39 26 Test vehicle properties for test 9429C-3 ................ 40 27 Barrier after test 9429C-3 ....•......................... 42 28 Vehicle after test 9429C-3 .............................. 43 29 Damage to tires on left side for test 9429C-3 ........... 44
vi
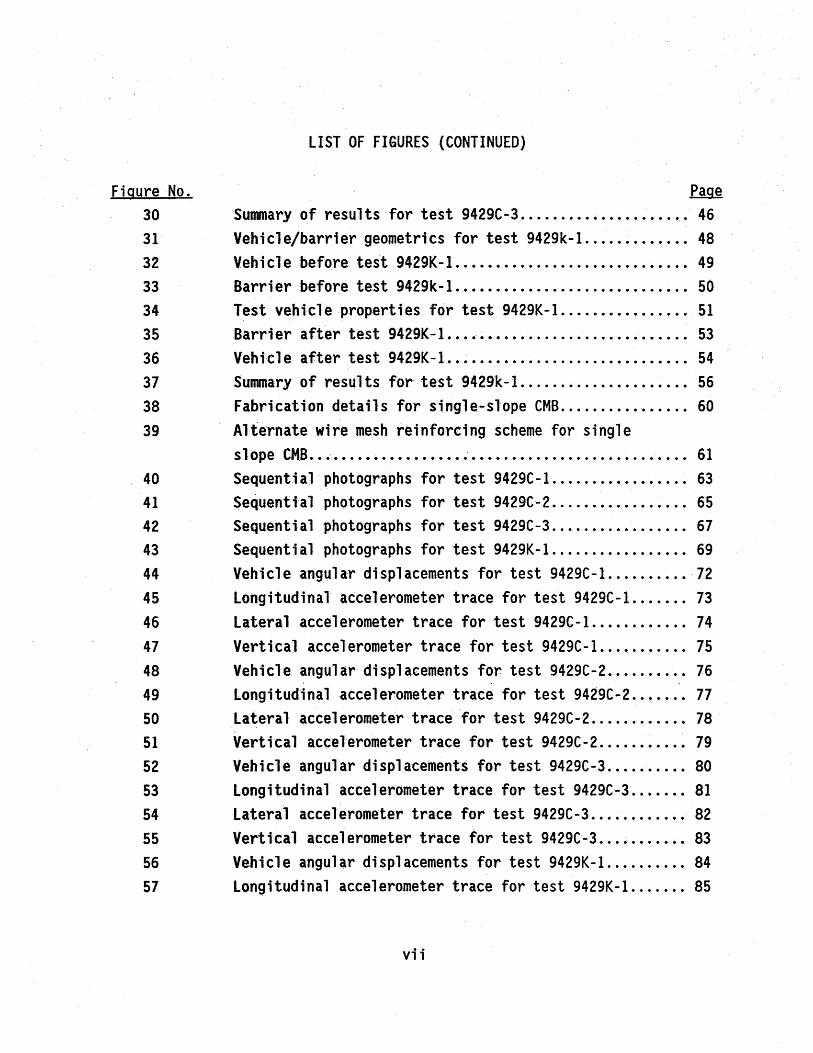
Figure No. 30 31 32 33 34 35 36 37 38 39
40 41 42 43 44 45 46 47 48 49 50 51 52 53 54 55 56 57
LIST OF FIGURES (CONTINUED)
Page Sununary of results for test 9429C-3 ......•......•....... 46 Vehicle/barrier geometries for test 9429k-l ........•.... 48 Vehicle before test 9429K-1 .•.••.....•.................. 49 Barrier before test 9429k-1 .•••••....................... 50 Test vehicle properties for test 9429K-l ................ 51 Barrier after test 9429K-l •••••••.•.............•....... 53 Vehicle after test 9429K-l ..•..•.••....................• 54 Sununary of results for test 9429k-l ......•.............. 56 Fabrication details for single-slope CMB ........••.•...• 60 Alternate wire mesh reinforcing scheme for single slope CM.B •• ................................................ 61
Sequential photographs for test 9429C-1 ........••.•.•... 63 Sequent i a 1 photographs for test 9429'C- 2. . . . . . . . . . . . • . . . . 65 Sequential photographs for test 9429C-3 ................. 67 Sequential photographs for test 9429K-1 ................. 69 Vehicle angular displacements for test 9429C-1 .......... 72 Longitudinal accelerometer trace for test 9429C-l ....... 73 Lateral accelerometer trace for test 9429C-1 ..•.•..••... 74 Vertical accelerometer trace for test 9429C-l ...•..••... 75 Vehicle angular displacements for test 9429C-2 ......•... 76
. . . Longitudinal accelerometer trace for test 9429C-2 ....... 77 Lateral accelerometer trace for test 9429C-2 .......••..• 78 Vertical accelerometer trace for test 9429C-2 ........... 79 Vehicle angular displacements for test 9429C-3 .......... 80 Longitudinal accelerometer trace for test 9429C-3 ..•.•.• 81 Lateral accelerometer trace for test 9429C-3 ..•••..•..•• 82 Vertical accelerometer trace for test 9429C-3 ...•.....•. 83 Vehicle angular displacements for test 9429K-l .......•.. 84 Longitudinal accelerometer trace for test 9429K-1 .....•. 85
vii
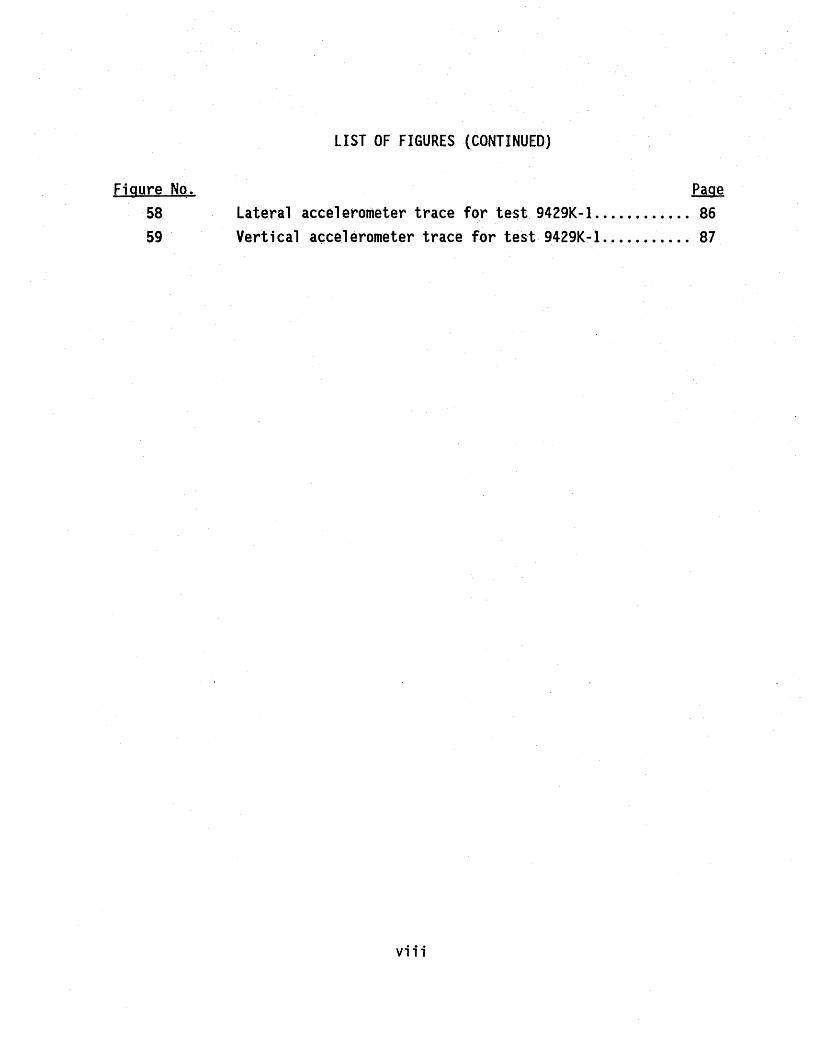
Figure N(). 58
59
LIST OF FIGURES (CONTINUED)
Page lateral accelero~eter trace for test 9429K-l ..•.•..••... 86 Vertical accelerometer trace for test 9429K-l ......•.... 87
viii
LIST OF TABLES
Table No.
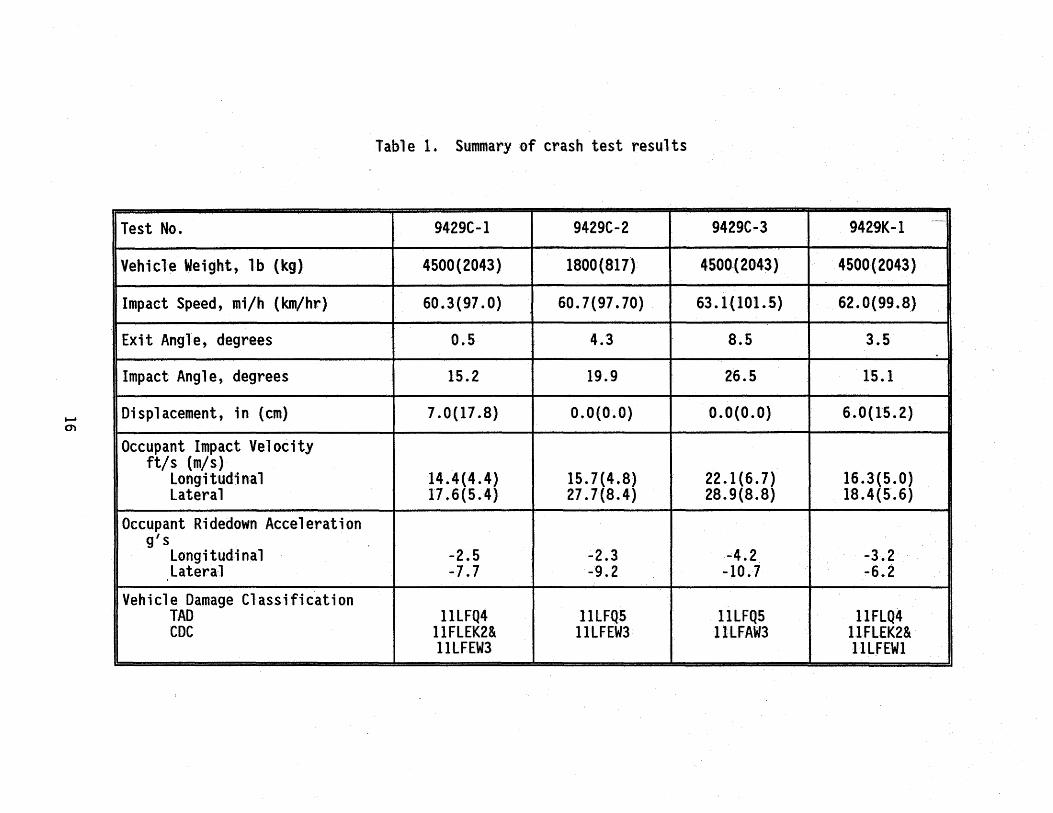
1 Summary of crash test results .•••......•..•..•.••...•.•. 16
ix
INTRODUCTION
Over the past several years, New Jersey concrete median barriers (CMB) have gained widespread acceptance. Further, other types of longitudinal
barriers employing the New Jersey shape, including bridge rails and
portable barriers, have become very popular. Full seale crash tests have
shown that New Jersey longitudinal barriers are capable of smoothly
redirecting the standard vehicle tests specified in NCHRP 230 {1) including
both the strength and stability requirements.
While, the use of the New Jersey CMB has been successful, there are
disadvantages with its use. One of the biggest disadvantages is that the
profile of the New Jersey shape varies with height above grade. This means
that if the roadway is resurfaced, both the height of the barrier and the
shape of the barrier wi 11 be substantially changed. It may be that the
performance of the New Jersey safety shape is not negatively affected by
the addition of a few inches of pavement overlay. However, as the
thickness of the overlay is increased, the performance of the New Jersey
CMB will eventually become unsatisfactory if only because of the reduction
of the overall height of the barrier. Therefore, it has become fairly
standard practice to reset the New Jersey longitudinal barriers as the
pavement height is increased in the overlaying process. This process is
both expensiv~ and time consuming.
The purpose of the research presented in this report was to develop a
new CMB shape whose performance is not impaired by the appl icati_on of
several inches of pavement overlays. Further, a major effort was made to
deve 1 op the geometry of the new CMB so that its effect on impacting
vehicles is as good as or better than the effect of the New Jersey CMB.
The new barrier has a single slope face. This shape was suggested by
engineers with the Texas State Department of Highways and Public
Transportation (SDHPT). Because the barrier face has a single, constant
1
slope, its performance is not affected by overlaying the adjacent pavement.
Rather, the addition a 1 pavement overlay serves to anchor the barrier more
securely at its base thus increasing its basic strength. The performance
of the single-slope CMB is ultimately controlled by its height and the
slope nf the barrier face.
The new single-slope CMB can be used in either a temporary or a
permanent application. The performance of the new CMB was documented in a series of four crash tests. The first test was conducted to verify that the performance of the barrier is acceptable in a temporary application.
The second two tests were accomplished to establish the performance of the barrier in a permanent application as prescribed in NCHRP 230 {1). The
fourth test was conducted to establish the performance of the single-slope
barrier in an alternate temporary configuration.
The remainder of this report is divided into three major sections.
The next section presents a description of the newly developed single-slope
CMB. This is followed by a section on the full scale testing of the single-slope CMB. The final section presents conclusions and
recommendations for the use of the single-slope CMB.
2
DEVELOPMENT OF THE SINGLE-SLOPE CMB
The objective of the research presented in this report was to develop
a single-slope CMB which can be used interchangeably with the New Jersey
CMB. The design of the single-slope CMB is based on the results of a
series of computer simulations and engineering judgment as discussed below.
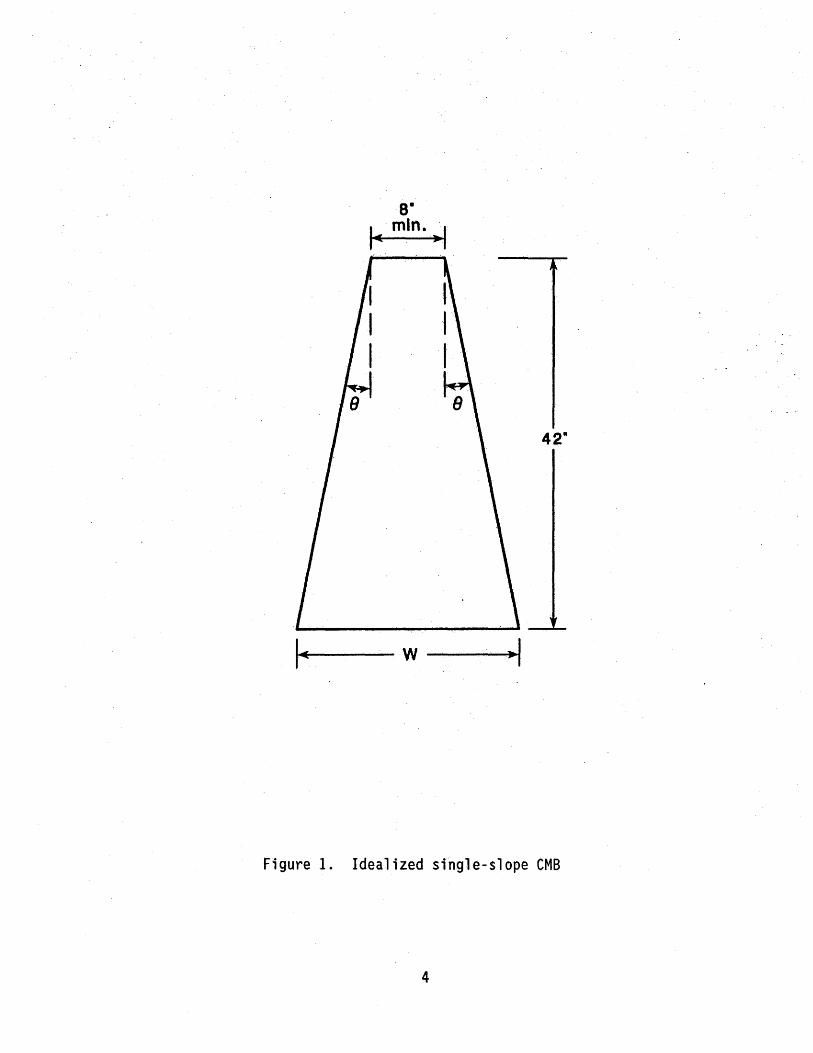
The basic constraints issued by engineers with the SDHPT were that the
single-slope CMB should be 42 in (106.7 em) tall with a flat top that is a
minimum of 8 in (20.3 em) wide. ln addition, it was required that the
impact face of the single-sl~pe CMB incorporate a constant slope as shown
in Figure 1.
It is known that a rigid barrier with a vert i ca 1 face results in the
minimum vehicle instability during impact. Vertical face rigid barriers
have undergone extensive testing with a variety of different vehicles
ranging from compact automobiles to tractor-trailers (2,3). Computer
simulations and practical experience suggest that if the face of the
barrier is sloped as shown in Figure 1, errant vehicles will be subjected
to increasing instabilities as the angle of the barrier face is increased.
If the angle of the barrier face becomes large enough, the vehicle
instabilities will lead to vehiele roll-over.
While vehicles are clearly more· stable during impacts ·with vertical
rigid barriers, there exists the possibility that the occupants in a
vehicle impacting a vertical barrier will be subjected to accelerations
that cause their heads to be propelled through the side windows of the
occupant compartment and against the vert i ca 1 barrier surface. Such
movements of the occupants heads have been observed in crash tests which
incorporated anthropomorphic dummies. Therefore, it was decided to set the
angle of the barrier face so that the vehicle rolls away from the barrier
(Ref. fig. 2) to prevent this phenomenon.
- 3
..... ,.;.----- w -----~·1
Figure 1. Idealized single-slope CMB
4
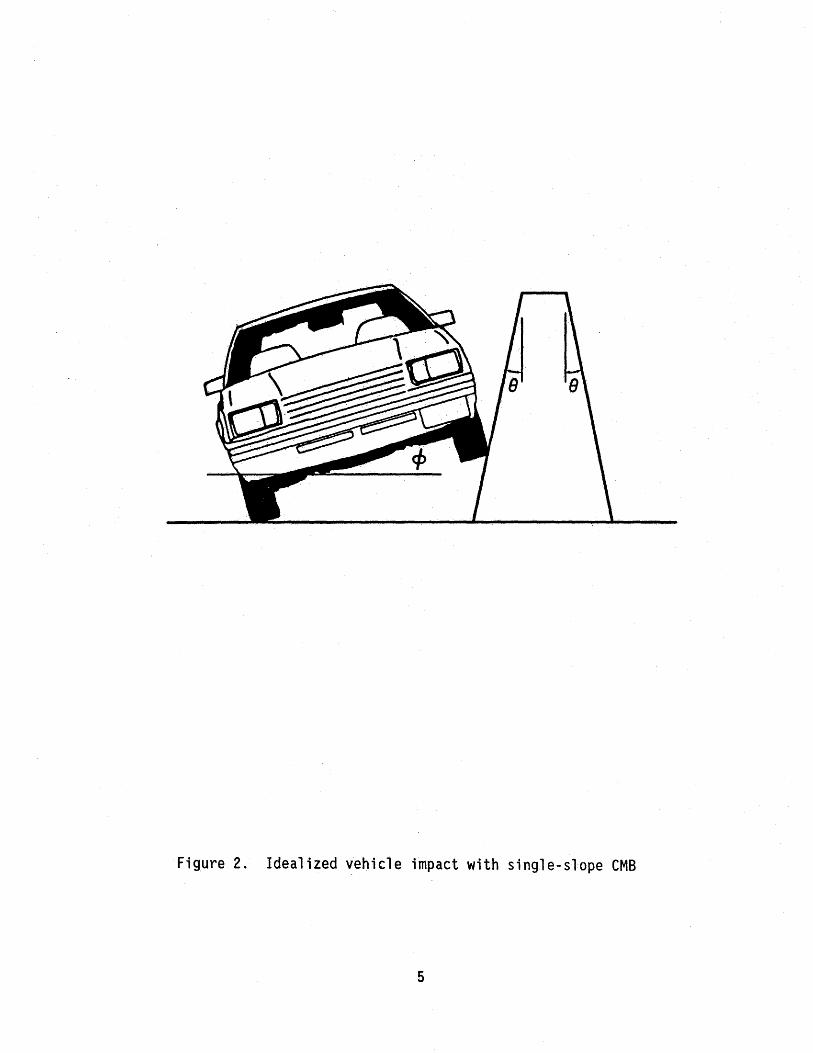
Figure 2. Idealized vehicle impact with single-slope CMB
5
Computer simulations were used to study the effect of the barrier
slope on the vehicle roll. The computer program used to evaluate the
performance of the single-slope CMB was HVOSM {Highway-Vehicle-Object
Simulation-Model) {4). The version of HVOSM used in the study was the RD2
version which incorporates modifications developed by researchers at the
Texas Transportation Institute {TTl). The TTl modifications permit the
structure of the vehicle to interact with the sloped faces of a multi-faced
rigid barrier. Studies of rigid New Jersey CMB's made with this modified
version ~f HVOSM have met with reasonably good success {5,6). Therefore,
the RD2 version of HVOSM was used to study the effects of various angles on
the performance of the single-slope CMB.
The performance of rigid longitudinal barriers is evaluated by the
stability of the vehicle after impact and the degree of deceleration due to
the impact. Angular response of the vehicle is the measure of stability
and occupant impact velocity is controlled to limit the deceleration.
Large barrier face angles {measured from vertical as shown in Figure 1)
increase the propensity for the vehicle to roll-over, while small angles
lead to high occupant impact velocities. The objective of the computer
simulation study was to select a moderate slope which will provide a good
compromise between ro 11-over tendency and occupant impact ve 1 oc it i es. The
HVOSM program was used to simulate the impact of a 4,500-lb {2,043 kg)
automobile traveling at 60 mph {96 km/h) with an angle of 25 degrees to
evaluate the performance of·different slopes. In addition, HVOSM was used
to examine the performance of 1,800-lb (817 kg) automobiles impacting the
single-slope CMB.
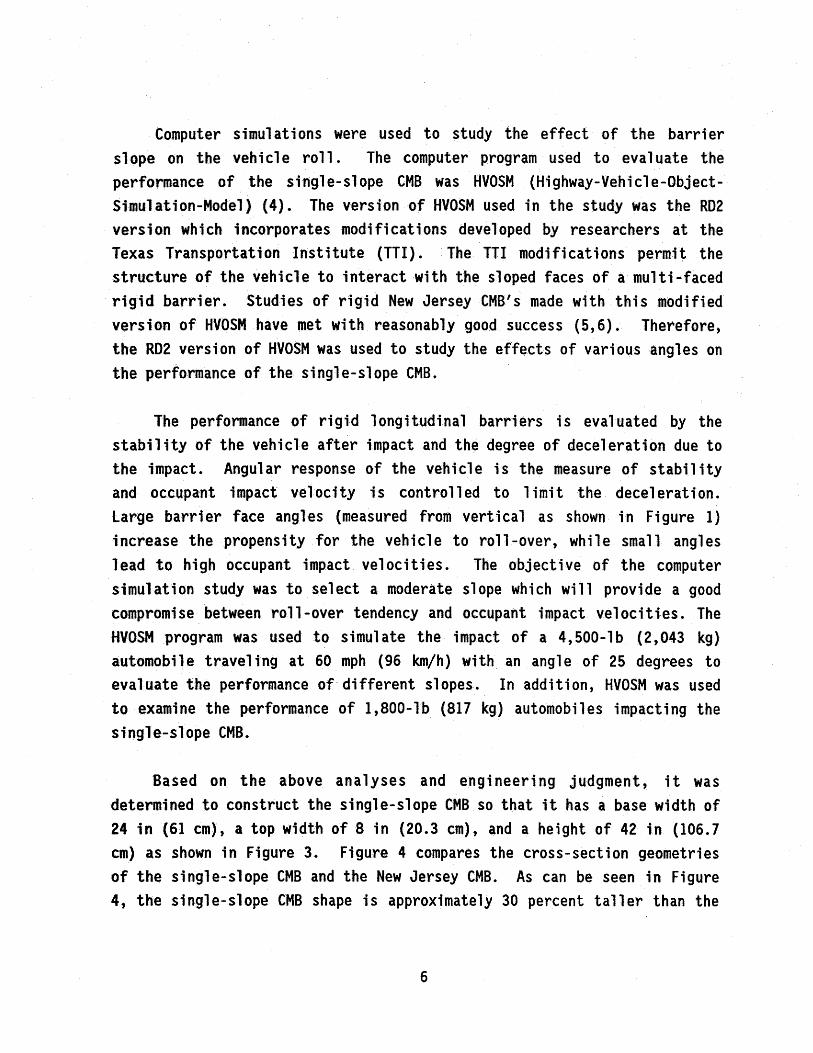
Based on the above analyses and engineering judgment, it was
determined to construct the single-slope CMB so that it has a base width of
24 in (61 em), a top width of 8 in (20.3 em), and a height of 42 in (106.7
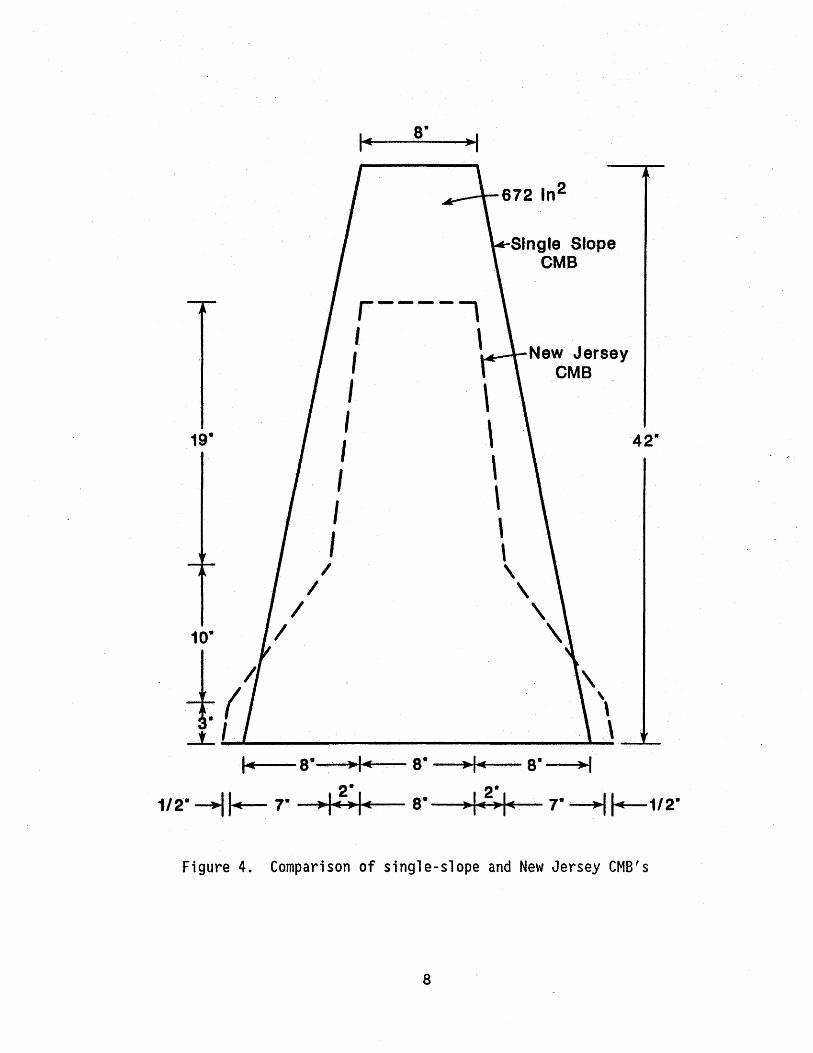
em) as shown in Figure 3. Figure 4 compares the cross-section geometries
of the single-slope CMB and the New Jersey CMB. As can be seen in Figure
4, the single-slope CMB shape is approximately 30 percent taller than the
6
10.8°
Figure 3. Typical cross~section of single-slope CMB
7
I
1-.(
1/2. -..)]-+-- 7"
I
r----, I \ I I I I I I I
I I
\ \ \ \
Single Slope CMB
New Jersey CMB
\ \ \
\ \
\
a· ~I ... a· ~I ... a· ~I 2.
~1 ... •I ... a· 2. ,., ... ,.,~ 7-~~1/2.
Figure 4. Comparison of single-slope and New Jersey CMB's
8
New Jersey CMB. The weight of the single-slope CMB is estimated to be 675
lb/ft (1000 kg/m). This estimated weight is approximately 40 percent more
than the New Jersey CMB. This weight increase is primarily due to the
increased height of the barrier. The resistance to overturning provided by
the dead weight of the single-slope CMB is approximately 20 percent more
than for the New Jersey CMB. Finally, the center-of-gravity of the single
slope CMB is approximately 18 in ( 45.7 em) above the base compared with
approximately 11.5 in (29.2 em) for the New Jersey CMB. The added height
of the center-of-gravity results in a CMB center-of-gravity which is closer
to the center-of-gravity heights of typical automobiles. All of these
geometric factors combine to suggest that the single-slope CMB will display
a better impact response than the New Jersey CMB, particularly in the
temporary configuration.
The outputs from the computer simulations were used to determine the
angular vehicle responses and the occupant impact velocities according to
the procedures presented in NCHRP 230 ( 1). These results were compared
with analogous results for the New Jersey CMB. Based on these comparisons
it was determined that the single-slope CMB should induce approximately the
same vehicle response as achieved with the New Jersey CMB.
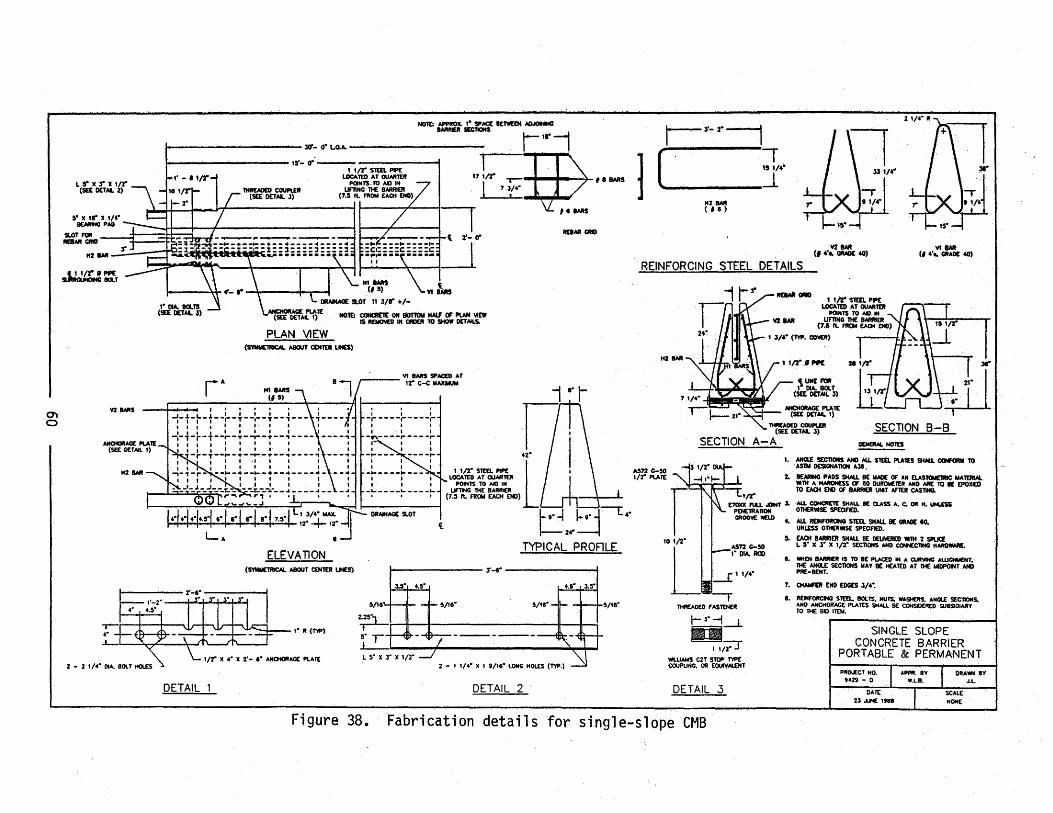
Complete fabrication drawings for the single-slope barrier are
presented in Figure 38 of Appendix A. As shown in Appendix A, it is
recommended that· the single-slope CMB ·be fabricated in 30 ft {9.1 m)
lengths. As shown in the fabrication drawings, two steel pipes are
embedded in the barrier segments approximately at the quarter points. The
procedure for lifting the barrier involves the insertion of solid steel
bars through the lifting pipes. Then chains can be draped around the
1 ifting ·bars and the barrier can be moved with either two pieces of light
lifting equipment such as fork lifts or a single piece of heavier lifting
equipment. In the current project the barrier segments were movedwith two
fork lifts with approximately the same ease as moving similar 30 ft {9.1 m)
segments of the New Jersey CMB.
9
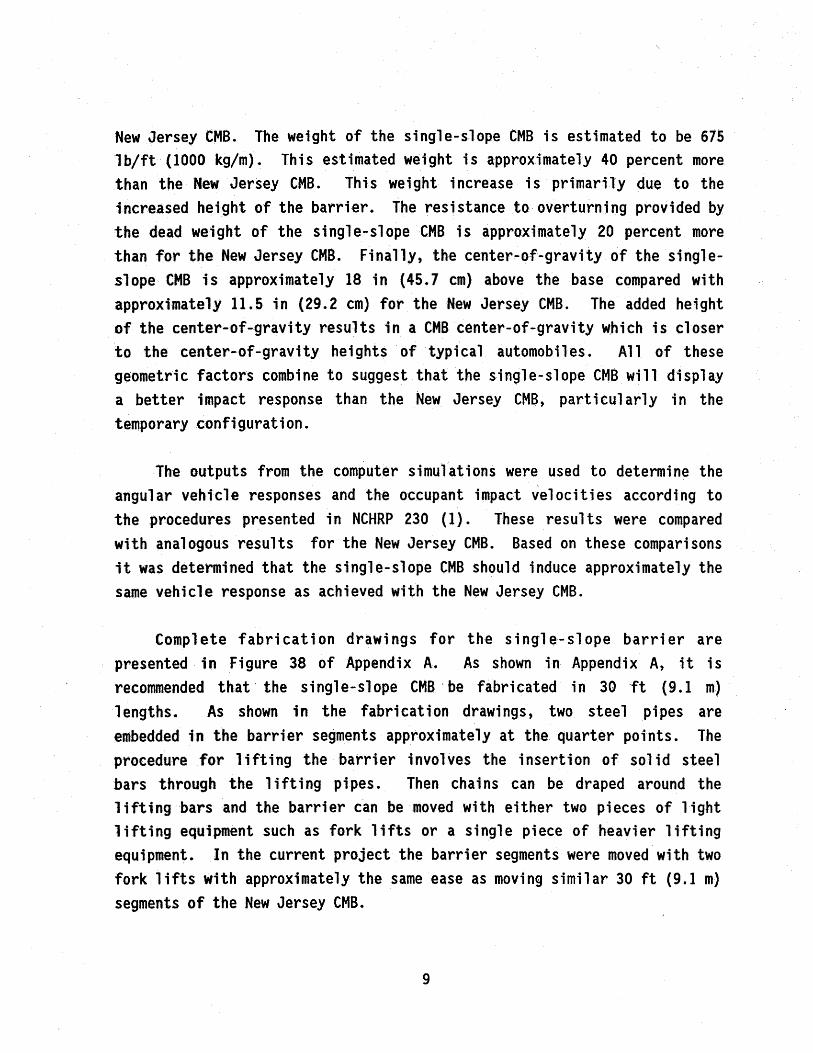
The ends of the single-slope CMB segments are equipped with provisions
for two different types of connections. The first type of connection
involves the use of external steel angles which are attached to the barrier
segment ends with specially fabricated bolts as shown in Figure 5 and in
the fabrication drawings presented in Figure 38 of Appendix A. This angle
splice connection is recommended for temporary connections and is not
required when the barrier is installed in the permanent configuration.
The second connection deta i 1 involves a s 1 ot which is cast into both
ends of the barrier segments. A permanent connection is made by inserting
a reinforcing bar grid into the slots of both ends of mating barrier
segments and filling the slots and the space between the barrier ends with
grout. The grout used in this research consisted of a mixture of 1 part
cement and 2 parts sand, with water added to make a workable mix. The
permanent installation is completed by locking the barrier segment into
place with a minimum of 1 in (2.54 em) of asphalt overlay placed next to
both faces of the barrier as shown in Figure 6. An alternative temporary
connection can be accomplished by simply inserting the reinforcing bar grid
into the slots without using the grout. While this temporary connection is
not as strong as the angle-splice connection it has been shown to be
adequate.
The barrier segments tested in this project were fabricated with
reinforcing bar placed as shown in Appendix A. Subsequent to the tests.
reported herein, an alternate reinforcing detail for the single-slope CMB
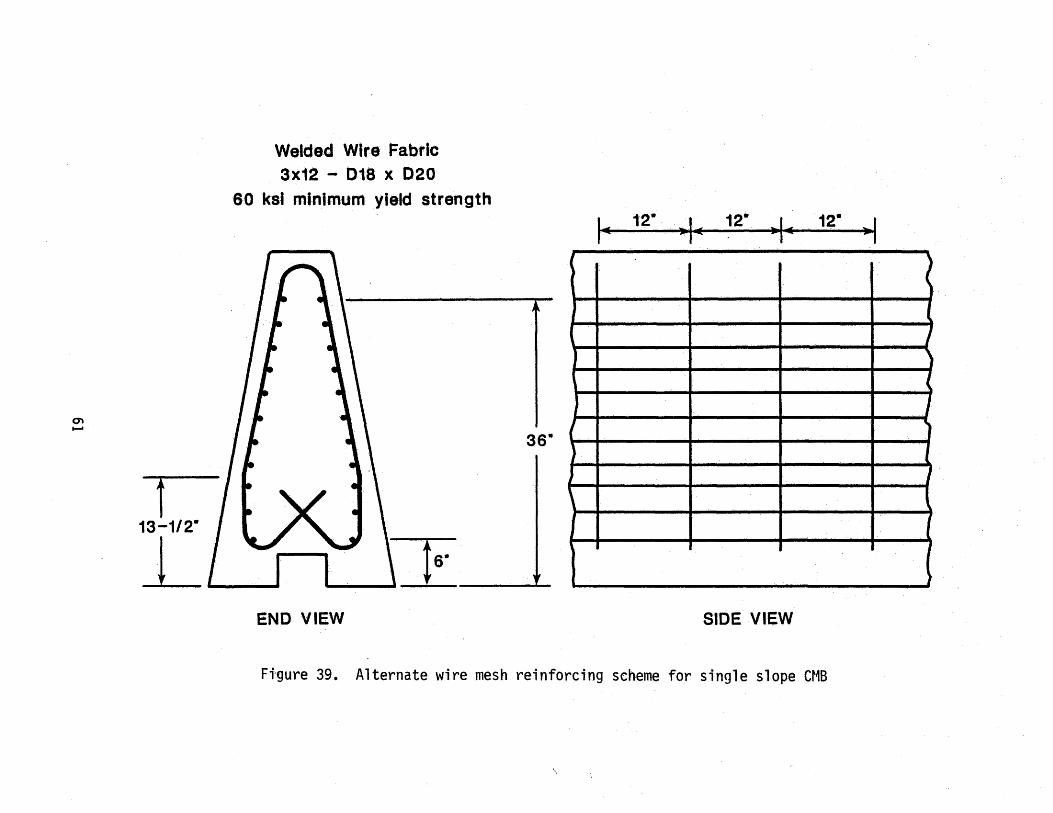
was developed. The alternate reinforcing scheme incorporates wire mesh in
the single-slope CMB away from the barrier ends as shown in Figure 39 in
Appendix A. It is recommended that the reinforcing bar detail contained in
the original fabrication drawings presented in Figure 38 be continued for a
total distance of at least 2 ft (0.60 m) from each end of the barrier
segment with adequate allowance provided for development lengths so that
the barrier will behave as though it is continuously reinforced.
10
,f. ,. ,.
. : · .. ;;:;; . ·.-·
~~:J~t~~~1~~~~~~~HrR~:)~-;;.:<(J·?:,.;:,"~·nfl~·i\, -~>•.:.
Figure 5. Temporary angle-splice connection
11
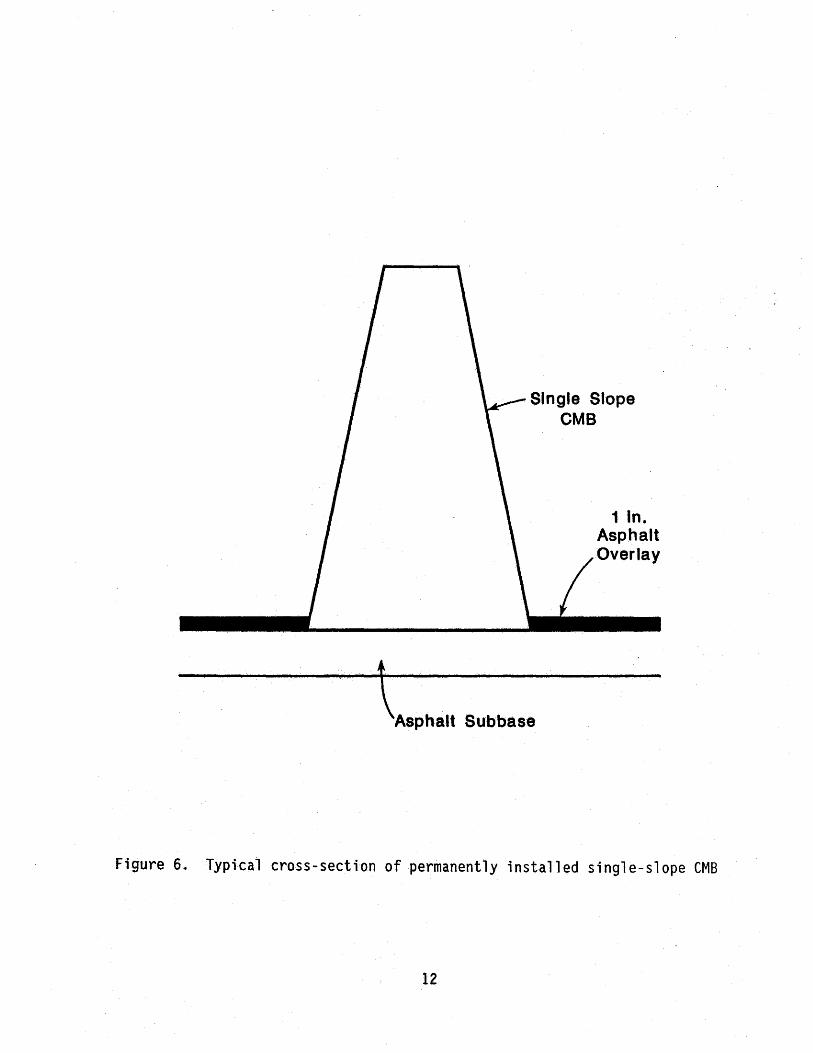
Single Slope CMB
1 ln. Asphalt Overlay
\Asphalt Subbase
Figure 6. Typical cross-section of permanently installed single-slope CMB
12
FULL-SCALE CRASH TESTS
Four full-scale crash tests were conducted on the single-slope CMB to
eva 1 uate its performance with respect to structura 1 adequacy, occupant
risk, and vehicle exit trajectory. The first test involved a 4,500-lb
(2,043 kg) full-size automobile which impacted the single-slope CMB in a
temporary configuration. The second and third tests involved a 4,500-lb
(2,043 kg) full-size automobile and a 1,800-lb (817 kg) subcompact
automobile, respectively. The vehicles in the second and third tests
impacted the single-slope CMB in the permanent configuration. The fourth
test involved a 4,500-lb (2,043 kg) full-size automobile which impa.cted the
single-slope CMB in a temporary configuration.
The first three full-scale crash tests were conducted using four 30-ft
{9.1 m) single-slope CMB segments connected together to form a 120-ft
(36.4 m) longitudinal barrier. The fourth full-scale crash test was
conducted using six 30-ft (9.1 m) CMB segments for an overall length of 180
ft (54.6 m).
The barrier segments in the temporary barrier configurations were
.positioned on an existing concrete surface at the TTl test track. In the
first crash test, the four barrier segments were joined with the angle
spl ice temporary barrier connection without the reinforcing bar grid. In
the fourth crash test, the barrier segments were joined with the ungrouted
reinforcing bar temporary barrier connection. In both temporary
configurations, the single-slope CMB was not attached to the roadway
surface. These installations represent typical temporary installations.
The four 30-ft (9.1 m) barrier segments in the permanent barrier
configuration were positioned on a specially prepared subbase consisting of
2 in (5.1 em) of type D hot mix asphalt which was placed on top of 4 in
(10.2 em) of compacted crushed limestone. The subbase was prepared in an
area immediately adjacent to the concrete test track. The subbase area was
13
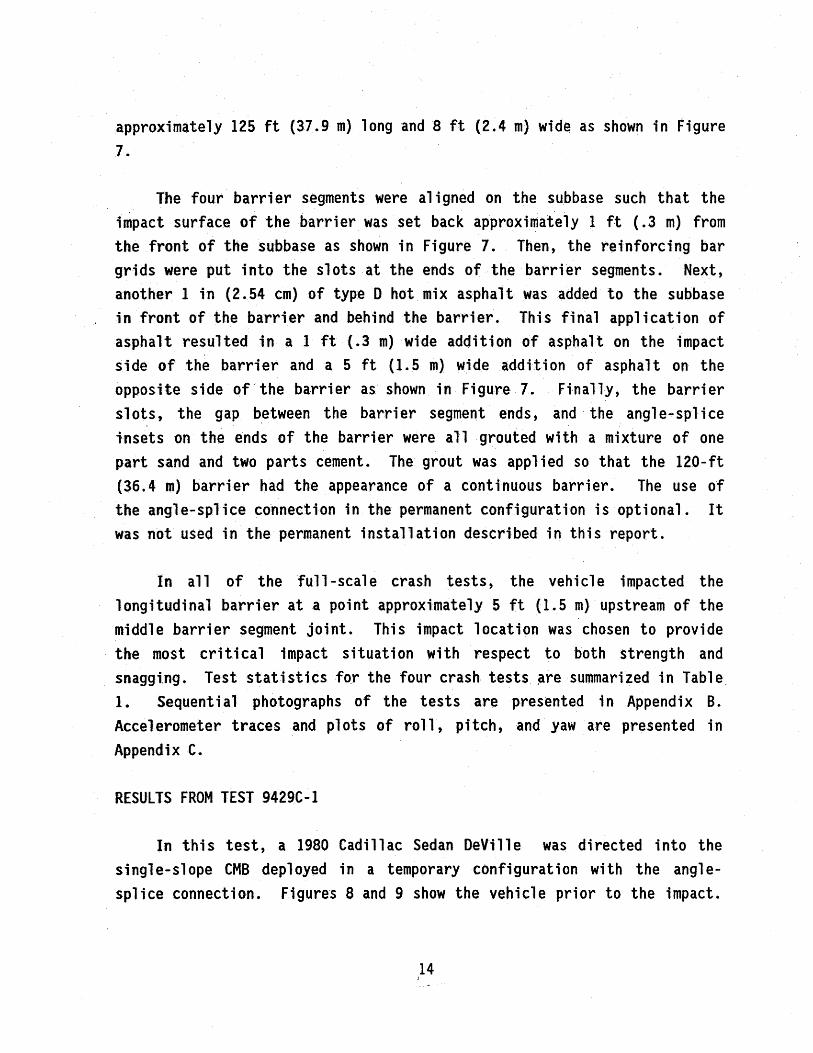
approximately 125 ft {37.9 m) long and 8 ft {2.4 m) wide as shown in Figure
7.
The four barrier segments were a 1 i gned on the. subbase such that the
impact surface of the barrier was set back approximately 1 ft { .3 m) from
the front of the subbase as shown in Figure 7. Then, the reinforcing bar
grids were put into the slots at the ends of the barri~r segments. Next,
another 1 in (2.54 em) of typ:e D hot mix asphalt was added to the subbase
in front of the barrier and behind the barrier. This final application of
asphalt resulted in a 1 ft (.3 m) wide addition of asphalt on the impact
side of the barrier and a 5 ft {1.5 m) wide addition of asphalt on the
opposite side of the barrier as shown in Figure 7. Finally, the barrier
slots, the gap between the barrier segment ends, and the angle-splice
tnsets on the ends of the barrier were all grouted with a mixture of one
part sand and two parts cement. The grout was applied so that the 120-ft
(36. 4 m) barrier had the appearance of a continuous barrier. The use of
the angle-splice connection in the permanent configuration is optional. It
was not used in the permanent installation described in this report.
In all of the full-scale crash tests, the vehicle impacted the
longitudinal barrier at a point approximately 5 ft (1.5 m) upstream of the
middle barrier segment joint. This impact location was chosen to provide
· the most cri ti ca 1 impact situation with respect to both strength and
snaggi.ng. Test statistics fo.r the four crash tests r1re summarized in Tab 1 e.
1. Sequential photographs of the tests are presented in Appendix B.
Accelerometer traces and plots of roll, pitch, and yaw are presented in
Appendix C.
RESULTS FROM TEST 9429C-1
In this test, a 1980 Cadillac Sedan DeVille was directed into the
single-slope CMB deployed in a temporary configuration with the angle
splice connection. Figures 8 and 9 show the vehicle prior to the impact.
14
15
c: 0 .,...
cx:a ::E: u 0.. 0 ,...... Vl I
Q) ,...... O'l c: .,...
...... m
Test No.
Vehicle Weight, lb (kg) I
1 Impact Speed, mi/h (km/hr)
I Exit Angle, degrees
Impact Angle, degrees
Displacement, in (em)
Occupant Impact Velocity ft/s (m/s)
Longitudinal Lateral
Occupant Ridedown Acceleration g's
Longitudinal Lateral
Vehicle Damage Classification TAD CDC
Table 1. Summary of crash test results
- --
9429C-1 9429C-2
4500(2043) 1800(817)
60.3(97.0) 60.7(97.70)
0.5 4.3
15.2 19.9
7.0(17.8) 0.0(0.0)
14.4(4.4) 15.7(4.8) 17.6(5.4) 27.7(8.4)
-2.5 -2.3 -7.7 -9.2
11LFQ4 11LFQ5 11FLEK2& 11LFEW3 11LFEW3
9429C-3 9429K-1 ------
4500.( 2043) 4500(2043)
63.1(101.5) 62.0(99.8)
8.5 3.5
26.5 15.1
0.0(0.0) 6.0(15.2)
22.1(6.7) 16.3(5.0) 28.9(8.8) 18.4(5.6)
-4.2 -3.2 -10.7 -6.2
llLFQS 11FLQ4 11LFAW3 11FLEK2&
11LFEW1
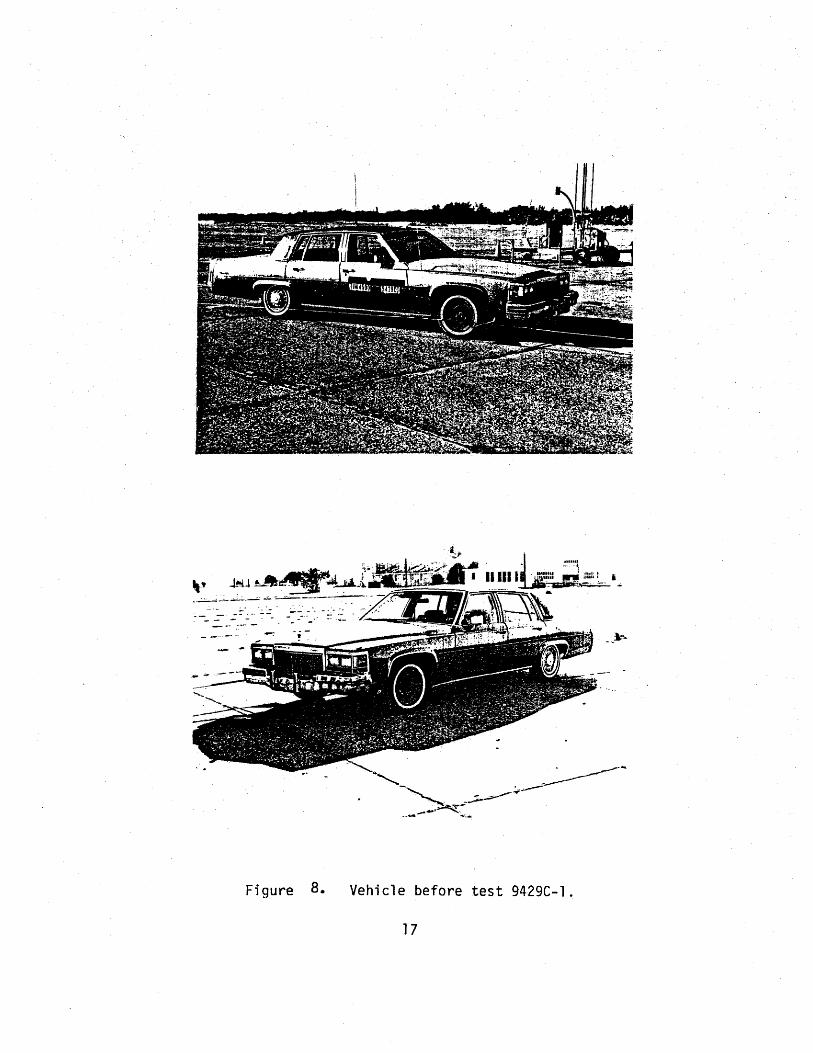
Figure 8. Vehicle before test 9429C-l.
17
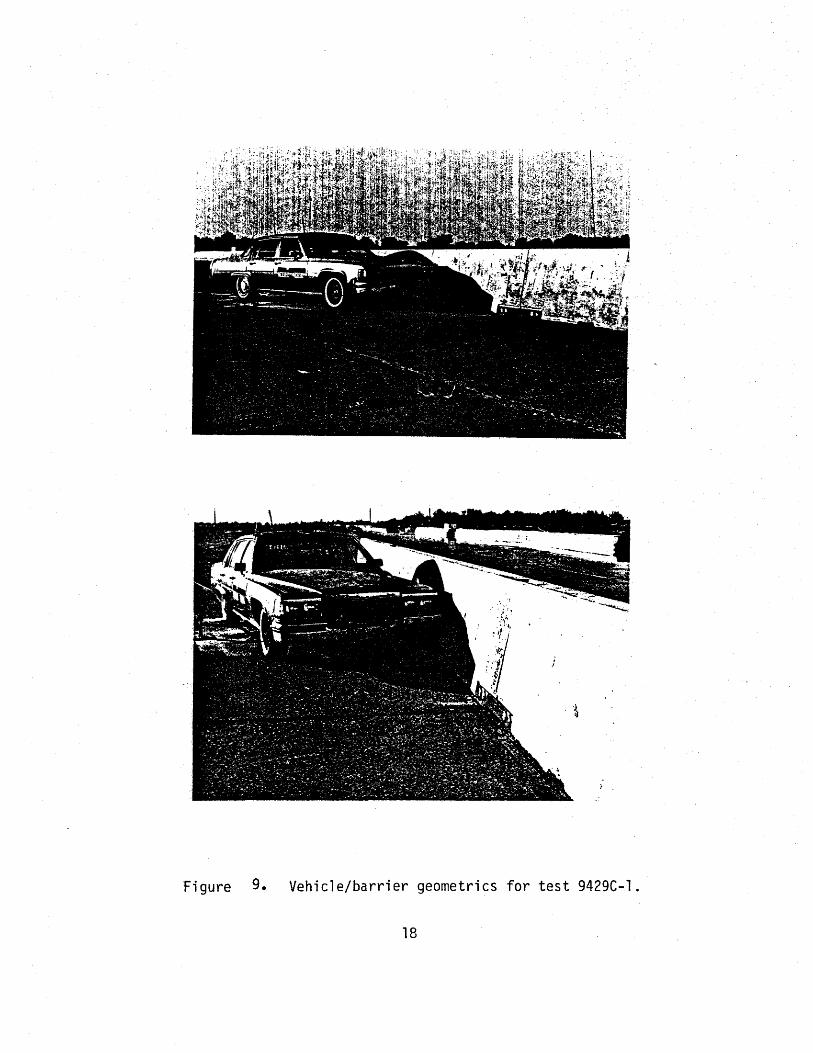
Figure 9. Vehicle/barrier geometries for test 9429C-l.
18
The vehicle was propelled into the barrier using a reverse tow and guidance
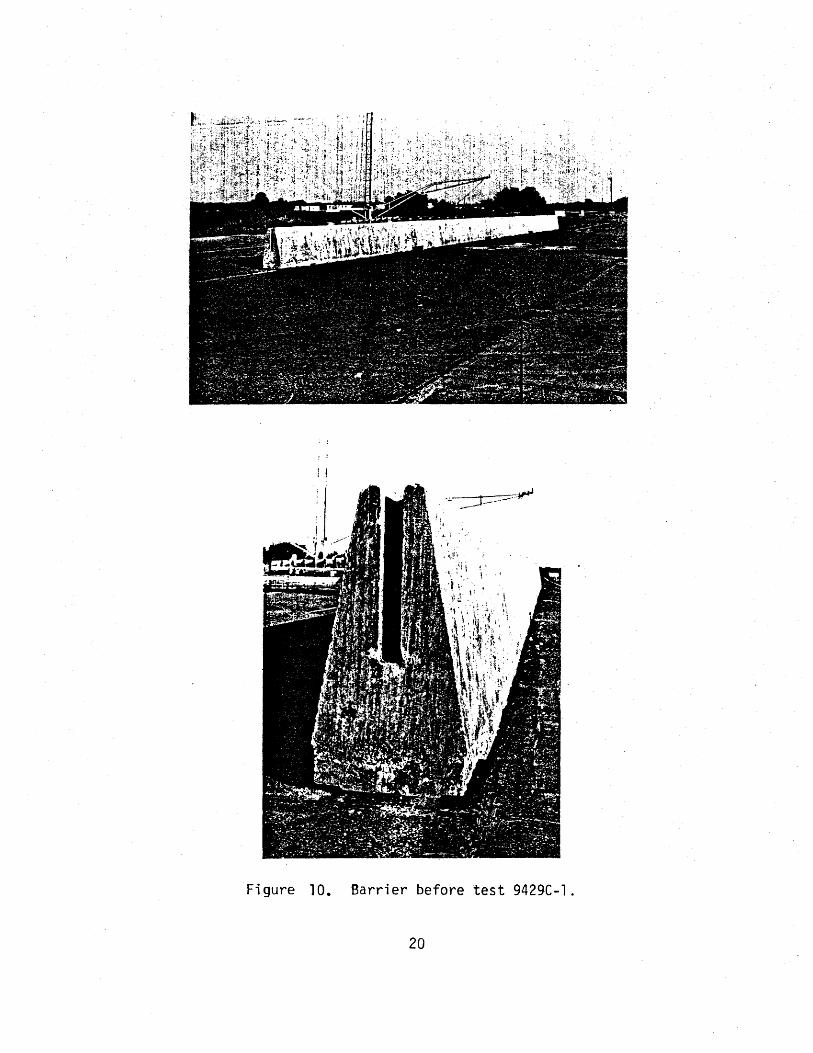
system. Figure 10 presents the temporary barrier prior to the impact. The
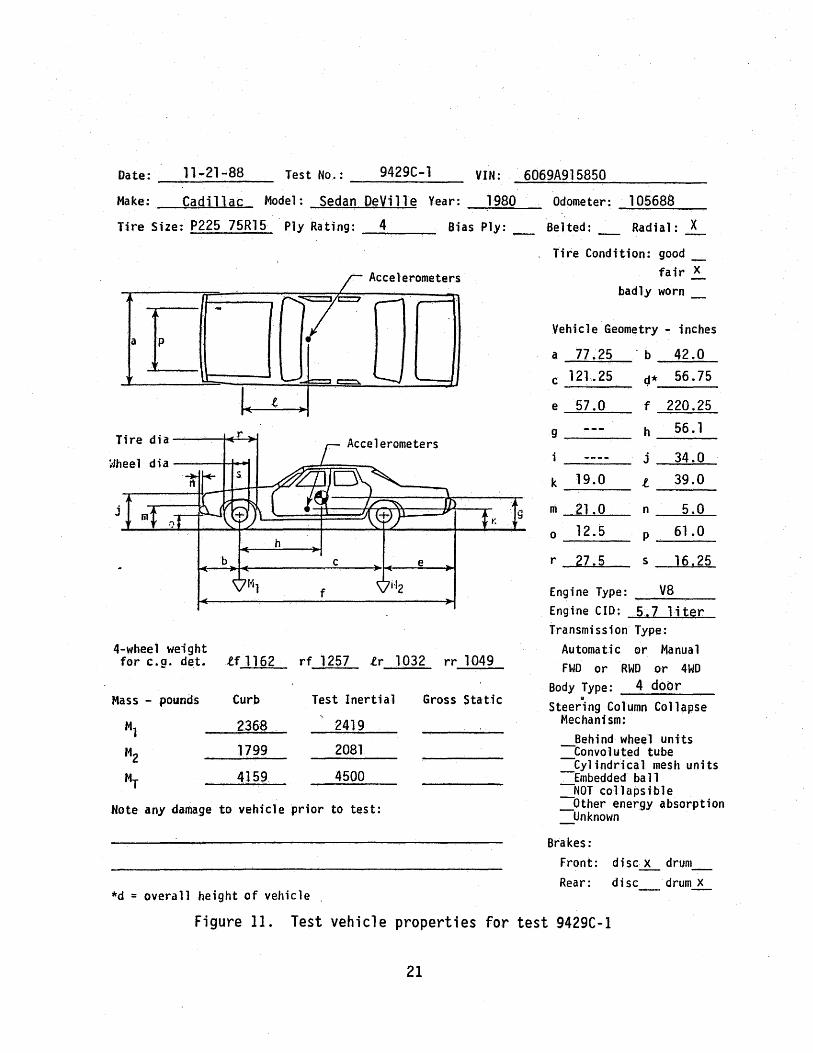
test inertia mass of the vehicle was 4,500 lb (2,043 kg). The height to
the lower edge of the vehicle bumper was 12.5 in (31.8 em) and it was
21 .. 0 in (53.3 em) to the top of the bumper. Other dimensions and
information on the test vehicle are presented in Figure 11. The vehicle
was free-wheeling and unrestrained just prior to the impact.
The speed of the vehicle at impact was 60.3 mi/h (97.0 km/h) and the
angle of impact was 15.2 degrees. The vehicle impacted the barrier
approximately 55 ft (16.8 m) from the upstream end of the barrier. The
left front wheel of the vehicle made contact with the barrier at
approximately 0.029 seconds after impact and shortly thereafter the tire
began to ride up the face of the barrier. The vehicle began to redirect at
0.049 seconds. At about 0.160 seconds, the rear of the vehicle struck the
barrier and by 0.173 seconds the vehicle was traveling parallel to the
barrier at a speed of 51.9 mi/h (83.5 km/h). The vehicle lost contact with
the barrier at 0.462 seconds traveling at a velocity of 51.3 mi/h
(82.5 km/h) and with an -angle of 0.5 degrees away from the barrier. The
brakes were then applied and the vehicle yawed in a counter-clockwise
direction and subsequently came to rest 240 ft {73 m) from the point of
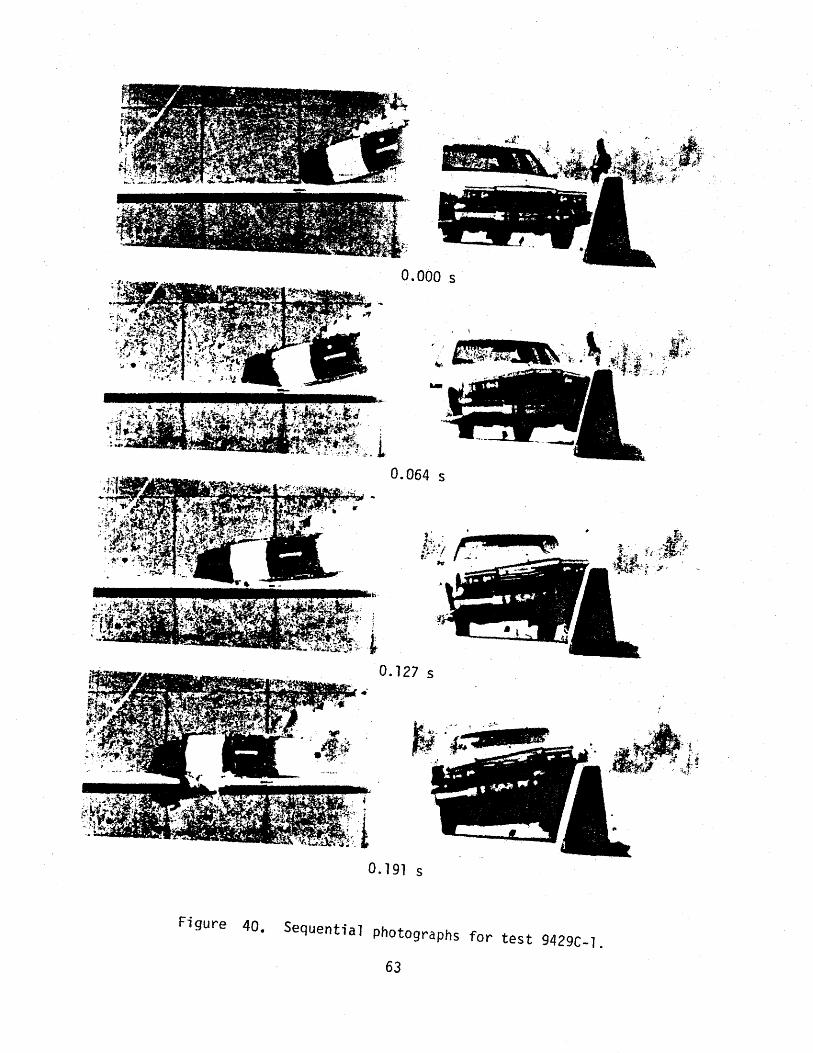
impact. Sequential photographs of the impact are shown in Figure 40 in
Appendix B.
As shown in Figures 12 and 13, the barrier received only minimal
cosmetic damage. There were tire marks on the face of the barrier to a
maximum height of 31 in {79 em). The bumper scraped the barrier at a
height of 42 in (107 em). The vehicle was in contact with the barrier for
17 ft (5.2 m). The maximum lateral movement of the barrier was 7 in
(17.8 em) at the middle joint of the barrier.
The vehicle sustained moderate damage to the left side as shown in
Figures 14 and 15. Maximum crush at the left front corner at bumper height
19
! I
Figure 10. Barrier before test 9429C-l~
20
Date: _.....,1_1_·-_21_-_8_8 __ Test No. : _ __,__9_42_9_C_-_1 __ VIN: 6069A915850
Make: __ c-=-=a:.:d::...:i~l...:.l,.::;a.:::.c _ Model: Sedan DeYi lle Year: 1980 Odometer~ 105688 _..;;..~~;.,..__-
Tire Size: P225 75Rl5 Ply Rating: 4 ------ Bias Ply: _ Belted: Radial: X
Tire d i a --..__..;.--~~
~.Jheel dia __ __, ......... -eo~ Accelerometers
j
h
c e
f
4-wheel weight for e.g. det. tf 1162 rf 1257 tr 1032 rr 1049
Mass - pounds Curb Test Inertial Gross Static
Ml 2368 2419
M2 1799 2081
MT 4159. 4500
Note any damage to vehicle prior to test:
*d = overall height of vehicle .
g
Tire Condition: good ~
fair X -badly worn_
Vehicle Geometry - inches
a 77.25 'b 42.0
c 121.25 Q* 56.75
e 57.0 f 220.25
9 h 56.1
j 34.0
k 19.0 l 39.0
m 2] .0 n 5.0
0 12.5 p 61.0
r 2715 s 16125
Engine Type: ___ v_a...;.._,. __
Engine CID: 5.7 liter Transmission Type:
Automatic or Manual
FWD or RWD or 4WD
Body Type: 4 door Steer"ing Column Collapse
Mechanism:
Behindwheel units -Convoluted tube -Cylindrical mesh units -Embedded ba 11 -NOT collapsible
Other energy absorption _Unknown
Brakes:
Front: discL drum_
Rear: disc drum~
Figure 11. Test vehicle properties for test 9429C-1
21
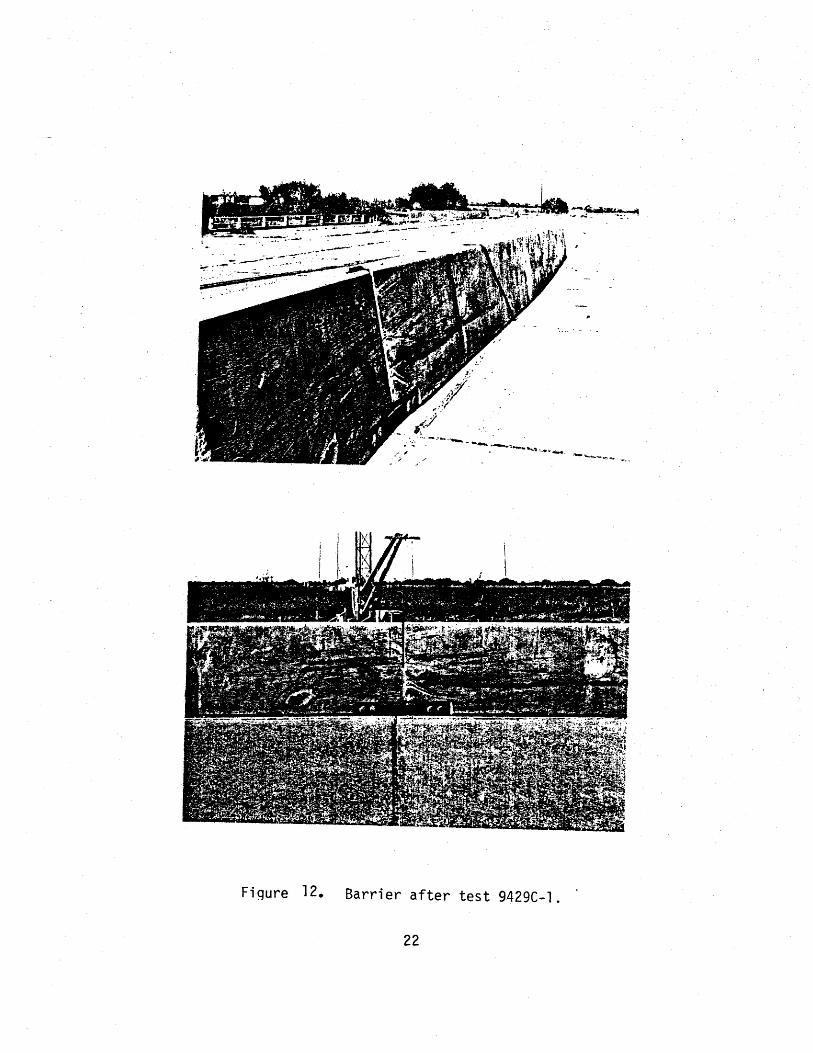
Fi qure 12. Barrier after test 9429C-l.
22
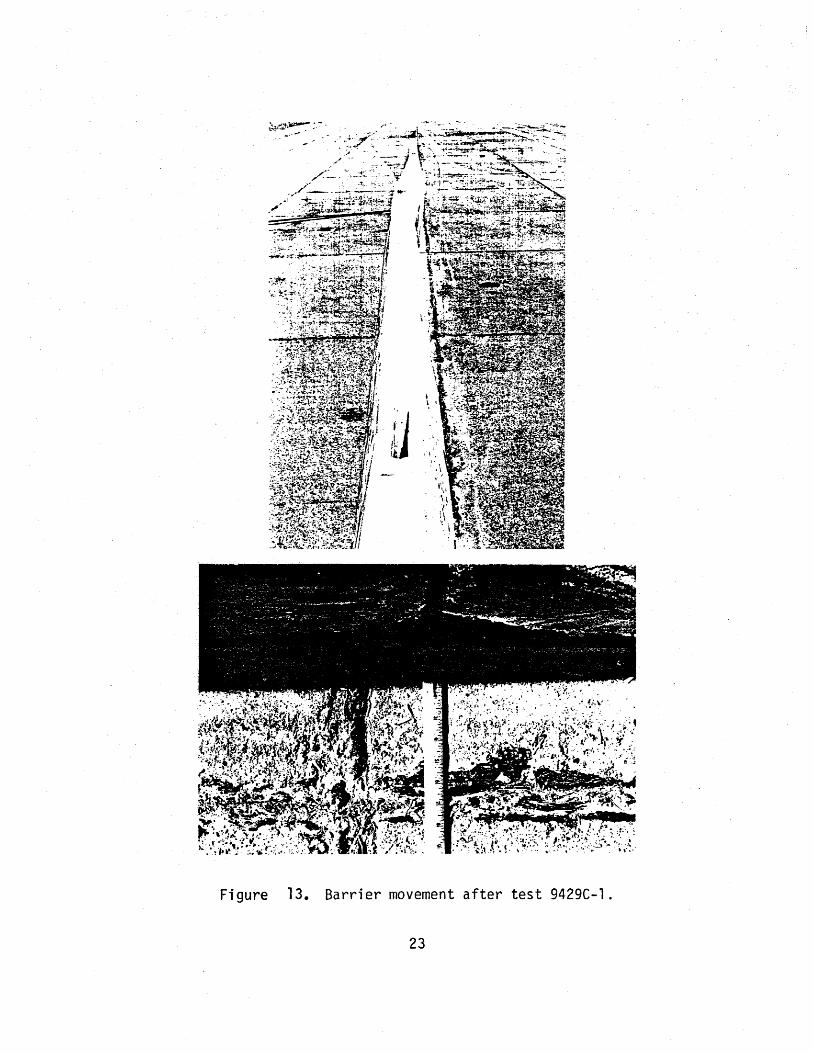
Figure 13. Barrier movement after test 9429C-l.
23
;,if
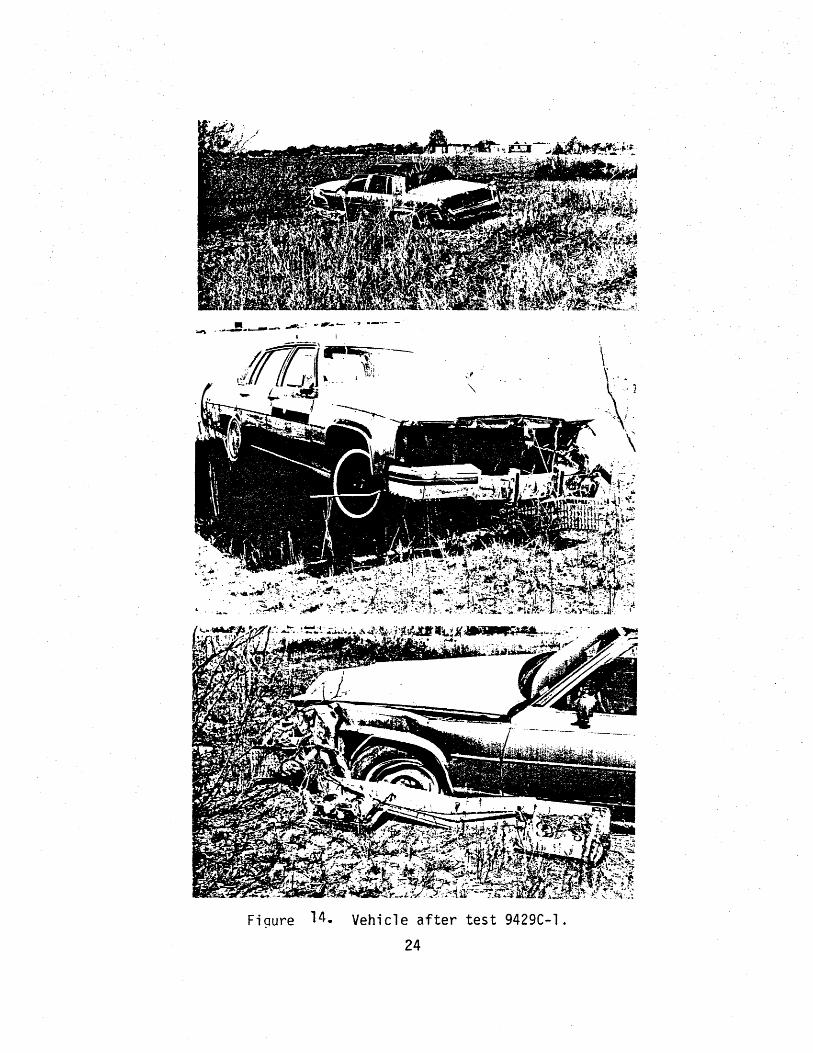
Figure 14. Vehicle after test 9429C-l.
24
\ \\.· ~J
. ..... ,'
\
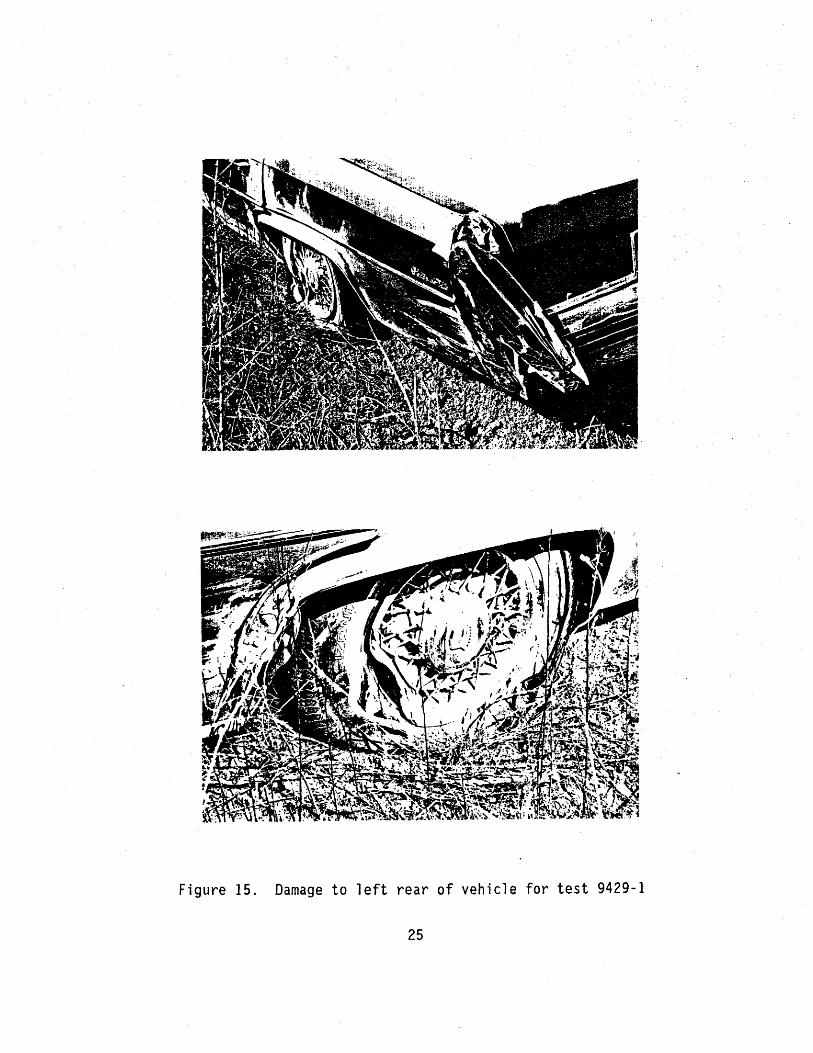
Figure 15. Damage to left rear of vehicle for test 9429-1
25
was 12.0 in (30.7 em). The left front rim was bent and the tire damaged. There was damage to the hood, grill, bumper, left front quarter panel, the left front ?lnd rear doors, the left rear quarter panel and the rear bumper.
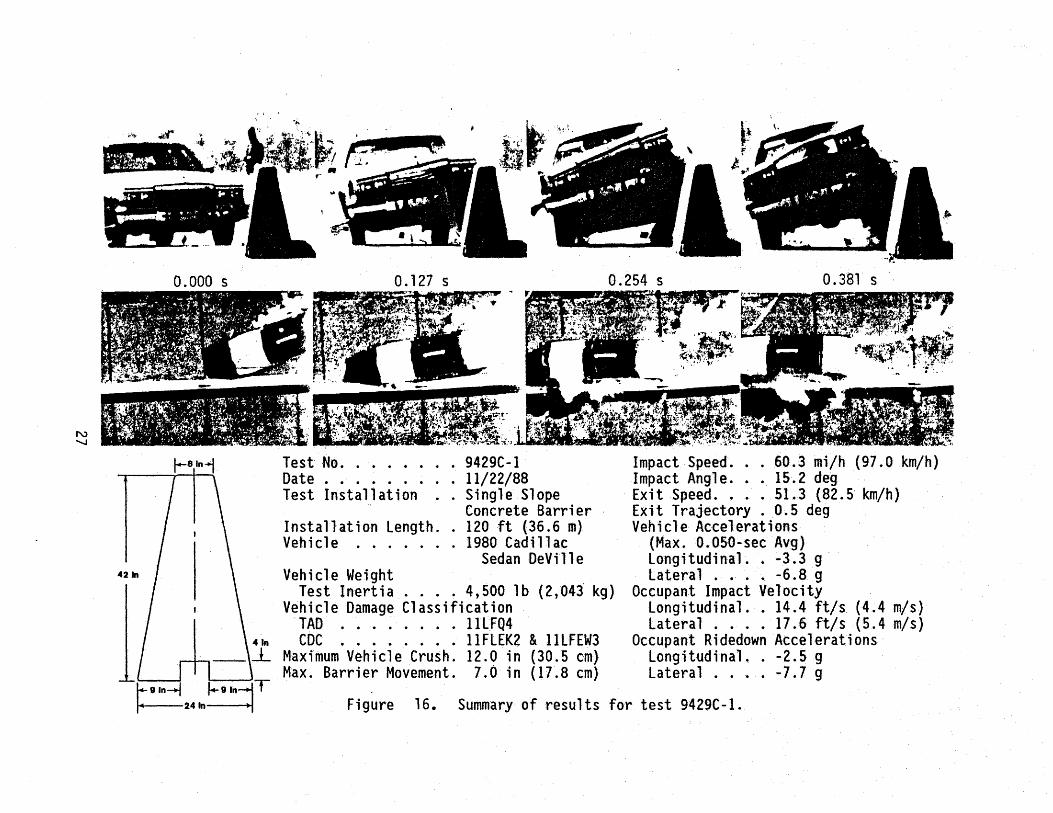
As stated previously, the impact speed was 60.3 mi/h (97 .0 km/h) and the angle of impact was 15.2 degrees. The vehicle lost contact with the barrier traveling at 51.3 mi/h (82.5 km/h) and 0.5 degrees. NCHRP 230 describes occupant risk evaluation criteria and places limits on these for acceptable performance for tests conducted with 1,800 lb-(817 kg) vehicles (1). These limits do not apply to tests conducted with 4,500-lb (2,043 kg) vehic 1 es but were computed and reported for info.rmat ion on 1 y. The occupant impact velocity was 14.4 ft/s {4.4 m/s) in the longitudinal direction and 17.6 ft/s (65.4 m/s) in the lateral direction. The highest 0.010 second occupant ridedown accelerations were -2.5 g (longitudinal) and -7.7 g (1 atera 1). These data and other pertinent i nformatton from the test are summarized in Figure 16.
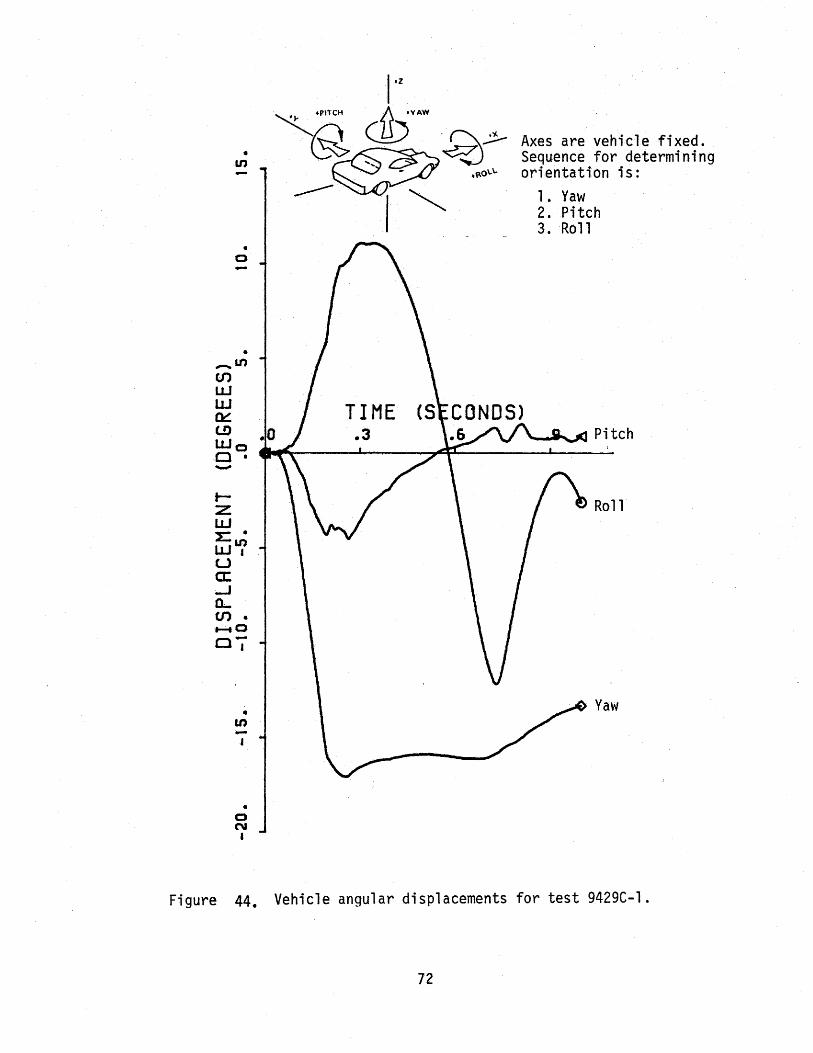
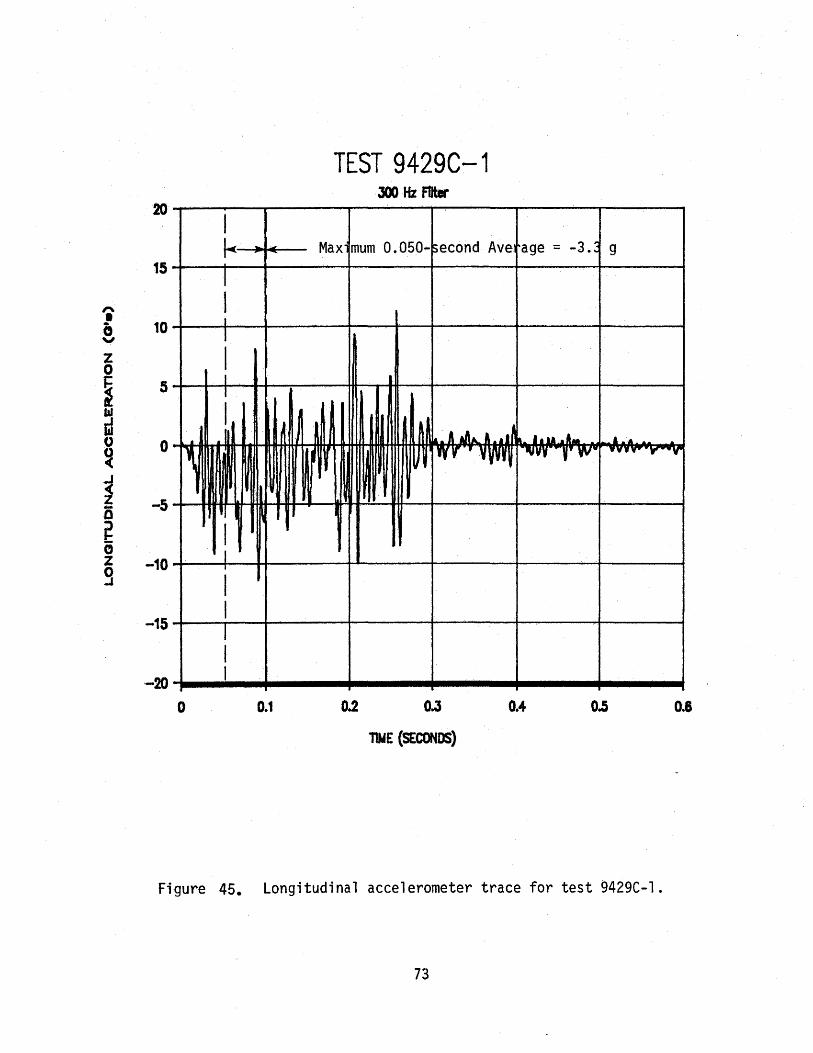
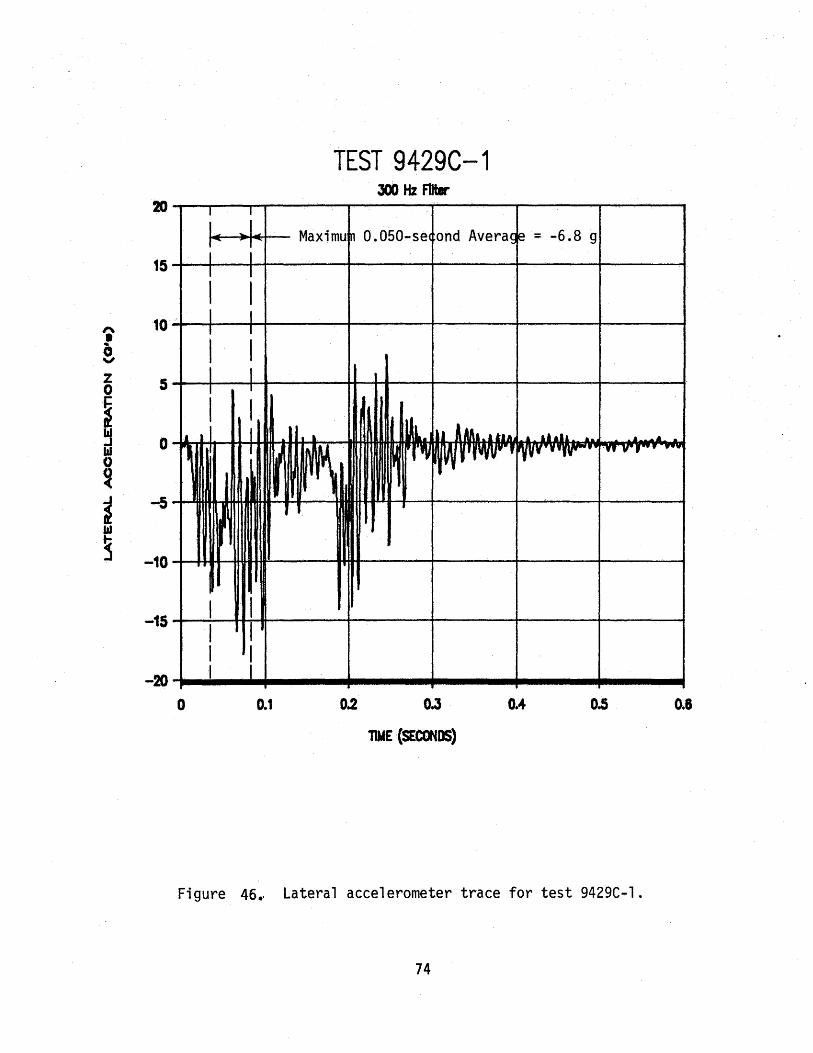
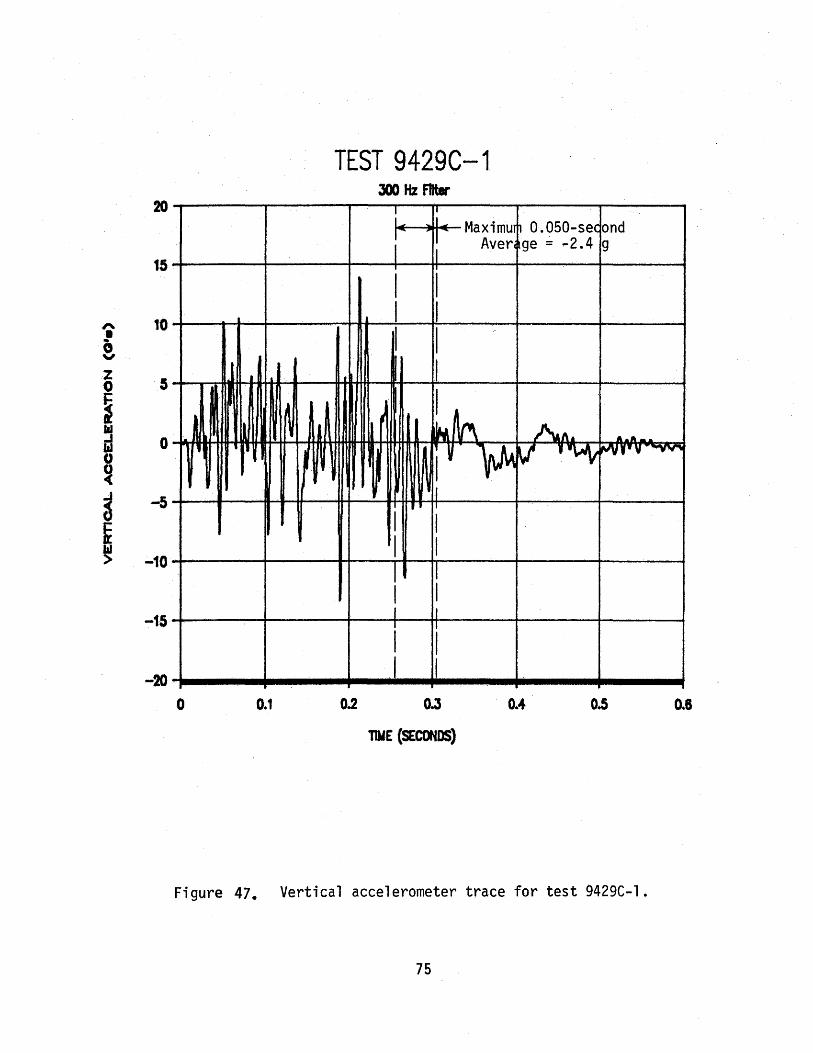
Vehicular angular displacements are displayed in Figure 44 of Appendix B. Vehicular accelerations versus time traces fi 1 tered at 300 Hz are presented in Figures 45 through 47 in Appendix C. These data were further analyzed to obtain the 0.050 second average accelerations. The maximum 0.050 second average accelerations measured near the vehicle center-ofgravity were -3.3 g (longitudinal) and -6.8 g (lateral).
These test results show that the barrier contained and smoothly redirected the test vehicle with 1 ittle lateral movement of the barrier. There was no intrusion into the occupant compartment and minimal deformation of the occupant compartment. The vehicle remained upright and relatively stable during the collision. The vehicle trajectory at loss of contact indicates minimum intrusion into the adjacent traffic lanes.
26
N .......,
0.000 s 0.127 s 0.254 s 0.381 s
~.~~~}~,~·};~~;·{~(1~ .:1:';:·~ ·'il,1Lltf5-f~';~; o•;k" f\,1• ~,tf··, .. ~,., .. ., .... ~· c·r-~· :~ ·~~~::~~?f1.·~~~~:f .~J~~~~~~t~::~.. ,
Test No •••••••• 9429C-l Date ......•.. 11/22/88 Test Installation .. Single Slope
Concrete Barrier Installation Length .. 120 ft (36.6 m) Vehicle ....... 1980 Cadillac
Sedan DeVille Vehicle Weight
Test Inertia .... 4,500 lb {2,043. kg) Vehicle Damage Classification
TAD ........ 11LFQ4 CDC •....... 11FLEK2 & lllfEW3
Maximum Vehicle Crush. 12.0 in {30.5 em) Max. Barrier Movement. 7.0 in {17~8 em)
Impact Speed •.. 60.3 mi/h (97.0 km/h) Impact Angle .•• 15~2 deg Ex i t S.peed. • . . 51. 3 ( 82 . 5 km/h) Exit Trajectory . 0.5 deg Vehicle Accelerations
(Max. 0.050-sec Avg) Longitudinal .• -3.3 g Lateral ...• -6.8 g
Occupant Impact Velocity Longitudinal .. 14.4 ft/s (4.4 m/s) later a 1 . . . . 17 . 6 ft/ s ( 5 . 4 m/ s )
Occupant Ridedown Accelerations· Longitudinal .. -2.5 g lateral .... -7.7 g
Figure 16. Summary of results for test 9429C-1.
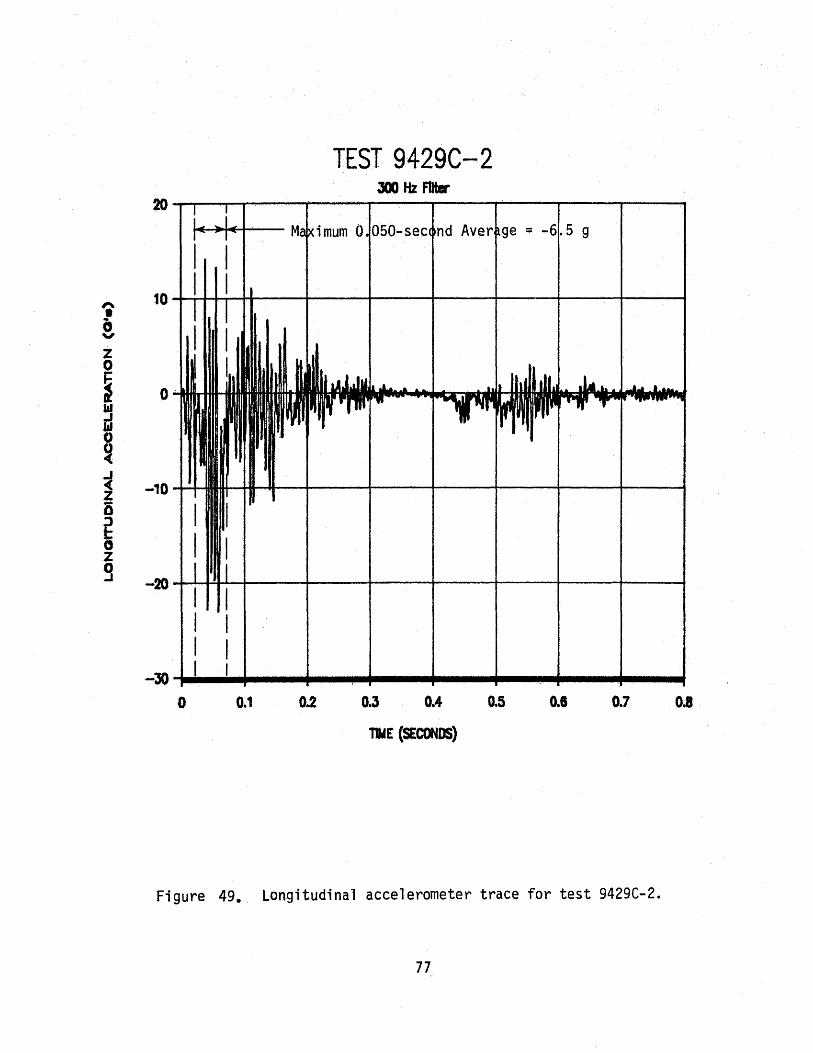
RESULTS FROM TEST 9429C--2
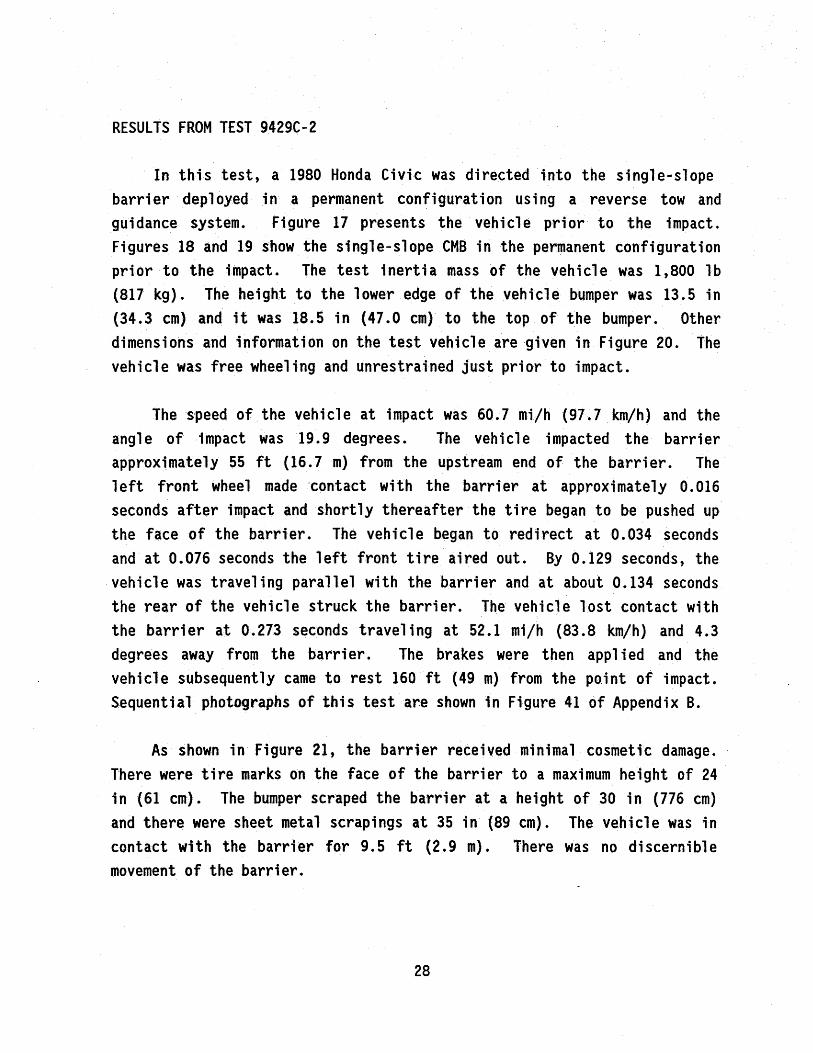
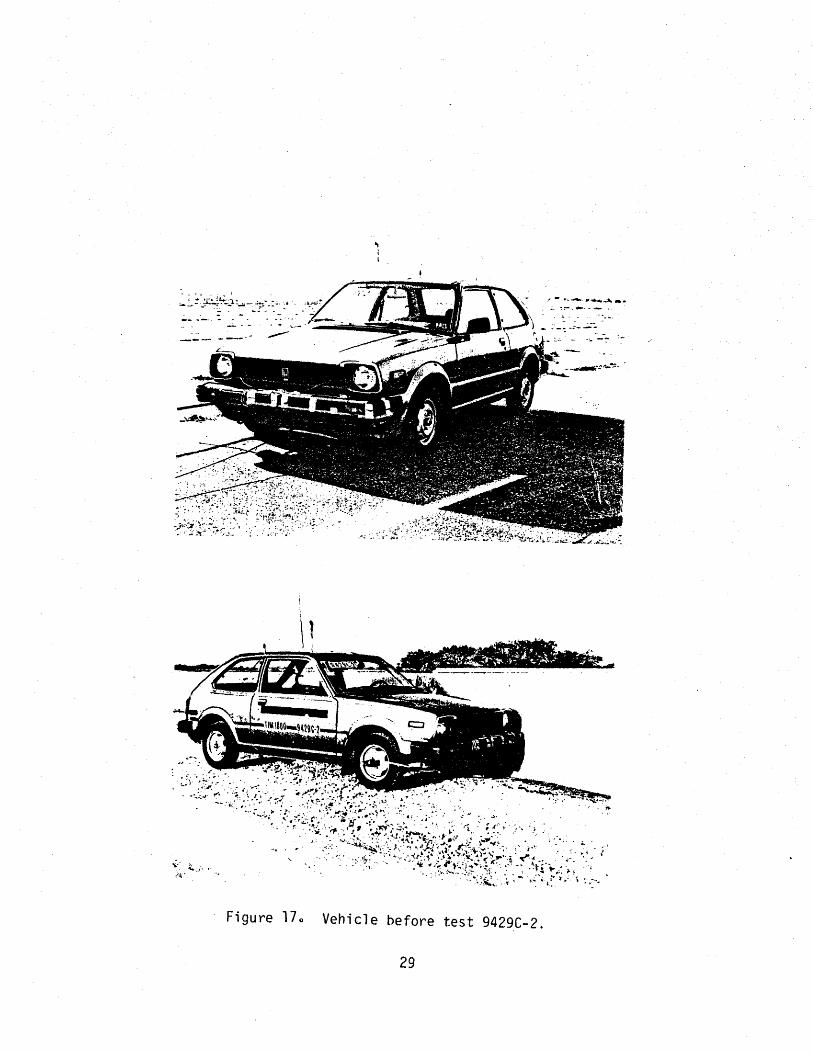
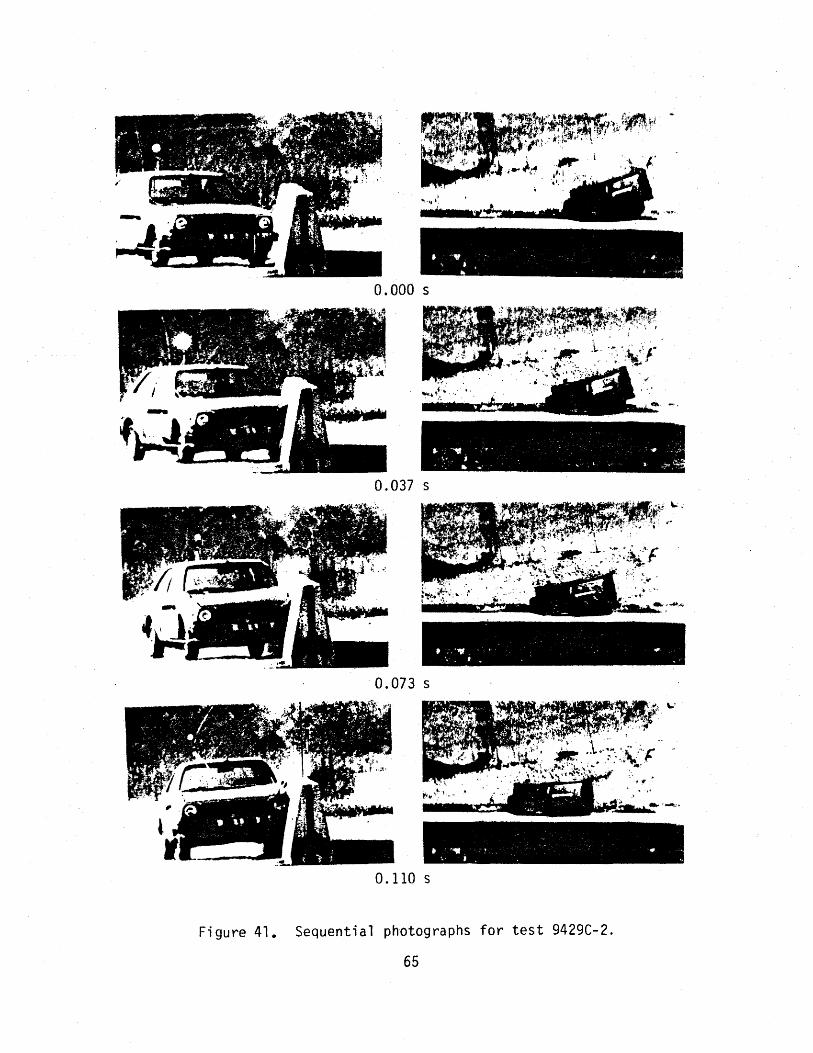
In this test, a 1980 Honda Civic was dire~ted into the single-slope barrier dep 1 oyed in a permanent configuration using a reverse tow and guidance system. Figure 17 presents the vehicle prior to the impact. Figures 18 and 19 show the single-slope CMB in the permanent configuration prior to the impact. The test inertia mass of the veh i c 1 e was 1, 800 lb (817 kg). The height to the lower edge of the vehicle bumper was 13.5 in (34.3 em) and it was 18.5 in (47 .0 em) to the top of the bumper. Other dimensions and information on the test vehicle are given in Figure 20. The vehicle was free wheeling and unrestrained just prior tn impact.
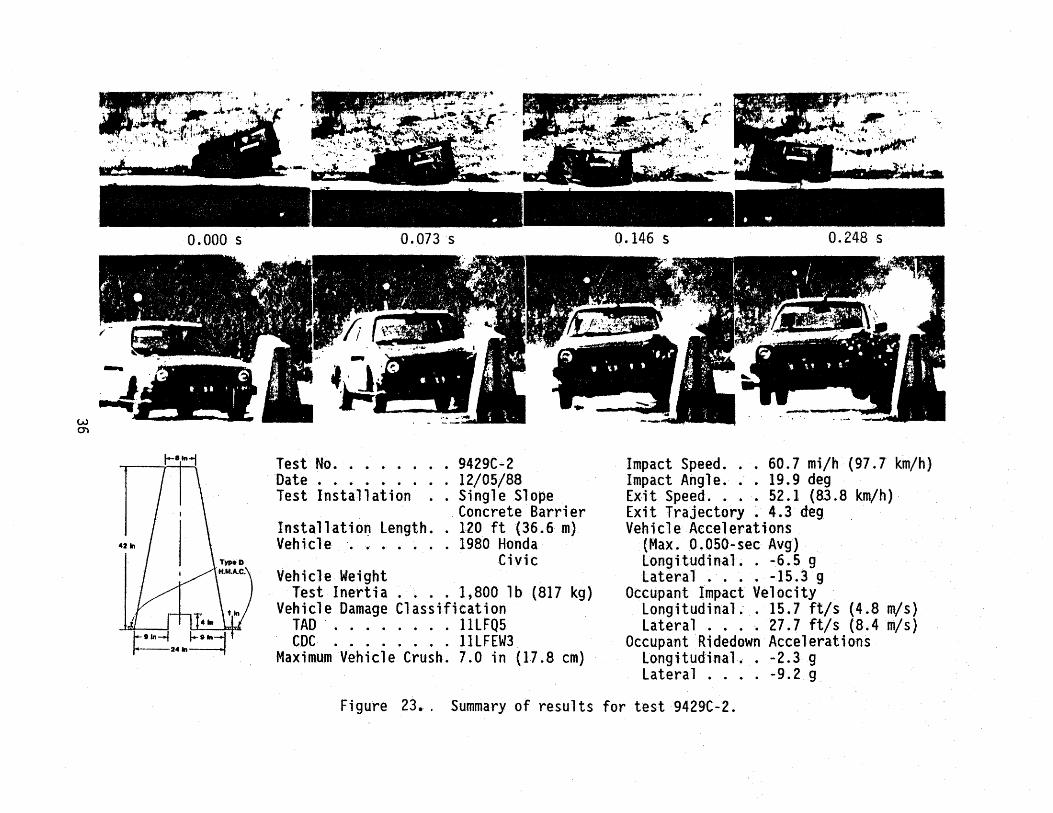
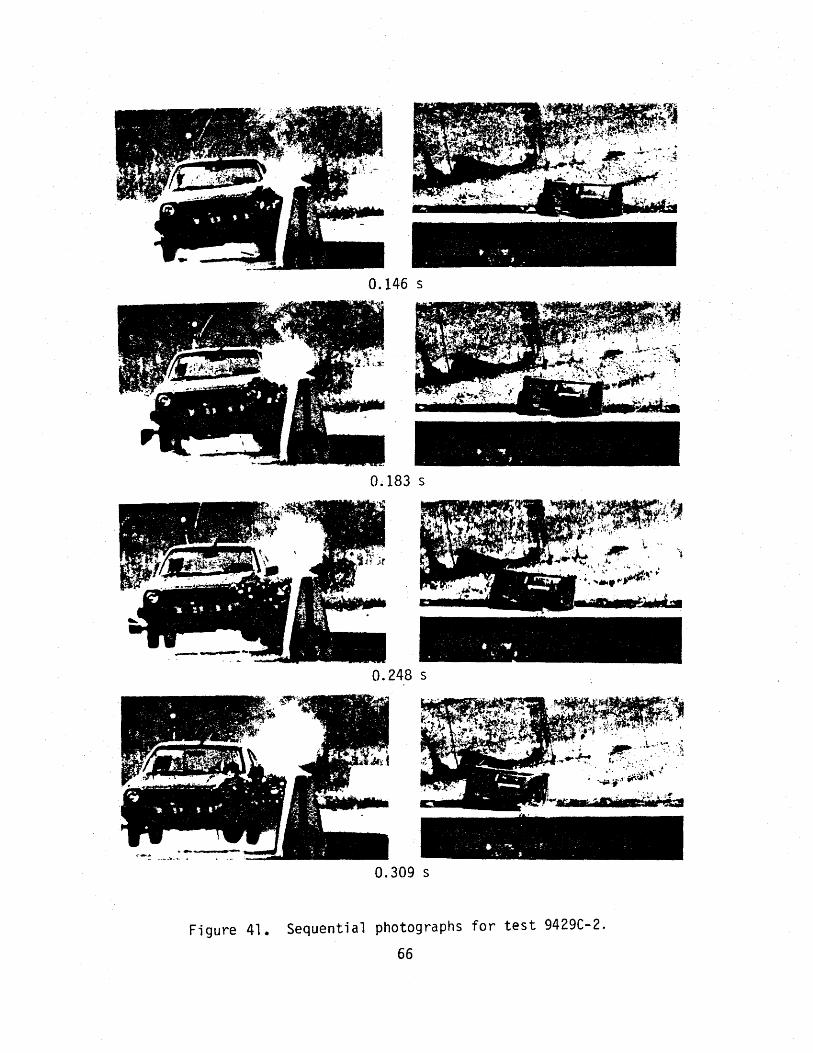
The speed of. the vehicle at impact was 60.7 mi/h (97. 7 km/h) and the angle of impact was 19.9 degrees. The vehicle impacted the barrier approximately 55 ft (16.7 m) from the upstream end of the barrier. The left front wheel made 'Contact with the barrier at approximately 0.016 seconds after impact and shortly thereafter the tire began to be pushed up the face of the barrier. The vehicle began to redirect at 0.034 seconds and at 0.076 seconds the left front tire aired out. By 0.129 seconds, the vehicle was traveling parallel with the barrier and at about 0.134 seconds the rear of the vehicle struck the barrier. The vehicle lost contact with the barrier at 0.273 seconds traveling at 52.1 mi/h (83.8 km/hl and 4.3 degrees away from the barrier. The brakes were then app 1 i ed and the vehicle subsequently came to rest 160 ft (49 m) from the po,int of impact. Sequential photographs of this test are shown in Figure 41 of Appendix B.
As shown in Figure 21, the barrier received minimal cosmetic damage. There were tire marks on the face of the barrier to a maximum height of 24 in (61 em). The bumper scraped the barrier at a height of 30 in (776 em) and there were sheet metal scrapings at 35 in (89 em). The vehicle was in contact with the barrier for 9.5 ft (2.9 m). There was no discernible movement of the barrier.
28
.,. .. · ~,_ .... -<"<\.
Figure 17 o
i I
Vehicle before test 9429C-2.
29
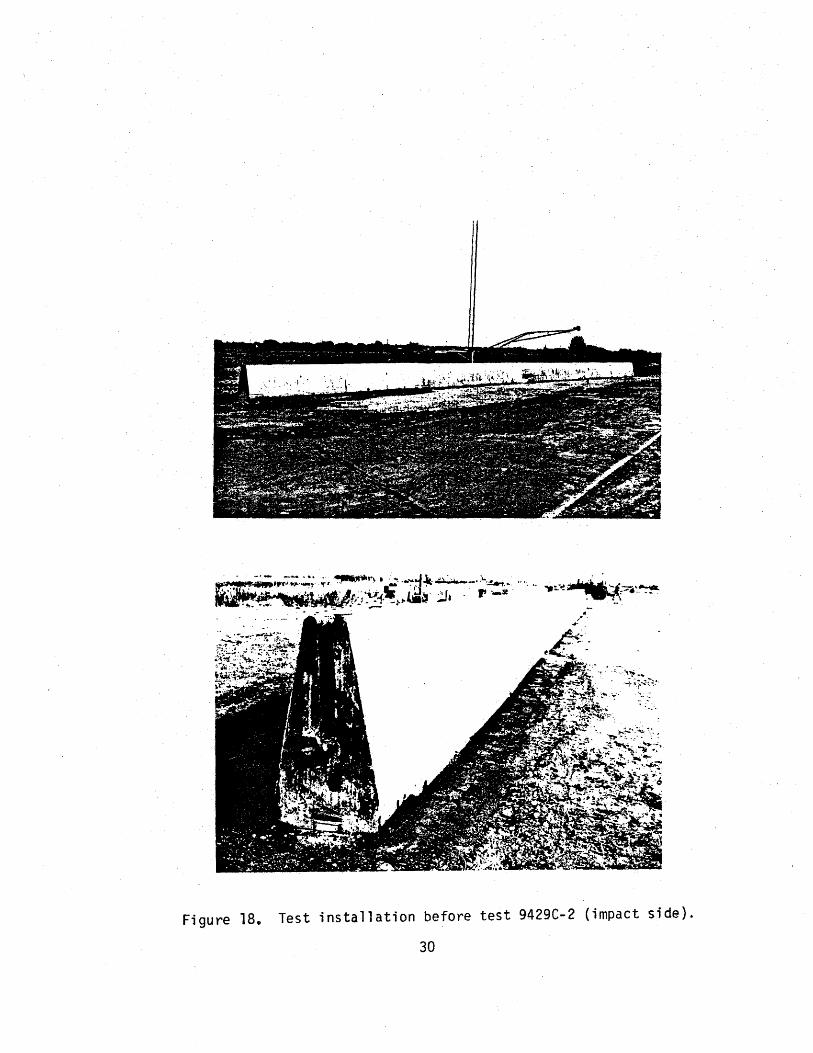
Figure 18. Test installation before test 9429C-2 (impact side).
30
-~···
Figure 19o Test installation before test 9429C-2 {rear side).
31
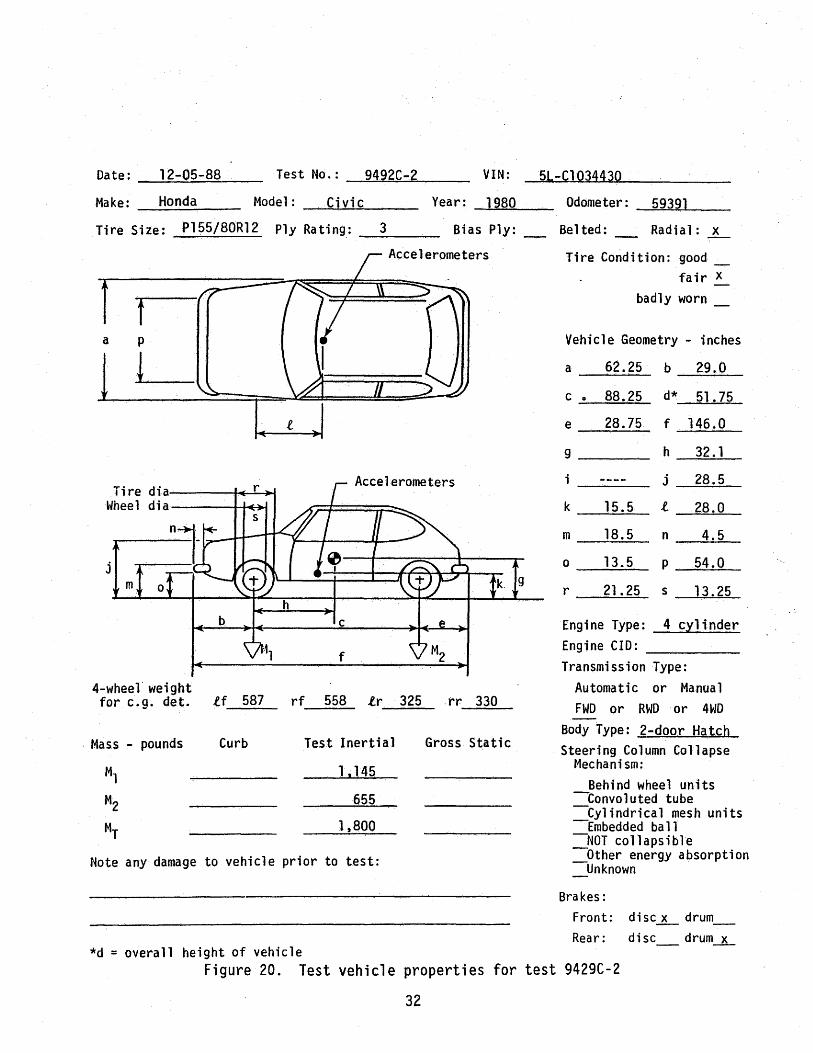
Date: ......_;...;:.,1.;;:..2-_..,;0;....;;;5;.._-...;;..88~-- Test No.: 9492C-2 ----.:::;.._:..:;=--"=----'---
VIN: 5L-Cl034430
Make: Honda -------- Model: _ ..... C;,....;.i __ v~ic._· __ _ Year: 1980 Odometer: 59391
Tire Size: . P155/80R12 Ply Rating_: __ 3 __ _ Bias Ply: _ Belted: Radial: x
f f a p
L_
Tire d i a------toE.....:....~ Wheel dia----++~
j
m
4-wheel· weight for e.g. det. lf 587
Mass - pounds Curb
Accelerometers
Accelerometers
f
rf 558 lr 325 rr 330
Test Inertial Gross Static
1,145
655
1,800
Note any damage to vehicle prior to test:
*d = overall height of vehicle
Tire Condition: good _ fair X
badly worn_
Vehicle Geometry - inches
a 62.25
c 0 88.25
e 28.75
9 ___ ___
m 18.5
0 -~13;;,..;•;...,;5.._. -
r ---=21.;_•;..::2::...;::5_
b
d*
f
h
j
l
n
p
s
29.0
51.75
146.0
32.1
28.5
28.0
4.5
54.0
13.25
Engine Type: 4 cylinder
Engine CID: ------Transmission Type:
Automatic or Manual FWD or RWD or 4WD
Body Type: 2-door Hatch Steering Column Collapse
Mechanism: Behind wheel units
--Convoluted tube -Cylindrical mesh units -Embedded ba 11
NOT collapsible Other energy absorption
-Unknown
Brakes: Front: disc~ drum_ Rear: disc drum_x_
Figure 20. Test vehicle properties for test 9429C-2
32
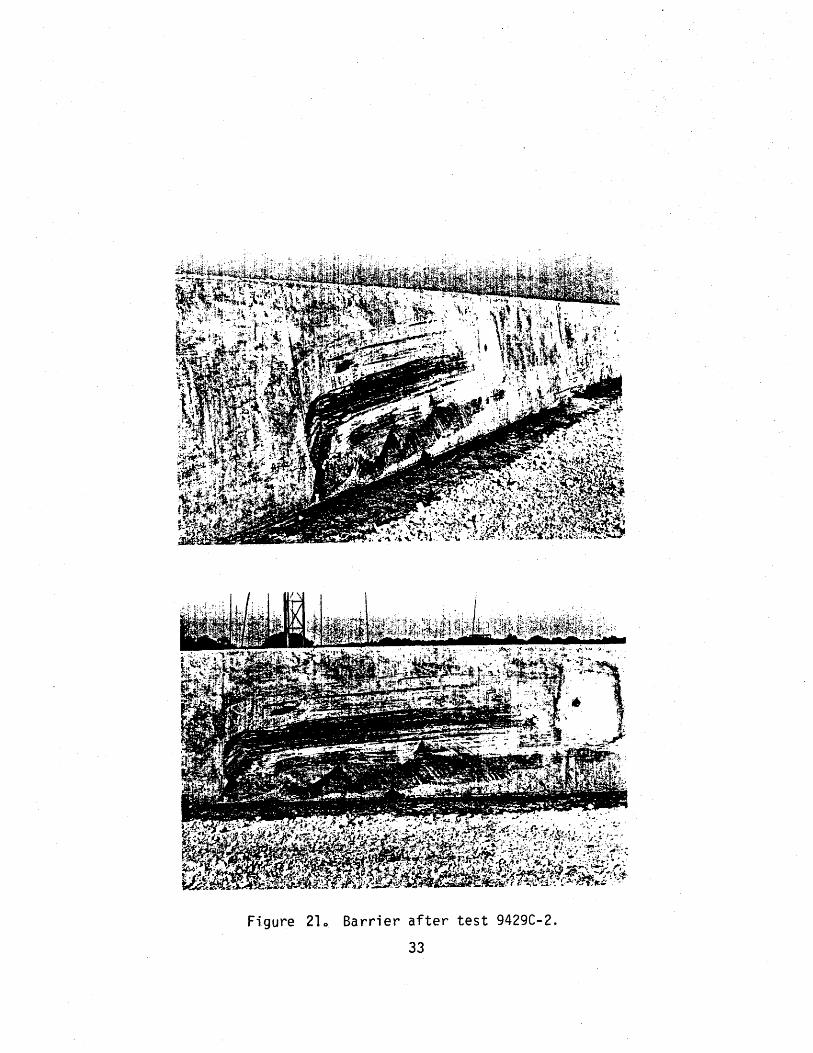
Figure 2lc Barrier after test 9429C-2.
33
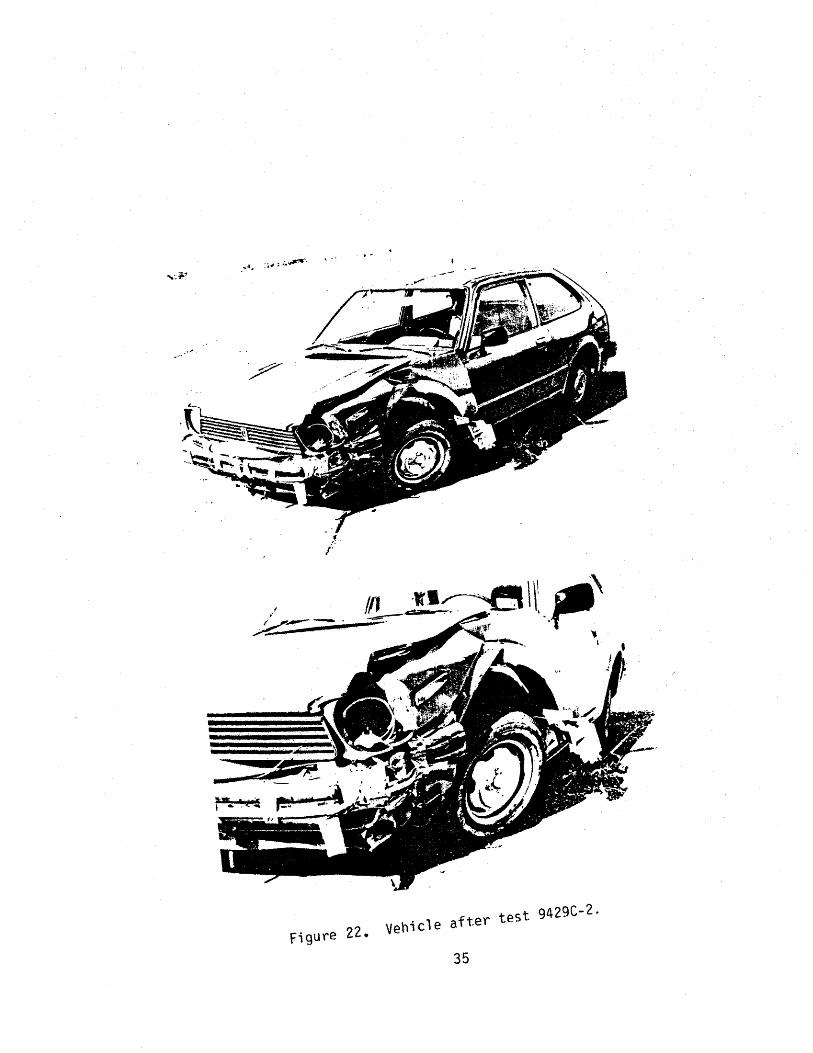
The vehicle sustained moderate damage to the left side as shown in
Figure 22. Maximum crush at the left front corner at bumper height was 7.0
in (17 .8 em):. The left front and rear struts were damaged, the 1 eft front
rim was bent, and the tire was damaged. There was damage to the hood,
grill, front bumper, left front quarter panel, the left door, the left rear
quarter panel and the rear bumper.
As stated previously, the impact speed was 60.7 mi/h (97.7 km/h) and
the angle of impact was 19.9 degrees. The vehicle lost contact with the
barrier traveling at 52.1 mi/h (83.8 km/ h) and with an angle of 4.3
degrees with the barrier. NCHRP 230 describes occupant risk eva 1 uat ion
criteria and places 1 imi ts on these for acceptable performance for tests
conducted with 1,800-lb (817 kg} vehicles impacting longitudinal barriers
with a speeds of 60 mph (96 km/h) and angles of 15 degrees (1). These
limits do not apply to this particular test because the impact angle was 20
degrees. However, these limits were computed and reported for information
purposes only. The occupant impact velocity was 15.7 ft/s (4.8 m/s} in the
longitudinal direction and 27.7 ft/s (8.4 m/s) in the lateral direction.
The highest 0.010 second occupant ridedown accelerations were -2.3 g
(longitudinal) and -9.2 g (lateral}. These data and other pertinent
information from the test are summarized in Figure 23.
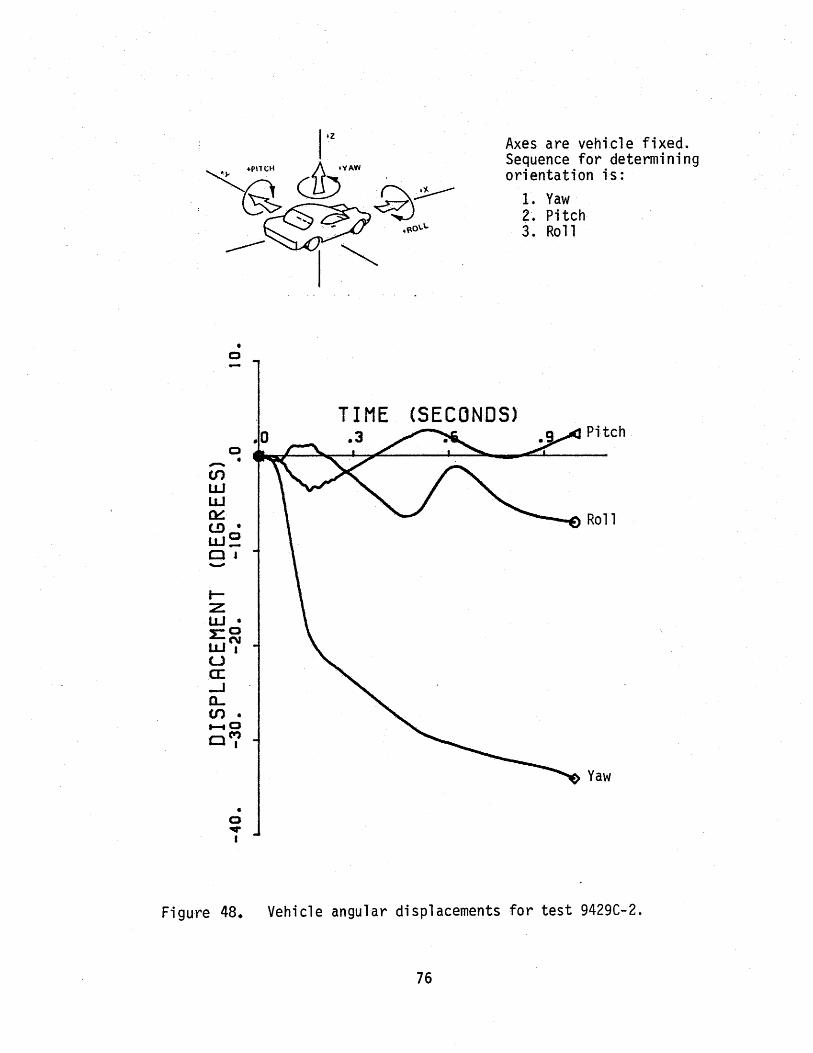
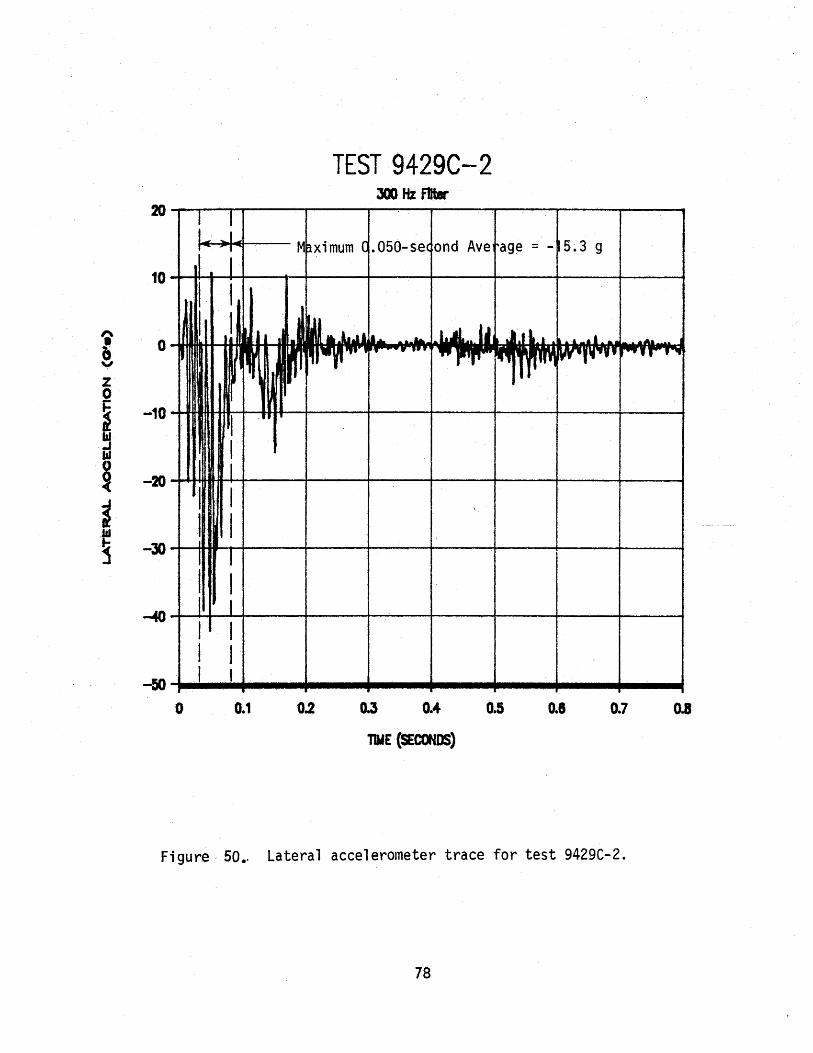
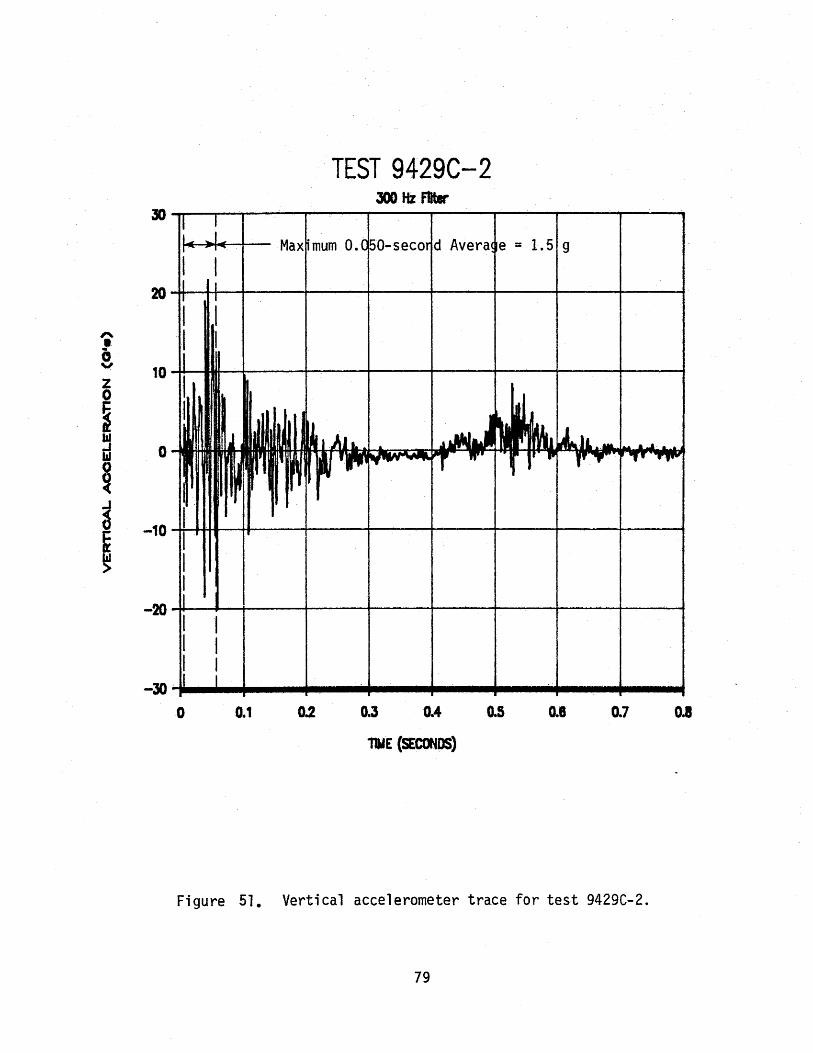
Vehicle angular displacements are displayed in Figure 48 in Appendix
B. ·Vehicular accelerations versus time traces fi 1 tered at 300 Hz are
p.resented in Figures 49 through 51 in Appendix B. These data were further
analyzed to obtain 0.050 second average accelerations versus time. The
maximum 0.050 second averages measured at the center-of-gravity were -6.5 g
(longitudinal) and -15.3 g (lateral).
The barrier contained and smoothly redirected the test vehicle with no
lateral movement of the barrier. There was minimal intrusion into the
occupant compartment and minimal deformation of the cpmpartment. The
vehicle remained upright and relatively stable during the collision. The
34
. . .
{ .-~-.·
Figure 22. Vehicle after test 9429C-2.
35
w
"'
jm• • . .
0.000 s 0.073 s
.. ... 9' '
• \t •
-t ·~ Test No. . . • . . . . 9429C-2 Date • • . . . . . . . 12/05/88 Test Installation .. Single Slope
Concrete Barrier Installatiot) Length .. 120 ft (36.6 m) Vehicle . . . . . . . 1980 Honda
Civic Vehicle Weight
Test Inertia .... 1,800 lb (817 kg) Vehicle Damage Classification
TAD ........ lllFQS CDC ........ 11LFEW3
Maximum Vehicle Crush. 7.0 in (17.8 em)
0.146 s 0.248 s
Impact Speed ... 60.7 mi/h (97. 7 km/h) Impact Angle ••. 19.9 deg Exit Speed. . . . 52.1 (83 .8 km/h) Exit Trajectory . 4.3 deg Vehicle Accelerations
(Max. 0.050-sec Avg) Long i t ud i n a l. . -6 . 5 g Lateral .... -15.3 g
Occupant Impact Velocity Longitudinal; . 15.7 ft/s (4.8 m/s) Lateral .... 27.7 ft/s (8.4 m/s)
Occupant Ridedown Accelerations longitudinal •. -2.3 g Lateral .... -9.2 g
Figure 23.. Summary of results for test 9429C-2.
vehicle trajectory at the loss of contact indicates minimum intrusion into adjacent traffic lanes with the change in velocity being within recommended NCHRP limits for a 15 degree impact. The longitudinal occupant/compartment impact velocity was within the limit recommended in NCHRP 230 for 15degree impacts. The lateral impact velocity exceeded the recommended NCHRP 230 limit for 15 degree impacts. However, the lateral impact velocity was less than the limiting value presented fn NCHRP 230 and is consistent with the performance of other vehicles impacting rigid barriers under similar conditions (7 ,8). It should also be noted that new impact performance standards are currently being considered to replace the current NCHRP 230 criteria {9). Finally, comparisons of the current tests with similar tests conducted on New Jersey barriers show that the vehicle redirection with the new single-slope barrier is more stable than similar impacts with the New Jersey shape barriers.
RESULTS FROM TEST 9429C-3
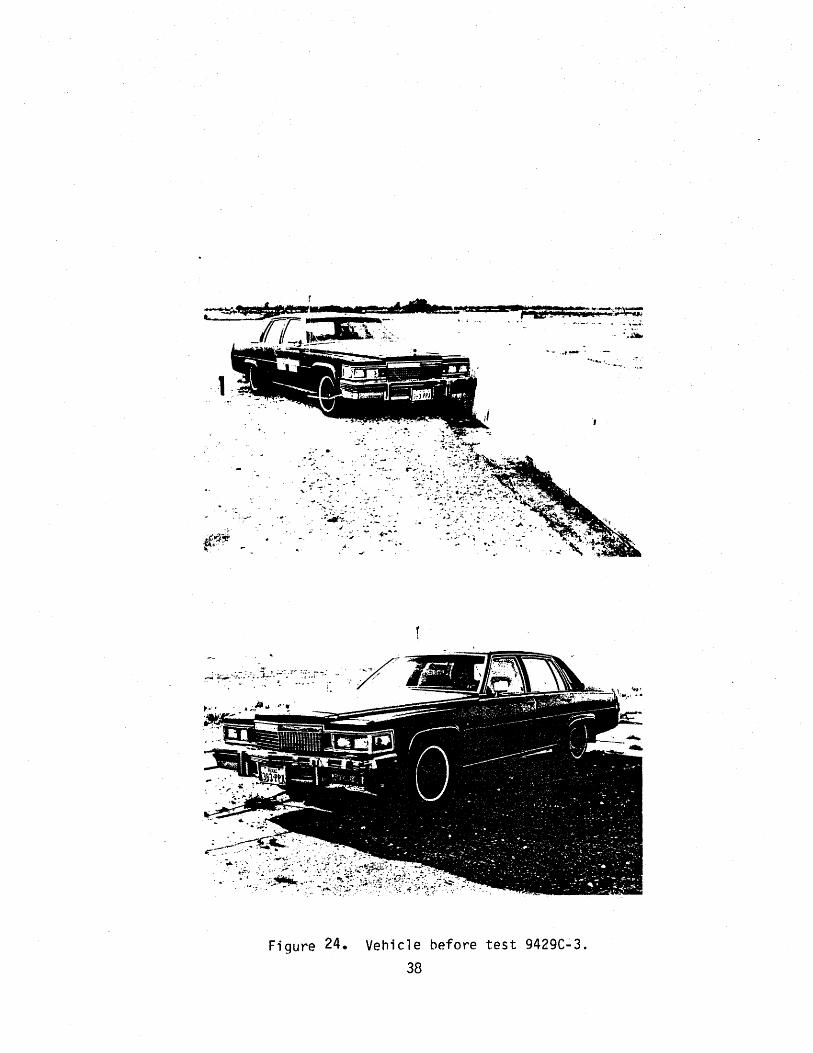
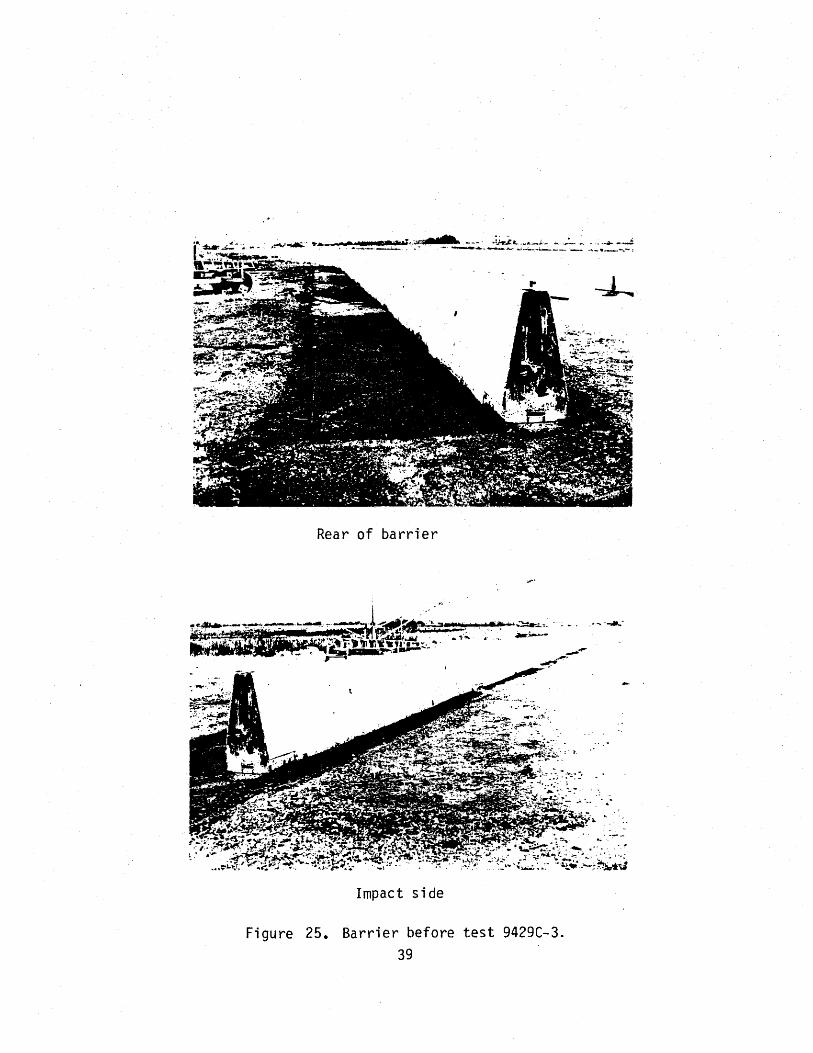
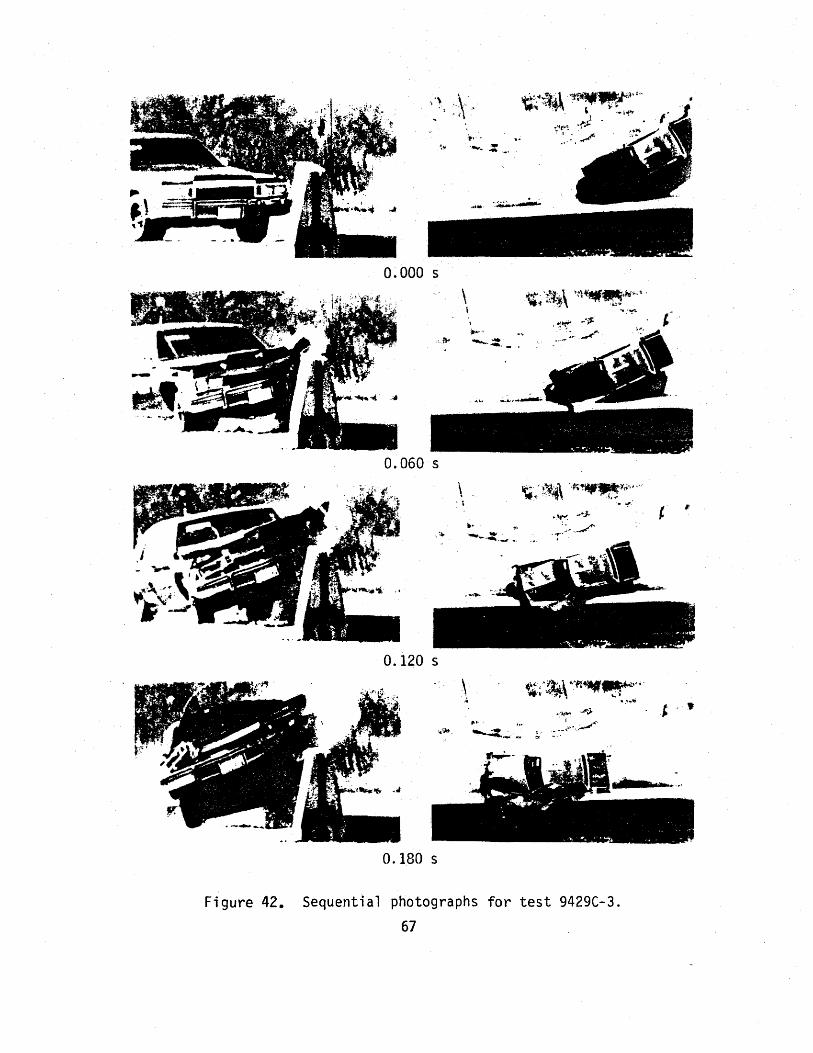
This test involved the impact of a 1979 Caddi lac Sedan deVille as shown in Figure 24. The vehicle was directed into the barrier using a reverse tow and guidance system. Figure 25 presents the single-slope barrier prior to the impact. The barrier shown in Figure 25 is the same barrier used in the previous test with paint added for cosmetic purposes. The test inertia mass of the vehicle was 4,500 lb {2,043 kg). The height to the lower edge· of the vehicle bumper·was 12.0 in (30.5 em) ·and it was 23.0 in {58.4 em) to the top of the bumper. Other dimensions and information on the test vehicle are presented in Figure 26. The vehicle was free-wheeling and unrestrained just prior to impact.
The speed of the vehicle at impact was 63.1 mi/h (101.5 km/h) and the angle of impact was 26.5 degrees. The vehicle impacted the barrier approximately 54 ft (16.5 m) from the upstream end of the barrier. The 1 eft front whee 1 made contact with the barrier at approximately 0. 024 seconds after impact and shortly thereafter the tire began to be pushed up
37
~-· . -· ~--
.... - ... : ... _
,_ ."'. ~ :.~-:- :· ·~: :: ·:
--·~
-.:.:#·. -. --.- ·::: ·-·· .·
...... ··"':·:·.. ·--~~;;_~ -~ .. ·,~.:
Figure 24.
;.
Vehicle before test 9429C-3.
38
·.~
·· .. ~·.
a rft ---. •L-~-«.t:t..._...__._._ .... ___ .. __ --~ -~ .... ....._.. .......... ......._.,__ .. ~ . ..;:;... .. ---· --·· ·-
Rear of barrier
.....
--· ~ ...-:--
Impact side
Figure 25. Barrier before test 9429C-3.
39
>.
.·~_-..... _·
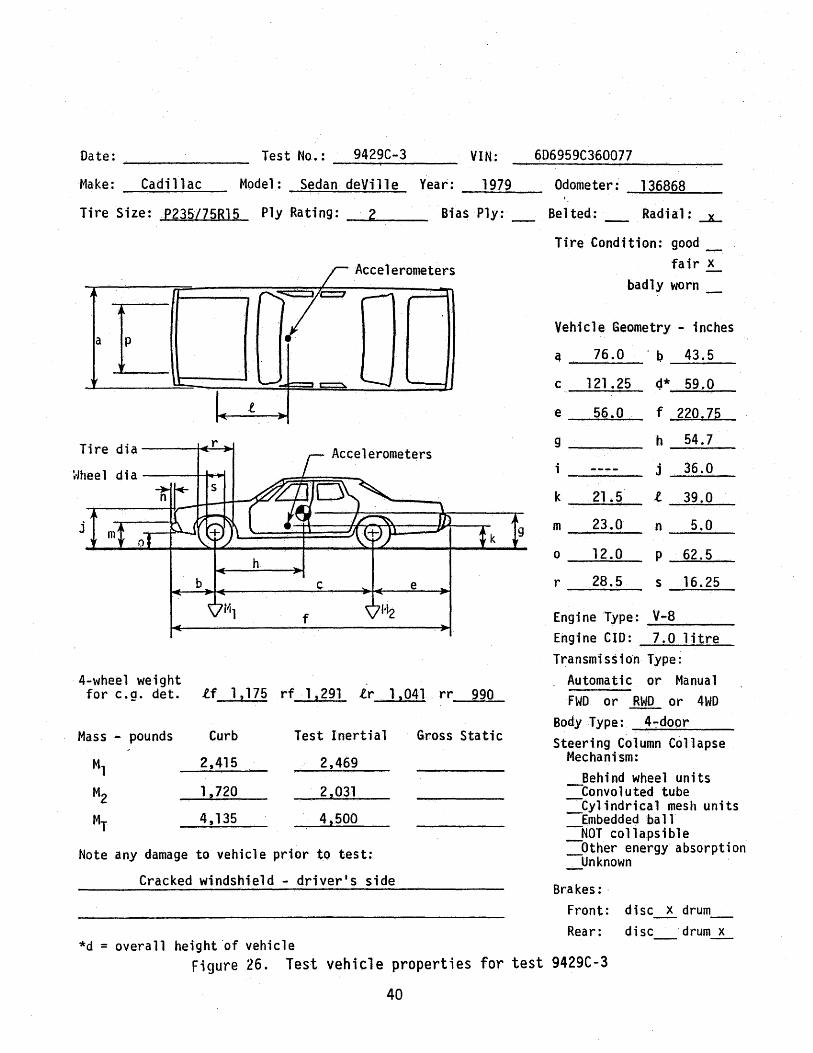
Date: Test No.: 9429C-3 6D6959C360077 ----------- ---------Make: Cadillac
-~~..;....;;...;;;,__ Odometer: 136868
Tire Size: P235/75Rl5 Ply Rating: _....._2 __ _ Bias Ply: _ Belted: Radial: _x_
Tire dia ---~~
~~hee 1 di a ------1-+e-'.-t
j
4-wheel weight
Accelerometers
f
for e.g. det. .tf 1,175 rf 1,291 .tr 1,041 rr 990
Mass - pounds Curb Test Inertial Gross Static
Ml 2,415 2,469
M2 1,720 21 031
MT 4,135 4!500
Note any damage to vehicle prior to test:
Cracked windshield - driver's side
*d = overall height ·of vehicle
Tire Condition: good _ fair~
badly worn _
Vehicle Geometry .. inches
~ 76.0 "b 43.5
c 121 . 25 c;l* 59.0
e 56.0 f 220.75
g h 54.7
j 36.0
k 21.5 .t 39.0
m 23.0 n 5.0
0 12.0 p 62.5
r 28.5 s 16.25
Engine Type: V-8 _..,.___,_ __ _ Engine CID: 7~0 litre Transmission Type: . Automatic or Manual
FWD or RWD or 4WD Body Type: 4-door Steering Column Collapse
Mechanism: Behind wheel units
-Convoluted tube -. ·Cylindrical mesh units -Embedded ba 11
NOT collapsible _Other energy absorption _Unknown
Brakes: · Front: disc~ drum_ Rear: disc_· drum x
Figure 26. Test vehicle properties for test 9429C-3
40
the face of the barrier. The vehicle began to redirect at 0.034 seconds
and at about 0.171 seconds the rear of the ve;hicle struck the barrier. The
left side of the vehicle became airborne at 0.188 seconds. By 0.198
seconds the vehicle was traveling parallel with the barrier at a speed of
53.2 mi/h {85.6 km/h). The vehicle became completely airborne at 0.295
seconds. Whi 1 e st i 11 airborne, the vehicle lost contact with the barrier
at 0.360 seconds traveling at 51.8 mi/h (83.3 km/h) and 8.5 degrees away
from the barrier. The right front tire touched ground at 0. 726 seconds
after impact. The brakes were then applied and the vehicle subsequently
came to rest 165 ft ( 5,0 m) from the point of impact. -Se.quent i a 1
photographs of this test are presented in Figure 42 in Appendix B.
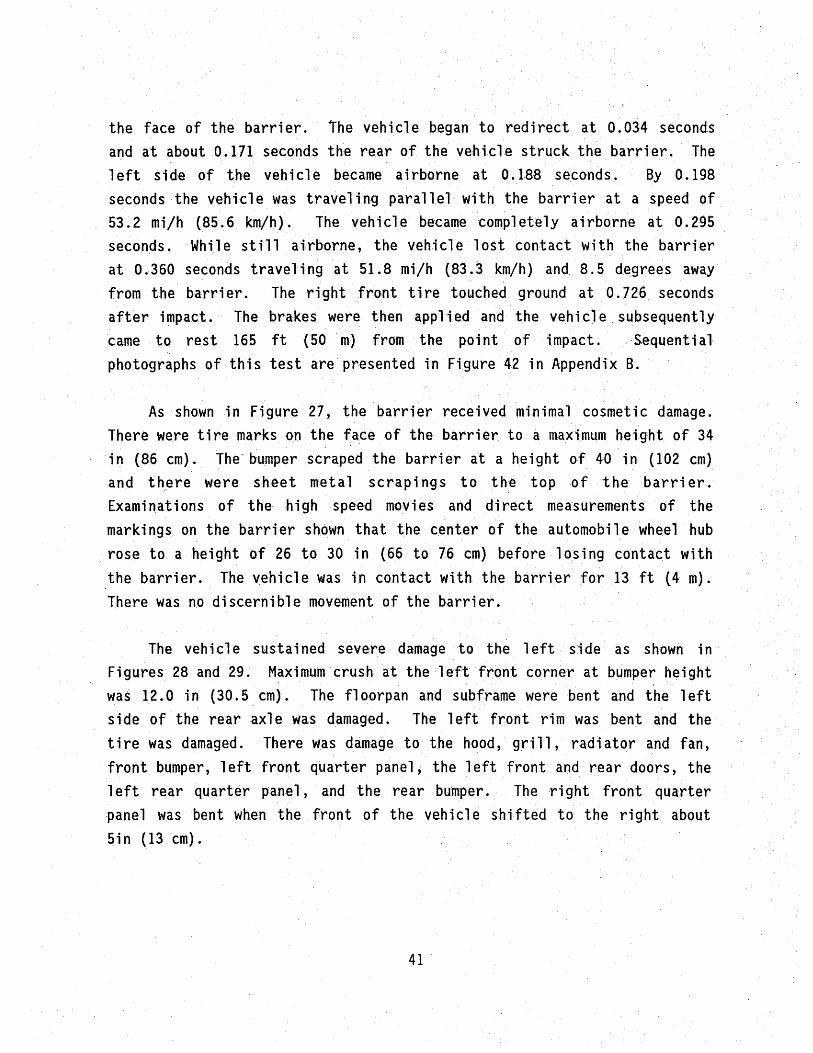
As shown in Figure 27, the barrier received minimal cosmetic damage.
There were tire marks on the face of the barrier to a maximum height of 34
in (86 em). The- bumper scraped the barrier at a height of 4-0 in (102 em)
and there were sheet met a 1 scrap i ng s to the top of the barr i e r . Examinations of the high speed movies and direct measurements of the
markings on the barrier shown that the center of the automobi 1 e wheel hub
rose to a height of 26 to 30 in (66 to 76 em) before losing contact with
the barrier. The vehicle was in contact with the barrier for 13 ft (4 m).
There was no discernible movement of the barrier.
The vehicle sustained seve:re damage to the left side as shown in·
Figures 28 and 29. Maximum crush at the left front corner at bumper height . .
was 12.0 in (30. 5. em). The floorpan and subframe were bent and the 1 eft
side of the rear axle was damaged. The 1 eft front rim was bent and the
tire was damaged. There was damage to the hood, g·ri 11, radiator and fan,
front bumper, 1 eft front quarter pane 1 , the left front and rear doors, the
1 eft rear quarter panel, and the rear bumper. The right front quarter
panel was bent when the front of the vehicle shifted to the right about
Sin (13 em).
41
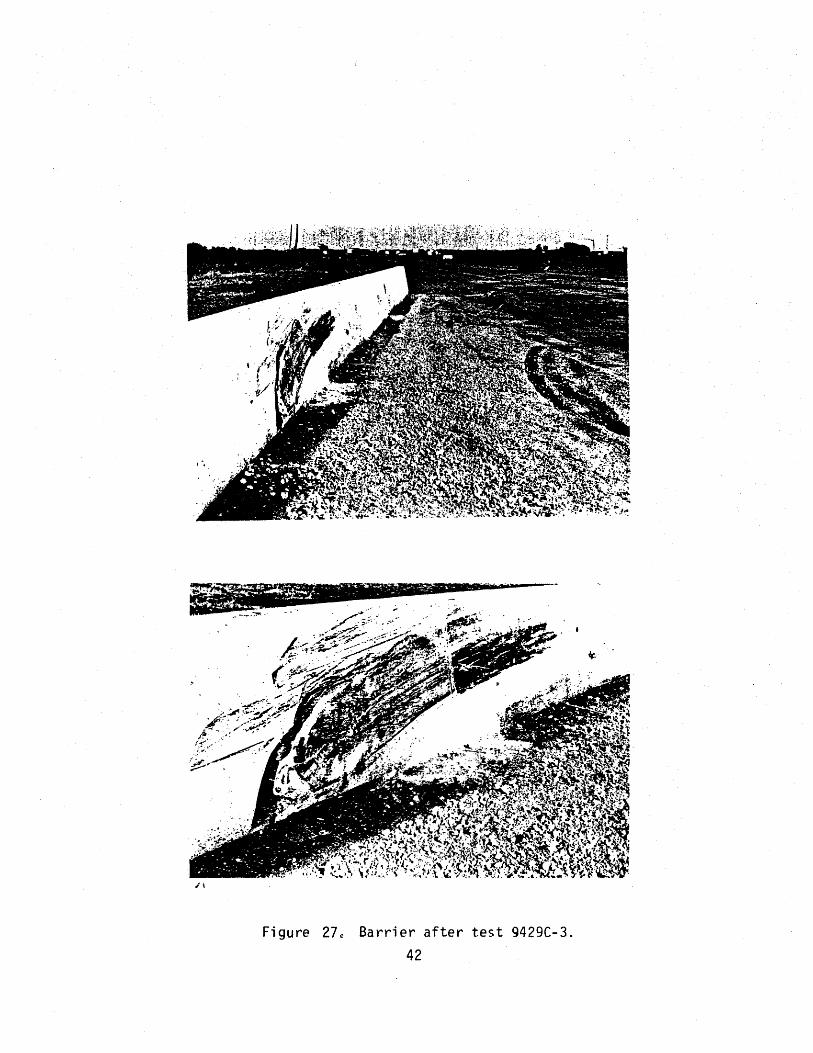
Figure 27" Barrier after test 9429C- 3.
42

Figure 28o Vehicle after test 9429C-3.
43
Left rear tire
Left front tire
Figure 29. Damage to tires on left side for test 9429C-3
44
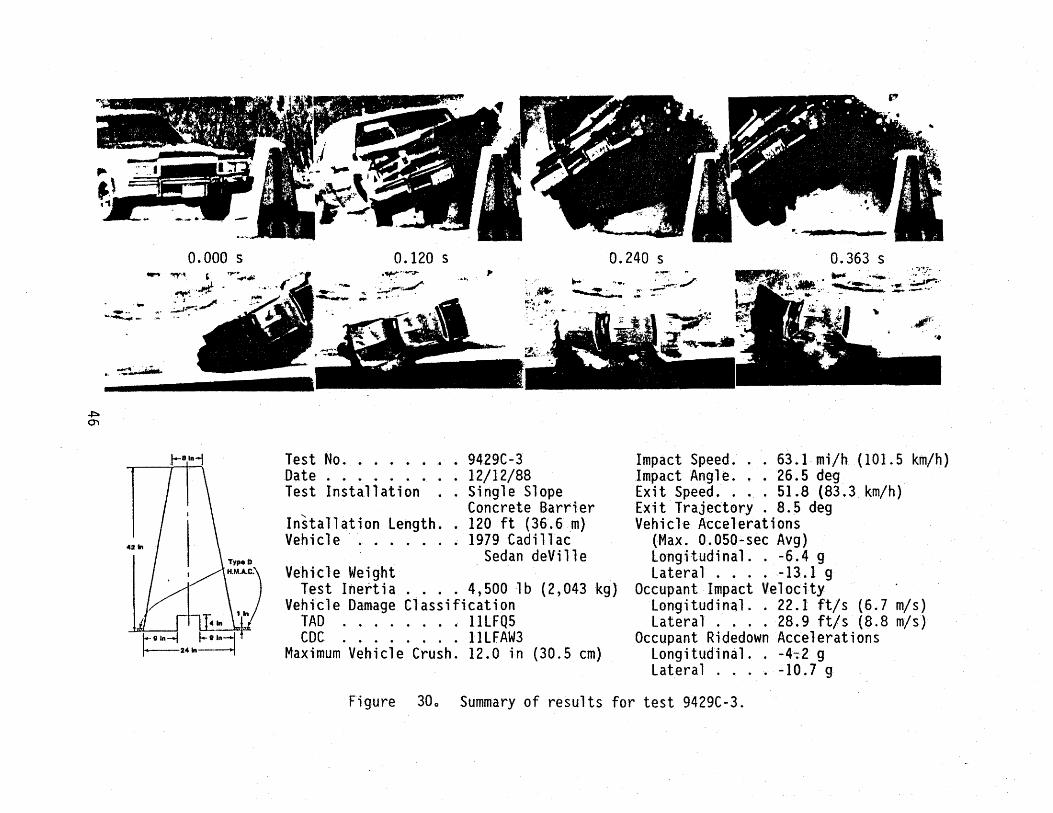
As stated previously, the impact speed was 63.1 mi/h (101.5 km/h) and
the angle of impact was 26.5 degrees. The vehicle lost contact with the
barrier traveling at 51.8 mi/h (83.3 km/h) and 8.5 degrees. NCHRP 230
describes occupant risk criteria and places limits on these for acceptable
performance for tests involving 1,800-lb (817 kg) impacting at 15 degrees
with a velocity of 60 mph (96 km/h) (1). These 1 imits do not apply to
tests involving 4,500-lb automobiles impacting at 25 degree angles but were
computed and reported for information only. The occupant impact velocity
was 22.1 ft/s (6.7 m/s) in the longitudinal direction and 28.9 ft/s
(8.8 m/s) in the lateral direction. The highest 0.010 second occupant
ridedown accelerations were -4.2 g (longitudinal) and -10.7 g (lateral).
These data and other pertinent information from the test are summarized in
Figure 30.
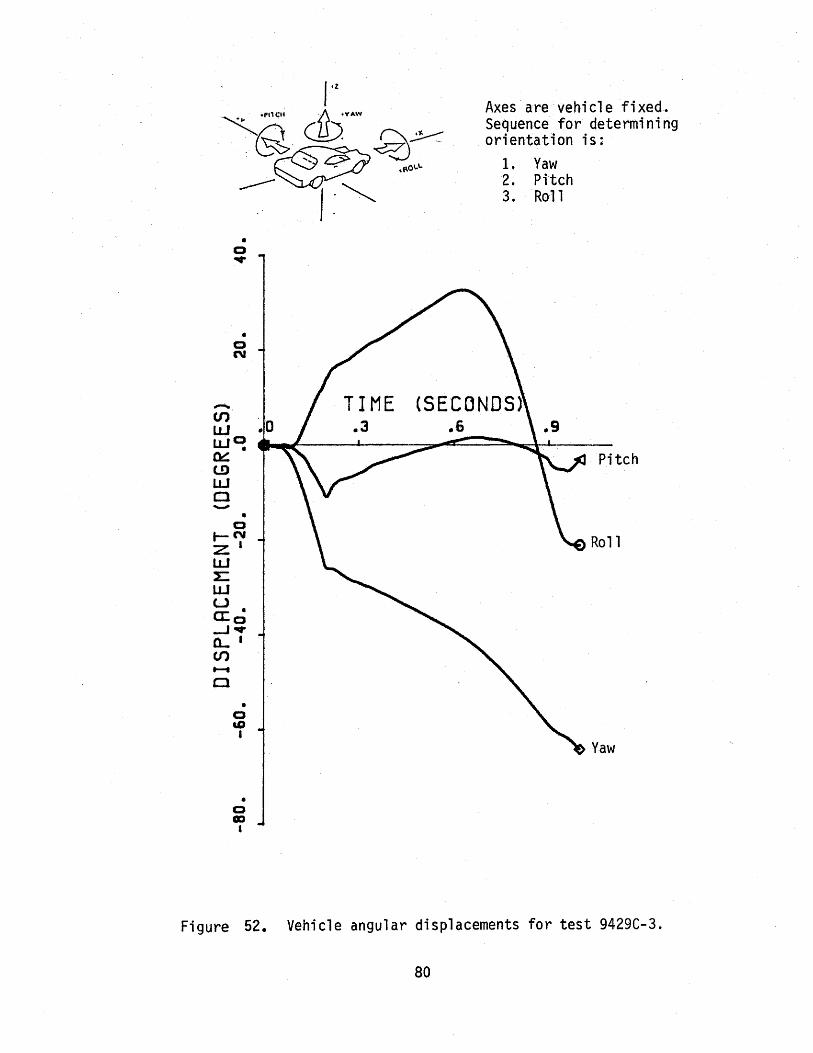
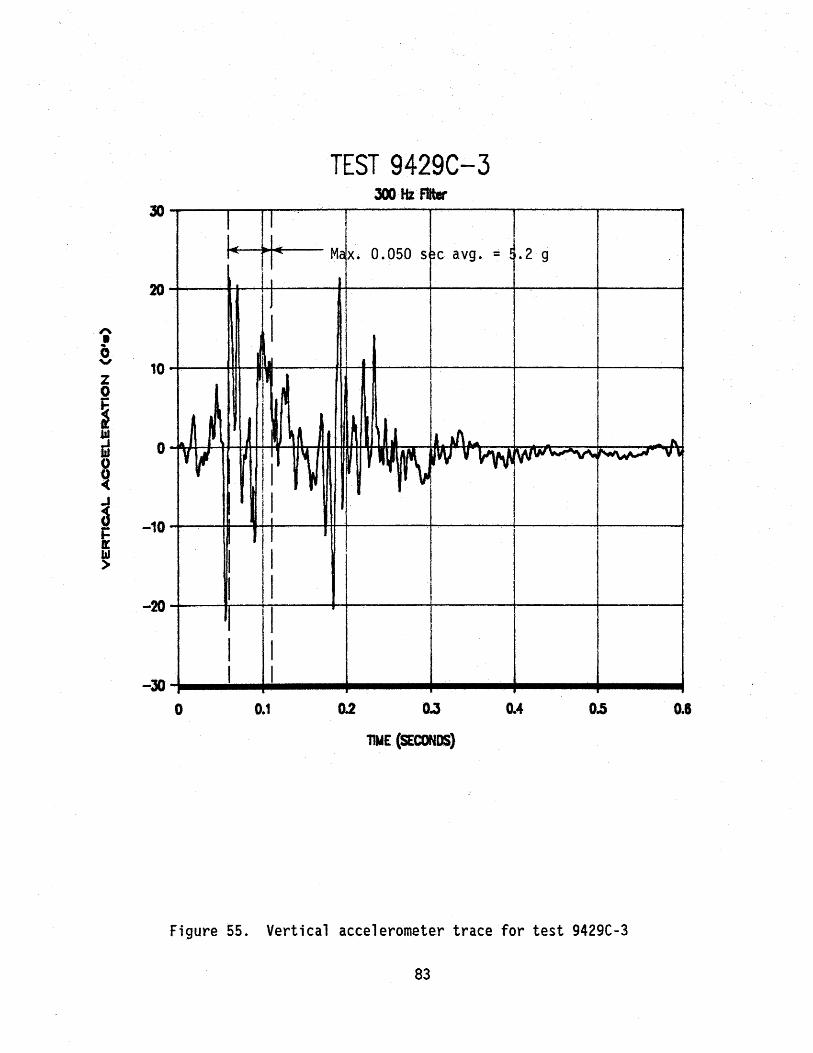
Vehicular angular displacements are displayed in Figure 52 in
Appendix B. Vehicular accelerations versus time traces filtered at 300 Hz
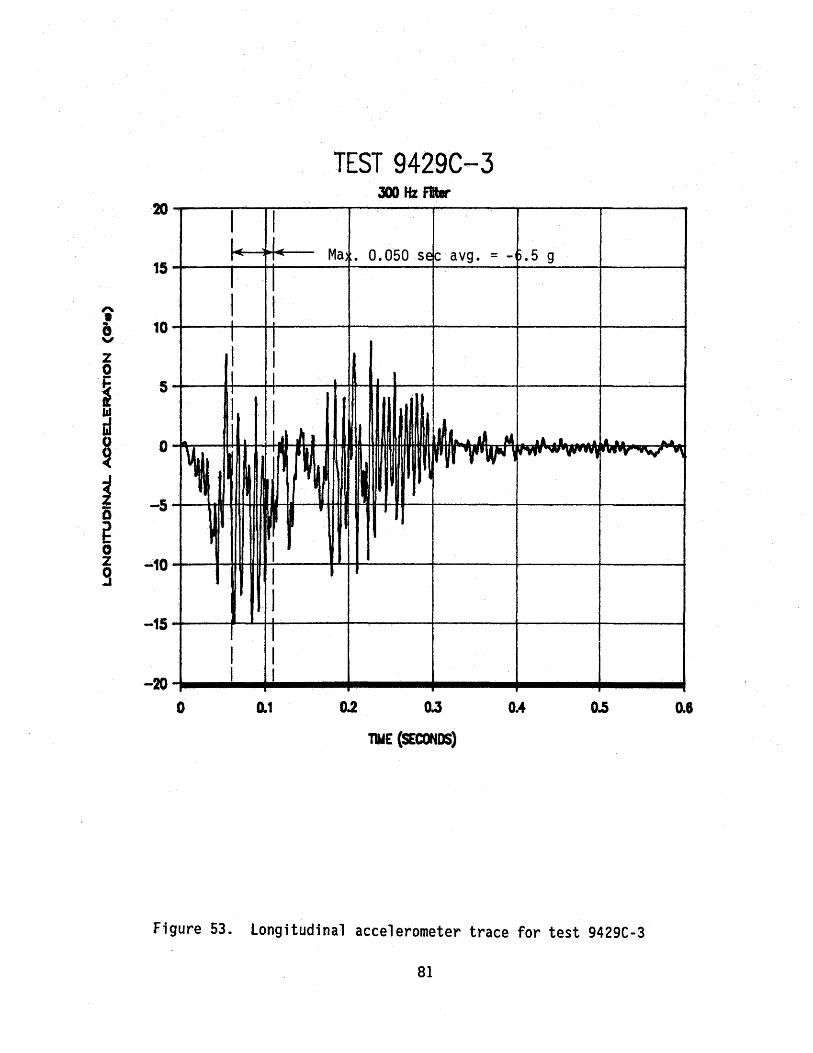
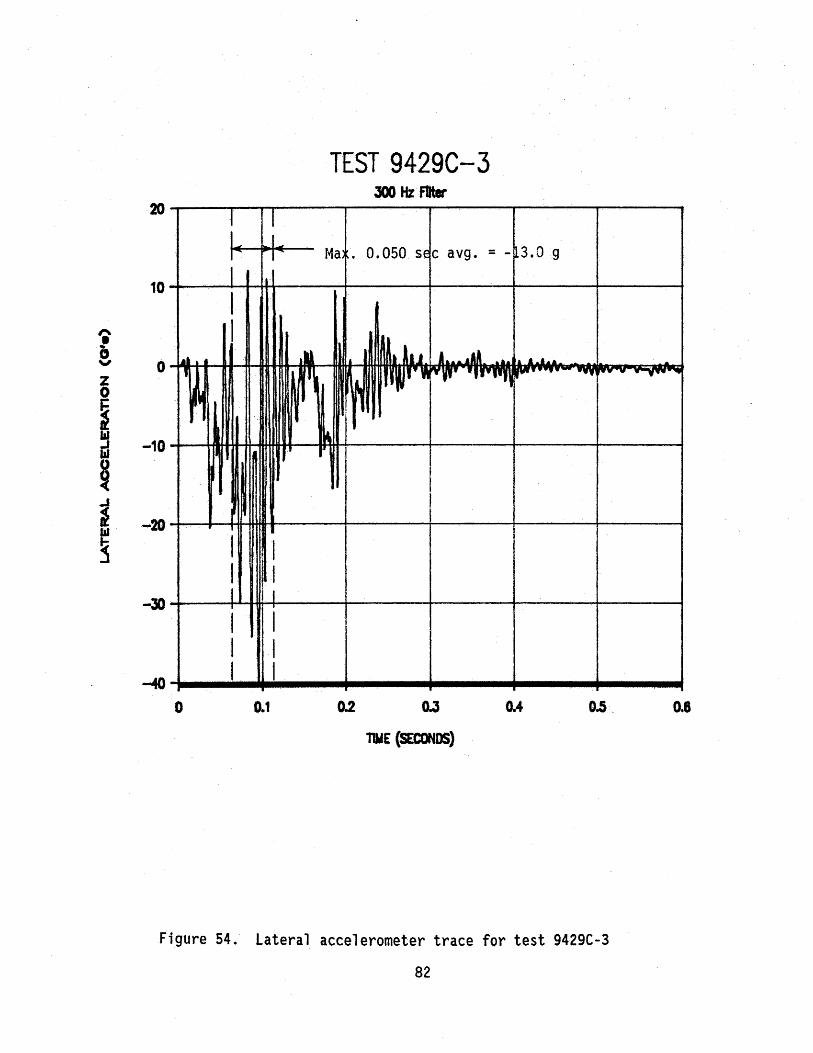
are presented in Figures 53 through 55. These data were further analyzed
to obtain 0.050 second average accelerations versus time. The maximum
0.050 second average accelerations measured near the vehicle center of
gravity were -6.4 g (longitudinal) and -13.1 g (lateral).
The barrier contained and smoothly redirected the test vehicle with no
1 atera 1 movement of the barrier. There was some deformation of the
·occupant compartment. · However, there was ·mini mal intrusion into the
occupant compartment. The vehicle remained upright and relatively stable
during the collision. The vehicle trajectory at loss of contact indicates
minimum intrusion into adjacent traffic lanes and the change in velocity
was within the recommended limit set forth in NCHRP 230 {1).
It should be noted when interpreting the data associated with this
test that both the velocity and and impact angle associated with this test
were higher than required by NCHRP 230 (1). The following formula
presented in NCHRP 230 allows the impact severity, IS, of impacts to be
45
,.J:::a 0)
0.000 s .... ..,.. .. ' .,... .. ... A. . ..,...,;;.
'.... ·.:":'· .·'. . ... · . . £ . .::.:;. - .. ~../' - - .
-~ ........
0.120 s .·~··-.,..
.! ~·~;·.-/
,. ;,, .-.:
0.240 s 0.363 s ..... ":........ ~
~- .:-~~:/'
"' ..,'(:· , ..
Impact Speed. o • 63.1 rni/h ( 101.5 km/h) Impact Angle ... 26.5 deg Exit Speed ... o 51.8 (83.3 km/h} Exit Traje·ctory o 8 o 5 deg Vehicl~ Accelerations
(Max. 0.050-sec Avg) Longitudinal .. -6.4 g Lateral .... -13.1 g
Occupant Impact Velocity Long i tud i na 1 . . 2 2 0 1 ft/ s ( 6 o 7 m/ s } Lateral o o •• 28.9 ft/s (8.8 m/s)
Occupant Ridedown Accelerations Longitudinal .. -4~Z g Lateral .... -10.7 g
Figure 30o Summary of results for test 9429C-3.
quantified in terms of impact velocity, V; vehicle mass, m; and impact angle, a.
IS = 1/2 m y2 (sin a)2 (1)
The impact severity calculated for the actual test conditions is
approximately 25 percent greater than the intended impact severity associated with a 4,500-lb (2,043 kg)/60 mph (96 km/h)/25 degree impact. This deviation suggests that the impact force between the barrier and the vehicle would be approximately 25 percent greater than would have been the case at the intended conditions. Thi~ additional impact force resulted in a more severe impact than required under NCHRP 230. Despite the increased severity of this .impact the vehicle was smoothly redirected and remained upright throughout the test.
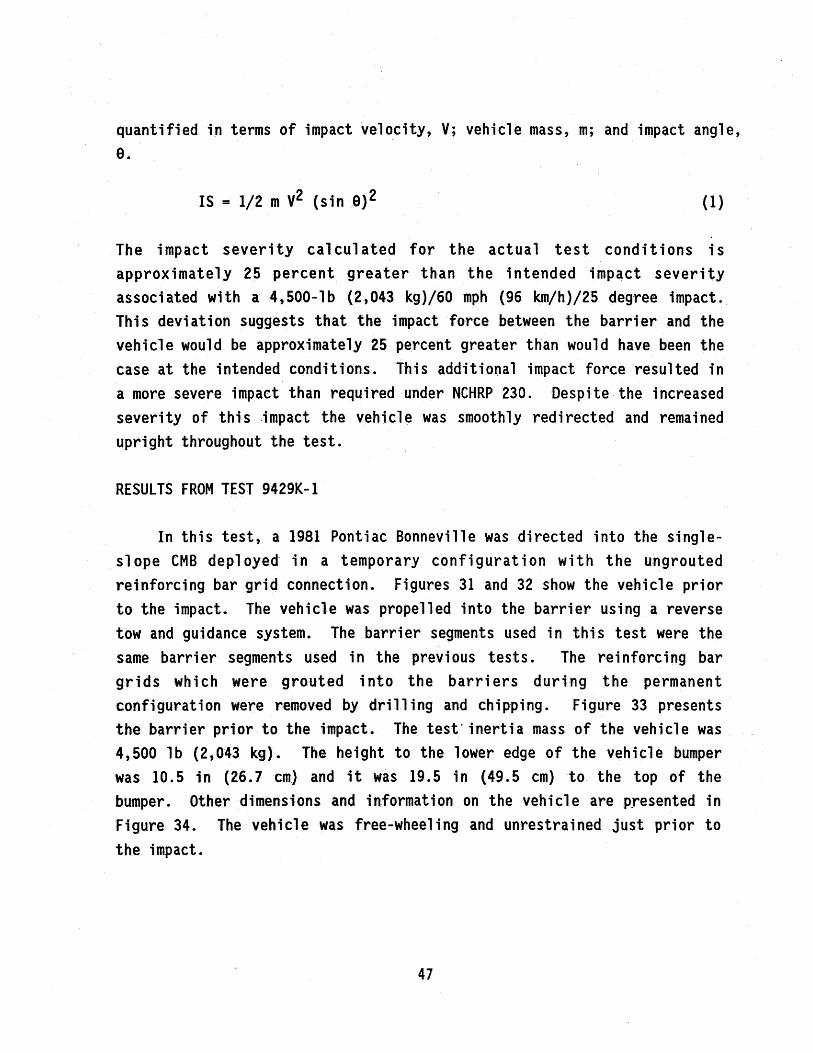
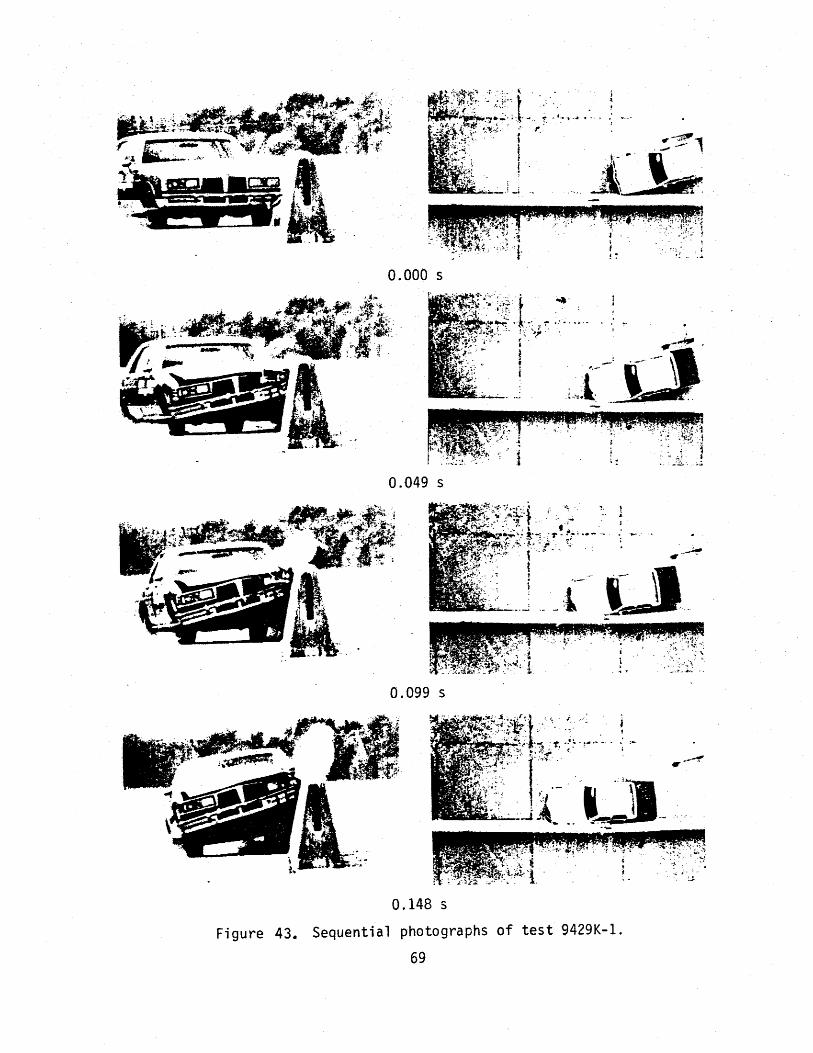
RESULTS FROM TEST 9429K-1
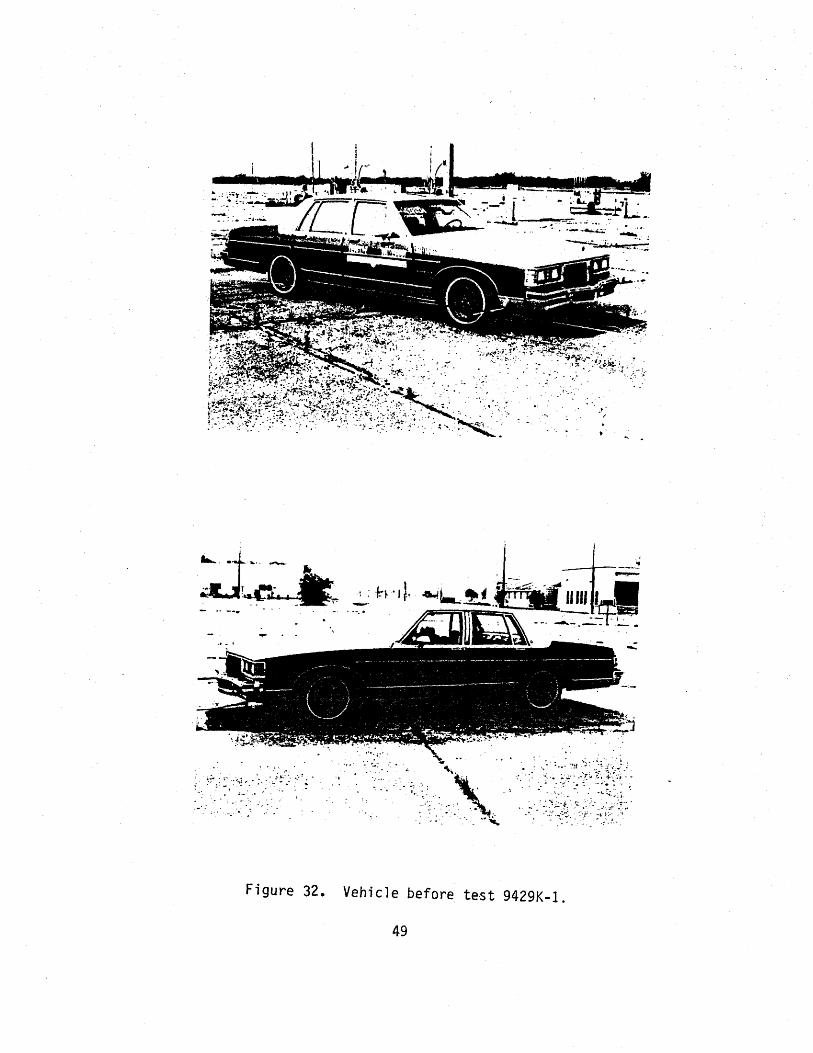
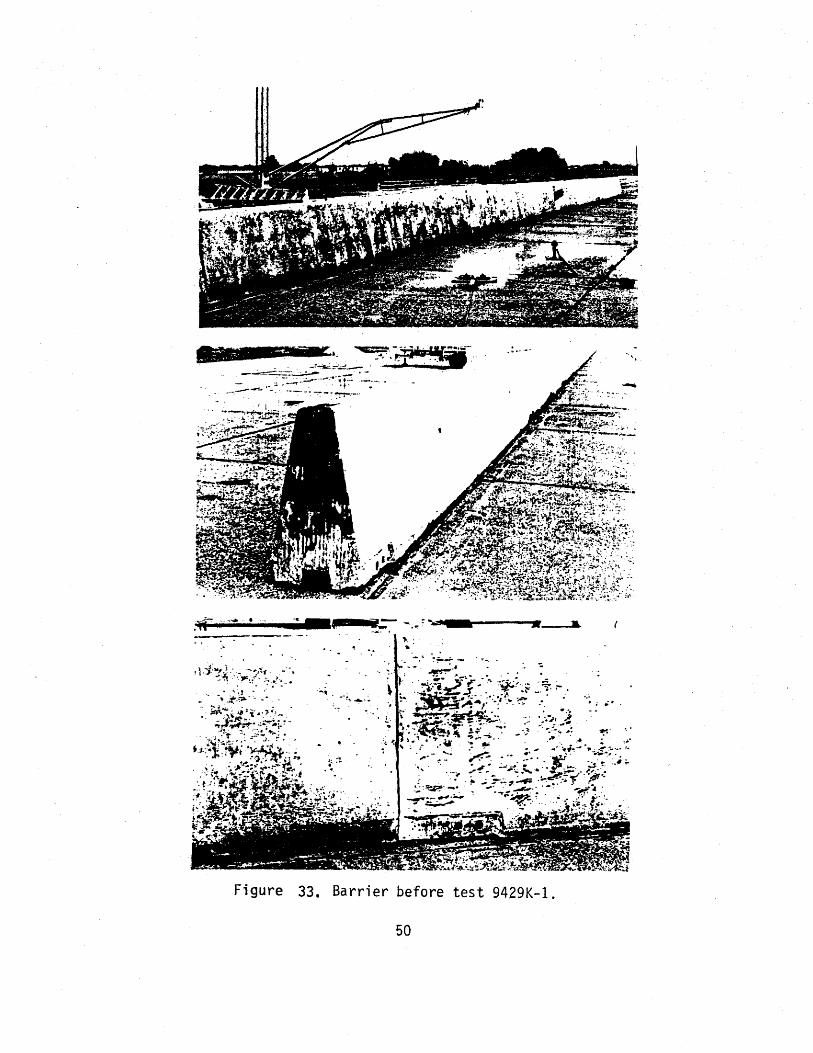
In this test, a 1981 Pontiac Bonneville was directed into the singleslope CMB deployed in a temporary configuration with the ungrouted reinforcing bar grid connection. Figures 31 and 32 show the vehicle prior to the impact. The vehicle was propelled into the barrier using a reverse tow and guidance system. The barrier segments used in thts test were the same barrier segments used in the previous tests. The reinforcing bar grids which were grouted into the barriers during the permanent configuration were removed by drilling and chipping. Figure 33 presents the barrier prior to the impact. The test· inertia mass of the vehicle was 4,500 lb (2,043 kg). The height to the lower edge of the vehicle bumper was 10.5 in (26.7 em) and it was 19.5 in (49.5 em) to the top of the bumper. Other dimensions and information on the vehicle are presented in Figure 34. The vehicle was free-wheeling and unrestrained just prior to the impact.
47
--, ... -... _.,.~ .. _ .. _!plfl"······ - ~- • ~__._ -· - ~~ .4:'o-
• vt- .. ~~:t:~·~v-~ ... .., .. !>u~-~~ ---- ~ --
Figure 31. Vehicle/barrier geometries for test 9429K-l.
48
.... -~~ -:-. . . . 'x· . ~ ~ . -... . . . .. ,;: . : .
. . ~.,_ ~ .. . . . ··: : . . .
. ~: ... ·.' ·'~
Figure 32. Vehicle before test 9429K-l.
49
az ..... - _ ..
---:--:------· ·- .. .,._: ..
! '-~i~~ ·:.·.~~::~':'\·/:-~ ~· - ·,:_;.~-~- .· "
·Jt.-.,~'jf!j.F:~ •J-::_t.-~r
Figure 33. Barrier before test 9429K-1.
50
'•
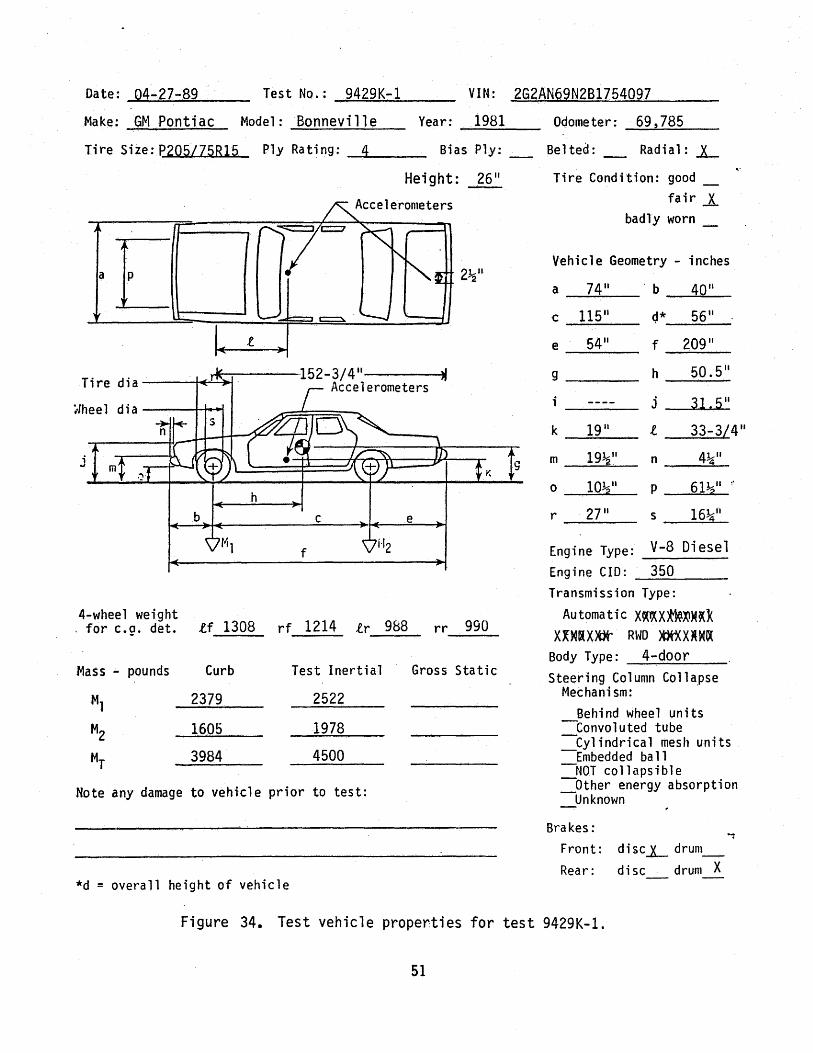
Date: 04-27-89 Test No.: 9429K-1 YIN! 2G2AN69N2B1754097
Make: G~t Pontiac Model: Bonneville Year: 1981 Odometer: 69,785
Tire Siie: P205/75Rl5 Ply Rating: ~4:.....--- Bias Ply: _ Belted: Radial: ..x_
Tire dia-------~~
ilhee 1 d i a -----+-~
j
h
f
Height: 26"
c e
4-wheel weight , for e.g. det. lf 1308 rf 1214 tr 988 rr 990
Mass .;.. pounds Curb Test Inertial Gross Static
Ml 2379 2522
Mz 1605 1978
MT 3984 4500
Note any damage to vehicle prior to test:
*d = overall height of vehicle
g
Tire Condition: good_ fair .X
badly worn -·
Vehicle Geometry - inches
a 74 11 "b 40"
c 115" ~* 56"
e 54 11 f 209"
g h 50.5"
i j 31.5" k 19" .e. 33-3L4 11
m 19~" n 4~"
0 10!a11 p 61~11
r 27" s 16~"
Engine Type: V-8 Diesel Engine CID: 350 Transmission Type:
Automatic X«~X~~M~X XXWDlXitir RWD )OO{X)tKOC
Body Type: 4-door Steering Column Collapse
Mechanism! · Behind wheel units
--Convoluted tube -Cylindrical mesh units -Embedded ba 11 -NOT collapsible -Other energy absorption -Unknown
Brakes: Front: disc_x_ drum_. Rear: disc drum X
Figure 34. Test vehicle properties for test 9429K-1.
51
The speed of the vehicle at impact was 62.0 mi/h {99.8 km/h) and the
angle of impact was 15.1 degrees. The vehicle impacted the barrier
approximately 85 ft (26.0 m) from the upstream end of the barrier. Upon
impact, the left front of the vehicle began to deform and shortly
thereafter, the left front of the vehicle began to climb up the face of the
barrier. At app¥'oximately 0.042 seconds after the impact, the vehicle
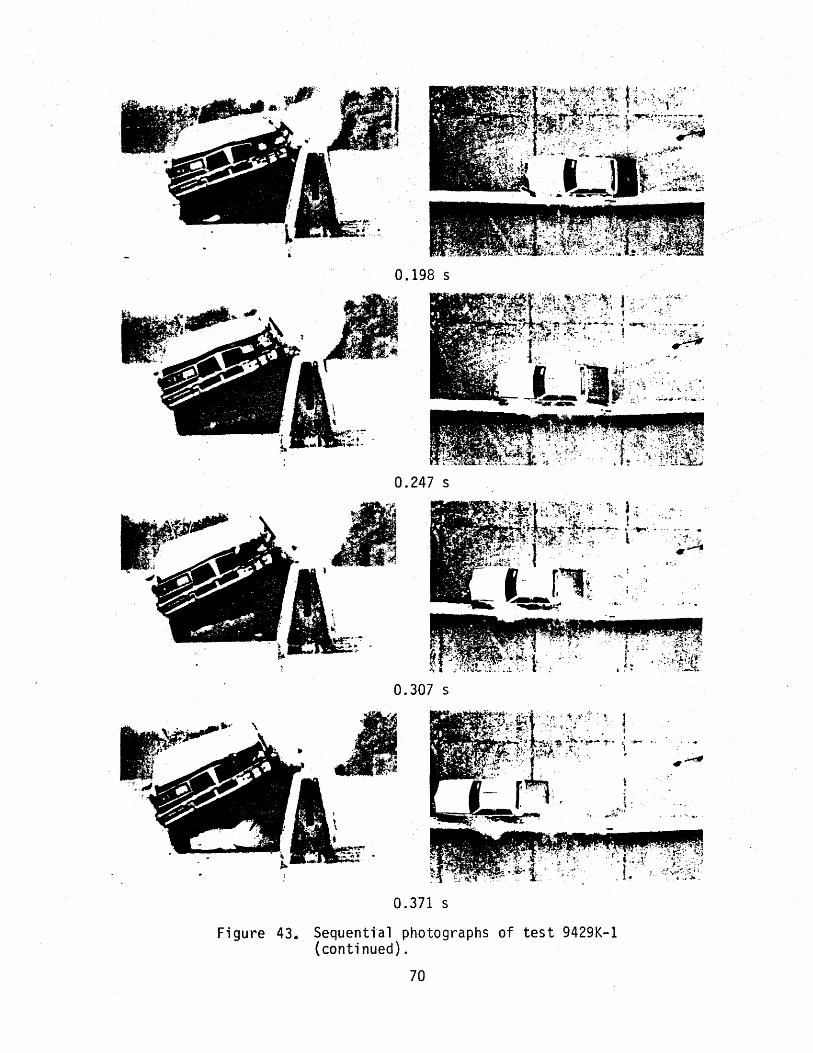
began to redirect and by 0.173 seconds, the rear of the vehicle had.
contacted the barrier. The vehicle traveled parallel to the barrier at
.57.3 mi/h (92.2 km/h{). Shortly thereafter, the vehicle lost contact with
the barrier at approximately 0.307 seconds after impact. The exit speed
was 57.0 mi/h (91. 7 km/h) with an exit angle of 3. 5 degrees. As the
vehicle exited the barrier, the brakes were applied. The vehicle then
yawed counter-clockwise and came to rest approximately 240.0 ft {73.2 m)
from the point of impact. Sequent i a 1 photographs of the impact are shown
in Figure 43 in Appendix a.
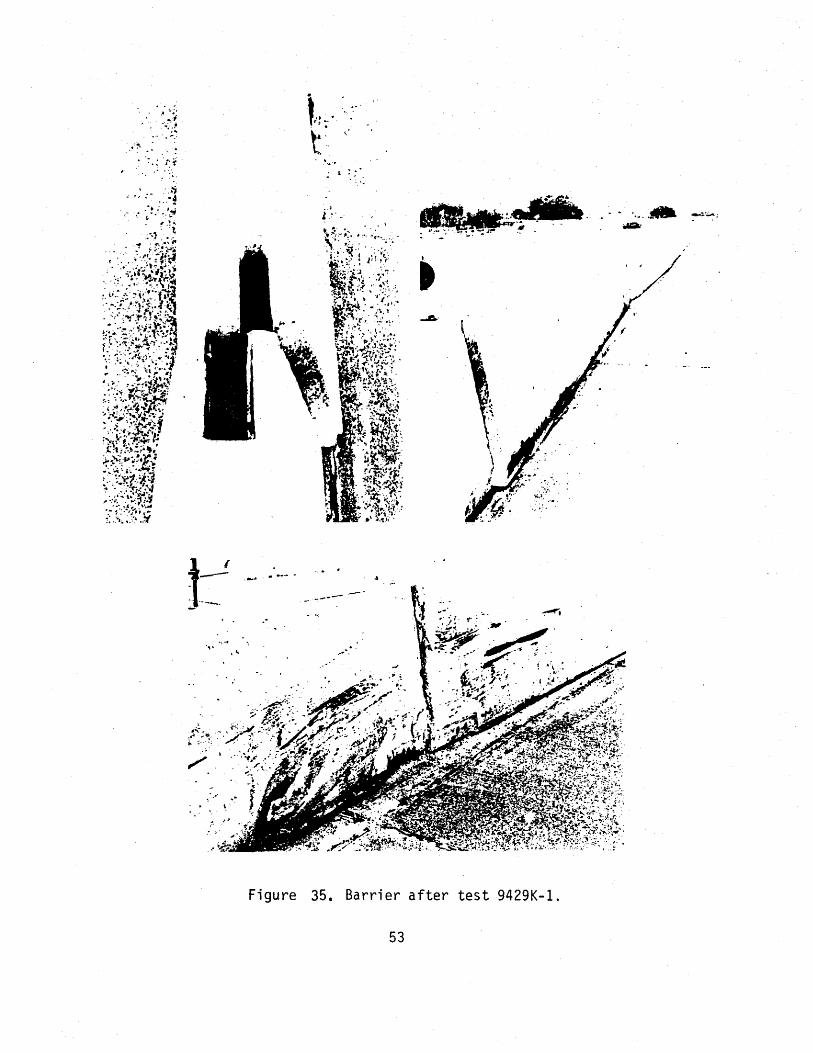
As shown in Figure 35, the barrier received only minimal cosmetic
damage. The barrier was displaced laterally a maximum distance of 6.0 in
{15.2 em) at the joint closest to the impact point. The maximum height of
vehicle-rail interaction was 32 in {81.3 em). The vehicle was in contact
with the barrier for a total length of 16.0 ft {2.4 m). Further~ it should
be noted that the barrier segments at the impact joint experienced relative
lateral movement as shown in Figure 35. This relative lateral movement
caused the impacting vehicle to be subjected to an abrupt. change in the
barrier face. Prior to the conducting this test, there was a question as
to whether or not this relative lateral movement of the barrier ends.would
be sufficient to cause the vehicle to snag. However, as evidenced by the
test results, the vehicle was successfully redirected.
The vehicle received minor damage as shown in Figure 36. The maximum
crush was 8.0 in (20.3 em) at the left front corner of the vehicle. The
left control arm, wheel, fender, and hood were severely b~nt. In addition,
52
.... ~
. . ....... -
Figure
'·· . f, ..... ' ... ~·· ~··
. ' : ..
35. Barrier after test 9429K-1.
53
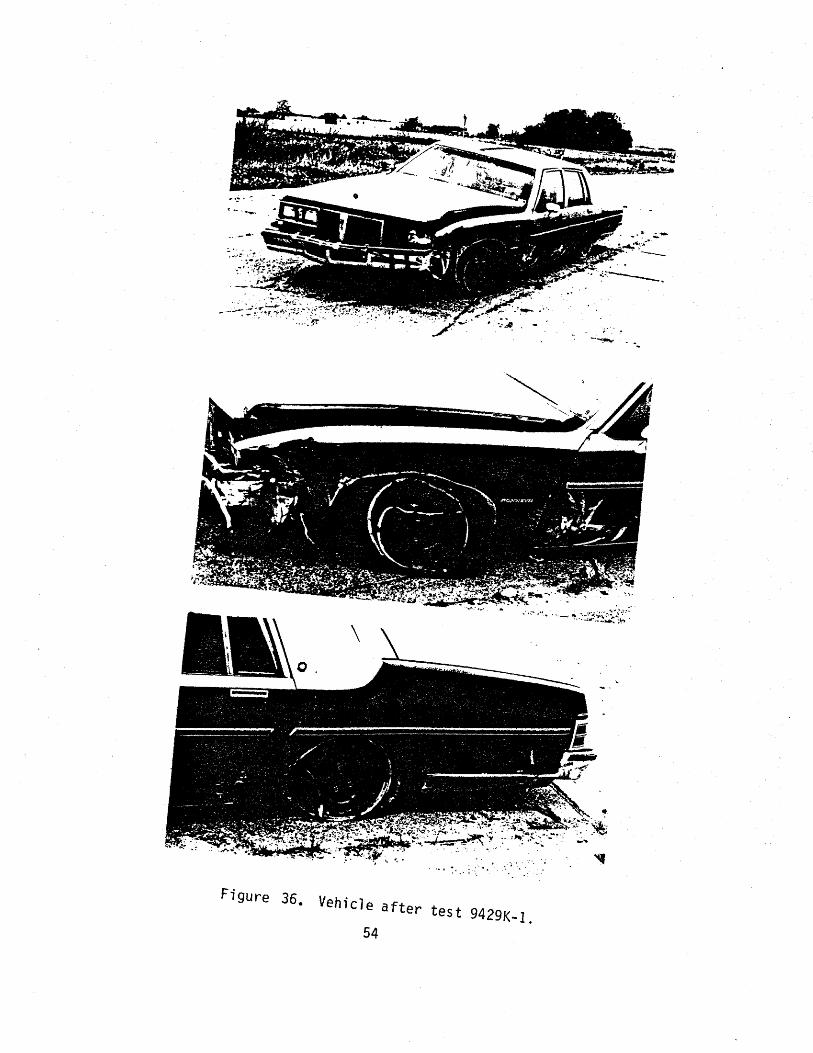
Figure 36. Vehicle after test 9429K-1.
54
•.
the left wheel was pushed rearward 1.0 in (2.5 em} and the rear axle was
bent. The entire left side of the vehicle was dented and scraped.
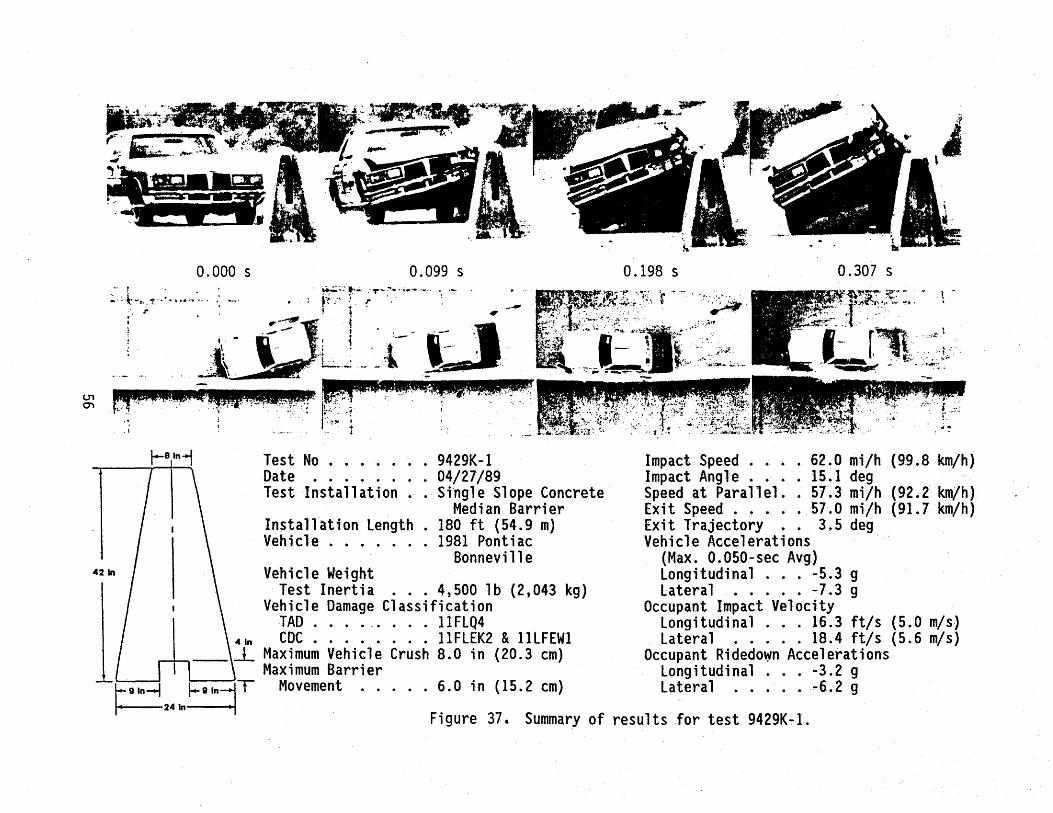
As stated previously, the impact speed was 62.0 mi/h (99.8 km/h} and
the impact angle was 15.1 degrees. The vehicle lost contact with the
barrier with a speed of 57.0 mi/h (91.7 km/h} with an exit angle of 3.5
degrees. NCHRP 230 describes occupant risk evaluation criteria and places
1 i mi ts on these for acceptable performance for tests conducted with 1, 800
lb (817 kg) vehicles (1). These limits do not apply to tests conducted
with 4,500 lb (2.043 kg} vehicles but were computed and reported for
information only. The occupant impact velocity was 16.3 ft/s (5.0 m/s) in
the longitudinal direction and 18.4 ft/s (5.6 m/s) in the lateral direction. The highest 0.010 second occupant ridedown accelerations were
-3.2 g (longitudinal) and -6.2 g (lateral). These data and other pertinent
information from the test are summarized in Figure 37.
Vehicle angular displacements are displayed in Figure 56 of Appendix
B. Vehicular acce 1 erat ions versus time traces fi 1 tered at 300 Hz are
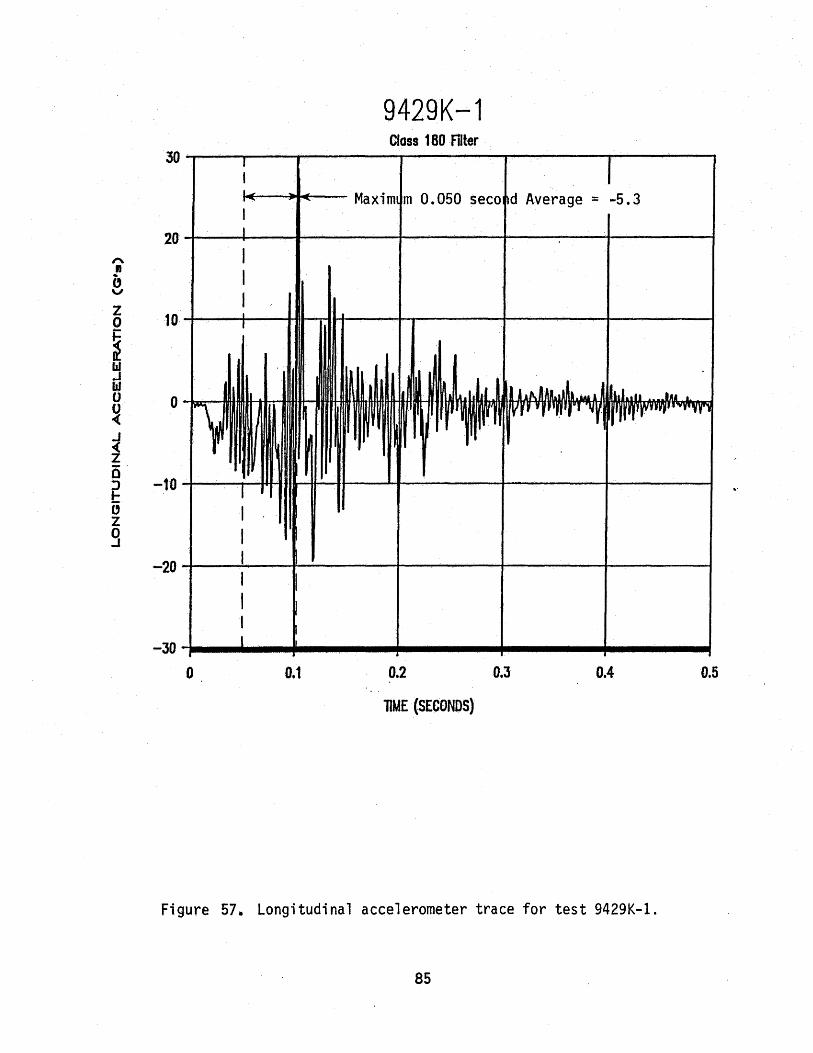
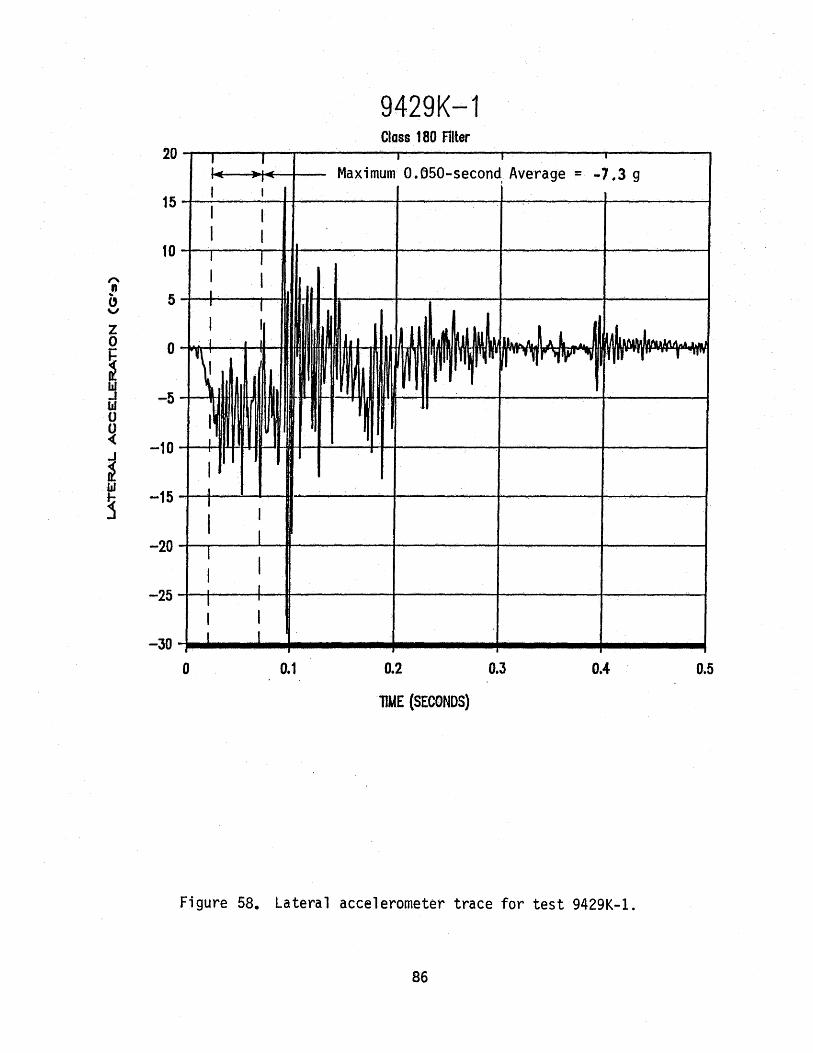
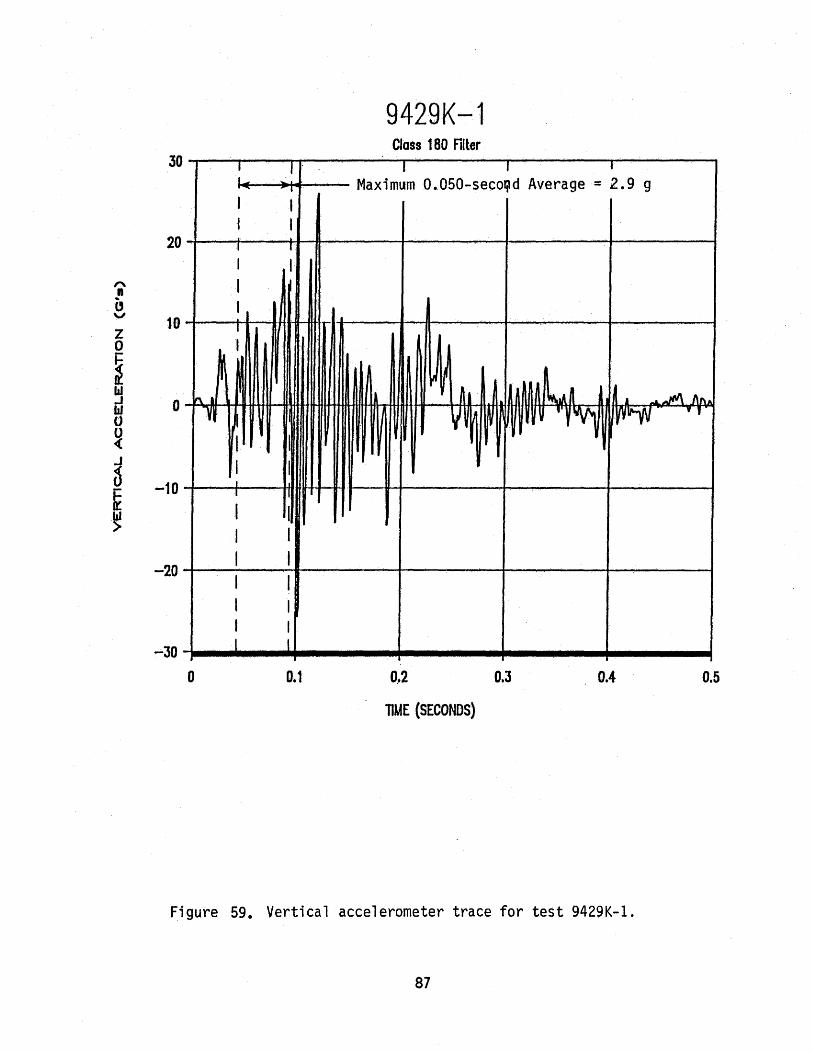
presented in Figures 57 through 59 in Appendix C. These data were further
analyzed to obtain the 0.050 second average accelerations. The maximum
0.050 second average accelerations measured near the vehicle center-of
gravity·were -5.3 g (longitudinal) and -7.3 g (lateral).
· These test results show that the barrier · contained and smoothly
redirected the test vehicle with little lateral movement of the barrier.
There was minimal damage to the barrier and the vehicle. There was no
debris or detached elements. There was minimal deformation and intrusion
into the occupant compartment. The vehicle remained upright and stable
duringthe initial test period and after leaving the barrier. The vehicle
trajectory at loss of contact indicates minimal intrusion into the adjacent
traffic lanes.
55
0.000 s 0.099 s :·:: 1--..... 't .. : ..... ·~ ·.. . -·· • : · ~f~-.. r·~·.; T'- :_.. • ···- ·--· ·: ·- ·
:· r . ~~~ . ' l , , ~ --
U1
"'
421n
~ . - - ..,.,. _..,. .~ t • . - ~ -- . ~ .•. ·,I 1 ··- ' . A ' _. .>Lj - -\ u
..
.I
m .$t.QQa:;:;itQJ£11Mt.Cl
Test No •...... 9429K-1 Date . . . . . . . . 04/27/89 Test Installation . o Single Slope Concrete
Median Barrier Install at ion Length . 180 ft (54. 9 m) Vehicle ... o ••• 1981 Pontiac
Bonneville Vehicle Weight
Test Inertia o • o 4,500 lb (2,043 kg) Vehicle Damage Classification
TAD ......... 11FLQ4 41n CDC ........ 11FLEK2 & llLFEWI
__ ,_L Maximum Vehicle Crush 8.0 in (20.3 em) Maximum Barrier
Movement ..... 6.0 in (15.2 em)
~~
0.198 s 0.307 s ,¥ l -
. t
..~
Impact Speed ..•. 62.0 mi/h (99.8 km/h) Impact Angle ..•. IS.l deg Speed at Parallel .. 57.3 mi/h (92.2 km/h) Exit Speed . • . . . 57.0 mi/h (91. 7 km/h) Exi ~ Trajectory . . 3. 5 deg Vehicle Accelerations
(Max. 0.050-sec Avg) Longitudinal ... -5.3 g Lateral . • . . • -7.3 g
Occupant Impact Velocity Longi tudi na 1 . . . 16.3 ft/s ( 5. 0 m/s) Lateral ..... 18.4 ft/s (5.6 m/s)
Occupant Ridedo~n Accelerations longitudinal ... -3.2 g lateral ....• -6.2 g
Figure 37. Summary of results for test 9429K-l.
CONCLUSIONS
A new single-slope CMB has been developed. The new single-slope CMB can be used as a either a temporary or permanent barrier. The new barrier was designed to redirect both heavy and light automobiles with approximately the same response characteristics as the New Jersey CMB. The new single-slope CMB was designed to redirect a 4,500-lb {2043 kg) automobile trave 1 i ng at 60 mph { 96.6 km/h) with an impact angle of 25 degrees with only cosmetic damage when deployed in the permanent configuration. Further, it was designed to redirect a 4,500-lb {2043 kg) automobile traveling at 60 mph (96.6 km/h) with an impact angle of 15 degrees when deployed in either of two different temporary configurations. It is probable that the new single-slope barrier will be able to successfully redirect more severe impacts involving heavier vehicles with higher centers of gravity.
The primary advantage of the new single-slope CMB is that it will not be necessary to reset the barrier each time that the surrounding pavement is overlaid as required with the New Jersey CMB. As stated in the previous section, the center of the wheel hub of the vehicle in the third test rose to a maximu~ height of no more than 30 in {76 em) before losing contact with the barrier. Experience suggests that the barrier would continue to redirect the vehicle as 1 ong as the contact height of the center of the wheel hub does not exceed the height of the barrier. Therefore, it is anticipated that the overall height of the barrier can be reduced to at least 30 in (76 em) by adjacent pavement overlays without significantly affecting the performance of the barrier for the test conditions presented in this report. It is possible that the barrier would continue to perform satisfactorily at lower heights; however, it is not recommended that it be used at heights below 30 in {76 em) unless further tests are conducted.
Another advantage of the new single-slope barrier is that the redirection of the 1,800-lb {817 kg) vehicle appeared to be much more
57
stable than analogous redirections observed with the New Jersey CMB (8). While further study is required to make a definitive statement on this matter it is believed that the new single-slope CMB will result in fewer roll-over crashes than occur with the New Jersey CMB. This is particularly true with nontracking, high angle, low velocity impacts of small vehicles.
A total of four full-scale tests were conducted on the new singles 1 ope CMB. The first test i nvo 1 ved a 4, 500-1 b ( 2043 kg) automobi 1 e impacting the new barrier in a temporary configuration. The second and third tests involved an 1,800-lb (817 kg) automobile and a 4,500-lb (2043 kg) automobile impacting the single-slope CMB in a permanent configuration. The fourth test involved a 4,500 lb (2043 kg) automobile impacting the single-slope CMB in an alternate temporary configuration. In all cases, the vehicles were smoothly redirected with no snagging. Results from these tests were within acceptable limits for roll, pitch, yaw, acceleration as described in NCHRP 230 (1). As such the new single-slope CMB is recommended for immediate use.
58
APPENDIX A.
FABRICATION DETAILS FOR
SINGLE~SLOPE CMB
59
0'\ 0
Y211MS
H28M
3tl- IY' I..O.A.
NOtE: Af'PRO)(. 1" SPACE: 8£1'«04 AO.lOIHIIG &MUll SEC110NS
........... ________ ....... _15·- 0"- --------1
I"
PLAN VJEW
, 1 tr' Slttl. PI'[ lOCATED AT QUNUER I'ON~. TO AID IN
UF11NC M BARRIER (7.5 ft. FROM EACH END)
NOt£: OONCRE1t Oft ·$0T1QW· HALf ~ PLAN 1o1tw IS ftENO't'£1) IN ONIEit 10 SHOW DETNLS.
(~ ABOUT CENltR LilES)
vt 8MS SPACf:D AT ,---- ;z• c-c MAXIMUM
. . . I I I
-·----·- ---r-1 I I I I I
-"'----,-----,. 1• I I I I I -... --- ----... I I I I I I _._ ____ .,. __ _ I I I I I I _._ ____ ._ ____ ... . . . DRAINAGE ~T
~
REBAR GRID
ELEVATION TYPICAL PROFILE
(SWMETAICAL ABOUT CENTER LilES) r------- s-e· ___ _.;. ___ -..~
u·1 4.5" ..,.,3.5" 5/18"
I" II (T'IP)
1/'f" X 4" X 2'- a• ANOtCRACE PlAit
DETAIL 1 DETAIL 2 ·
r-'·-rj
1 ( :t~ H2 11M ( '6)
V211Nt (I ., • ., GIUOE 40)
VI BAR (I ..... GRADE 40)
REINFORCING STEEL DETAILS
H2 8Nt
ASn c-so 1/2'" PLATE
SECTION
ll!AEADED F' AS'ItNEI'I
1- 3" -1 n_j_ t ,;:-r
WIUIANS C2T SlOP T'IPE COUPUNG, OR £0UfVAI..EHl
DETAIL 3
, vr STEn PP£ I.OCA1m AT QUARTER
POIN'I'S TO AID IN
(7~~~~ ::¥:.o, t 'J/4" (T\10. CCMII)
$UNE Fat I DtA. BOLT
(SEE DETAIL 'J}
SECTION 8-B GEHEI'IAL NOlES
I. ANQ:£ · SECnONs N:1D AU. Stm. PUlES SIWJ. CONFORti 10 . AS'IU OE'SIONA110H AJI.
2. BEARING PAD$ SHN.L BE IIAOE fJF AN o.ASTCJNE'IRIC IIATERI~ WITH A HARONESS Of' 60 DUIIOioi£1ER AND ARE TO If EPOXIED TO EAOf END Of BARRIER UNIT AFTER CASllNO.
·AU. ~ SHALL II£ CUSS A, e. OR H, utiLESS OTHERWISE SPECIFIED.
4. ALL R£JNFORCINO STEEL SHALL 8E GRAOE to, UNLESS OTHERWISE SPECIFIED.
5. EAOf ·BARRIER SHALL BE DEU'fERm WITH 2 SPUCE L 5" X 'J" X 1/2" SttnONS AND CONNECliiG HAROWML
S. Wti£N BMI'IIER IS TO 8£ PLACED 14 A Q.lltWjC. AWGtMNT. THE ANGLE SECTIONS IIAY 8E HEATED AT iHE MiDPOINT. ANO PRE-BENT.
7. CHAIM'ER END EDG£5 3/4".
a. REINF'ORCINQ S1E£1,. BOLTS, NUTS. WASHDt$, ANGLE SEC'IlOMS, ANO ANCHOR ACE PV. ftS SHALl BE CONSIOEI'IEO SUBSIDIARY TO IHE BID ITEN,
SINGLE SLOPE CONCRETE BARRIER
PORTABLE & PERMANENT
PRo.£CT NO. 9&29 - D
ORA ... BY J.t..
SCALE HONE
Figure 38. Fabrication details for single-slope CMB
01 ......
Welded Wlre Fabric 3x12 - 018 x 020
6-0 kst minimum yield strength
u--r=-END VIEW
as·
I-- 12· _ -1
12· _J 12· I ... .. ·-ill( ,. tl( .. )1:
I
I
' I I
~ , , ' '
SIDE VIEW
Fi,gure 39. Alternate wire mesh reinforcing scheme for single slope cr1B
\
l t I , I
)
~
J
) ~ I
I j I
t
APPENDIX B.
SEQUENTIAL PHOTOGRAPHS OF CRASH TESTS
62
o.ooo s
.~.1 0.064 s
0.127 s
0.191 s
Figure 40. Sequential photographs for test 9429C-1.
63
0.254 s
0.318 s
0.381 s
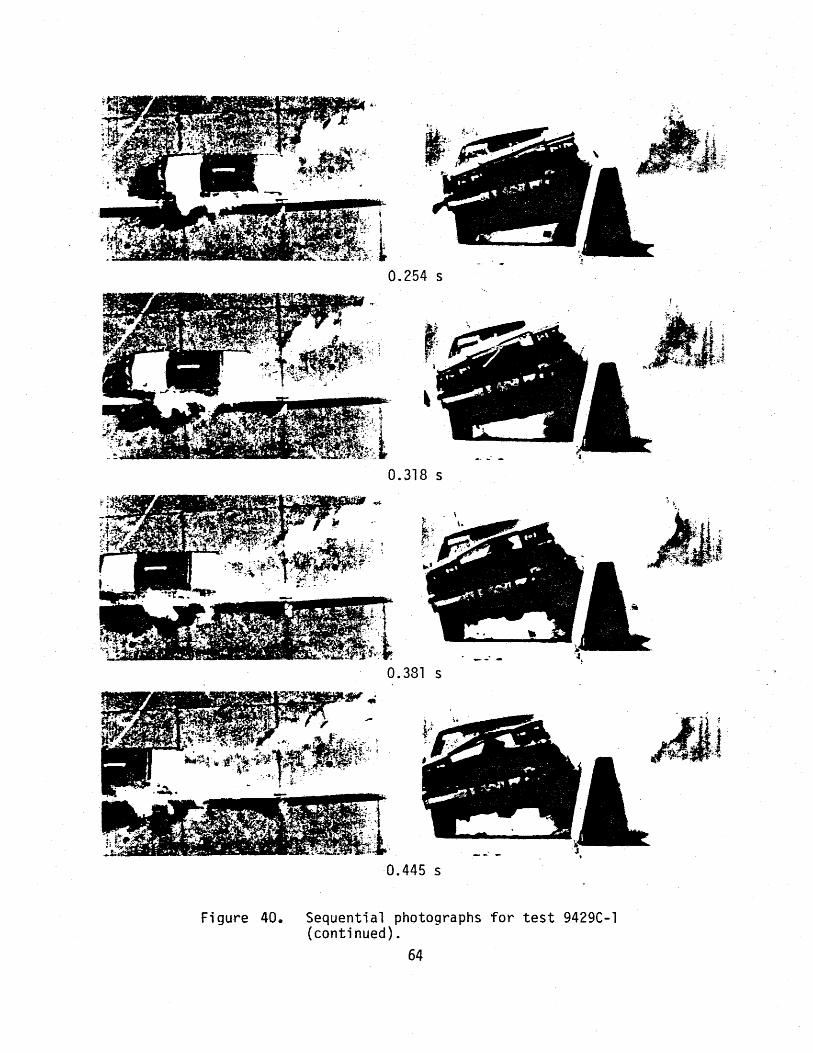
0.445 s
Figure 40. Sequenti a 1 photographs for test 9429C-l (continued).
64
• -·y ' 4 --
~ ~ ~' . .: ""~ -~.
0.000 s
0.037 s
. __ . ., ' ., ·. - j - . • -
0.073 s
. ... ' - . . ; . ' . . '•
0.110 s
Figure 41. Sequential photographs for test 9429C-2.
65
' .. ,:-, .. • - ;: I --
0.146 s
• '"f . - ~ . 1 -
0.183 s
. . .. , . . . .... . ' .
0.248 s
' .*+>~ ~ ~ -~· . , . .
0. 309 s
Figure 41. Sequential photographs for test 9429C-2.
66
1 '\. ..\..· • :s ,.·,t\ .....
•.. . ....... .: ·-·
. . . .. ..._ ....... .,. ~ .._,. ~ or ~,. .o.C. "'"'-
0.000 s
\
0.060 s
\ . t
0.120 s
'f.~.
0.180 s
..........
........ .;:.- '
i"~_· ·tlibJ.·~~ ':~~~...... ;r.,;.-.• •.•. · -~-~:~\ -~
.• "'!'.
·'~ .... J.. •· ~. -.....- .. ,.:'.~ ..... :,.
. .p-> . ./·
,...... . ~ ... -......;.:.· <· ·---!;··~-.-~··
"'
Figure 42. Sequential photographs for test 9429C-3.
67
t
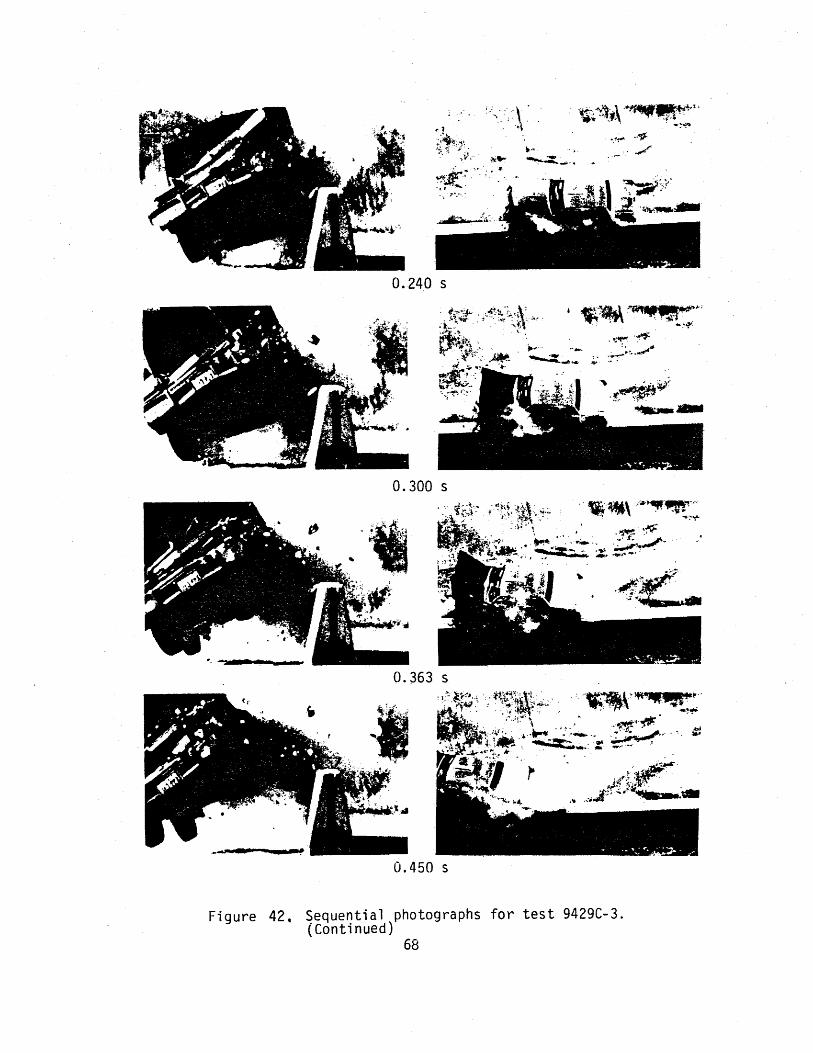
Figure 42,
..... ... : ····x··· . ....... ·i; .. ... # l
ij.1'*;1~; .. ·.!~ ··"'11-~-'· ./ -.. ,. ~
::.Jt~ ,._";- ~-..•. r·~"· . .
0.240 s
. ..:~~ : ' . .:,..;~ ••. -..A* .........
0.300 s
'
;··.Ji . 'R
'
0.450 s
Sequential photographs for test 9429C-3. (Continued)
68
0.000 s
0.049 s
0.099 s
· .. Jl.l\ . I . ~~~. -- .·•
--·:--~
0.148 s t 9429K-1. of tes 1 Photographs Sequentia Figure 43• 69
0.198 s
: -~~~r~····]~:, r~ > :;r \''~ ' . . ~ . . -
:::·~~t~ .. :~~::-:~ -·~ -..:·,~ ;::·~
0.247 s
•f#~ .
. ~ ..,;
0.307 s
J ' . 't ,_ ... ..
i 1 .
.. ·,. ~~;;."~·.! .
0.371 s
Figure 43. Sequential photographs of test 9429K-1 (continued).
70
APPENDIX C ..
ACCELEROMETER TRACES AND PLOTS OF
ROLL, PITCH, AND YAW RATES
71
• an
• 0 -
• _tn (f) UJ UJ ~ (..!)
Ulo Cl • -tz UJ 1::. w'f u a: __. tl.. (f) • t-tO
o1
• II) -I
• 0 N
I
TIME
Axes are vehicle fixed. Sequence for determining orientation is:
1. Yaw 2. Pitch 3. Roll
Roll
Yaw
Figure 44. Vehicle angular displacements for test 9429C-1.
72
TEST 9429C-1 300 Hz F1Jter
20 I 1-- ..... ci Max mum 0.050-second Ave age = -3.: g
15 I
" 1 • a 10 v
I
I z 0
~ 5
bl .J
I I I
I Iii 0 0 ~
I A- A .ft..._ A .. j l "· a.u .• A. .. ... &
' wvr ' vyvv~ "''' r vv·
...... y .... .,... wv r
~ z -5 0 :l 1-a % -10 g
I I I
I -15
I I I
-20 I
0 0.1 0.2 O.J 0.4 0.5 0.8
nwE (SECONDS)
figure 45. Longitudinal accelerometer trace for test 9429C-l.
73
TEST 9429C-1 300 Hz Filter
I I
1.. ..1 Maximu~ 0.050-sec ond Avera£ e == -6.8 g I "' I""
15 I I I I
I I "
10 • ... 0 ...,
--- I I I I
I I z 5 0
I I I I
~ ~ 0 bl 0 ~
~ -5
I I. ~N J I • I A ~· &IAJ l aldl .. A, ... •
1 I
~ m1 ~ J'l r•rl ryvv •·tr· .. YJ v· J""'• .,...""
I -1-- 1-
Ill
~ -10
I I I I -15
I I -20 I I
0 0.1 0.2 0.3 0.4 0.5 0.8
TIME {SECONDS)
Figure 46.. Latera 1 acce 1 erometer trace for test 9429C-1 .
74
TEST 9429C-1 300 Hz Filter
20 T
II il Maximur ~· 0. 050-sec ond I 'II ,
Aver ge = -2.4 g I II I Jl 15
I I " 10 • .. ! z s 0
~ ~ 0 ld
8 '(
g -5
~ bJ > -10
I I I I
~
II I
ll ~ ~ L~ Aru .... _ .. 1 , 1 ~
~ v '~ WI"V -vv"
I I I
I I I I I :I
I I I I r T -15 I I
-20 I I 0 0.1 0.2 0.3 0.4 0.5 0.8
llME (SECONDS)
Figure 47. Vertical accelerometer trace for test 9429C-1.
75
• 0
0 • -(/')
UJ UJ ~ U) •
UJ~ Cl I -tz UJ • :!::0 UJ~ u a: _J
0... (/) . ...... o or;>
• 0 ... I
Axes are vehicle fixed. Sequence for determining orie,ntation is:
1. Yaw 2. Pitch 3. Ro 11
TIME <SECONDS) Pitch
Yaw
Figure 48. Vehicle angular displacements for test 9429C-2.
76
TEST 9429C-2 300 Hz f1lter
m~--~----~----~--~----~--------------imum 0 050-sec nd Aver ge ~ - 5 g
" 10
• 0 ..., z 0
~ 0 ld
Jil 0 ~ ~ z -10 -0 g a z 9 -20
0 0.1 0.2 0.3 0.4 0.5 0.8 0.7 0.8
11ME (SECONDS)
Figure 49. Longitudinal accelerometer trace for test 9429C-2.
77
TEST 9429C-2 300 Hz F1lter
. 050-s.e nd Ave ge = - 5. 3 g
~ 0 -0 v
z 0
~ ~·
-10
Ill
§ -20
i Jd
~ -30
0 0.1 0.2 D.3 0.4 0.5 0.8 0.7 0.8
11WE (SECONDS)
Figure . 50.. Latera 1 accelerometer trace for test 9429C-2.
78
TEST 9429C-2 300 Hz Filter
" • -a v
z 10 0
~ ~ 0 0 ~ g
-10 ~ bJ >
-20
0 0.1 0.2 0.3 0.4 0.5 0.8 0.7 0.8
111£ (SECOODS)
Figure 51. Vertical accelerometer trace for test 9429C-2.
79
-(I) UJ
• 0 ....
• C) N
UJD • 01!: (.!)
UJ Cl """' •
0 t-N z• UJ l:: UJ (J
a:ci ..J• Q... (I) ....... Cl
I
• 0
"' I
• 0 00
I
Axes are vehicle fixed. Sequence for determining orientation is:
1. Yaw 2. Pitch 3. Roll
Pitch
Roll
Yaw
Figure 52. Vehicle angular displacements for test 9429C-3.
80
TEST 9429C-3 300 Hz F1Jter
20 J I
15 1 ... .I., Ma . 0.050 se c avg. = - ~. 5 g I .l I I
" • .. 10 a v
z 0
I 5
ld .J
~ 0 ·~
~
I I I
I I I I I -' lj I
I I I lot. I ·IJ J ~~:a .. ~ ·• _. a& .. l al .. aa LA
I~ ·~ -~~ ~· n r·~l !f'"Y'• - ... . .. , ...... ~ ~ I
z -s 0 ·.~ 0 z ~10 9
I I J
-15 .1.
I I I
-20 I I
0 0.1 0.2 o.J 0.4 0.5 0.8
TlUE (SECONDS)
figure 53. Longitudinal accelerometer trace for test 9429C-3.
81
TEST 9429C-3 300 Hz Filter
m--~~1~-,----~----~----~~--~--~
1... J.., I"' T"" Na,. 0.050 sec avg. = -~3.0 g
10~~~1~~----~-----+~----r-----~----~ I I
0 ill
~~ -20 -+----&--11~141-1------+-----l~---+----+--------1
I . I I ; I I i I
-~-+----~.~~-----+-----~~----~-----+~--~
I I I I
~~--~~~~--------~----~----.---~ 0 0.1 0.2 0.3 0.4 0.8
llWE (SECONDS)
Figure 54. lateral accelerometer trace for test 9429C-3
82
TEST 9429C-3 300 Hz f1lter
30 I I I~ I
Ma x. 0.050 s ~c avg. = E I II"' .2 g
20
" I 0 " 10 z 0
~ Jd ..J 0 ~ ~
~ -10 ~ bJ >
I
j
I I ~!\II I
~,,
~ I I
j ~ I ' t • I J\ ... I - 1\.
v~ t .·~ ~~ N,W V VN~WW~~ v' I
II ~ I II !1
I' I '
I I l
-20 I I I I I I
-JO I I 0 0.1 0.2 0.3 0.4 0.5 0.8
11UE .(SECONDS)
Figure 55. Vertical accelerometer trace for test 9429C-3
83
-(f)
• 0 N
UJ • wo 0:!:-(.!)
UJ Cl -r-o z· UJ L: UJ u a:c:i ..Jo_l (/') t-t
Cl . 0 N
'
9429K-t
9429K-1
9429K-1
l'z
~. C.H .. ®.· .' .· .. ··.V. AW ·~... _;!---' . ~ -<7 . ~ ---~ .~o•'.
Axes are vehicle fixed. Sequence.for determining orientation is:
1. Yaw 2. Pitch 3. Roll
Roll
P• .h6 1tc
----e Yaw
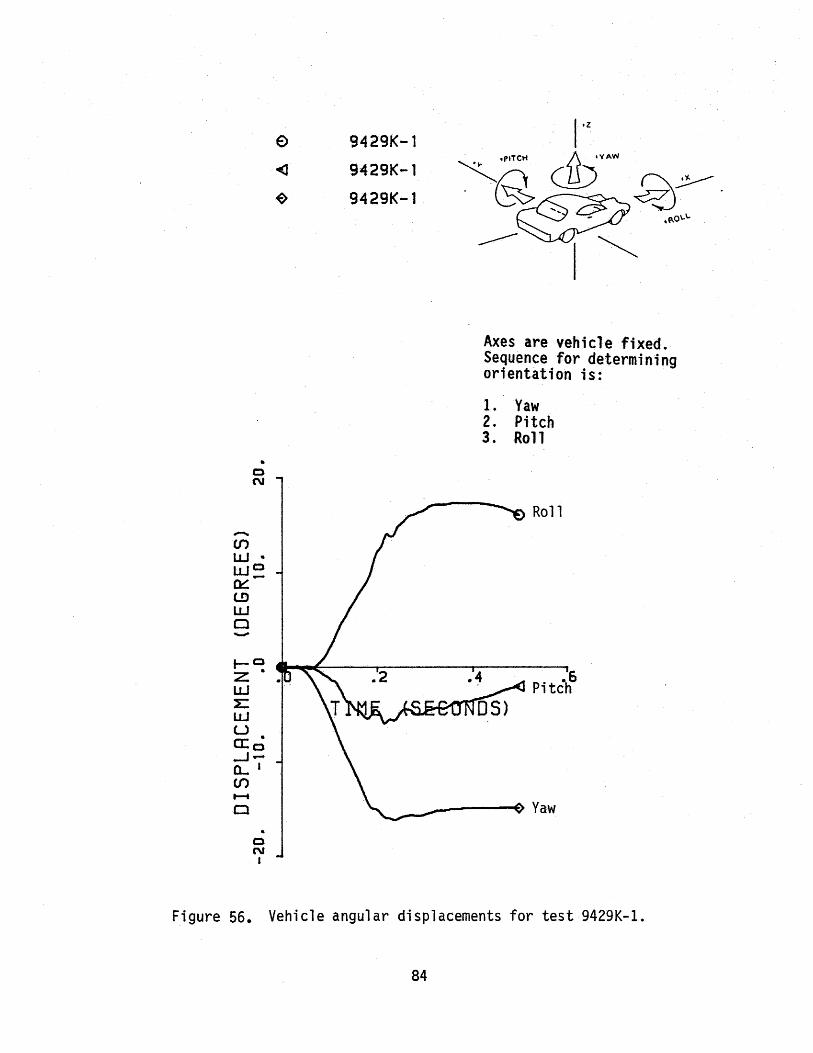
Figure 56. Vehicle angular displacements for test 9429K-1.
84
9429K-1 · Closs 180 Filter
30~~~--~~--~----~------~----------~--~--~
" ., ...
" v
z 10 0
~ hJ .J hJ 0 0 ~ .J ( z 0 :> -10 1-0 z g
-20~--~----~~------~--~~-4~------~--------~
-Jo;. .. .--..-~------~ ................ ~--------• 0 0.1 0.2 O.J 0.4 0.5
liME (SECONDS)
Figure 57. Longitudinal accelerometer trace for test 9429K-1.
85
9429K-1 Class ·180 Filter
20 t l I I .I
I - ...,. Maximum 0.650-second; Average = -7.3 g ·-- I
15 I I I I I
10 I I " ., b 5 v
I I I J I
z 0 0
~ w
I I
I ~M ~.~~~· !u. A.~ A L ....... .• I. I I .u.... • ... .
~ n ... 1 lj!r lfY'' i ,,,. • T" . .. I 'II''
..1 -5 w -u ~ -10 J
I I I
~ I w
-15 ~
-20
.I I
I I I I
I I -25 I
I I
I I -JO I I
0 0.1 0.2 0.3 0.4 0.5
llUE {SECONDS}
Figure 58. Lateral accelerometer trace for test 9429K-1.
86
9429K-1 Class 180 Filter
30 I I . I I I I Maximum 0.050-secoftld Average = 2.9 g ....
' I I I I
20 ,. I I
I I
" n I u v
10 z 0
~ bJ ..J 0 hJ 0
~
1 . I
~ I
~~ ~l"A n. al ~ j ...t.. ,JII\ J\t\ A
1'1 ~~! v ··y~l AI y I v ,, yv
I I
~ -10 ~ w >
I I I I !I
I I I I
-20 I I I I I I I I
-30 I I
0 0.1 0 .• 2 0.3 0.4 0.5
TIME (SECONDS)
Figure 59. Vertical accelerometer trace for test 9429K-1.
87
REFERENCES
I. Mi ch fe, J.D., "Recommended Practices for- the Safety Performance Evaluation of Highway Appurtenances," NCHRP Report 230, March 1981.
2. Buth
3. Beason, W.l., Hirsch, T.J., and
4. Segal, D.J., "Highway-Vehicle-Object-Simulation-Model-1976," Report Numbers FHWA-RD-75-162 through 165, 4 Volumes, Calspan Corporation, Buffalo, New York, 1976.
5. Perera, H.S, "Simulation of Vehicular Impacts with Safety Shaped Barrier," Ph.D. Dissertation, Department of Civil Engineering, Texas A&M University, College Station, Texas, 1987.
6. Ross, H.E., Perera, H.S.,. Sicking, D.l., and Bligh, R.P., "Roadside Safety Design for Small Vehicles, .. Final Report, NCHRP Project 22-6, 2 Volumes.
7. Hancock, K.t., Brons tad, M. E., and McDevitt, C. F., "Crash Test Evaluation of Selected Bridge Rails," Preprint of Paper Prepared for Presentation at the 66th Annua 1 Meeting of the Transportation Research Board, January, 1987.
8. Ross, H.E., Michie, J.D., and Sicking, D.l, "Update of Recommended Procedures for the Safety Performance Evaluation of Highway Appurtenances," Research Project No. NCHRP 22-7 in Progress at the Texas Transportation Institute, Texas A&M University, 1989.
88


![Bullard Assumptions Talk[1]](https://img.pdfslide.us/doc/110x75/577d22b61a28ab4e1e980efd/bullard-assumptions-talk1.jpg)