Embed Size (px)
Citation preview

W-483
Derek C. Jones Panu Kalmi
W-485
W-483
Evidence from Finnish Manufacturing
HRM Practices and
AALTO-YLIOPISTON KAUPPAKORKEAKOULUAALTO UNIVERSITY SCHOOL OF ECONOMICS
AALTO-YLIOPISTON KAUPPAKORKEAKOULUAALTO UNIVERSITY SCHOOL OF ECONOMICS
Petri Järvikuona, Aleksander Panfilo, Päivi Karhunen, Riitta Kosonen: Yritysten palveluiden ulkoistam
isen potentiaali Pietarissa suomalaistoim
ijoiden näkökulmasta
Takao Kato Mikko Mäkinen
Firm Performance:

Department of Economics
December2010
AALTO-YLIOPISTON KAUPPAKORKEAKOULUAALTO UNIVERSITY SCHOOL OF ECONOMICS
WORKING PAPERSW-485
Derek C. Jones – Panu Kalmi – Takao Kato – Mikko Mäkinen
HRM Practices and Firm Performance:Evidence from Finnish Manufacturing

Derek C. Jones, Panu Kalmi, Takao Kato, Mikko Mäkinen andAalto University School of Economics
ISSN 1235-5674 (Electronic working paper)ISBN 978-952-60-1065-6
Aalto University School of Economics -Aalto-Print 2010
AALTO-YLIOPISTON KAUPPAKORKEAKOULUAALTO UNIVERSITY SCHOOL OF ECONOMICSPL 00076FI-00101 HELSINKIFINLAND
1
HRM Practices and Firm Performance: Evidence from Finnish Manufacturing1
Derek C. Jones*, Panu Kalmi**, Takao Kato*** and Mikko Mäkinen** Abstract: We study how HRM practices such as employee involvement (EI) in firm decision making and financial participation (FP) are associated with firm performance. Our novel HRM survey data set has advantages over most data sets typically used in related studies since it is a panel, includes a broad variety of practices and is a representative random sample. Also we take into account other important drivers of firm performance, notably computer use, product market competition, and family and foreign majority ownership. The sensitivity of findings to different empirical approaches is investigated and our preferred approach is novel and uses robust regression methods. While results are sensitive to different specifications we find that performance-based pay and indices of FP are positively related to firm performance. Contrary to many previous findings we do not find a significant positive association between indices of EI and firm performance, though in some case we find that individual EI practices do enhance business performance. JEL Codes: M54, J53, L23 Keywords: new workplace practices; HRM; employee participation; firm productivity * Dept. of Economics, Hamilton College, Clinton, NY 13323, [email protected]; ** Dept. of Economics, Aalto University, School of Economics, PO Box 1210, 00101 Helsinki, Finland and HECER, [email protected] and [email protected] (corresponding author) *** Dept. of Economics, Colgate University, Clinton, NY 13346, [email protected]
1 Earlier version of the paper have benefitted from comments by participants at the 2009 CAED conference (Tokyo), the HECER Labour and Public Economics Seminar in Helsinki, May 26, 2010, the 2010 AEA conference (Rome), and the 2010 IAFEP conference (Paris). We are grateful to the Academy of Finland (Grants 206027 and 120234) and the Finnish Work Environment Fund (Grants 103313 and 108708) for financial support. The usual disclaimer applies.

2
1. Introduction
A growing body of empirical research evidence from several industrialized countries
suggests that human resource management practices (HRMPs) have become increasingly common
forms of employee participation during the last years (see, e.g., Blasi and Kruse 2006, Kruse et al.
2010 for the US; Bryson and Freeman 2010 for the UK; Kato 2006 for Japan; Jones et al. 2010a,
Kalmi and Kauhanen 2008 for Finland). In parallel with the mushrooming of these practices there
has been an outpouring of empirical research that focuses on the impacts of HRMPs on firm
performance. Whereas some of these studies examine combinations of HRMPs--e.g. Chi et al.
(2007) construct employee involvement indices (EI) based on eight practices-- others focus on a
single HRM practice, such as stock options (e.g. Jones et al. 2010b; Mäkinen 2010; Sesil et al.
2002).
However, the key conclusions obtained in many of these previous studies might be
premature, since often they have at least one of the following potential limitations. For one thing, the
underlying data may not be representative. Several studies use subjective performance measures,
while others do not conduct their empirical analysis using methods that are derived from a strong
conceptual framework but rather use ad hoc regressions. Also, several studies are likely to suffer
from omitted variable bias, because of a failure to include all relevant HRMPs or other important
factors that are likely to affect firm performance. In addition all studies that are based on self-
reported surveys are prone to measurement errors (e.g. survey noise biases).1 Finally, the two-stage
estimation method applied in some studies (e.g. Black and Lynch 2001; Zwick 2004) may be
problematic itself and suffer from outlying observations (e.g. due to noisy company micro data, or
due to biased first-step fixed effects estimates) which, especially in small samples, can lead to the
erroneous estimates of coefficients and standard errors, and potentially flawed conclusions.
3
In this paper we estimate how HRM practices are related to firm performance. While
we cannot address all the potential limitations of previous work, we are able to respond to many of
these matters. In particular, we focus on the following issues concerning data and methods. First, we
use a new survey data set from the Finnish manufacturing sector that covers a broad set of HRM
practices in 398 firms which constitutes 38% of firms in the population.2 This HRM survey is a
representative random sample of those manufacturing firms that employed at least 50 persons in
2005. The response rate of nearly 50% is relatively high compared to previous HRM surveys in this
area (e.g. compare with Freeman and Kleiner 2000 or Kato and Morishima 2002). Most unusually,
the wide range of practices we survey enables us to distinguish strategic or high-level forms of
employee participation in decision making (such as board representation) from low-level practices
(such as self-managed teams). As well as investigating the effects of individual HRM practices, we
also follow some previous studies and use summated rating indices of these practices to measure
firms’ overall HRM activity. Importantly, when assessing the association of HRMPs with firm
performance, we are able control for many factors that previous work has found to be important for
firm business performance; these include computer use, the extent of market competition, and family
and foreign ownership. By following Bloom and van Reenen (2007) another innovation is to control
for survey interview biases (noise errors). From an econometric point of view, our novel contribution
is to apply estimators that are to robust to outlying observations, both in cross sectional as well as in
a two-step estimation approach. Finally, because we have access to panel data, we are able to control
for omitted variable bias by using the fixed effects estimator.
The paper is organized as follows. In section 2, we provide a brief conceptual
framework and in section 3 we describe our data. After outlining the empirical strategy in section 4,
we report our key findings in section 5 while in the final section we provide our conclusions.

4
2. Conceptual framework
There are several standard arguments in the personnel economics literature as to why
one might expect a positive effect of a single workplace HRM practice on firm performance. For
example, increased employee financial participation (FP) can improve goal-alignment and
motivation of employees and lead them to exert more discretionary effort. Increased employee
involvement (EI) in firm decision making may lead empowered employees to make business
decisions that were previously within the realm of managers’ duties and also encourage employees to
share important information with managers and coworkers, thus leading to better information flows
within the firm. Also, management may voluntarily share important firm information with employees
leading workers to increase their commitment and loyalty which, in turn, enhances firm performance.
Furthermore, managers’ top-down sharing of firm information might increase workers’ trust for
management and reduce management’s opportunistic behavior.
Empirical evidence in support of a positive effect of a single HRM practice on firm
performance is found in several important studies. For example, what comes to employee financial
participation, profit-sharing plans have often been found to be positively related to firm performance.
This is the key conclusion of several surveys and studies (see, e.g., Cable and Wilson 1990; Jones
and Pliskin 1991; Knez and Simester 2001; Kruse 1992; Robinson and Wilson 2006; Wadhwani and
Wall 1990; Weitzman and Kruse 1990). In addition, empirical studies of employee stock ownership
plans (ESOPs) also usually support the existence of a positive relationship between ESOPs and firm
productivity in a variety of institutional settings (see, e.g., Bryson and Freeman 2010 for the UK;
Kato et al. 2010 for Korea; Kumbhakar and Dunbar 1993 for the US; Jones and Kato 1995 for Japan;
Perotin and Robinson 2003 for various European countries). However, as many surveys point out
(e.g. Kruse 2002), the empirical evidence in support of this positive link is probably less robust than
for profit sharing.

5
Another major underlying theme in the conceptual literature is the claim that there are
complementarities among HRM practices—i.e. the returns of a workplace HRM practice can be
substantially higher when they are combined with other workplace practices rather than introduced
alone. For instance, the effects of increased employee discretion, such as teamwork, might be higher
when they are introduced in tandem with performance-based pay. The theoretical framework to
analyze complementarities has been laid out in several studies (e.g. Aoki 1990; Ben-Ner and Jones
1995; Dessein and Santos 2006; Milgrom and Roberts 1995). In support of this prediction, empirical
research has often found a positive association between clusters of workplace HRM practices and
firm performance in various institutional contexts (see, e.g., Black and Lynch 2001, Black and Lynch
2004, Huselid 1995 and Ichniowski et al. 1997 for the US; Kato and Morishima 2002 for Japan;
Conyon and Freeman 2004, Guest et al. 2003, Robinson and Wilson 2006 for the UK; Zwick 2004
for Germany; Eriksson 2003 for Denmark; Jones et al. 2010c for a Finnish econometric case study).
However several studies have been unable to find support for the complementarity theses (e.g.
Addison and Belfield 2001; Cappelli and Neumark 2001), suggesting that institutional context,
nonrepresentative samples or econometric specifications may influence results (Kaufman 2010). On
the other hand, Pendleton and Robinson (2010) suggest (in the case of employee stock ownership)
that when there is a minority participation in the ESOP, the plan needs employee involvement in
decision-making (or voice) to be effective, but when there is a majority participation, the plan has an
independent effect on productivity.
As well as these findings reported in the literature on the effects of HRM practices on
firm performance, there is a rich literature on how other factors are related to firm performance. For
one thing, empirical work using micro data suggests a positive link between computer use and
productivity (e.g. Brynjolfsson and Hitt 1997, 2000). Foreign ownership has also found to enhance
firm performance (Aitken and Harrison 1999; Griffith 1999). 3 Furthermore, family ownership (or,

6
more generally, concentrated ownership) may have advantages over highly dispersed share
ownership due to the principal-agent problem (Berle and Means 1932) being less severe. The
benefits of family ownership are also linked to issues such as working hard due to a higher social
shame of failure, and greater trust and loyalty to other stakeholders, whereas conflicts between
business operations and family interests are associated with costs (Bennedsen et al. 2007). Overall,
family ownership seems to be expected to have a mixed effect of firm performance, whereas family
management appears to have a significant negative effect (Perez-Gonzalez 2006, Villalonga and
Amit 2006). Finally, product market competition has the most straightforward theoretical link with
firm performance through a Darwinian selection process whereby high competition simply drives
less efficient firms out of the market. On this point, empirical research has found supportive evidence
(e.g. Bloom and van Reenen 2007; Nickell 1996; Olley and Pakes 1996).
3. Data
3.1. HRM survey
A) Background information
Our firm population is Finnish manufacturing companies employing at least 50 persons
as listed in Statistics Finland’s Business Register in September 2005.4 The size of the population
with 50+ employees in the Business Register is 1,054 companies. Because the register basically
includes all Finnish firms that are liable to pay value added tax or have paid employees, we can
define the population accurately. We decided to focus on manufacturing firms employing at least 50
persons due to following reasons: (i) HRM practices might not be common in smaller firms; (ii)
respondents in smaller firms may be reluctant to participate in surveys (e.g. due to lack of time); (iii)
financial statements are not easily available for smaller firms; and (iv) to show comparable findings
with many previous studies that also focus on manufacturing firms (e.g. Black and Lynch 2001).
Because our accounting data are at the firm-level, the survey was also addressed to

7
firms rather than establishments. However, for the Finnish case this is probably not a large source of
concern since it is widely believed that there is not much heterogeneity concerning HRM practices
within multi-plant Finnish manufacturing firms --establishments do not have a large measure of
autonomy concerning the adoption of HRM practices.
A well-known market research firm, operating in the field for over 20 years, conducted
the Computer Assisted Telephone Interviews on HRM practices. The interviewers are specially
trained (most are university students) and called firms in a random order and asked the firm’s
switchboard operator to be connected with our target respondent: “a manager who is in charge of the
firm’s human resource management issues in Finland.” In the beginning of each survey, they
stressed to respondents that full anonymity and confidentiality would be guaranteed. Altogether 832
calls were made between December 2005 and January 2006, and we have data on 398 manufacturing
firms (the sample size n=398) that participated fully in the survey. This is 38% of the firms in the
population and almost 50% of our target respondents. The duration of each interview fluctuated
somewhat, but an average running time was about 30 minutes. The most common reason for non-
participation was that respondents were too busy and/or uninterested (86% of the non-respondents).5
When our sample is compared with the underlying population, the characteristics of sample
companies are found to be very similar to the population in terms of size and industry distributions
(Mäkinen and Kalmi 2006).
B) Employee involvement in decision-making and financial participation
To provide the reader with a better understanding of HRM practices in sample firms,
we briefly describe the incidence of employee participation. To assess the incidence of employee
involvement in firm decision making (EI), and drawing on earlier literature (e.g. Chi et al. 2007;
Freeman and Kleiner 2000), we focus on the following practices: 1) employee board representation,
2) joint consultation committee, 3) quality circles, 4) self-managed teams, 5) job rotation, 6)

8
suggestion scheme, 7) job satisfaction survey, and 8) total quality management (TQM). For financial
participation (FP), we focus on the following practices: 1) performance-based pay6, 2) personnel
funds7, and 3) stock option schemes. For ease of interpretation, we follow Black et al. (2004) and use
binary measures for the incidence of a single practice (=1 if a firm has adopted a given practice, 0
otherwise).
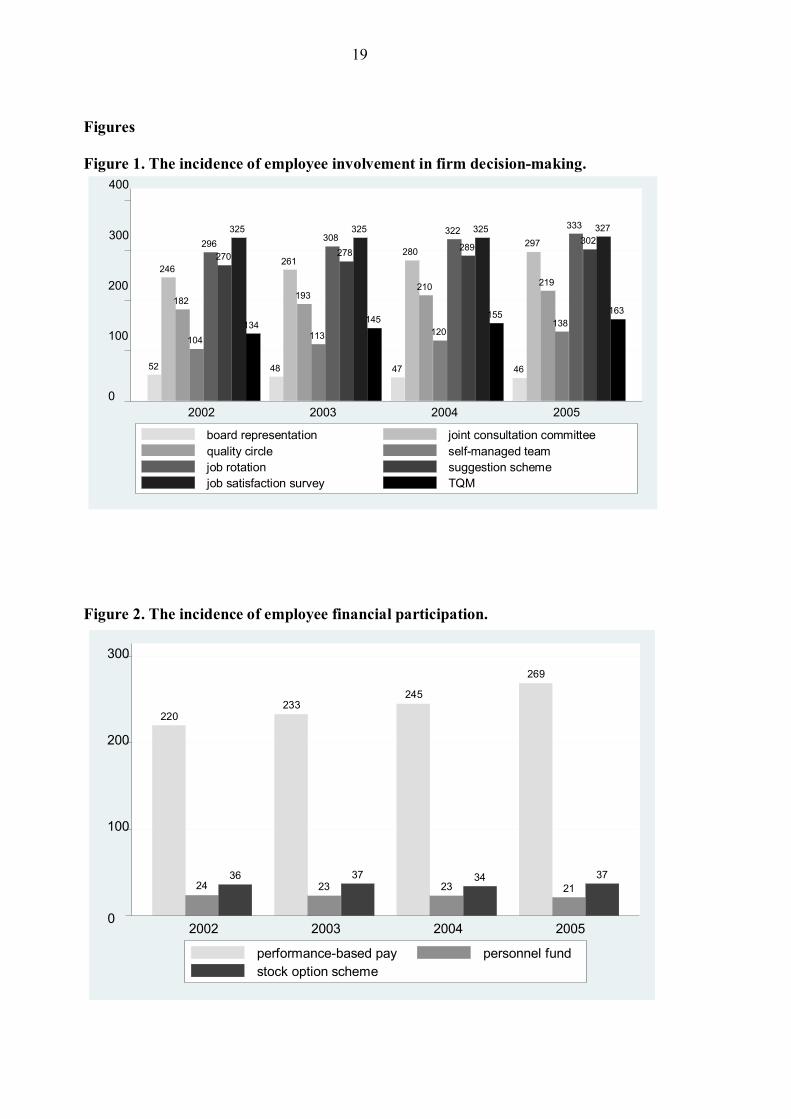
Figure 1 shows the incidence of employee involvement between 2002 and 2005 and
indicates significant heterogeneity among firms in the popularity of these practices. For instance, in
2005 the most common practices are the use of job satisfaction surveys (82%) and suggestion
schemes (76%), whereas TQM (41%), self-managed teams (35%) and board representation (12%)
occur much less frequently among sample firms. Figure 1 also shows that the incidence of many of
these practices has increased significantly from 2002 to 2005. For example, 46% of firms have joint
consultation committee in 2002 but by 2005 the figure has jumped to 55%.
(FIGURE 1 ABOUT HERE)
Figure 2 shows the incidence of financial participation. The most popular form of
financial participation is performance-based pay. Furthermore, the incidence of performance-based
pay grew from 58% in 2002 to 67% in 2005, and this growth is consistent with findings from other
Finnish surveys (e.g. as reported by the Confederation of Finnish Industries in their wage surveys,
EK 2006). The incidence of stock option schemes has been relatively stable at 9% over the period,
whereas the share of firms with personnel funds has decreased slightly from 6% in 2002 to 5% in
2005.8
(FIGURE 2 ABOUT HERE)
9
3.2. Company data
Company financial statement data are obtained from a firm that specializes in business
and credit rationing information and provides firm-level data (including income statements, balance
sheets and key financial figures) for from 60-80,000 firms per year. This data base constitutes one of
the largest data sets including financial statement information in Finland, and the data have been
used in many previous empirical studies. We were able to successfully merge financial statements
and HRM surveys for about 90% of sample firms, thus producing a rich panel for the period 2002-
2005.
In the empirical analysis that follows our production function variables (i.e. output,
capital, labor, and materials) come from the financial statement data. Annual turnover is used to
proxy firm output, while labor is the (mean) number of employees, and capital is the sum of tangible
and intangible assets. When using panel data, value variables are deflated to constant 2000 Euros. To
take into account heterogeneity among firms, we use the following firm characteristics: age of firm;
10 region dummies; two-digit manufacturing industry dummies; a dummy for foreign majority
owner; a dummy for family ownership (a member of the Finnish Family Firms Association);
computer use; a dummy for a multi-plant firm; and a dummy for intensive product market
competition.9 Table 1 presents summary statistics.
(TABLE 1 ABOUT HERE) 4. Empirical strategy
Our strategy is to estimate augmented Cobb-Douglas production functions, where firm
turnover is explained by labor, capital, materials, HRM practices, and a large set of covariates that
have been found to be important factors in explaining firm performance in previous studies. We
assume a Cobb-Douglas form of production technology, since it has been used in the related
literature such as the evaluation of the effects of ESOPs on firm productivity (e.g. Jones and Kato
1995) and when analyzing the impact of stock options on firm performance (e.g. Conyon and

10
Freeman 2004; Jones et al. 2010b; Mäkinen 2010). Our estimation strategy partially follows Black
and Lynch (2001) in the sense that we also use the OLS estimator in cross sectional estimates, and
the fixed effects estimator to estimate the average of total factor productivity (avTFP) and then
explain avTFP by various HRM practices using the OLS estimator (i.e. the two-step estimation
approach). However, our preferred approach has two important differences from that adopted in the
influential Black and Lynch (2001) study. First, we apply robust regression methods in the second
step of the two-step approach (besides OLS). Second, we directly use the fixed effects estimator with
panel data and HRM practices. More specifically, we consider the augmented Cobb-Douglas
production function
(1) ln(Y/L)i=c + ln(K/L)i + ln(M/L)i + ´Xi + ´HRMi + i,
where the dependent variable ln(Y/L) is the natural logarithm of firm turnover per worker (labor
productivity), c is a constant term, ln(K/L) is capital per worker, ln(M/L) is intermediate inputs per
worker (materials), X is a vector of firm characteristics, and HRM is a vector of HRM practices. Our
key variable of interest is HRM. As explained earlier we use eight practices for employee
involvement (joint consultation committee, quality circles, self-managed teams, board
representation, job rotation, suggestion scheme, job satisfaction survey, and total quality
management) and three for financial participation (performance-based pay, personnel fund, and
stock option scheme). These variables measure the presence of a practice in a firm (=1 if a firm has a
practice, 0 otherwise).
Despite the fact that we can account for several HRM practices and also include a rich
set of firm characteristics, our cross-sectional estimates of Eq. (1) may be biased if capital, labor, and
materials are be correlated with unobserved firm characteristics. To deal with this potential problem,
and to bring more information to estimating capital, material and labor coefficients, we apply the
two-step estimation procedure suggested by Black and Lynch (2001). In the first step we use panel

11
data and the fixed effects estimator10 to generate firm specific average residuals (time average of
total factor productivity; avTFP), and then in the second step we explain avTFP on HRM practices
and firm characteristics in the cross section:
(2) (first stage; panel data 2002-2005) ln(Y/L)it = i + ln(K/L)it + ln(M/L)it + it.
(3) (second stage; cross section 2005) avTFPi = c + ´Xi + ´HRMi + vi.
While the two-step method has undoubted advantages (compared to many alternative
approaches), nevertheless the second step estimates might still be biased. For example, severe outlier
observations can bias the second stage OLS estimates, since the estimator tends to attach excessive
importance to observations with very large residuals, possibly leading to unreliable results.11 To deal
with outlying observations, as a novel to literature we apply three different robust-to-outliers
estimators: the Median regression (or the Quantile regression for the 0.5 quantile), the M-estimator,
and the MM-estimator. The median regression (the 0.5 quantile) estimator protects against vertical
outliers (only in the y dimension) but not against bad leverage points (both in the y and the x
dimensions). Similarly, the M-estimator (rreg in Stata) is also robust to vertical outliers, but
compared to the median regression it is more efficient. The key feature of the M-estimator is that it
gives less weight to outlying observations. The MM- estimator (mmregress in Stata) of Yohai
(1987) that we apply also gives less importance to outlying observations, but it is more robust and
efficient compared to the M-estimator.12
Finally, one of the key benefits of our data is that we have access to panel data on
HRM practices. Therefore, we can directly apply the standard fixed effects estimator to assess the
association of HRM practices with firm performance while simultaneously controlling for omitted
variable bias.

12
5. Empirical findings
Table 2 investigates the association between HRM practices and firm performance
using a cross section for 2005. In all columns the dependent variable is labor productivity ln(Y/L),
and the covariates are a constant term, capital, labor, a broad set of HRM practices, 10 region
dummies, two-digit manufacturing industry dummies, a rich set of firm characteristics, and survey
noise controls (see notes in Table 3). Column (1) reports OLS estimates. Among the broad set of EI
practices we find that only joint consultation committee (0.06) and job satisfaction survey (-0.07) are
statistically significant, both at the 10% level. On the other hand, FP estimates are insignificant
(though all positive). In column (2), where we report findings having applied the median regression
approach to mitigate biases related to vertical outliers, the previously significant estimates of joint
consultation committees and job satisfaction surveys become statistically insignificant at customary
levels and other EI practices remain insignificant. Performance-based pay is positively significant
(0.05) at the 10% level. In column (3), we report findings based on the M-estimator that is more
robust to vertical outliers compared to results detailed in column (2). In line with our previous
results, almost all EI estimates are insignificant, while performance-based pay remains positively
significant (0.06) but now at the 5% level. In column (4), we apply the MM-estimator to further
increase robustness and efficiency. Most of the employee involvement practices continue to have
statistically insignificant relationships with productivity, though job satisfaction surveys (-0.06) and
TQM (-0.07) are now found to be significant at a 10% level. Performance-based pay continues to be
positive (0.06) and the significance level increases to the1% level. Overall, our HRM findings in
columns (1)-(4) suggest that it is performance-based pay that is positively and more consistently
associated with firm performance and that only selected EI practices are sometimes found to matter
for firm performance.

13
In addition to HRM practices, from Table 2 we see that other firm characteristics often
affect performance. The results are strongest for computer use (a proxy for firm technology),
indicating that production technology matters for firm performance. Column (4) suggests that the
type of firm ownership also has a role in accounting for differences in firm performance and both
foreign majority ownership and family firm variables are found to be positive and significant.
However, the extent of product market competition is consistently found to be statistically
insignificant. Finally, it seems that over time firms lose some of their ability to compete, since in
most columns firm age is negatively associated with performance.
(TABLE 2 ABOUT HERE)
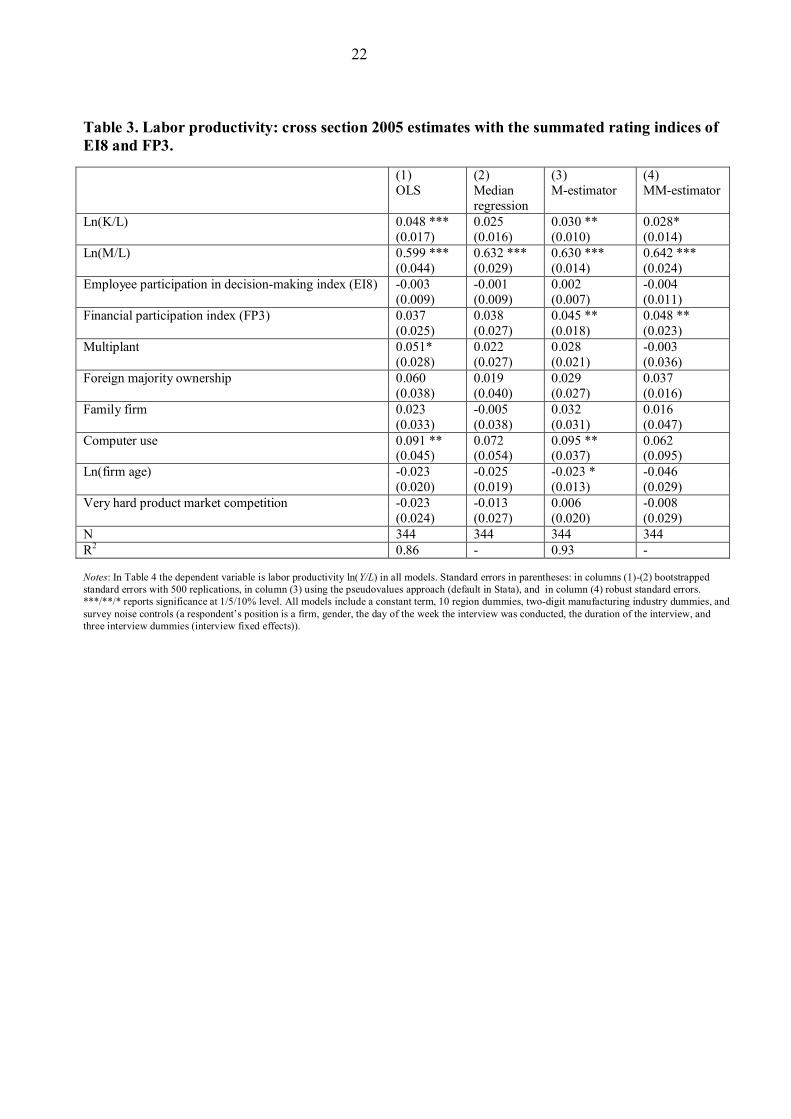
In Table 3, we provide evidence on how firms’ overall HRM activity is related to firm
performance by using the summated rating indices of employee involvement and financial
participation practices. We find that the estimates of financial participation index are always positive,
and in columns (3) and (4) where we use our preferred estimators, they are also clearly significant.
On the other hand, the estimates of employee involvement index are consistently insignificant. We
also examined (not reported here but available upon request) possible complementarities between the
indices of employee involvement and financial participation but did not find any evidence of this.
(TABLE 3 ABOUT HERE)
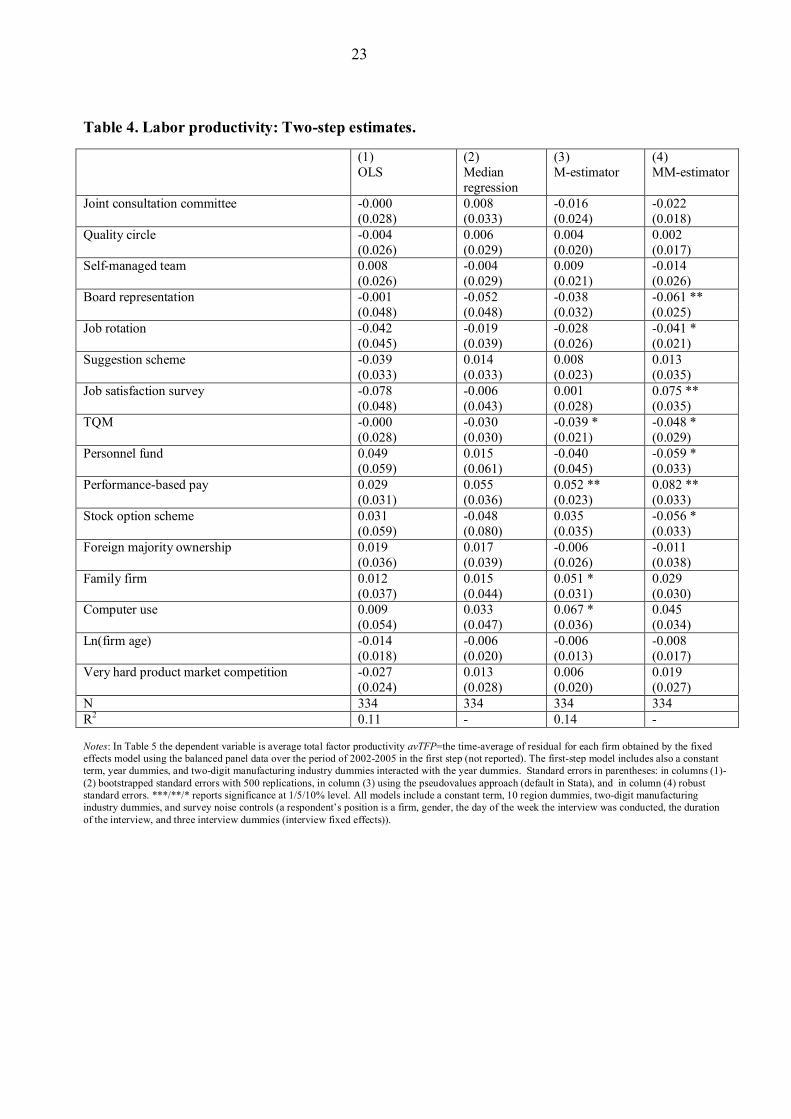
In Table 4, we report the second-step estimation results for the two-step estimation
method. The first-step estimations (not reported) are based on the fixed effects estimator. Though the
method has some advantages over cross section estimation, since it allows us to take into account
omitted variable bias in the first-step, as discussed in Section 4, the two-step estimation strategy may
be problematic by itself. In Column (1) we report findings based on the OLS specification, the
method that, to the best of our knowledge, has always been used in previous studies of this sort. The
results are clear-- we do not find significant association between HRM practices and firm

14
characteristics and firm performance (the average of total factor productivity). In column (2), where
we use the median regression, an estimator that is more robust to vertical outliers than the OLS, we
continue to find insignificant associations with firm performance. In column (3) we present the
estimates of the M-estimator that is also robust to vertical outliers but more efficient compared to the
median regression. Now we find a significant and positive coefficient on performance-based pay,
whereas coefficients for almost all of the EI practices are insignificant (TQM is the only exception).
Our controls for family firm and computer use are both positive and significant. In the final column
of Table 4 we show the estimates of the MM-estimator. The estimator is more robust and efficient
compared to the M-estimator. In contrast to previous columns, now we do find evidence of a
significant association between HRM practices and firm performance. This supports the view that it
may be beneficial to use robust estimators in the second-step of the two-step approach, in addition to
the OLS estimator. Of the eight EI practices, only job satisfaction surveys is positively associated
with firm performance. The point estimate (standard error) is 0.08 (0.04). On the other hand, board
representation, job rotation and TQM are significantly negative. The point estimates (standard errors)
are the following: board representation -0.06 (0.03); job rotation -0.04 (0.02); and TQM -0.05 (0.03).
The remaining four practices, i.e. joint consultation committee, quality circles, self-managed teams,
and suggestion scheme, are each found to be insignificant. Turning to FP, as in most previous
estimates, we find that the coefficient on performance-based pay is positive and statistically
significant. The coefficient (standard error) is 0.08 (0.03). We also find significant but negative
coefficients on personnel funds (-0.06) and stock option schemes (-0.06), both at the10% level.
(TABLE 4 ABOUT HERE)
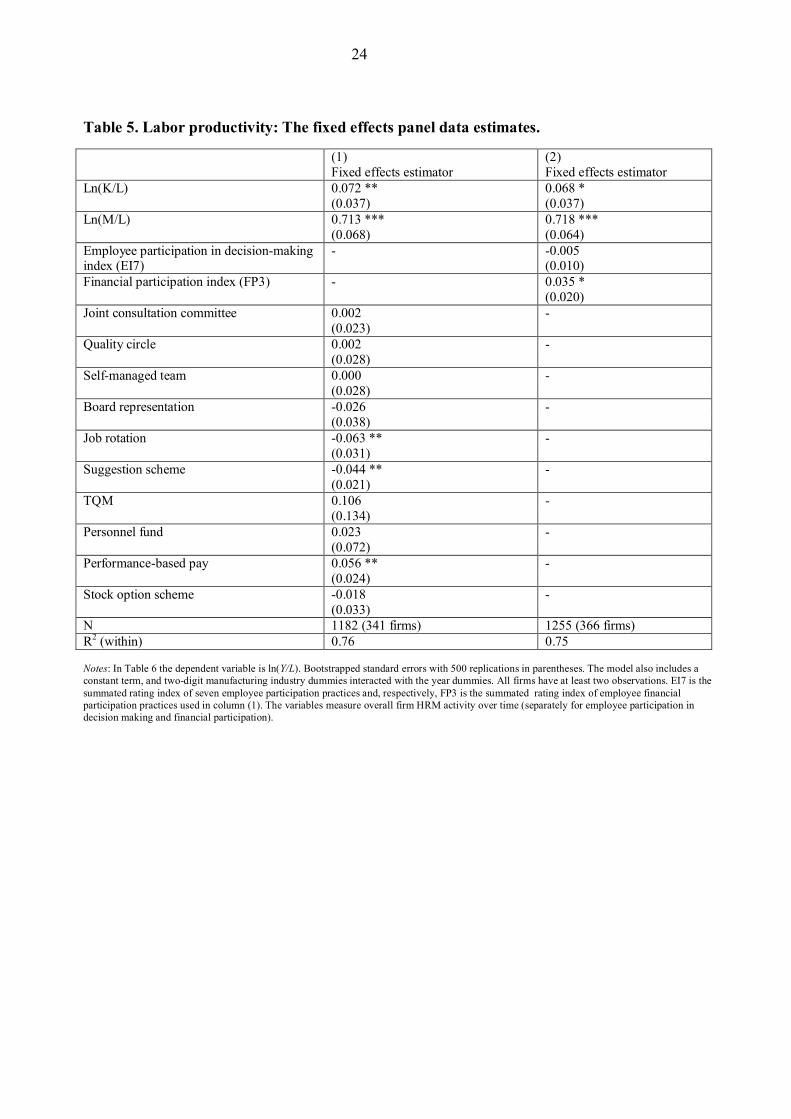
Since we have an access to panel data on HRM practices and firm characteristics, in
Table 5 we directly apply the standard fixed effects estimator. The benefit of using this estimator is
that we can assess the association of HRM practices with firm performance, and simultaneously are

15
able to control for omitted variable bias caused by time-invariant unobserved heterogeneity of firms
such as managerial quality and style, corporate culture, and worker quality. Column (1) shows that
the most EI practices are insignificant, except job rotation (-0.06) and suggestion schemes (-0.04)
which are found to be significant and negatively associated with firm performance, both at the 5%
level.13 Consistent with our previous findings, performance-based pay (0.06) is again found to be
positive and statistically significantly related to output. In column (2), we attempt to measure overall
HRM activity over time, and use the summated rating indices of EI and FP practices. We find that
the summated rating index of FP is significant but that the EI index is insignificant.
(TABLE 5 ABOUT HERE)
6. Conclusions
This paper investigates the relationships between employee involvement in firm
decision making and employee financial participation with firm performance. One contribution is
that we provide the most reliable evidence on these matters for the interesting case of manufacturing
in Finland. As such we extend the range of geographical evidence. But most of our contributions
spring from our attempting to respond to some of potential limitations of previous work. We use
novel data on Finnish manufacturing firms that has many advantages over data typically used in
previous work. Our survey covers an unusually broad range of HRM practices and is for a
representative random sample from the population of the firms with 50 or more employees --38% of
the firms in the population and almost 50% of the survey respondents. By combining our new HRM
survey with firm financial statements we construct a rich panel. This allows us to use a production
function approach that is well grounded in economic theory. Our rich data enable us to take into
account many control variables that have been found to be important for firm performance in
previous work, notably computer use, product market competition, and family and foreign majority
ownership. Most unusually, we control for survey measurement errors. Finally, we estimate diverse

16
specifications including robust regression methods in the second step of a two step approach and also
make direct use of fixed effects estimators.
Our HRM survey evidence suggests that the presence of employee involvement and
financial participation practices in Finnish manufacturing has increased between 2002 and 2005 ,
thus indicating a change in a way of a work is organized, managed and rewarded in that sector. This
development towards more participatory HRM systems is also consistent with previous studies from
other institutional environments (e.g. Kruse et al. 2010 for the US; Bryson and Freeman 2010 for the
UK). We also find substantial heterogeneity in the presence of HRM practices across firms. In other
words, and also consistent with other institutional contexts (e.g. Freeman and Rogers 1999 for the
US), there appears to be lots of managerial discretion in selecting particular HR practices, including
EI and FP practices.
In investigating the association between HRM practices and firm performance, the
most consistent and robust evidence is that firms with performance-based pay schemes have about 5-
8% higher productivity compared to firms without these schemes. This is finding is largely
consistent with earlier literature for other forms of financial participation, including findings for
profit-sharing firms (e.g. Cable and Wilson 1990; Kruse 1992), though our performance-based pay
measure is a broader concept than profit-sharing (as it is usually defined). Furthermore, we find that
business performance is enhanced only by performance-based pay; we find no evidence that other
forms of FP in Finland, namely personnel funds or stock option schemes, enhance firm performance.
However, this result is in line with previous Finnish studies that have focused on these particular
forms of FP notably Kalmi and Sweins (2010) for personnel funds and Jones et al. (2010b) and
Mäkinen (2010) for stock option schemes.
When using an index of EI, we do not find evidence of a positive association between
EI and firm performance. Also, when we look at individual EI practices, only occasionally do we

17
find evidence that EI is positively related to firm performance. As such these findings tend to be at
odds with much of previous literature, including influential contributions both in the fields of
strategic HRM (e.g. Huselid 1995) and labor economics (e.g. Ichniowski et al. 1997; Black and
Lynch 2001). In accounting for these differences in findings, we are reminded yet again of the
complexities surrounding investigations of the links between HR practices and firm performance.
For instance, Kaufman (2010) notes that a positive coefficient on HRM variables means that some
firms are undersupplying HRM and therefore are in a disequilbrium position. Our mostly
insignificant results suggest that the variation in HRM practices may indicate that different firms
benefit from different configurations. Alternatively, one consideration is that the benefits of HRM
practices may not be directly transmitted to better firm performance but rather it takes time before
expected gains are realized (e.g. Kato and Morishima 2002). This is perhaps of particular relevance
in our case, when many practices had only recently been introduced. Also, for firm performance, it is
important to know not only whether a particular practice has been adopted but also how it has been
implemented within the firm (Black and Lynch 2001). Another possible factor is that the potential
economic gains from increased employee involvement may be transferred largely to employees
rather than firms (Freeman and Kleiner 2000).
Our remaining findings suggest evidence of a positive association between foreign
majority ownership, family firm, computer use and firm performance in cross section. These all are
consistent with previous studies (see e.g. Brynjolfsson and Hitt 1997 for computers; Griffith 1999 for
foreign ownership; Bennedsen et al. 2007 for family ownership).
In closing, we note again the sensitivity of findings to different specifications and that
the use of the OLS estimator in the second-step may lead to flawed conclusions, particularly when
the underlying company data are noisy, include outlying observations, and when the sample size is

18
relatively small and for a short time-period. In future work, it might be useful to apply estimators
similar to those we use since to some extent they are robust to outlying observations.
19
Figures
Figure 1. The incidence of employee involvement in firm decision-making.
Figure 2. The incidence of employee financial participation.
220
24 36
233
23 37
245
23 34
269
21 37
0
100
200
300
2002 2003 2004 2005 performance-based pay personnel fund stock option scheme
52
246
182
104
296 270
325
134
48
261
193
113
308 278
325
145
47
280
210
120
322 289
325
155
46
297
219
138
333 302
327
163
0
100
200
300
400
2002 2003 2004 2005
board representation joint consultation committee quality circle self-managed team job rotation suggestion scheme job satisfaction survey TQM

20
Tables
Table 1. Summary statistics 2005 Variable Definition N mean std.dev.
Key production variables Sales firm sales (€1000) 363 79269.4 216534.7 Labor # employees in the firm 400 328.9 943.4 Capital sum of the intangible and tangible fixed assets
(€1000) 364 27935 124879.7
Materials materials (€1000) 364 46329.9 131197.5
HRM practices Employee participation in decision making Joint consultation committee
=1 if joint consultation committee, 0 otherwise 399 0.74 0.44
Self-managed teams
=1 if self-managed teams, 0 otherwise 400 0.35 0.48
Board representation
=1 if employee representative in the board, 0 otherwise
400 0.12 0.32
Quality circles =1 if quality circles, 0 otherwise 396 0.55 0.50 Job rotation =1 if job rotation, 0 otherwise 399 0.84 0.37 Suggestion scheme
=1 if suggestion scheme, 0 otherwise 398 0.76 0.43
Job satisfaction survey
=1 if job satisfaction survey, 0 otherwise 397 0.83 0.38
Total quality management (TQM)
=1 if total quality management, 0 otherwise 395 0.41 0.49
Employee financial participation Performance-based pay
=1 if performance-based pay scheme, 0 otherwise 399 0.67 0.47
Stock option scheme
=1 if stock option scheme, 0 otherwise 397 0.09 0.29
Personnel fund =1 if personnel fund, 0 otherwise 398 0.05 0.22
Firm characteristics Computer use Share of employees using computers almost daily 397 0.58 0.30 Foreign majority owner
=1 if a firm’s major owner is foreign, 0 otherwise 400 0.21 0.40
Family firm =1 if a firm is a member of the Finnish Family Firms Association, 0 otherwise
400 0.12 0.33
Multi-plant =1 if a firm has more than one plant, 0 otherwise 400 0.54 0.50 Very hard competition
=1 if product market competition very high (if scored 5 on the scale 1-5), 0 otherwise
400 0.40 0.49
Firm age Age of the firm 400 16.39 12.36

21
Table 2. Labor productivity: cross section 2005 estimates with single HRM practices. (1)
OLS (2) Median regression
(3) M-estimator
(4) MM-estimator
Ln(K/L)
0.050 *** (0.017)
0.026 (0.018)
0.030 *** (0.010)
0.029 * (0.015)
Ln(M/L) 0.597 *** (0.044)
0.637 *** (0.028)
0.631 *** (0.014)
0.638 *** (0.018)
Joint consultation committee 0.055 * (0.029)
0.045 (0.033)
0.041 * (0.024)
-0.019 (0.017)
Quality circle -0.010 0.000 0.019 0.028 (0.028) (0.028) (0.021) (0.024) Self-managed team 0.011 0.002 -0.005 0.017 (0.027) (0.030) (0.021) (0.023) Board representation 0.052 0.057 0.053 0.005 (0.046) (0.053) (0.032) (0.019) Job rotation -0.017 -0.012 -0.019 0.009 (0.045) (0.041 (0.027) (0.025) Suggestion scheme -0.028 -0.006 -0.002 0.011 (0.032) (0.034) (0.024) (0.022) Job satisfaction survey -0.066 * -0.041 -0.032 -0.055* (0.038) (0.041) (0.029) (0.030) TQM -0.002 -0.019 -0.017 -0.068 ** (0.025) (0.033) (0.022) (0.027) Personnel fund 0.051 -0.047 -0.010 -0.012 (0.077) (0.092) (0.046) (0.034) Performance-based pay 0.034 0.051 * 0.059 ** 0.056 *** (0.028) (0.031) (0.023) (0.015) Stock option scheme 0.055 0.024 0.009 0.023 (0.055) (0.062) (0.036) (0.070) Multiplant
0.055* (0.029)
0.033 (0.030)
0.022 (0.022)
-0.029 (0.022)
Foreign majority ownership 0.057 0.028 0.029 0.068 ** (0.040) (0.040) (0.027) (0.032) Family firm 0.019 -0.012 0.033 0.046 ** (0.034) (0.042) (0.031) (0.018) Computer use 0.103 ** 0.087 0.100 *** 0.073 * (0.046) (0.054) (0.037) (0.042) Ln(firm age) -0.032 -0.034 * -0.028 ** -0.059 *** (0.021) (0.020) (0.013) (0.010) Very hard product market competition -0.021 0.004 0.006 -0.016 (0.024) (0.030) (0.020) (0.026) N 344 344 344 344 R2 0.86 - 0.936 - Notes: In Table 3 the dependent variable is labor productivity ln(Y/L) in all models. Standard errors in parentheses: in columns (1)-(2) bootstrapped standard errors with 500 replications, in column (3) using the pseudovalues approach (default in Stata), and in column (4) robust standard errors. ***/**/* reports significance at 1/5/10% level. All models include a constant term, 10 region dummies, two-digit manufacturing industry dummies, and survey noise controls (a respondent’s position is a firm, gender, the day of the week the interview was conducted, the duration of the interview, and three interview dummies (interview fixed effects)).
22
Table 3. Labor productivity: cross section 2005 estimates with the summated rating indices of EI8 and FP3. (1)
OLS (2) Median regression
(3) M-estimator
(4) MM-estimator
Ln(K/L) 0.048 *** 0.025 0.030 ** 0.028* (0.017) (0.016) (0.010) (0.014) Ln(M/L) 0.599 *** 0.632 *** 0.630 *** 0.642 *** (0.044) (0.029) (0.014) (0.024) Employee participation in decision-making index (EI8) -0.003 -0.001 0.002 -0.004 (0.009) (0.009) (0.007) (0.011) Financial participation index (FP3) 0.037 0.038 0.045 ** 0.048 ** (0.025) (0.027) (0.018) (0.023) Multiplant 0.051*
(0.028) 0.022 (0.027)
0.028 (0.021)
-0.003 (0.036)
Foreign majority ownership 0.060 0.019 0.029 0.037 (0.038) (0.040) (0.027) (0.016) Family firm 0.023 -0.005 0.032 0.016 (0.033) (0.038) (0.031) (0.047) Computer use 0.091 ** 0.072 0.095 ** 0.062 (0.045) (0.054) (0.037) (0.095) Ln(firm age) -0.023 -0.025 -0.023 * -0.046 (0.020) (0.019) (0.013) (0.029) Very hard product market competition -0.023 -0.013 0.006 -0.008 (0.024) (0.027) (0.020) (0.029) N 344 344 344 344 R2 0.86 - 0.93 - Notes: In Table 4 the dependent variable is labor productivity ln(Y/L) in all models. Standard errors in parentheses: in columns (1)-(2) bootstrapped standard errors with 500 replications, in column (3) using the pseudovalues approach (default in Stata), and in column (4) robust standard errors. ***/**/* reports significance at 1/5/10% level. All models include a constant term, 10 region dummies, two-digit manufacturing industry dummies, and survey noise controls (a respondent’s position is a firm, gender, the day of the week the interview was conducted, the duration of the interview, and three interview dummies (interview fixed effects)).
23
Table 4. Labor productivity: Two-step estimates. (1)
OLS (2) Median regression
(3) M-estimator
(4) MM-estimator
Joint consultation committee -0.000 (0.028)
0.008 (0.033)
-0.016 (0.024)
-0.022 (0.018)
Quality circle -0.004 0.006 0.004 0.002 (0.026) (0.029) (0.020) (0.017) Self-managed team 0.008 -0.004 0.009 -0.014 (0.026) (0.029) (0.021) (0.026) Board representation -0.001 -0.052 -0.038 -0.061 ** (0.048) (0.048) (0.032) (0.025) Job rotation -0.042 -0.019 -0.028 -0.041 * (0.045) (0.039) (0.026) (0.021) Suggestion scheme -0.039 0.014 0.008 0.013 (0.033) (0.033) (0.023) (0.035) Job satisfaction survey -0.078 -0.006 0.001 0.075 ** (0.048) (0.043) (0.028) (0.035) TQM -0.000 -0.030 -0.039 * -0.048 * (0.028) (0.030) (0.021) (0.029) Personnel fund 0.049 0.015 -0.040 -0.059 * (0.059) (0.061) (0.045) (0.033) Performance-based pay 0.029 0.055 0.052 ** 0.082 ** (0.031) (0.036) (0.023) (0.033) Stock option scheme 0.031 -0.048 0.035 -0.056 * (0.059) (0.080) (0.035) (0.033) Foreign majority ownership 0.019 0.017 -0.006 -0.011 (0.036) (0.039) (0.026) (0.038) Family firm 0.012 0.015 0.051 * 0.029 (0.037) (0.044) (0.031) (0.030) Computer use 0.009 0.033 0.067 * 0.045 (0.054) (0.047) (0.036) (0.034) Ln(firm age) -0.014 -0.006 -0.006 -0.008 (0.018) (0.020) (0.013) (0.017) Very hard product market competition -0.027 0.013 0.006 0.019 (0.024) (0.028) (0.020) (0.027) N 334 334 334 334 R2 0.11 - 0.14 - Notes: In Table 5 the dependent variable is average total factor productivity avTFP=the time-average of residual for each firm obtained by the fixed effects model using the balanced panel data over the period of 2002-2005 in the first step (not reported). The first-step model includes also a constant term, year dummies, and two-digit manufacturing industry dummies interacted with the year dummies. Standard errors in parentheses: in columns (1)-(2) bootstrapped standard errors with 500 replications, in column (3) using the pseudovalues approach (default in Stata), and in column (4) robust standard errors. ***/**/* reports significance at 1/5/10% level. All models include a constant term, 10 region dummies, two-digit manufacturing industry dummies, and survey noise controls (a respondent’s position is a firm, gender, the day of the week the interview was conducted, the duration of the interview, and three interview dummies (interview fixed effects)).
24
Table 5. Labor productivity: The fixed effects panel data estimates. (1)
Fixed effects estimator (2) Fixed effects estimator
Ln(K/L)
0.072 ** (0.037)
0.068 * (0.037)
Ln(M/L)
0.713 *** (0.068)
0.718 *** (0.064)
Employee participation in decision-making index (EI7)
- -0.005 (0.010)
Financial participation index (FP3) - 0.035 * (0.020)
Joint consultation committee 0.002 (0.023)
-
Quality circle 0.002 - (0.028) Self-managed team 0.000 - (0.028) Board representation -0.026 - (0.038) Job rotation -0.063 ** - (0.031) Suggestion scheme -0.044 ** - (0.021) TQM 0.106 - (0.134) Personnel fund 0.023 - (0.072) Performance-based pay 0.056 ** - (0.024) Stock option scheme -0.018 - (0.033) N 1182 (341 firms) 1255 (366 firms) R2 (within) 0.76 0.75 Notes: In Table 6 the dependent variable is ln(Y/L). Bootstrapped standard errors with 500 replications in parentheses. The model also includes a constant term, and two-digit manufacturing industry dummies interacted with the year dummies. All firms have at least two observations. EI7 is the summated rating index of seven employee participation practices and, respectively, FP3 is the summated rating index of employee financial participation practices used in column (1). The variables measure overall firm HRM activity over time (separately for employee participation in decision making and financial participation).
25
References
Addison, J.T. and Belfield, C.R. (2001). ‘Updating the Determinants of Firm Performance: Estimation using the 1998 Workplace Employee Relations Survey’. British Journal of Industrial Relations, 39 (3): 341-66. Aitken, B. and Harrison, A. (1999). ‘Do domestic firms benefit from direct foreign investment? Evidence from Venezuela’. American Economic Review, 89: 605-18. Aoki, M. (1990). ‘Toward an Economic Model of the Japanese Firm’. Journal of Economic Literature, 28 (1): 1-27. Bennedsen, M., Nielsen, K., Pérez-González, F. and Wolfenzon, D. (2007). ‘Inside the Family Firm: The Role of Families in Succession Decisions and Performance’. Quarterly Journal of Economics, 122 (2): 647-91. Ben-Ner, A. and Jones, D.C. (1995). ‘Employee Participation, Ownership and Productivity: A Theoretical Framework’. Industrial Relations, 34 (4): 532-55. Berle, A. and Means, G. (1932). The Modern Corporation and Private Property. New York: Macmillan. Bertrand, M. and Mullainathan, S. (2001). ‘Do People Mean What They Say? Implications for Subjective Survey Data’. American Economic Review Papers and Proceedings, 91 (2): 67–72. Black, S. and Lynch, L. (2001). ‘How to Compete: The Impact of Workplace Practices and Information Technology on Productivity’. Review of Economics and Statistics, 83 (3): 434-45. Black , S. and Lynch, L. and Krivelyova, A. (2004). ‘How Workers Fare When Employers Innovate’. Industrial Relations, 43 (1): 44-66. Black S. and Lynch, L. (2004). ‘What's Driving the New Economy? The Benefits of Workplace Innovation’. Economic Journal, 114: F97-116. Blasi, J. and Kruse, D. (2006). ‘U.S. High Performance Work Practice’s at Century’s End’. Industrial Relations, 45 (4): 547-78. Bloom, N. and van Reenen, J. (2007). ‘Measuring and Explaining Management Practices Across Firms and Countries’. Quarterly Journal of Economics, 4: 1351-1408. Blundell, R. and Bond, S. (2000). ‘GMM estimation with Persistent Panel Data: An Application to Production Functions’. Econometric Reviews, 19 (3): 321-40. Brynjolfsson, E. and Hitt, L. M. (1997). ‘Information Technology and Organizational Design’. MIT Sloan School Working Paper.

26
Brynjolfsson, E. and Hitt, L. M. (2000). ‘Beyond Computation: Information Technology, Organizational Transformation and Business Performance’. Journal of Economic Perspectives, 14 (4): 23-48. Bryson, A. and Freeman, R. (2010). ‘How Does Shared Capitalism Affect Economic Performance in the United Kingdom?’ In D.L. Kruse, R.B. Freeman and J.R. Blasi (eds.), Shared Capitalism at Work: Employee Ownership, Profit and Gain Sharing, and Broad-based Stock Options. University of Chicago Press and NBER, pp. 201-24. Cable, J. and Wilson, N. (1989). ‘Profit-Sharing and Productivity: An Analysis of UK Engineering Firms’. Economic Journal, 99: 366-75. Cappelli, P. and Neumark, D. (2001). ‘Do ”High-Performance” Work Practices Improve Establishment-Level Outcomes?’ Industrial & Labor Relations Review 54, (4): 737-75. Chi, W., Freeman, R. B. and Kleiner, M. (2007). ‘Adoption and Termination of Employee Involvement Programs’. NBER Working Paper 12878. Conyon, M. J. and Freeman, R. B. (2004). ‘Shared Modes of Compensation and Firm Performance: U.K. Evidence’. In D. Card, R. Blundell and R. B. Freeman (eds.), Seeking a Premier Economy: The Economic Effects of British Economic Reforms, 1980-2000. Chicago and London: University of Chicago Press, pp. 109-46. Criscuolo, C. and Martin, R. (2009). ‘Multinationals and U.S. productivity leadership: Evidence from Great Britain’. Review of Economics and Statistics, 91 (2): 263-81. Dessein, W. and Santos, T. (2006). ‘Adaptive Organizations’. Journal of Political Economy, 114: 956-95. EK (2006). ’Tulospalkkaus yksityisellä sektorilla: EK:n palkkausjärjestelmätiedustelu 2005’. Helsinki: The Confederation of Finnish Industries CFI (in Finnish). Eriksson, T. (2003). ‘The Effects of New Work Practices - Evidence from Employer-Employee Data.’ In T. Kato and J. Pliskin (eds.), Advances in the Economic Analysis of Participatory and Labor-Managed Firms, Volume 7. Amsterdam: Elsevier/JAI, pp. 3-30. Freeman, R. and Rogers, J. (1999). What Workers Want. Ithaca, NY. Cornell University Press. Freeman, R. and Kleiner, M. (2000). ‘Who Benefits from Employee Involvement: Firms or Workers?’ American Economic Review Papers and Proceedings, 90 (2): 219-23. Griffith, R. (1999). ‘Using the ARD Establishment-level Data to Look at Foreign Ownership and Productivity in the United Kingdom’. Economic Journal, 109: F416-F442. Guest, D.E., Michie, J., Conway, N. and Sheehan, M. (2003). ‘Human Resource Management and Corporate Performance in the UK’. British Journal of Industrial Relations, 41 (2): 291-314.

27
Huselid, M. (1995). ‘The Impact of Human Resource Management Practices on Turnover, Productivity, and Corporate Financial Performance’. Academy of Management Journal, 38 (3): 635-72. Ichniowski, C., Shaw, K. and Prennushi, G. (1997). ‘The Effects of Human Resource Management on Productivity’. American Economic Review, 87 (3): 291-313. Jones, D. C., Kalmi, P. and Mäkinen, M. (2006). ‘The Determinants of Stock Option Compensation: Evidence from Finland’. Industrial Relations, 45 (3): 437-68. Jones, D. C., Kalmi, P., Kato, T. and Mäkinen, M. (2010a). ‘Financial Participation in Finland: Incidence and Determinants’. Forthcoming in a special issue of International Journal of Human Resource Management. Jones, D. C., Kalmi, P. and Mäkinen, M. (2010b). ’The Productivity Effects of Stock Option Schemes: Evidence from Finnish Panel Data’. Journal of Productivity Analysis, 33 (1): 67-80. Jones, D. C., Kalmi, P. and Kauhanen, A. (2010c). ’Teams, Performance-Related Pay, Profit-Sharing and Productive Efficiency: Evidence from a Food-Processing Plant’. Industrial & Labor Relations Review, 63 (4): 606-26. Jones, D. C. and Kato, T. (1995). ‘The Productivity Effects of Employee Stock-Ownership Plans and Bonuses: Evidence from Japanese Panel Data’. American Economic Review, 85: 391-414. Jones, D. C. and Pliskin, J. (1991). ‘The Effects of Worker Participation, Employee Ownership and Profit Sharing on Economics Performance’. In R. Russell and V. Rus (eds.), International Handbook of Participation in Organizations, Vol. 2, Oxford University Press. Kalmi, P. and Kauhanen, A. (2008). ‘Workplace Innovations and Employee Outcomes: Evidence from Finland’. Industrial Relations, 47 (3): 430-59. Kalmi, P. and Sweins, C. (2010). ‘The Performance Impact of Financial Participation: Subjective and Objective Measures Compared’. In T. Eriksson (ed.), Advances in the Economic Analysis of Participatory and Labor-Managed Firms, Volume 11. Emerald (forthcoming). Kato, T. (2006). Determinants of the Extent of Participatory Employment Practices: Evidence from Japan. Industrial Relations, 45 (4): 579-605. Kato, T., Lee, J. H. and Ryu, J-S. (2010). ‘The Productivity Effects of Profit Sharing, Employee Ownership, Stock Option, and Team Incentives: Evidence from Korean Panel Data.’ In T. Eriksson (ed.), Advances in the Economic Analysis of Participatory and Labor-Managed Firms, Volume 11. Emerald (forthcoming). Kato, T. and Morishima, M. (2002). ‘The Productivity Effects of Participatory Employment Practices: Evidence from New Panel Data’. Industrial Relations, 41 (4): 487-520.

28
Kaufman, B. E. (2010). ‘SHRM Theory in the Post-Huselid Era: Why It Is Fundamentally Misspecified’. Industrial Relations, 49 (2): 286-313. Knez, M. and Simester, D. (2001). ‘Firm-Wide Incentives and Mutual Monitoring at Continental Airlines’. Journal of Labor Economics, 19 (4): 743-72. Kruse, D. L. (1992). ‘Profit Sharing and Productivity: Microeconomic Evidence from the United States’. Economic Journal, 102: 24-36. Kruse, D. L. (2002). ‘Research Evidence on the Prevalence and Effects of Employee Share Ownership’. Journal of Employee Ownership Law and Finance, 14 (4): 65-90. Kruse, D., Blasi, J. and Park, R. (2010). ‘Shared Capitalism in the U.S. Economy: Prevalence, Characteristics, and Employee Views on Financial Participation in the Enterprises’. In D.L. Kruse, R.B. Freeman and J.R. Blasi (eds.), Shared Capitalism at Work: Employee Ownership, Profit and Gain Sharing, and Broad-based Stock Options. University of Chicago Press and NBER, pp. 41-75. Kumbhakar, S. C., and Dunbar, A. (1993). ‘The Elusive ESOP-Productivity Link’. Journal of Public Economics, 52: 273-83. Maronna, R. A. and Yohai V. J. (2000). ‘Robust regression with both continuous and categorical predictors’. Journal of Statistical Planning and Inference, 89: 197-214. Milgrom, P. and Roberts, J. (1995). ‘Complementarities and Fit: Strategy, Structure, and Organizational Change in Manufacturing’. Journal of Accounting and Economics, 19 (2-3): 179-208. Mäkinen, M. and Kalmi, P. (2006). ‘Henkilöstöjohtaminen, henkilöstön osallistuminen ja organisaatiomuutokset teollisuusyrityksissä: aineistokuvaus puhelinkyselyn tuloksista’. (Title in English: HRM, employee participation and organizational changes in Finnish manufacturing companies: preliminary results from a phone survey). ETLA Discussion Paper 1027 (in Finnish). Mäkinen, M. (2010). ‘Employee Stock Option Schemes and Firm Performance: Stochastic Production Frontier Evidence from Finland’. In T. Eriksson (ed.), Advances in the Economic Analysis of Participatory and Labor-Managed Firms, Volume 11. Emerald (forthcoming). Nickell, S. J. (1996). ‘Competition and Corporate Performance’. Journal of Political Economy, 104 (4): 724-46. Olley, S. and Pakes, A. (1996). ‘The Dynamics of Productivity in the Telecommunication Industry’. Econometrica, 64 (6): 1263-97. Pendleton, A. and Robinson, A. (2010). ‘Employee Stock Ownership, Involvement, and Productivity: an Interaction-Based Approach’. Industrial & Labor Relations Review, 64(1), article 1. Perez-Gonzalez, F. (2006). ‘Inherited Control and Firm Performance’. American Economic Review, 96 (5): 1559-88.
29
Perotin, V. and Robinson, A. (2003). ‘Employee participation in profit and ownership: a review of the issues and evidence’. European Parliament Working Paper No. SOCI109EN, Social Affairs Series, Directorate General for Research. Robinson, A.M. and Wilson, N. (2006). ‘Employee Financial Participation and Productivity: An Empirical Reappraisal’. British Journal of Industrial Relations, 44 (1): 31–50. Rousseeuw, P. J. and Leroy, A. M. (2003). Robust Regression and Outlier Detection. New York: Wiley. Sesil, J. C., Kroumova, M. A., Blasi, J. R., and Kruse, D. L. (2002). ‘Broad-Based Employee Options in “New Economy” Firms: Company Performance Effects’. British Journal of Industrial Relations, 40: 273-95. Sweins, C, Kalmi, P. and Hulkko-Nyman, K. (2009). ‘Personnel Knowledge of the Pay System, Pay Satisfaction and Pay Effectiveness: Evidence from Finnish Personnel Funds’. International Journal of Human Resource Management, 20 (2): 457-77. Uusitalo, R. and Vartiainen, J. (2008). ‘Finland: firm factors in wages and wage changes’. In E. P. Lazear and K. L. Shaw (eds.), The Structure of Wages: An International Comparison. Chicago and London: University of Chicago Press. Verardi, V. and Croux, C. (2009). ‘Robust regression in Stata’. Stata Journal, 9 (3): 439-53. Villalonga, B. and Amit, R. (2006). ‘How Do Family Ownership, Control and Management Affect Firm Value?’ Journal of Financial Economics, 80 (2): 385-417. Wadhwani, S. and Wall, M. (1990). ‘The Effects of Profit-Sharing on Employment, Wages, Stock Returns and Productivity: Evidence from UK Micro-Data’. Economic Journal, 100: 1-17. Weitzman, M.L. and Kruse, D.L. (1990). ‘Profit Sharing and Productivity’. In A. Blinder (ed.), Paying for Productivity. The Brookings Institution, Washington, pp. 94-141. Yohai, V. J. (1987). ‘High breakdown-point and high efficiency robust estimates for regression’. Annales of Statistics, 15, 642-56. Zwick, T. (2004). ‘Employee participation and productivity’. Labour Economics, 11: 715-40.

30
Endnotes
1 An important issue is how accurate are survey respondents’ answers on HRM practices. For one thing, as Bloom and van Reenen (2007) remark, a range of background characteristics that are potentially correlated with bad and good HRM practices may generate systematic bias in the survey data. Second, a respondent’s answer might be biased towards those answers the respondent believes are correct or more generally expected (e.g. Bertrand and Mullainathan 2001). In order to mitigate these concerns, we follow Bloom and van Reenen (2007) to control for possible interview biases (survey noise controls): on the interviewer (three interviewer dummies to remove possible interviewer fixed effects), on the respondent (gender and position within a firm), and on the interview process itself (the day of a week the interview was conducted and the duration of the interview). 2 Because of our budget constraint, our target number of participating firms was 400. Two interviews were interrupted during the survey because respondents noticed that they did not belong to the manufacturing firm population. 3 However, in recent studies a large part of differences in average productivity is attributable to differences between multinationals and non-multinationals rather than to “the origin of ownership of a country” (Criscuolo and Martin 2009). 4 Specifically we use TOL 2002 categories 15-37 based on the SIC/NACE 2002 classification. 5 After ending each survey we asked the interviewers to immediately assess how reliable they viewed the responses. Based on their subjective assessments, about 99% of the responses can be categorized as reliable. 6 Our measure of performance-based pay is a broader concept than profit sharing as it is usually understood. In the HRM survey, a performance-based pay scheme question was defined as follows: "... by performance-based pay schemes we mean a financial reward system, where a part of person's wage is tied to performance, either on the level of company, subsidiary, plant or other group. I will later ask on possible personnel funds and share or stock option schemes, since they are not defied here as performance-based pay schemes." The question that followed right away after this definition was simply: "Do you have performance-based pay schemes, other than personnel fund, share or stock option scheme, in your firm at the moment? [yes/no/cannot say]". We do not make a distinction between managerial and workers performance-based pay schemes, since over 70% of schemes in the sample cover all employees. 7 Personnel funds are a form of deferred profit-sharing, where profit-shares are further invested either to the stock of the sponsoring firm or divested in the financial market. If a company sponsors a personnel fund, all employees belong to it during their entire employment contract. Further analysis on personnel funds can be found in Sweins et al. (2009). 8 A more detailed analysis of the determinants of the financial participation in Finland can be found in Jones et al. (2010a). 9 Note that since our computer use variable measures the share of employees using computers almost daily in their work, this variable captures the outcomes of past and present ICT investments in a firm, and is thus a more comprehensive measure than an ICT investment that captures only current ICT investment activities. 10 Because the system GMM estimator á la Blundell and Bond (2000) performed unsatisfactorily with our data, we decided to apply only the fixed-effects estimator in the first step. Therefore, we cannot address the potential simultaneity concerns in the paper, especially related to the endogeneity of capital and labor. 11 Based on Rousseeuw and Leroy (2003), we can recognize three types of outliers that affect the OLS estimator: vertical outliers, good leverage points, and bad leverage points. Vertical outliers are defined as those observations that have outlying values in the y dimension (error term) but not in the x dimension (explanatory variables). The existence of vertical outliers especially affects the estimated intercept. Good leverage points are those observations that have outlying values in the x dimension but are located near to the regression line. The presence of bad leverage points deflates standard errors affecting statistical inference. Bad leverage points are outlying observations in the both the y and the x dimensions, and affect notably both the intercept and the slope. Based on our graphical outlier detection analysis (not reported), we find that our data include all three classes of outlying observations. The second issue that might generate bias is the fact that the dependent variable in the second step (avTFP) can be subject to measurement errors. One reasons for this is that measurement errors may arise when noisy firm panel data are used in the first step to calculate avTFPs, since avTFPs are the time-average of residuals and these averages are sensitive to large outliers (especially if the time-period is short). Another channel that may generate measurement errors in avTFPs is directly related to the fixed effects estimator in the two-step approach; the fixed effects estimates are inconsistent. And, as it is well-known, the measurement error in the dependent variable contributes to standard errors in the explanatory variables (the estimated standard errors are less precise) in a straightforward regression analysis under classical assumptions. 12 Initial values of the MM-estimator are obtained from the MS-estimator suggested by Maronna and Yohai (2000). See Verardi and Croux (2009) for a more detailed description of robust regression methods in Stata. 13 Cappelli and Neumark (2001) and Black and Lynch (2004) also report similar negative associations between HRMPs and performance in their fixed effect estimates.