Embed Size (px)
Citation preview

HRET Improvement Leader Fellowship
WHA Guidance Call Travis Dollak and Thomas Kaster
WHA Quality Coordinators
1

Webinar Agenda
• Future Fellowship Events• How to Catch Up if you Missed Chicago • Overall WHA-ILF Guidance and Strategy• HRET and CMS Harm Across the Board
Description • Harm Across the Board template demo and
rewards• Upcoming deadlines and events
2

Future HRET Fellowship Events
• San Diego – July 24 and 25–As soon as we know
• Chicago, September 30 and October 1
3

How to Catch Up if you Missed Chicago • To be receive a funded slot for the San Diego
ILF we are asking you to complete the IHI Open School Wave 1 Modules– You will need to register on HRET’s / IHI site
• Click Here to Enroll – http://app.ihi.org/lms/home.aspx?CatalogGUID=5b5c79b8-f019-442c-a199-de2041cdfbf
5
4

Overall WHA-ILF Guidance and Strategy
• HRET-IHI Open School Valued at over $7000• The more you give the more you get
– Not required to do anything
• WHA wants to capitalize on your achievements– Webinars, Q&A’s and Storyboards
• HRET and WHA provide you a audience to share your great work at a National and Federal level
5
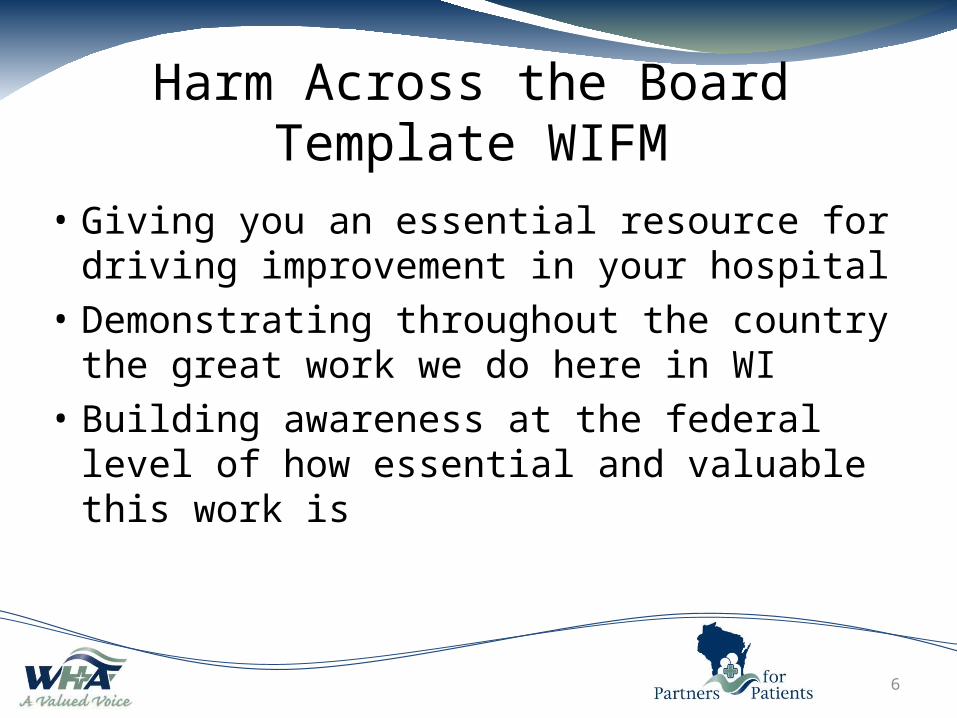
Harm Across the Board Template WIFM
• Giving you an essential resource for driving improvement in your hospital
• Demonstrating throughout the country the great work we do here in WI
• Building awareness at the federal level of how essential and valuable this work is
6

Harm Across the Board Template Description
• Provides a framework that changes the discussion from numbers and rates into how people are literally harmed in facilities
• Brings the reality that people are harmed to the forefront
• Helps people change the way they think about common errors ---no harm is acceptable
• Template will be sent via email and on the WHA Quality Center
7

Improving Harm Across the Board
Title Slide (1 of 15)

TEMPLATE GUIDE
• Treat harms as events that can be summed• Focus on harms (outcomes) rather then
preventive measures (process)• Special conditions can be considered a harm
(e.g., EED, Readmits, …)• Produce an overall harm trend for the hospital
(**Delete this slide when content of presentation is complete)
(2 of 15)

2012 Breakthrough in Reducing HARM: 250 to 50 harms/1,000 discharges
10
(3 of 15)
WHA has created a template for all 4 graphs in this template

Cut “harm across the board” in half: 60 patients per quarter to under 30
11
(4 of 15)
WHA has created a template for all 4 graphs in this template
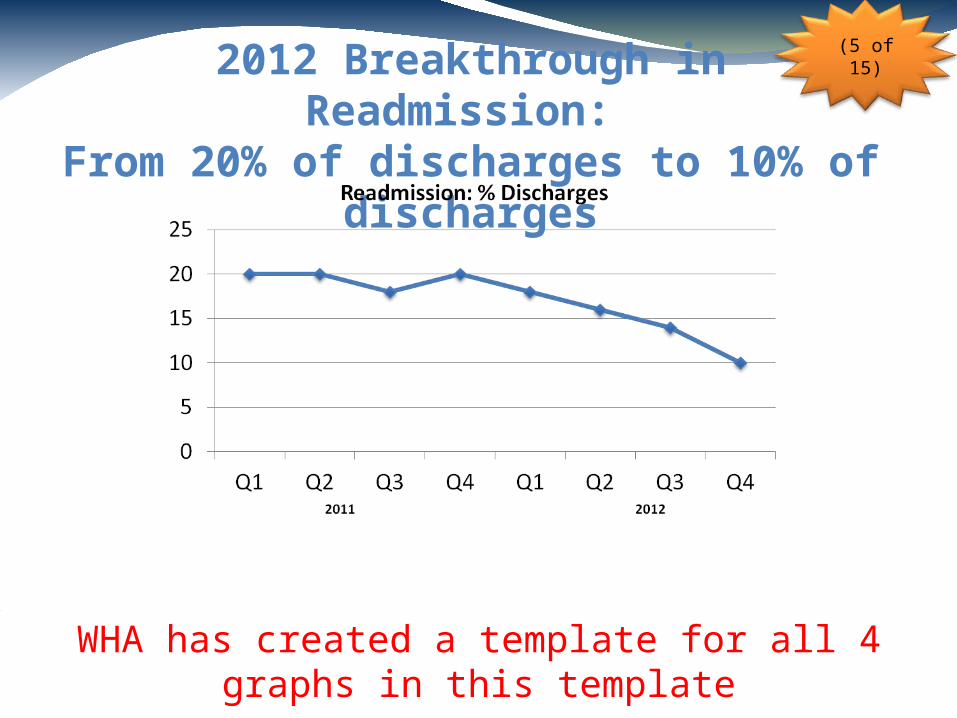
2012 Breakthrough in Readmission: From 20% of discharges to 10% of discharges
12
(5 of 15)
WHA has created a template for all 4 graphs in this template

2012 Breakthrough in Reducing Readmissions:
From 20 per quarter to 10 per quarter
13
(6 of 15)
WHA has created a template for all 4 graphs in this template

Pearls
• Please list the drivers of safety that produced these results.
• Include one about patient and family engagement, if relevant
(7 of 15)
The Most Important Slide

(8 of 15)
Defining Moment(s) In Our Journey• Name and date one or two defining moments.
• Moments that caused the organization to commit to extraordinary safety.
• Moments that resulted in a big breakthrough in the organization’s ability to deliver safety.
15

Strategies to Drive Results
• What challenges did you encounter that you were able to overcome to achieve the results you are presenting here?
• What were the strategies you used to overcome them?
(9 of 15)

Risk Profile by Areas of RiskHACs Estimated annual number of patients at risk in each area Number
ADE # of inpatients:
CAUTI # pts in IP units with catheter in place:
CLABSI # pts in IP units with central lines:
Falls # of discharges:
Ob AE # of women with deliveries:
Pr Ulcer # of discharges:
SSI # of applicable surgical pts:
VAP # of patients on a ventilator:
VTE # of inpatients:
EED # of women with elective deliveries
TOTAL Risk opportunities for harm across the board
Readmit # of inpatients at risk of readmit:
(10 of 15)

EXAMPLEHACs Estimated annual number of patients at risk in each area
ADE 4587 of inpatients:
CAUTI 1268 pts in IP units with catheter in place:
CLABSI 668 pts in IP units with central lines:
Falls 4587 of discharges:
Ob AE 747 of women with deliveries:
Pr Ulcer 4587 of discharges:
SSI 5502 of applicable surgical pts:
VAP 183 of patients on a ventilator:
VTE 4587 of inpatients:
EED 283 of women with elective deliveries
Readmit 4587 of inpatients at risk of readmit:
TOTAL 31,586 Risk opportunities for harm across the board

Improving Harms by HAC• Scale: number of hospital-acquired conditions
(HACs) at each level– IDEAL: level represents what we see as best possible– At Target: level represents meeting improvement
target– Progress: level not yet at target– Opportunity: level represents an improvement
opportunity(**Delete this slide when content of presentation
is complete)
(11 of 15)

Improving HAC Rates (12 of 15)
Use the baseline data that is available to youWHA can also help with Target Rates
HACs Baseline[time period]
Target40% Reduction OR
Current[time period]
Improvement Status (scale)
ADE <7% Insulin, <5% INR, 100% Med Rec
CAUTI .48 per 1000 catheter days
CLABSI .48 per 1000 central line days
Falls 2.15 per 1000 days OR.5 (with injury) per 1000 days
Ob AE .1208 per 100 births
Pr Ulcer 3.21 per 1000 discharges
SSI .504 per 100
VAP .66 per 1000 ventilator days
VTE .556 per 1000 discharges
EED <2%
Readmit 20% reduction
WHA can help fill this page if you send your draft slides
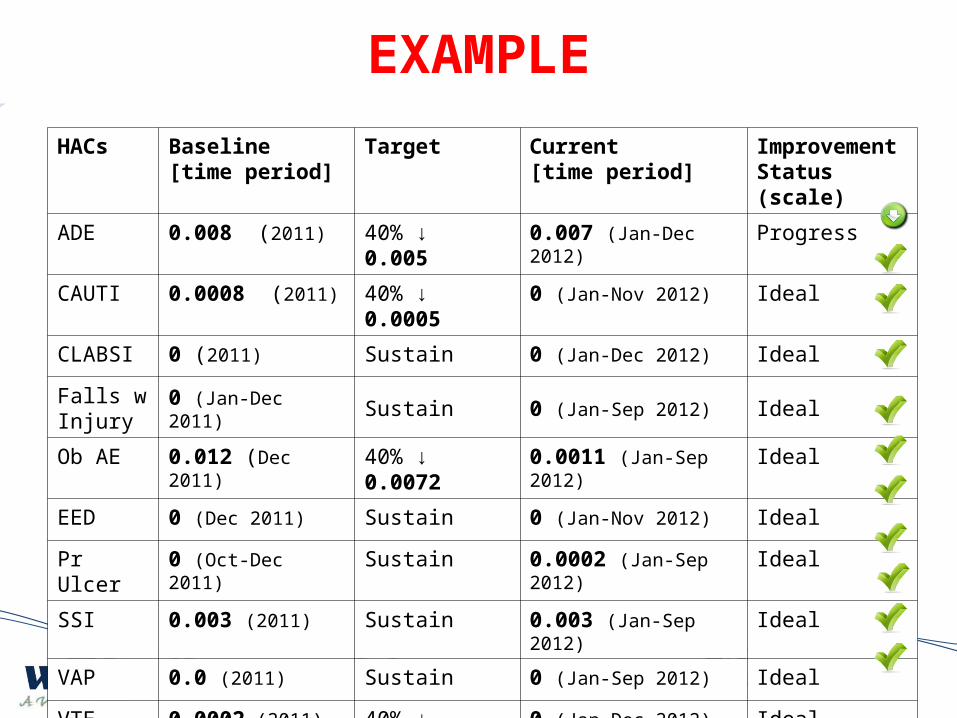
HACs Baseline[time period]
Target Current[time period]
Improvement Status (scale)
ADE 0.008 (2011) 40% ↓ 0.005 0.007 (Jan-Dec 2012) Progress
CAUTI 0.0008 (2011) 40% ↓ 0.0005 0 (Jan-Nov 2012) Ideal
CLABSI 0 (2011) Sustain 0 (Jan-Dec 2012) Ideal
Falls w Injury
0 (Jan-Dec 2011) Sustain 0 (Jan-Sep 2012) Ideal
Ob AE 0.012 (Dec 2011) 40% ↓ 0.0072 0.0011 (Jan-Sep 2012) Ideal
EED 0 (Dec 2011) Sustain 0 (Jan-Nov 2012) Ideal
Pr Ulcer 0 (Oct-Dec 2011) Sustain 0.0002 (Jan-Sep 2012) Ideal
SSI 0.003 (2011) Sustain 0.003 (Jan-Sep 2012) Ideal
VAP 0.0 (2011) Sustain 0 (Jan-Sep 2012) Ideal
VTE 0.0002 (2011) 40% ↓ 0.0011 0 (Jan-Dec 2012) Ideal
Readmit 0.066 (2011) Sustain 0.068 (Jan-Sep 2012) Ideal
EXAMPLE

Our Hospital Risk Profile & Result
Annual Volume (Discharges)
Total risk: annual harm opportunities
Risks per patients (Total Opportunities)/Discharges)
Number of PfP Harm Areas Applicable (0 – 11)
Number of PfP Harm Areas Applicable & Adopted
Number of PfP Areas at Improvement Target
Number of PfP Areas at IDEAL
(13 of 15)

EXAMPLEAnnual Volume (Discharges) 4587
Total risk: annual harm opportunities 31,586
Risks per patients (Total Opportunities)/Discharges)
6.9
Number of PfP Harm Areas Applicable (0 – 11) 11
Number of PfP Harm Areas Applicable & Adopted
11
Number of PfP Areas at Improvement Target 1
Number of PfP Areas at IDEAL 10

Future Actions to Reduce Harm
• What other actions will you take to reduce harm in the future?
(14 of 15)

Photo of Hospital CEO &Safety Team
(15 of 15)

Future Details• Draft Templates Due to WHA by April 29th
• Weekly HATB Development and Coaching Calls• Please send to WHA • Final Templates Due June 3rd
– Top 3 from Wisconsin to be on storyboards in San Diego (93 total)
– Top 3 in San Diego to receive certificates and discuss progress with Don Berwick
26