Embed Size (px)
Citation preview

randstad greece
hr trends and salary report 2019

attracting
talent.
2© Randstad
content
introduction 3
attracting talent 5
human capital strategy 8
recruiting practices 15
talent retention 19
about the research 23
salary report 26
3© Randstad
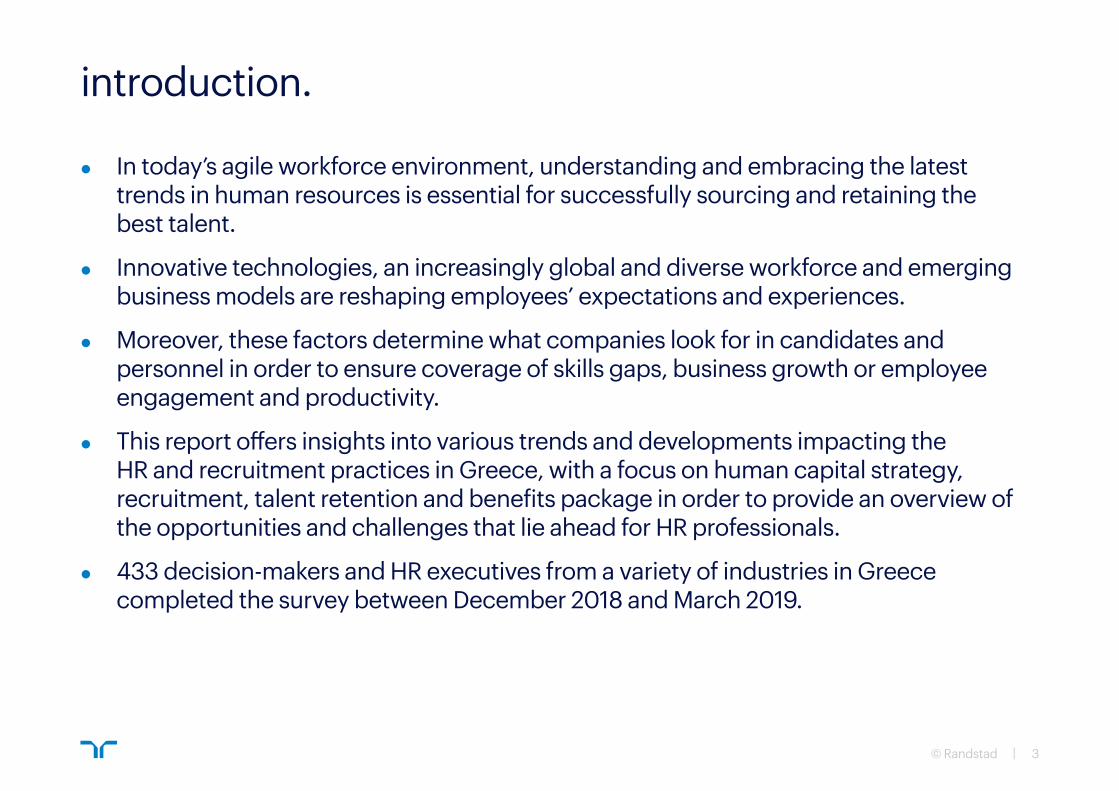
introduction.
z In today’s agile workforce environment, understanding and embracing the latest trends in human resources is essential for successfully sourcing and retaining the best talent.
z Innovative technologies, an increasingly global and diverse workforce and emerging business models are reshaping employees’ expectations and experiences.
z Moreover, these factors determine what companies look for in candidates and personnel in order to ensure coverage of skills gaps, business growth or employee engagement and productivity.
z This report offers insights into various trends and developments impacting the HR and recruitment practices in Greece, with a focus on human capital strategy, recruitment, talent retention and benefits package in order to provide an overview of the opportunities and challenges that lie ahead for HR professionals.
z 433 decision-makers and HR executives from a variety of industries in Greece completed the survey between December 2018 and March 2019.
4© Randstad
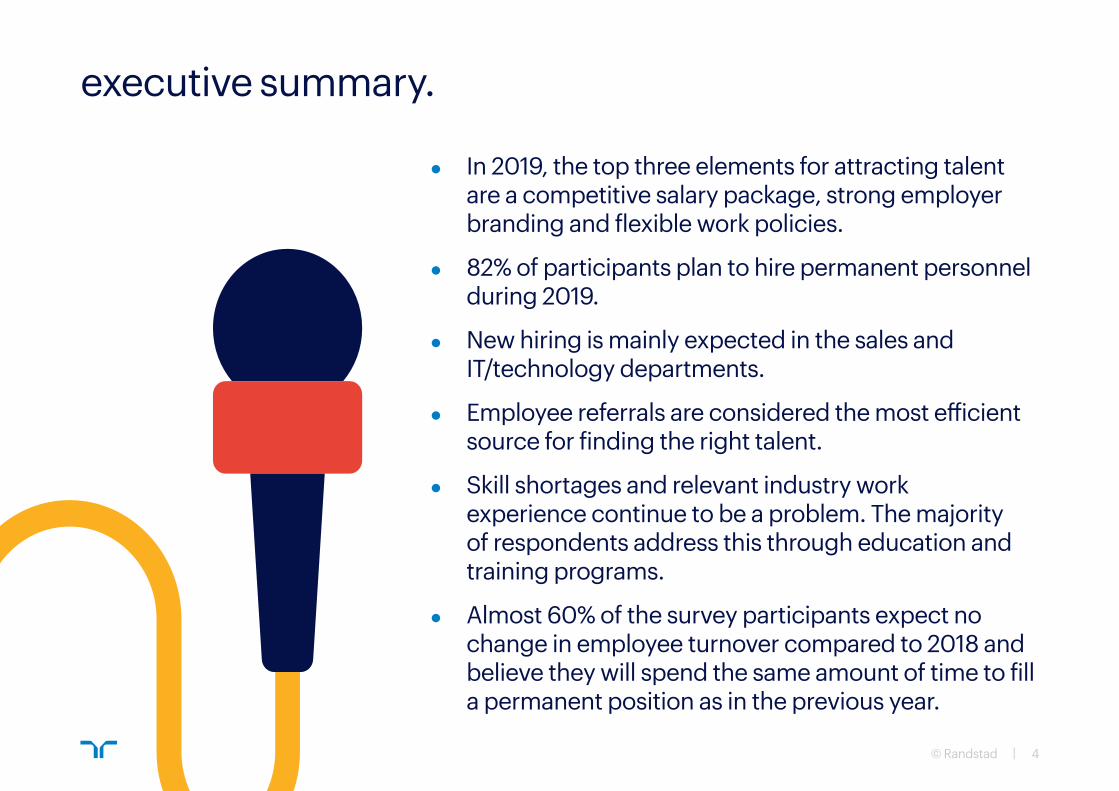
executive summary.
z In 2019, the top three elements for attracting talent are a competitive salary package, strong employer branding and flexible work policies.
z 82% of participants plan to hire permanent personnel during 2019.
z New hiring is mainly expected in the sales and IT/technology departments.
z Employee referrals are considered the most efficient source for finding the right talent.
z Skill shortages and relevant industry work experience continue to be a problem. The majority of respondents address this through education and training programs.
z Almost 60% of the survey participants expect no change in employee turnover compared to 2018 and believe they will spend the same amount of time to fill a permanent position as in the previous year.

attracting
talent.
attracting
talent.
5© Randstad 5© Randstad
6© Randstad
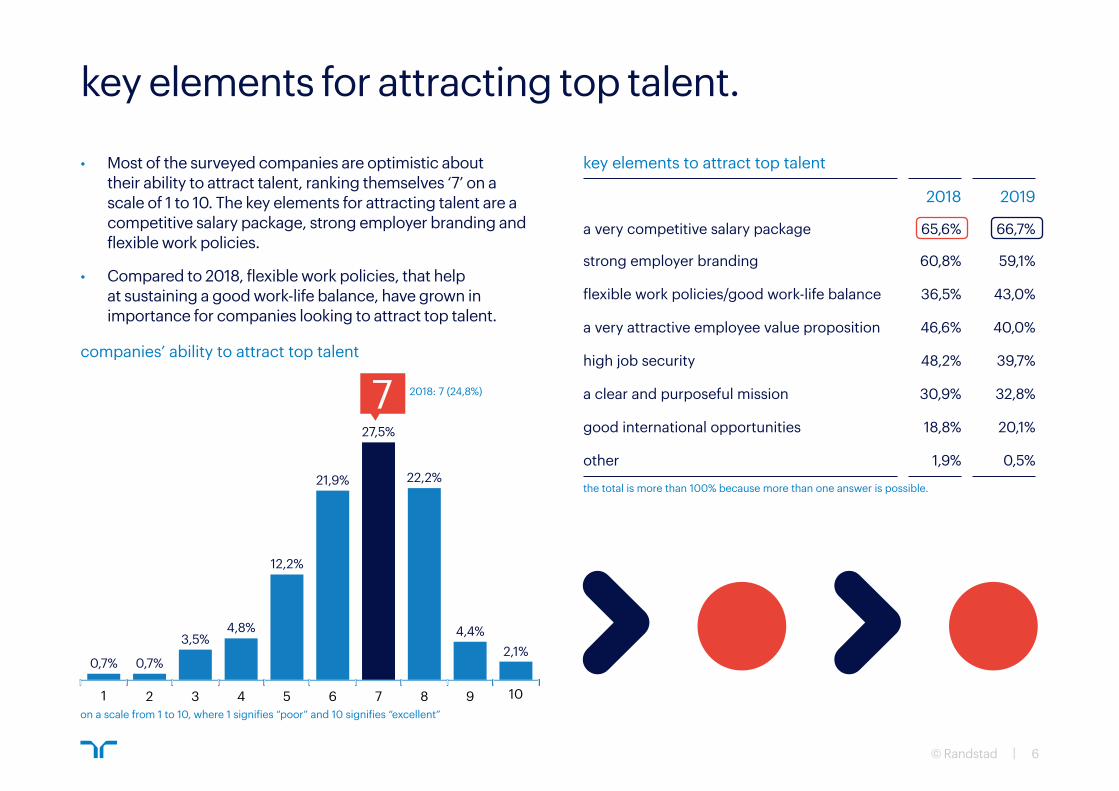
key elements for attracting top talent.
2018 2019
a very competitive salary package 65,6% 66,7%
strong employer branding 60,8% 59,1%
flexible work policies/good work-life balance 36,5% 43,0%
a very attractive employee value proposition 46,6% 40,0%
high job security 48,2% 39,7%
a clear and purposeful mission 30,9% 32,8%
good international opportunities 18,8% 20,1%
other 1,9% 0,5%
the total is more than 100% because more than one answer is possible.
companies’ ability to attract top talent
key elements to attract top talent• Most of the surveyed companies are optimistic about their ability to attract talent, ranking themselves ‘7’ on a scale of 1 to 10. The key elements for attracting talent are a competitive salary package, strong employer branding and flexible work policies.
• Compared to 2018, flexible work policies, that help at sustaining a good work-life balance, have grown in importance for companies looking to attract top talent.
0,7% 0,7%
3,5%4,8%
12,2%
21,9%
27,5%
22,2%
4,4%2,1%
on a scale from 1 to 10, where 1 signifies “poor” and 10 signifies “excellent”
7 2018: 7 (24,8%)
1 2 3 4 5 6 7 8 9 10
7© Randstad
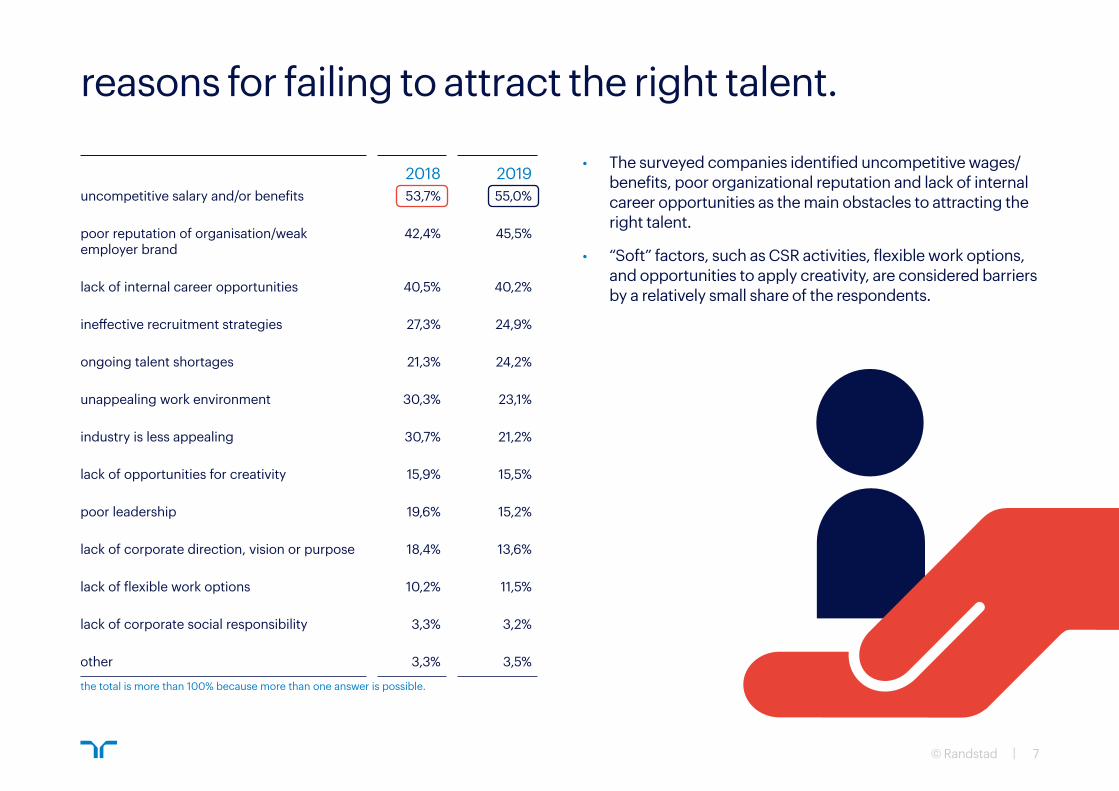
reasons for failing to attract the right talent.
2018 2019uncompetitive salary and/or benefits 53,7% 55,0%
poor reputation of organisation/weak employer brand
42,4% 45,5%
lack of internal career opportunities 40,5% 40,2%
ineffective recruitment strategies 27,3% 24,9%
ongoing talent shortages 21,3% 24,2%
unappealing work environment 30,3% 23,1%
industry is less appealing 30,7% 21,2%
lack of opportunities for creativity 15,9% 15,5%
poor leadership 19,6% 15,2%
lack of corporate direction, vision or purpose 18,4% 13,6%
lack of flexible work options 10,2% 11,5%
lack of corporate social responsibility 3,3% 3,2%
other 3,3% 3,5%
the total is more than 100% because more than one answer is possible.
• The surveyed companies identified uncompetitive wages/benefits, poor organizational reputation and lack of internal career opportunities as the main obstacles to attracting the right talent.
• “Soft” factors, such as CSR activities, flexible work options, and opportunities to apply creativity, are considered barriers by a relatively small share of the respondents.
attracting
talent.
human capital
strategy.
8© Randstad
9© Randstad
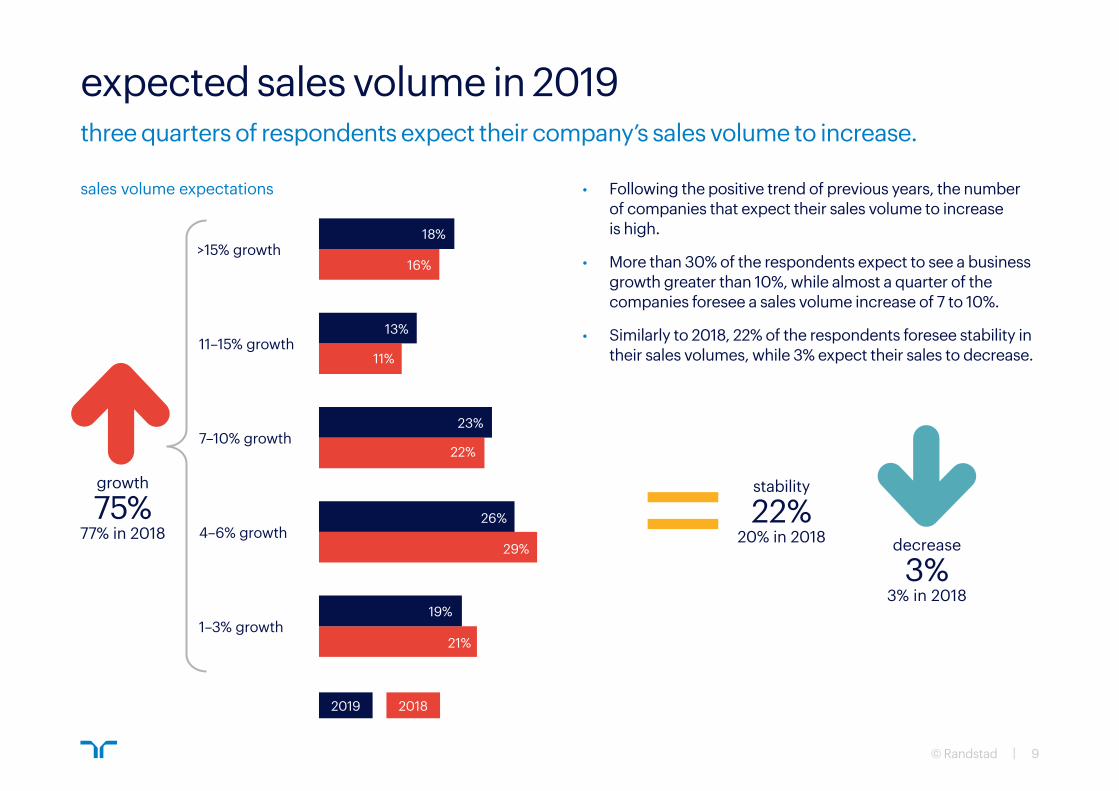
expected sales volume in 2019three quarters of respondents expect their company’s sales volume to increase.
growth
75%77% in 2018
stability
22%20% in 2018 decrease
3%3% in 2018
>15% growth
11–15% growth
7–10% growth
4–6% growth
1–3% growth
18%
16%
11%
23%
22%
26%
29%
19%
21%
13%
2019 2018
sales volume expectations • Following the positive trend of previous years, the number of companies that expect their sales volume to increase is high.
• More than 30% of the respondents expect to see a business growth greater than 10%, while almost a quarter of the companies foresee a sales volume increase of 7 to 10%.
• Similarly to 2018, 22% of the respondents foresee stability in their sales volumes, while 3% expect their sales to decrease.
10© Randstad
main hr challenges for participating companies.
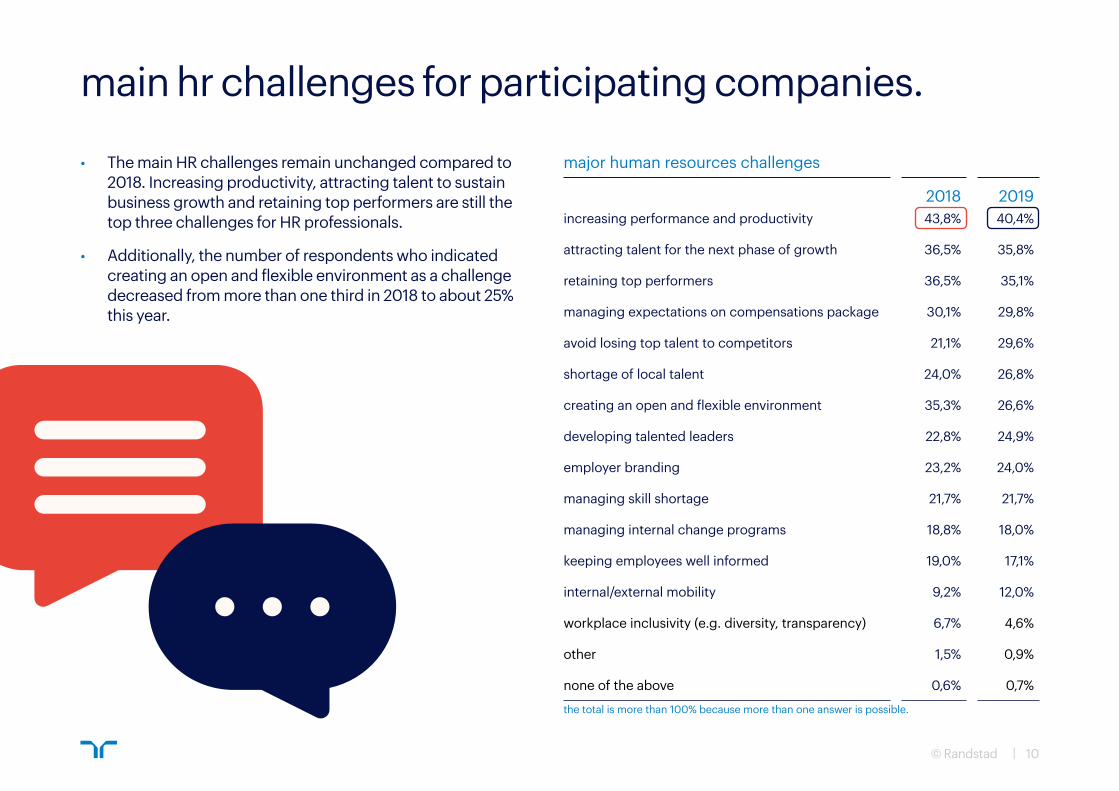
• The main HR challenges remain unchanged compared to 2018. Increasing productivity, attracting talent to sustain business growth and retaining top performers are still the top three challenges for HR professionals.
• Additionally, the number of respondents who indicated creating an open and flexible environment as a challenge decreased from more than one third in 2018 to about 25% this year.
2018 2019increasing performance and productivity 43,8% 40,4%
attracting talent for the next phase of growth 36,5% 35,8%
retaining top performers 36,5% 35,1%
managing expectations on compensations package 30,1% 29,8%
avoid losing top talent to competitors 21,1% 29,6%
shortage of local talent 24,0% 26,8%
creating an open and flexible environment 35,3% 26,6%
developing talented leaders 22,8% 24,9%
employer branding 23,2% 24,0%
managing skill shortage 21,7% 21,7%
managing internal change programs 18,8% 18,0%
keeping employees well informed 19,0% 17,1%
internal/external mobility 9,2% 12,0%
workplace inclusivity (e.g. diversity, transparency) 6,7% 4,6%
other 1,5% 0,9%
none of the above 0,6% 0,7%
major human resources challenges
the total is more than 100% because more than one answer is possible.
11© Randstad
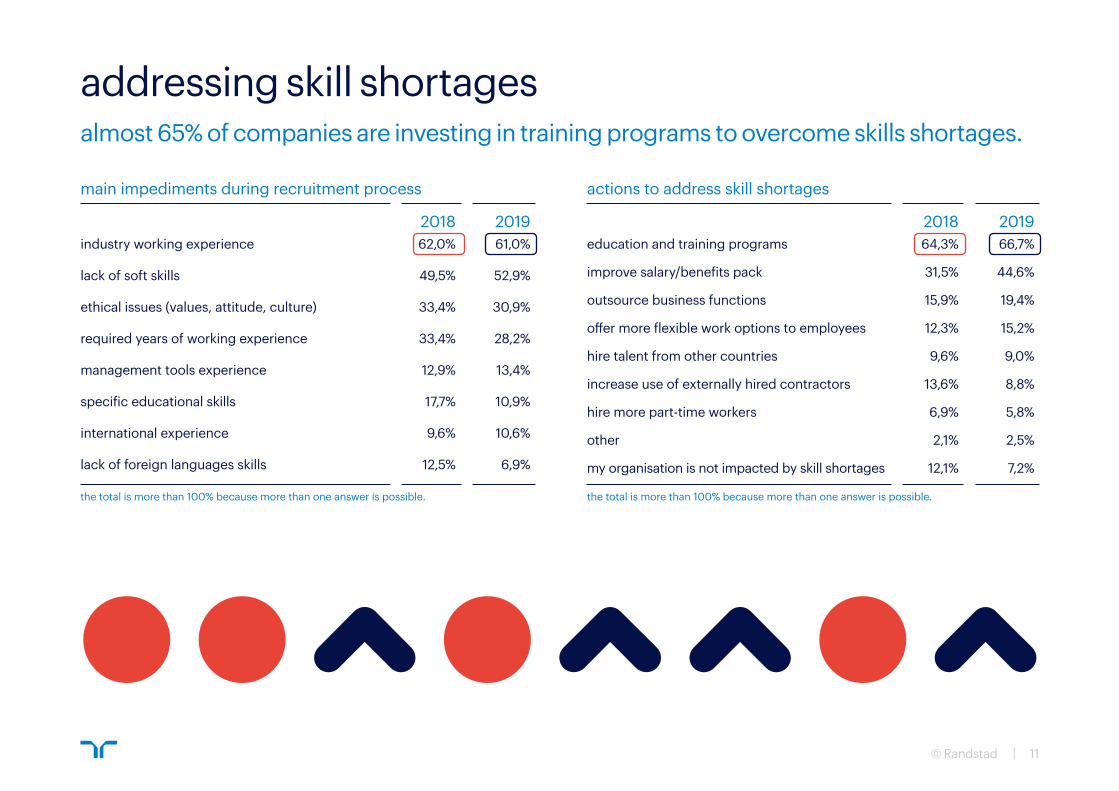
addressing skill shortagesalmost 65% of companies are investing in training programs to overcome skills shortages.
2018 2019industry working experience 62,0% 61,0%
lack of soft skills 49,5% 52,9%
ethical issues (values, attitude, culture) 33,4% 30,9%
required years of working experience 33,4% 28,2%
management tools experience 12,9% 13,4%
specific educational skills 17,7% 10,9%
international experience 9,6% 10,6%
lack of foreign languages skills 12,5% 6,9%
2018 2019education and training programs 64,3% 66,7%
improve salary/benefits pack 31,5% 44,6%
outsource business functions 15,9% 19,4%
offer more flexible work options to employees 12,3% 15,2%
hire talent from other countries 9,6% 9,0%
increase use of externally hired contractors 13,6% 8,8%
hire more part-time workers 6,9% 5,8%
other 2,1% 2,5%
my organisation is not impacted by skill shortages 12,1% 7,2%
the total is more than 100% because more than one answer is possible. the total is more than 100% because more than one answer is possible.
main impediments during recruitment process actions to address skill shortages
12© Randstad
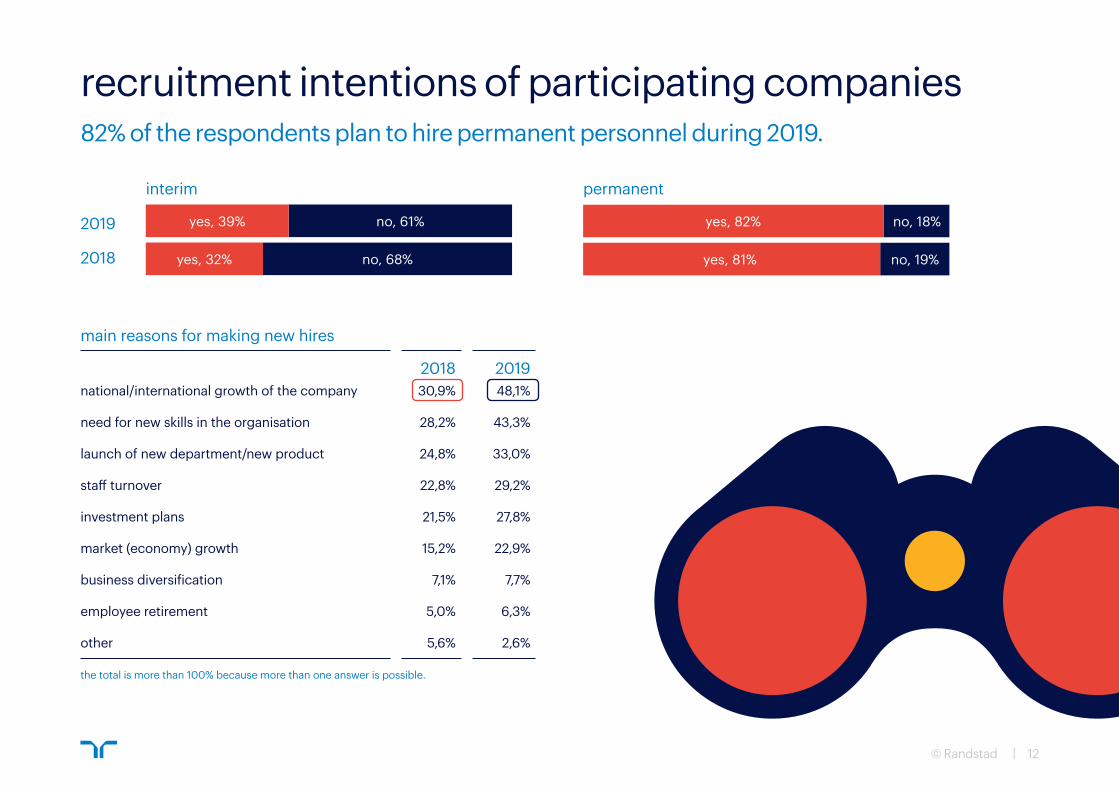
interim permanent
2019
2018
yes, 39% no, 61%
yes, 32% no, 68%
yes, 82% no, 18%
yes, 81% no, 19%
recruitment intentions of participating companies82% of the respondents plan to hire permanent personnel during 2019.
2018 2019national/international growth of the company 30,9% 48,1%
need for new skills in the organisation 28,2% 43,3%
launch of new department/new product 24,8% 33,0%
staff turnover 22,8% 29,2%
investment plans 21,5% 27,8%
market (economy) growth 15,2% 22,9%
business diversification 7,1% 7,7%
employee retirement 5,0% 6,3%
other 5,6% 2,6%
the total is more than 100% because more than one answer is possible.
main reasons for making new hires
13© Randstad
sales
marketing/communications
production
HR/training/ development
procurement
legal
IT/technology
accounting/finance
engineering
other
the total is more than 100% because more than one answer is possible.
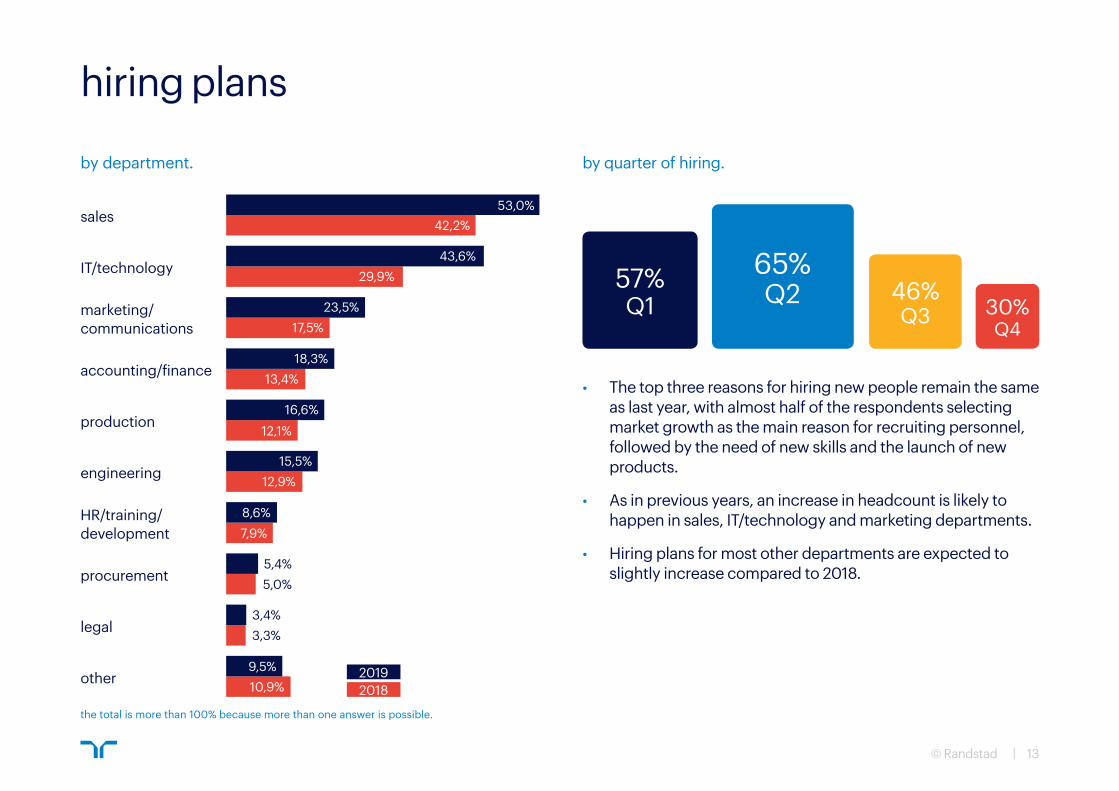
by department.
53,0%42,2%
43,6%29,9%
23,5%17,5%
18,3%13,4%
16,6%12,1%
15,5%12,9%
8,6%7,9%
9,5%10,9%
5,4%5,0%
3,4%3,3%
20192018
hiring plans
by quarter of hiring.
46%Q3 30%
Q4
57%Q1
65%Q2
• The top three reasons for hiring new people remain the same as last year, with almost half of the respondents selecting market growth as the main reason for recruiting personnel, followed by the need of new skills and the launch of new products.
• As in previous years, an increase in headcount is likely to happen in sales, IT/technology and marketing departments.
• Hiring plans for most other departments are expected to slightly increase compared to 2018.
14© Randstad
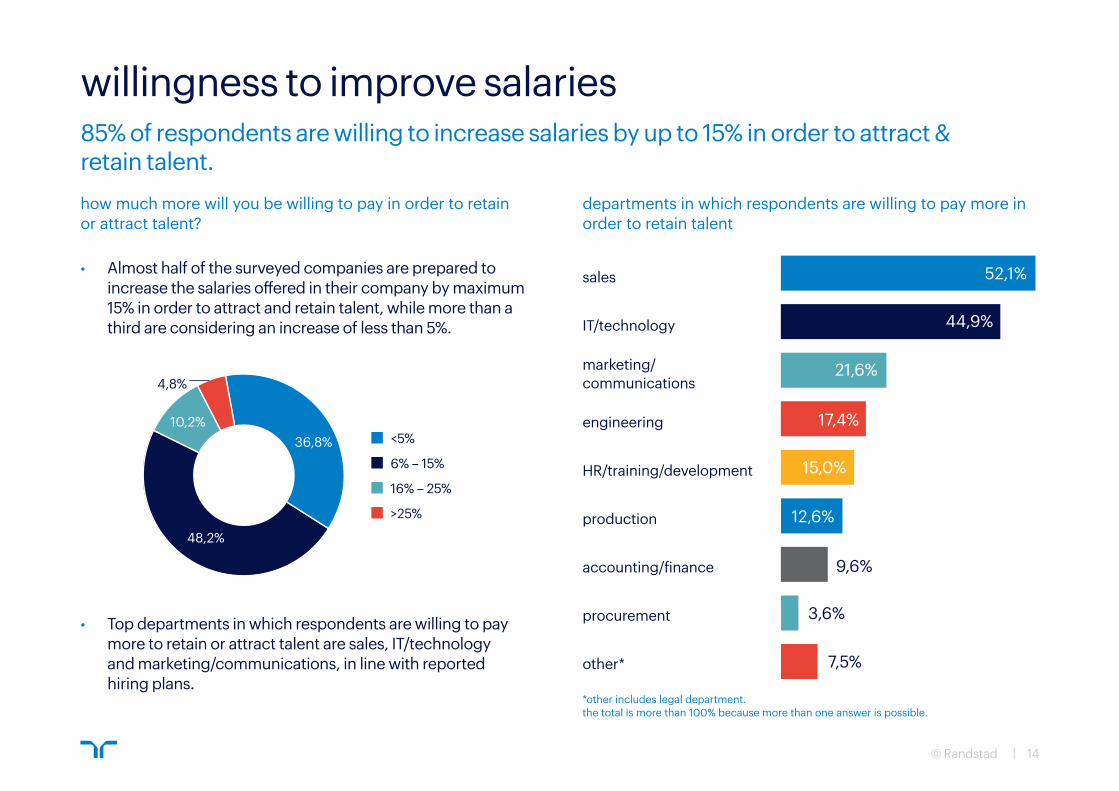
willingness to improve salaries85% of respondents are willing to increase salaries by up to 15% in order to attract & retain talent.
departments in which respondents are willing to pay more in order to retain talent
how much more will you be willing to pay in order to retain or attract talent?
*other includes legal department.the total is more than 100% because more than one answer is possible.
52,1%
44,9%
21,6%
17,4%
15,0%
9,6%
12,6%
3,6%
7,5%
36,8%
48,2%
10,2%
4,8%
<5%
6% – 15%
16% – 25%
>25%
• Almost half of the surveyed companies are prepared to increase the salaries offered in their company by maximum 15% in order to attract and retain talent, while more than a third are considering an increase of less than 5%.
• Top departments in which respondents are willing to pay more to retain or attract talent are sales, IT/technology and marketing/communications, in line with reported hiring plans.
sales
IT/technology
marketing/communications
engineering
HR/training/development
production
accounting/finance
procurement
other*
attracting
talent.practices.
recruiting
15© Randstad
16© Randstad
the total is more than 100% because more than one answer is possible.
ability to motivate and inspire others
ability to adapt to changing business demands
strong analytical and problem solving skills
ability to build trusted relationships
ability to innovate and drive creativity
vision for the future
60,5%
60,3%
49,9%
52,4%
49,7%
47,8%
44,8%
51,2%
39,3%
37,4%
39,9%
48,4%
2019 2018
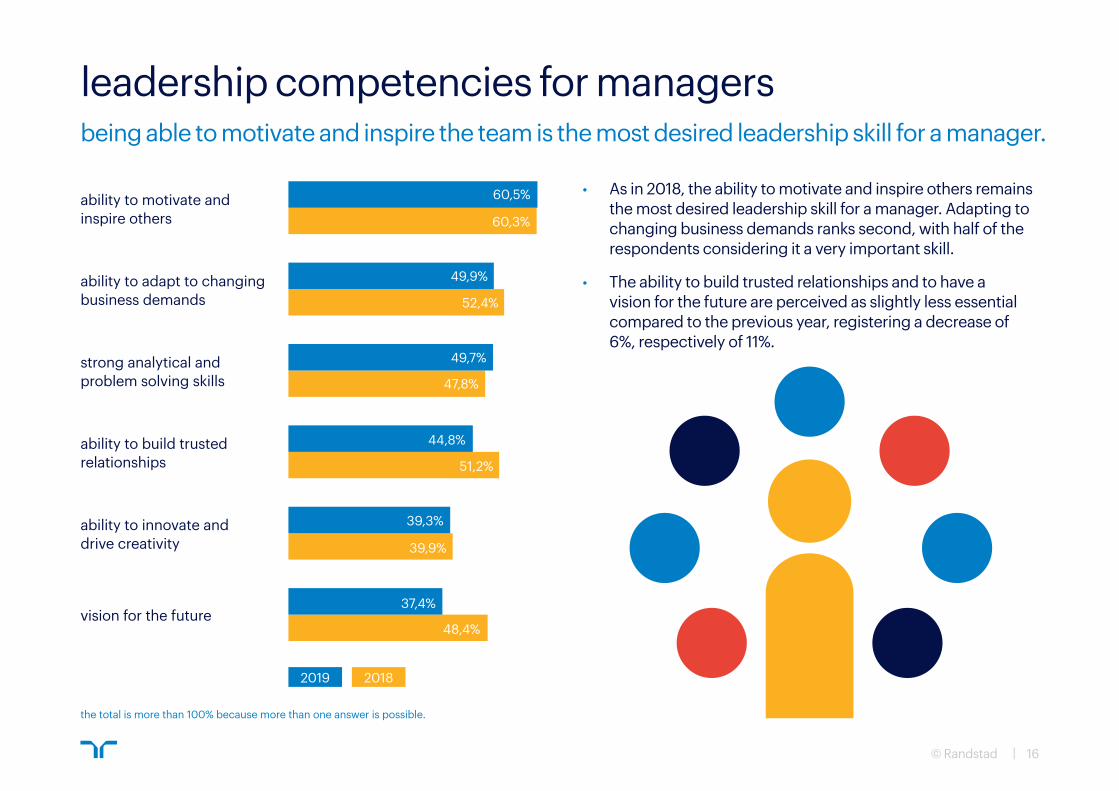
• As in 2018, the ability to motivate and inspire others remains the most desired leadership skill for a manager. Adapting to changing business demands ranks second, with half of the respondents considering it a very important skill.
• The ability to build trusted relationships and to have a vision for the future are perceived as slightly less essential compared to the previous year, registering a decrease of 6%, respectively of 11%.
leadership competencies for managersbeing able to motivate and inspire the team is the most desired leadership skill for a manager.
17© Randstad
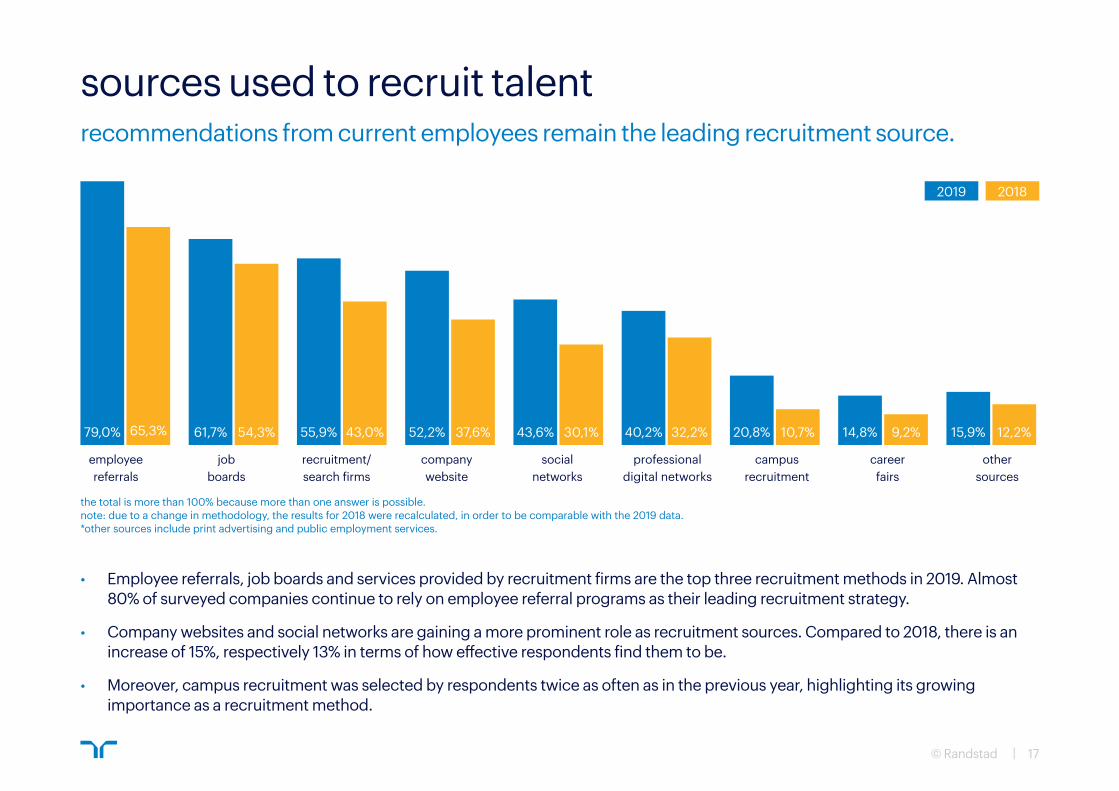
sources used to recruit talentrecommendations from current employees remain the leading recruitment source.
79,0% 65,3% 61,7% 54,3% 55,9% 43,0% 52,2% 37,6% 43,6% 30,1% 40,2% 32,2% 20,8% 10,7% 14,8% 9,2% 15,9% 12,2%
2019 2018
the total is more than 100% because more than one answer is possible.note: due to a change in methodology, the results for 2018 were recalculated, in order to be comparable with the 2019 data.*other sources include print advertising and public employment services.
job boards
employee referrals
recruitment/search firms
company website
social networks
professional digital networks
campus recruitment
career fairs
other sources
• Employee referrals, job boards and services provided by recruitment firms are the top three recruitment methods in 2019. Almost 80% of surveyed companies continue to rely on employee referral programs as their leading recruitment strategy.
• Company websites and social networks are gaining a more prominent role as recruitment sources. Compared to 2018, there is an increase of 15%, respectively 13% in terms of how effective respondents find them to be.
• Moreover, campus recruitment was selected by respondents twice as often as in the previous year, highlighting its growing importance as a recruitment method.
18© Randstad
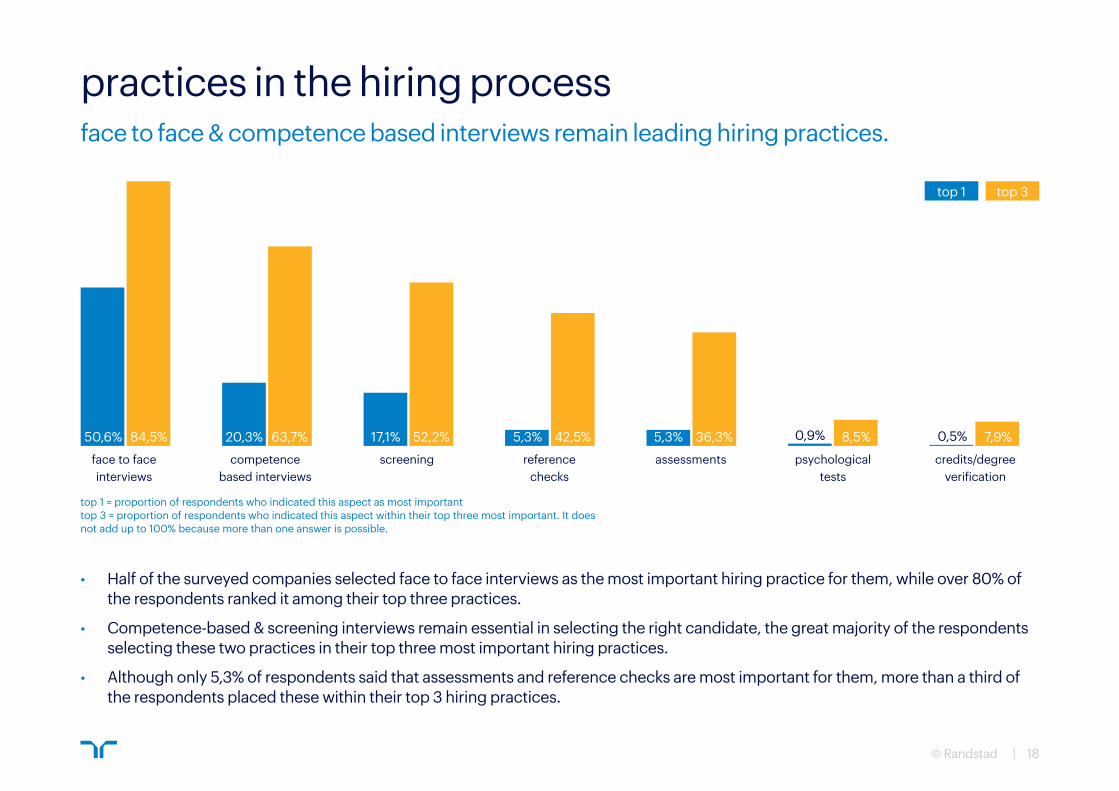
practices in the hiring processface to face & competence based interviews remain leading hiring practices.
50,6% 84,5% 20,3% 63,7% 17,1% 52,2% 5,3% 42,5% 5,3% 36,3% 0,9% 8,5% 0,5% 7,9%
top 1 top 3
competence based interviews
face to face interviews
screening reference checks
assessments psychological tests
credits/degree verification
• Half of the surveyed companies selected face to face interviews as the most important hiring practice for them, while over 80% of the respondents ranked it among their top three practices.
• Competence-based & screening interviews remain essential in selecting the right candidate, the great majority of the respondents selecting these two practices in their top three most important hiring practices.
• Although only 5,3% of respondents said that assessments and reference checks are most important for them, more than a third of the respondents placed these within their top 3 hiring practices.
top 1 = proportion of respondents who indicated this aspect as most importanttop 3 = proportion of respondents who indicated this aspect within their top three most important. It does not add up to 100% because more than one answer is possible.
attracting
talent.retention.
talent
19© Randstad
20© Randstad
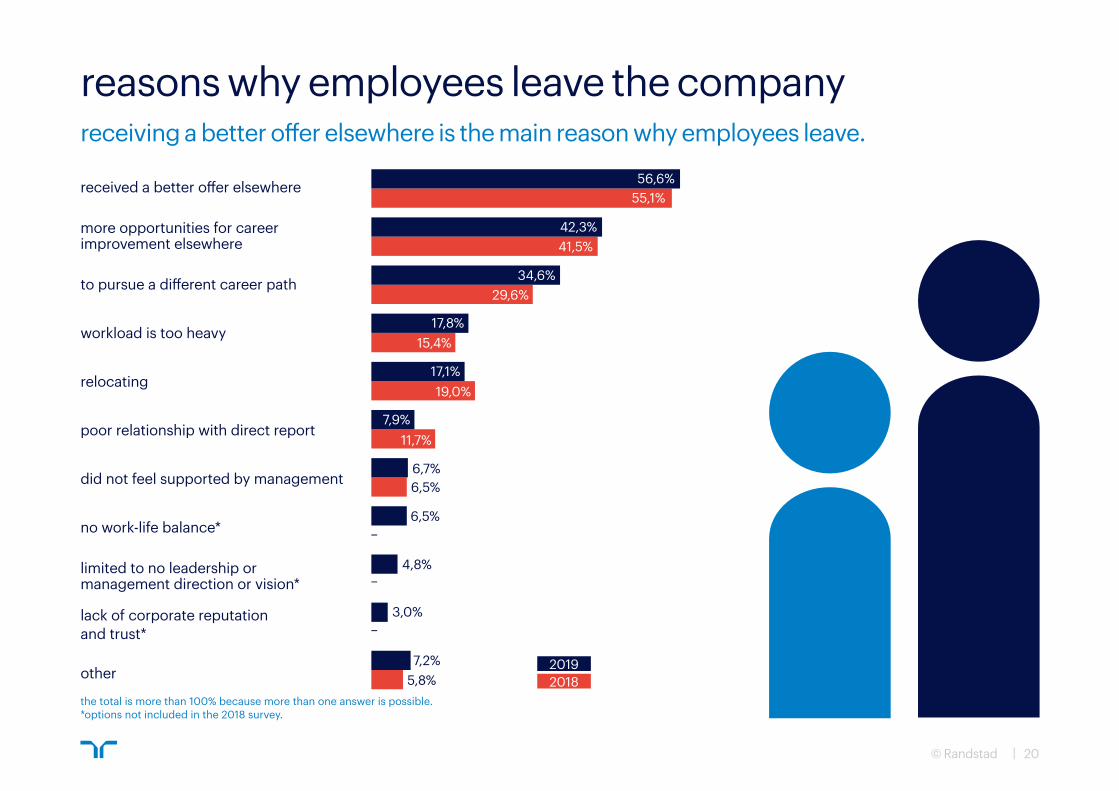
received a better offer elsewhere
to pursue a different career path
relocating
did not feel supported by management
no work-life balance*
limited to no leadership or management direction or vision*
more opportunities for career improvement elsewhere
workload is too heavy
poor relationship with direct report
lack of corporate reputation and trust*
other
the total is more than 100% because more than one answer is possible.*options not included in the 2018 survey.
56,6%55,1%
42,3%41,5%
34,6%29,6%
17,8%15,4%
17,1%19,0%
7,9%11,7%
7,2%5,8%
4,8%
6,5%
6,5%6,7%
3,0%
20192018
reasons why employees leave the companyreceiving a better offer elsewhere is the main reason why employees leave.
21© Randstad
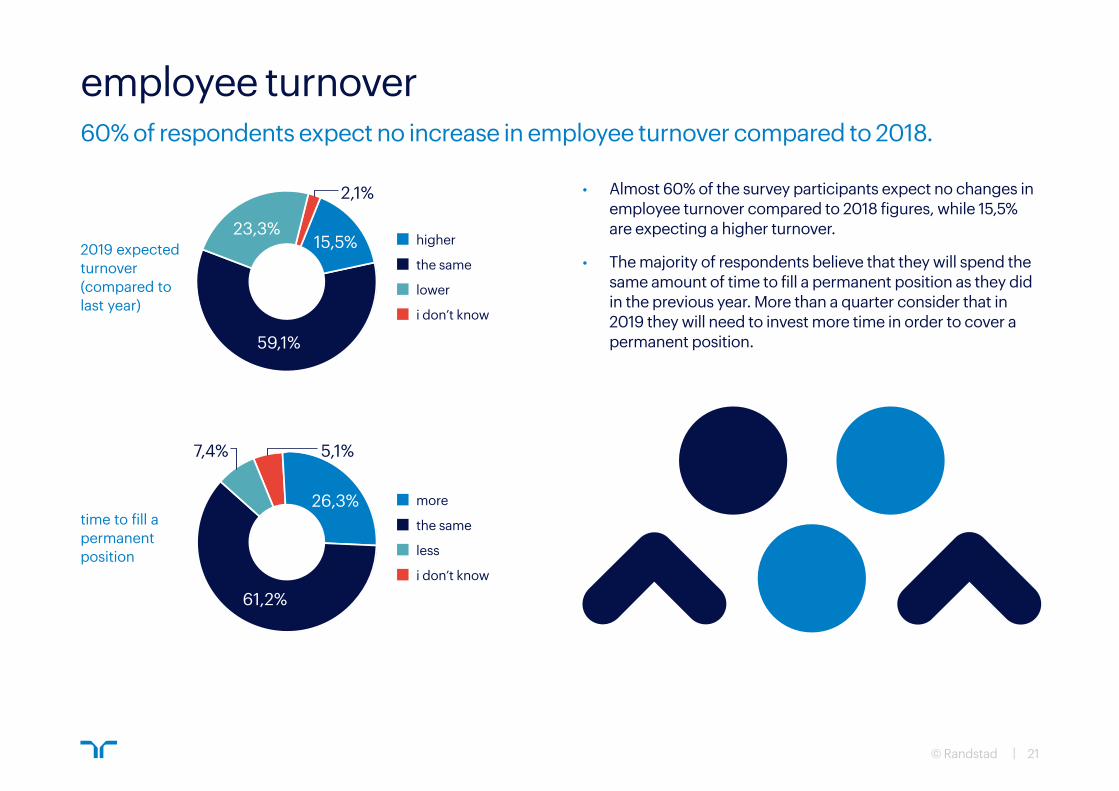
2019 expected turnover (compared to last year)
time to fill a permanent position
employee turnover60% of respondents expect no increase in employee turnover compared to 2018.
• Almost 60% of the survey participants expect no changes in employee turnover compared to 2018 figures, while 15,5% are expecting a higher turnover.
• The majority of respondents believe that they will spend the same amount of time to fill a permanent position as they did in the previous year. More than a quarter consider that in 2019 they will need to invest more time in order to cover a permanent position.
15,5%23,3%
2,1%
59,1%
26,3%
5,1%7,4%
61,2%
higher
the same
lower
i don’t know
more
the same
less
i don’t know
22© Randstad
42,5%
0,7% 0,9%
55,9%
11,8%
25,2%
5,3%
57,7%
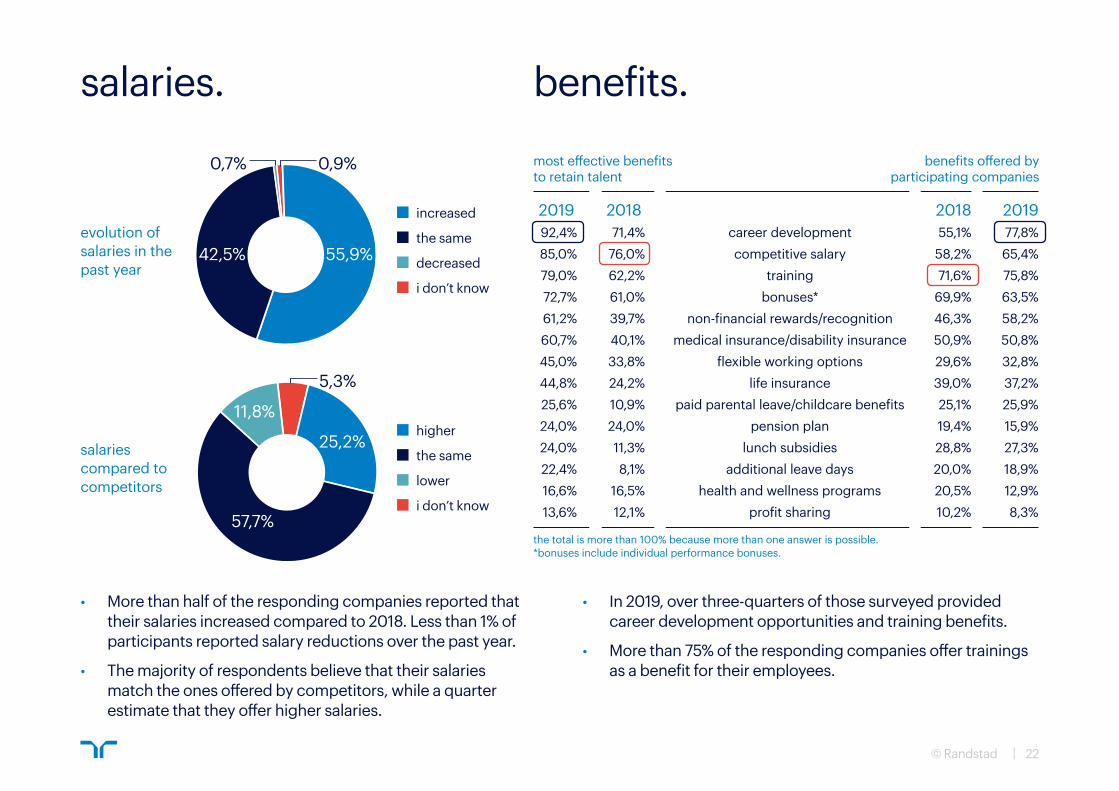
evolution of salaries in the past year
salaries compared to competitors
salaries. benefits.
2019 2018 2018 201992,4% 71,4% career development 55,1% 77,8%85,0% 76,0% competitive salary 58,2% 65,4%79,0% 62,2% training 71,6% 75,8%72,7% 61,0% bonuses* 69,9% 63,5%61,2% 39,7% non-financial rewards/recognition 46,3% 58,2%60,7% 40,1% medical insurance/disability insurance 50,9% 50,8%45,0% 33,8% flexible working options 29,6% 32,8%44,8% 24,2% life insurance 39,0% 37,2%25,6% 10,9% paid parental leave/childcare benefits 25,1% 25,9%24,0% 24,0% pension plan 19,4% 15,9%24,0% 11,3% lunch subsidies 28,8% 27,3%22,4% 8,1% additional leave days 20,0% 18,9%16,6% 16,5% health and wellness programs 20,5% 12,9%13,6% 12,1% profit sharing 10,2% 8,3%
the total is more than 100% because more than one answer is possible.*bonuses include individual performance bonuses.
most effective benefits to retain talent
benefits offered by participating companies
• More than half of the responding companies reported that their salaries increased compared to 2018. Less than 1% of participants reported salary reductions over the past year.
• The majority of respondents believe that their salaries match the ones offered by competitors, while a quarter estimate that they offer higher salaries.
• In 2019, over three-quarters of those surveyed provided career development opportunities and training benefits.
• More than 75% of the responding companies offer trainings as a benefit for their employees.
increased
the same
decreased
i don’t know
higher
the same
lower
i don’t know

attracting
23© Randstad
the research.
about
24© Randstad
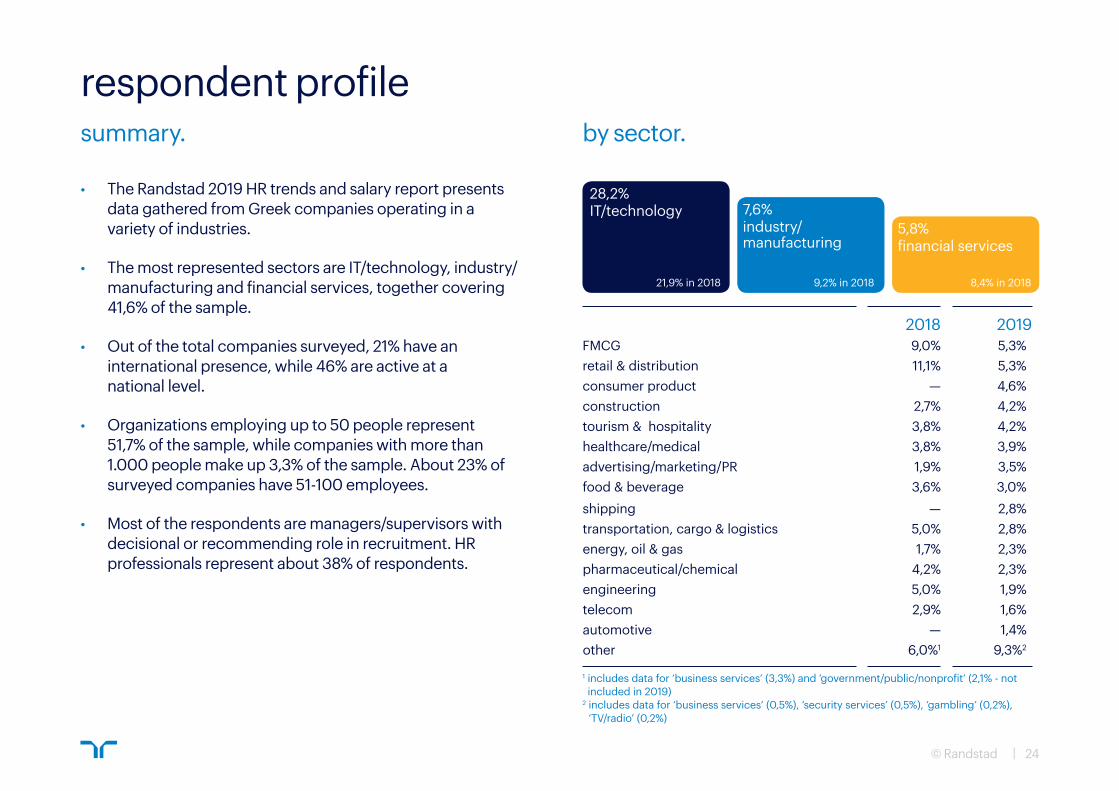
• The Randstad 2019 HR trends and salary report presents data gathered from Greek companies operating in a variety of industries.
• The most represented sectors are IT/technology, industry/manufacturing and financial services, together covering 41,6% of the sample.
• Out of the total companies surveyed, 21% have an international presence, while 46% are active at a national level.
• Organizations employing up to 50 people represent 51,7% of the sample, while companies with more than 1.000 people make up 3,3% of the sample. About 23% of surveyed companies have 51-100 employees.
• Most of the respondents are managers/supervisors with decisional or recommending role in recruitment. HR professionals represent about 38% of respondents.
respondent profilesummary.
by sector.
2018 2019FMCG 9,0% 5,3%retail & distribution 11,1% 5,3%consumer product — 4,6%construction 2,7% 4,2%tourism & hospitality 3,8% 4,2%healthcare/medical 3,8% 3,9%advertising/marketing/PR 1,9% 3,5%food & beverage 3,6% 3,0%shipping — 2,8%transportation, cargo & logistics 5,0% 2,8%energy, oil & gas 1,7% 2,3%pharmaceutical/chemical 4,2% 2,3%engineering 5,0% 1,9%telecom 2,9% 1,6%automotive — 1,4%other 6,0%1 9,3%2
1 includes data for ‘business services’ (3,3%) and ‘government/public/nonprofit’ (2,1% - not included in 2019)
2 includes data for ‘business services’ (0,5%), ‘security services’ (0,5%), ‘gambling’ (0,2%), ‘TV/radio’ (0,2%)
28,2% IT/technology
5,8%financial services
7,6%industry/manufacturing
21,9% in 2018 9,2% in 2018 8,4% in 2018
25© Randstad
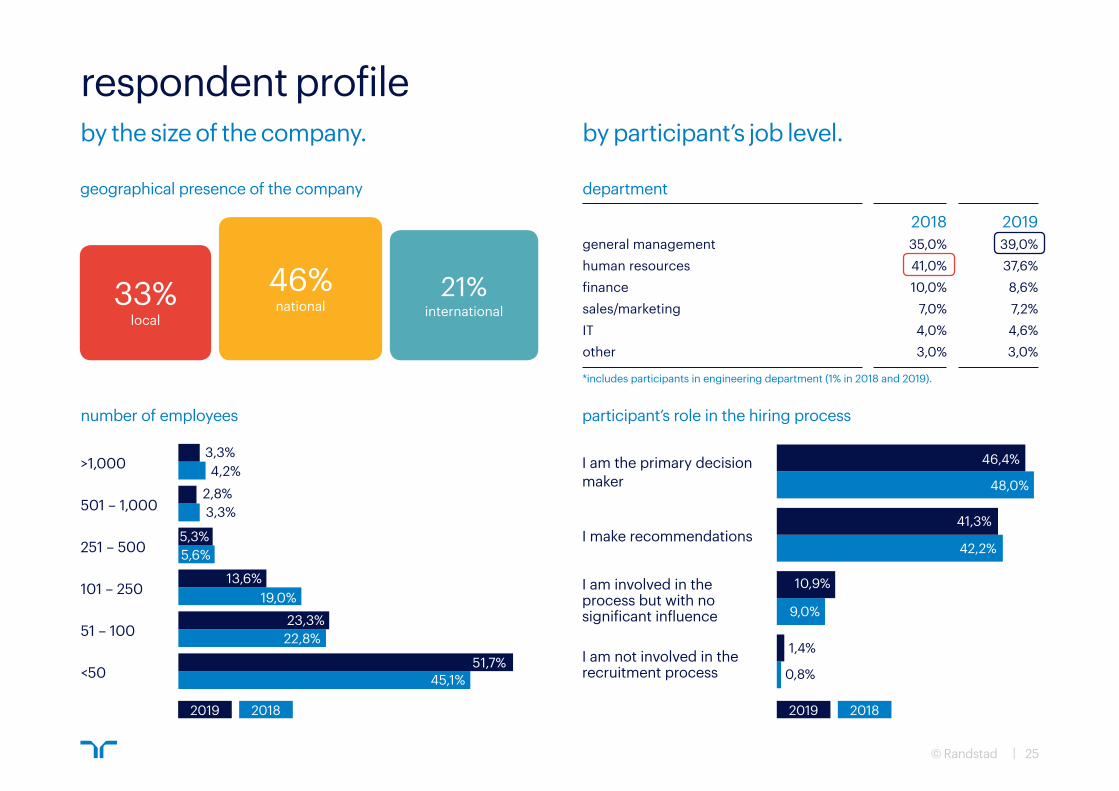
geographical presence of the company
number of employees participant’s role in the hiring process
33%local
46% national
21%international
2018 2019general management 35,0% 39,0%human resources 41,0% 37,6%finance 10,0% 8,6%sales/marketing 7,0% 7,2%IT 4,0% 4,6%other 3,0% 3,0%
department
3,3%4,2%
2,8%3,3%
5,3%5,6%
51,7%
22,8%23,3%
13,6%19,0%
45,1%
>1,000
501 – 1,000
1,4%
0,8%
10,9%
42,2%
41,3%
48,0%
46,4%
9,0%
I am the primary decision maker
I make recommendations
I am involved in the process but with no significant influence
I am not involved in the recruitment process
251 – 500
101 – 250
51 – 100
<50
2019 2018 2019 2018
respondent profileby the size of the company.
by participant’s job level.
*includes participants in engineering department (1% in 2018 and 2019).
attracting
26© Randstad
report.
salary
27© Randstad
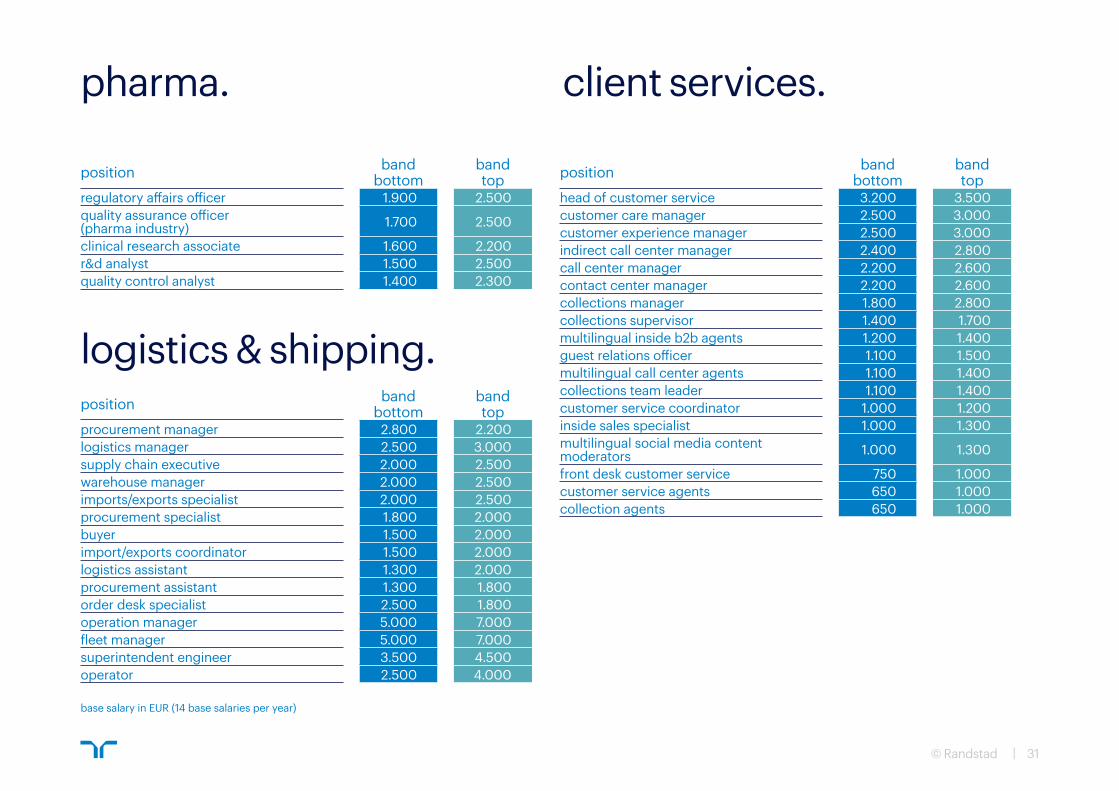
z The following slides present the band bottom and band top salaries for different job positions.
z The main positions listed are in the sales & marketing, business support, insurance, HR, pharma, legal, finance & accounting, technology, engineering, logistics and client services sectors.
z Similarly to the previous years, the highest salaries are paid in the finance & accounting and technology sectors while the lowest-paid positions are in the in business support and insurance sectors.
salary report highlights
28© Randstad
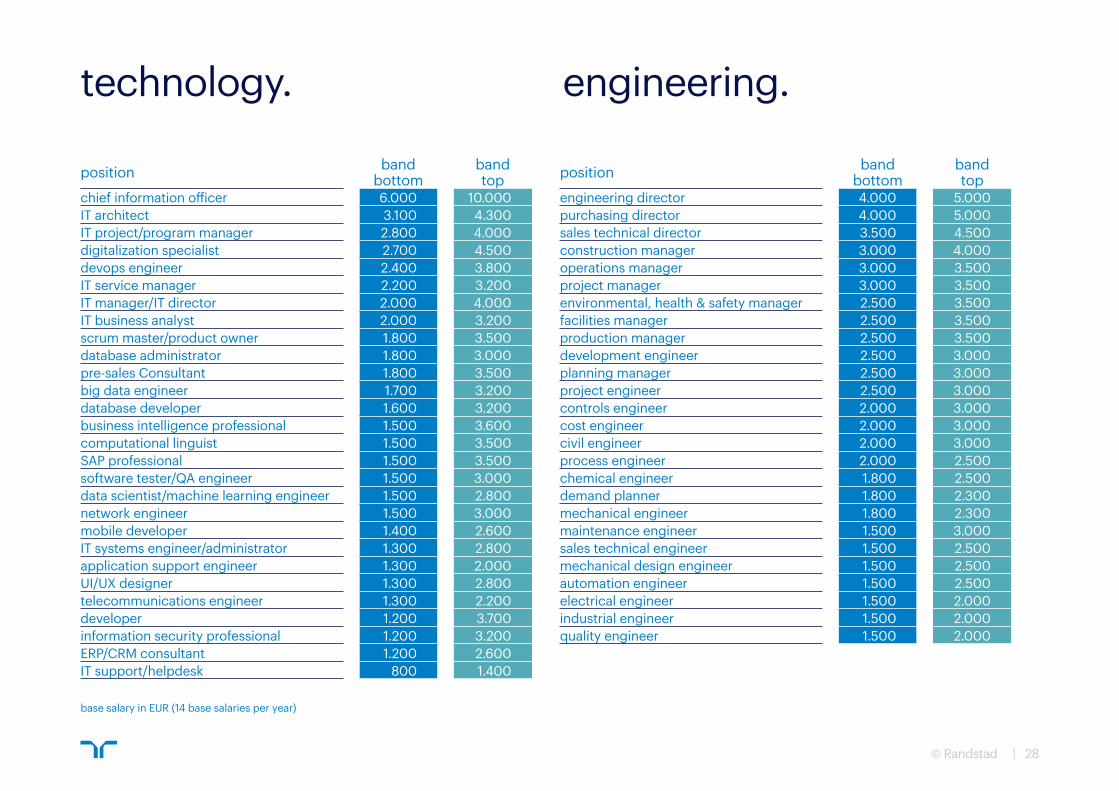
technology. engineering.
position band bottom
band top
chief information officer 6.000 10.000IT architect 3.100 4.300IT project/program manager 2.800 4.000digitalization specialist 2.700 4.500devops engineer 2.400 3.800IT service manager 2.200 3.200IT manager/IT director 2.000 4.000IT business analyst 2.000 3.200scrum master/product owner 1.800 3.500database administrator 1.800 3.000pre-sales Consultant 1.800 3.500big data engineer 1.700 3.200database developer 1.600 3.200business intelligence professional 1.500 3.600computational linguist 1.500 3.500SAP professional 1.500 3.500software tester/QA engineer 1.500 3.000data scientist/machine learning engineer 1.500 2.800network engineer 1.500 3.000mobile developer 1.400 2.600IT systems engineer/administrator 1.300 2.800application support engineer 1.300 2.000UI/UX designer 1.300 2.800telecommunications engineer 1.300 2.200developer 1.200 3.700information security professional 1.200 3.200ERP/CRM consultant 1.200 2.600IT support/helpdesk 800 1.400
position band bottom
band top
engineering director 4.000 5.000purchasing director 4.000 5.000sales technical director 3.500 4.500construction manager 3.000 4.000operations manager 3.000 3.500project manager 3.000 3.500environmental, health & safety manager 2.500 3.500facilities manager 2.500 3.500production manager 2.500 3.500development engineer 2.500 3.000planning manager 2.500 3.000project engineer 2.500 3.000controls engineer 2.000 3.000cost engineer 2.000 3.000civil engineer 2.000 3.000process engineer 2.000 2.500chemical engineer 1.800 2.500demand planner 1.800 2.300mechanical engineer 1.800 2.300maintenance engineer 1.500 3.000sales technical engineer 1.500 2.500mechanical design engineer 1.500 2.500automation engineer 1.500 2.500electrical engineer 1.500 2.000industrial engineer 1.500 2.000quality engineer 1.500 2.000
base salary in EUR (14 base salaries per year)
29© Randstad
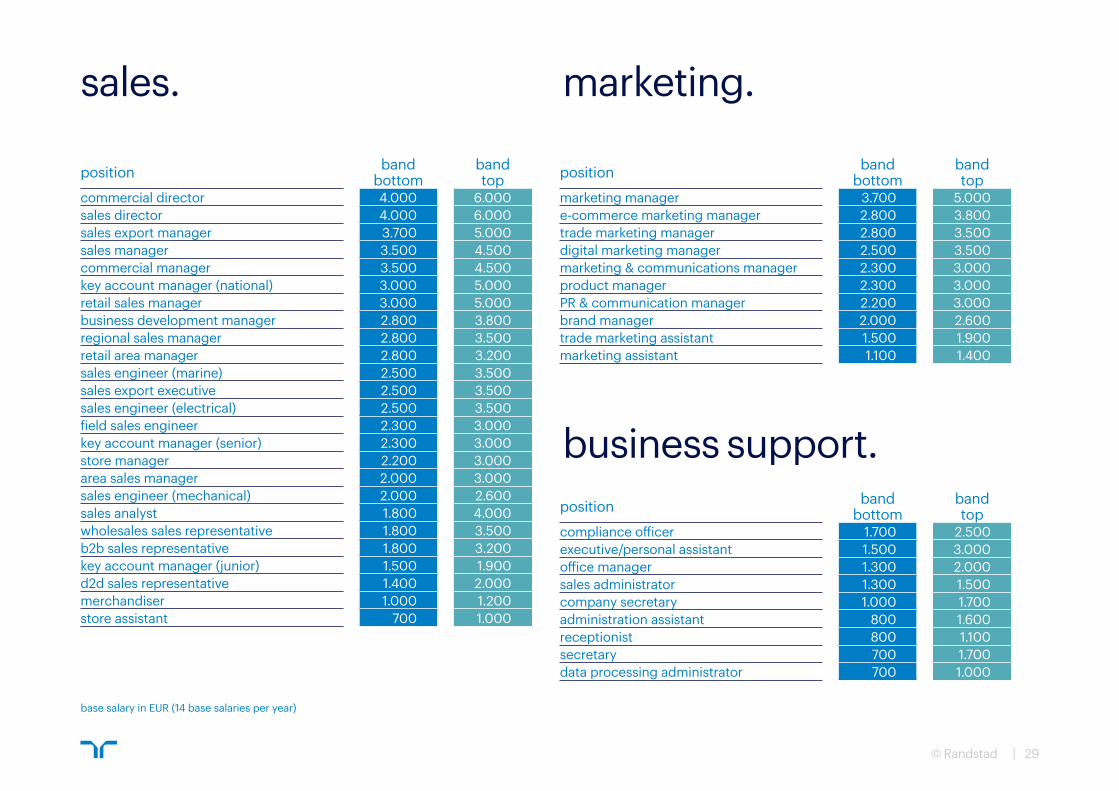
sales. marketing.
business support.
position band bottom
band top
commercial director 4.000 6.000sales director 4.000 6.000sales export manager 3.700 5.000sales manager 3.500 4.500commercial manager 3.500 4.500key account manager (national) 3.000 5.000retail sales manager 3.000 5.000business development manager 2.800 3.800regional sales manager 2.800 3.500retail area manager 2.800 3.200sales engineer (marine) 2.500 3.500sales export executive 2.500 3.500sales engineer (electrical) 2.500 3.500field sales engineer 2.300 3.000key account manager (senior) 2.300 3.000store manager 2.200 3.000area sales manager 2.000 3.000sales engineer (mechanical) 2.000 2.600sales analyst 1.800 4.000wholesales sales representative 1.800 3.500b2b sales representative 1.800 3.200key account manager (junior) 1.500 1.900d2d sales representative 1.400 2.000merchandiser 1.000 1.200store assistant 700 1.000
position band bottom
band top
marketing manager 3.700 5.000e-commerce marketing manager 2.800 3.800trade marketing manager 2.800 3.500digital marketing manager 2.500 3.500marketing & communications manager 2.300 3.000product manager 2.300 3.000PR & communication manager 2.200 3.000brand manager 2.000 2.600trade marketing assistant 1.500 1.900marketing assistant 1.100 1.400
position band bottom
band top
compliance officer 1.700 2.500executive/personal assistant 1.500 3.000office manager 1.300 2.000sales administrator 1.300 1.500company secretary 1.000 1.700administration assistant 800 1.600receptionist 800 1.100secretary 700 1.700data processing administrator 700 1.000
base salary in EUR (14 base salaries per year)
30© Randstad
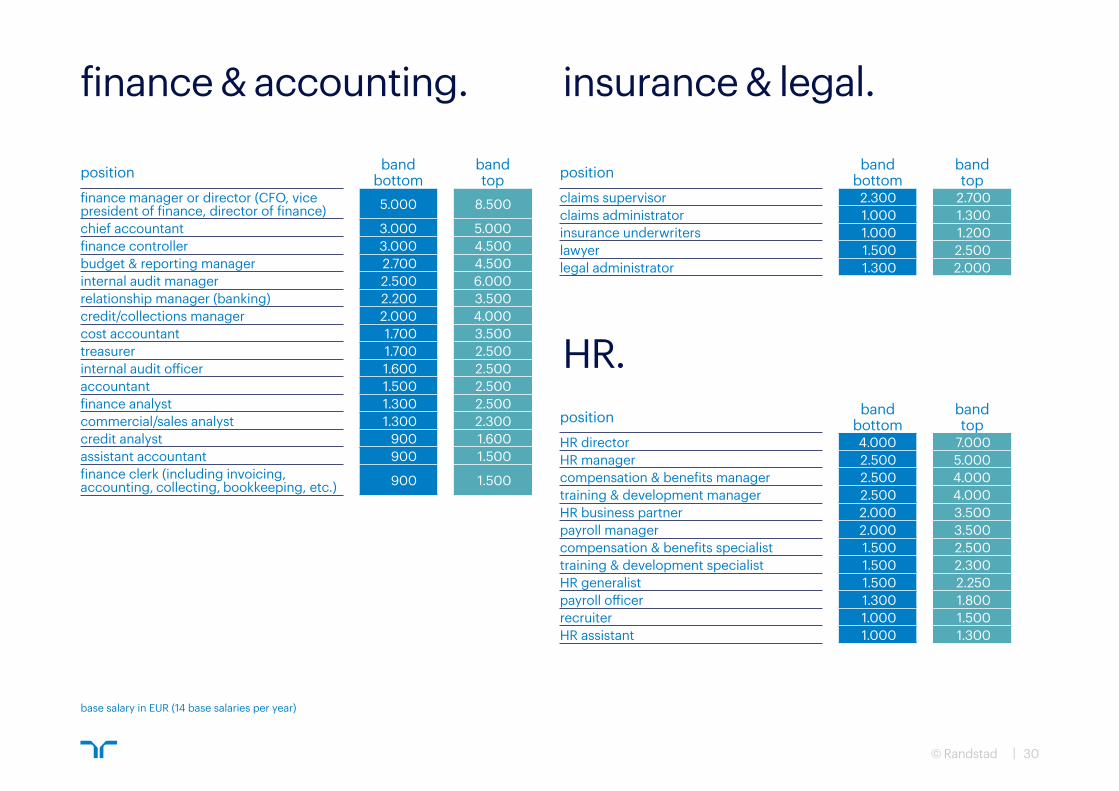
finance & accounting. insurance & legal.
HR.
position band bottom
band top
finance manager or director (CFO, vice president of finance, director of finance) 5.000 8.500
chief accountant 3.000 5.000finance controller 3.000 4.500budget & reporting manager 2.700 4.500internal audit manager 2.500 6.000relationship manager (banking) 2.200 3.500credit/collections manager 2.000 4.000cost accountant 1.700 3.500treasurer 1.700 2.500internal audit officer 1.600 2.500accountant 1.500 2.500finance analyst 1.300 2.500commercial/sales analyst 1.300 2.300credit analyst 900 1.600assistant accountant 900 1.500finance clerk (including invoicing, accounting, collecting, bookkeeping, etc.) 900 1.500
position band bottom
band top
claims supervisor 2.300 2.700claims administrator 1.000 1.300insurance underwriters 1.000 1.200lawyer 1.500 2.500 legal administrator 1.300 2.000
position band bottom
band top
HR director 4.000 7.000HR manager 2.500 5.000compensation & benefits manager 2.500 4.000training & development manager 2.500 4.000HR business partner 2.000 3.500payroll manager 2.000 3.500compensation & benefits specialist 1.500 2.500training & development specialist 1.500 2.300HR generalist 1.500 2.250payroll officer 1.300 1.800recruiter 1.000 1.500HR assistant 1.000 1.300
base salary in EUR (14 base salaries per year)
31© Randstad
pharma. client services.
logistics & shipping.
position band bottom
band top
head of customer service 3.200 3.500customer care manager 2.500 3.000customer experience manager 2.500 3.000indirect call center manager 2.400 2.800call center manager 2.200 2.600contact center manager 2.200 2.600collections manager 1.800 2.800collections supervisor 1.400 1.700multilingual inside b2b agents 1.200 1.400guest relations officer 1.100 1.500multilingual call center agents 1.100 1.400collections team leader 1.100 1.400customer service coordinator 1.000 1.200inside sales specialist 1.000 1.300multilingual social media content moderators 1.000 1.300
front desk customer service 750 1.000customer service agents 650 1.000collection agents 650 1.000
position band bottom
band top
regulatory affairs officer 1.900 2.500quality assurance officer (pharma industry) 1.700 2.500
clinical research associate 1.600 2.200r&d analyst 1.500 2.500quality control analyst 1.400 2.300
position band bottom
band top
procurement manager 2.800 2.200logistics manager 2.500 3.000supply chain executive 2.000 2.500warehouse manager 2.000 2.500imports/exports specialist 2.000 2.500procurement specialist 1.800 2.000buyer 1.500 2.000import/exports coordinator 1.500 2.000logistics assistant 1.300 2.000procurement assistant 1.300 1.800order desk specialist 2.500 1.800operation manager 5.000 7.000fleet manager 5.000 7.000superintendent engineer 3.500 4.500operator 2.500 4.000
base salary in EUR (14 base salaries per year)

attractingrandstad
human forward.
randstad greece
hr trends and salary report 2019
attracting
talent.
34© Randstad
content
introduction 3
attracting talent 5
human capital strategy 8
recruiting practices 15
talent retention 19
about the research 23
salary report 26

35© Randstad
introduction.
z In today’s agile workforce environment, understanding and embracing the latest trends in human resources is essential for successfully sourcing and retaining the best talent.
z Innovative technologies, an increasingly global and diverse workforce and emerging business models are reshaping employees’ expectations and experiences.
z Moreover, these factors determine what companies look for in candidates and personnel in order to ensure coverage of skills gaps, business growth or employee engagement and productivity.
z This report offers insights into various trends and developments impacting the HR and recruitment practices in Greece, with a focus on human capital strategy, recruitment, talent retention and benefits package in order to provide an overview of the opportunities and challenges that lie ahead for HR professionals.
z 433 decision-makers and HR executives from a variety of industries in Greece completed the survey between December 2018 and March 2019.

36© Randstad
executive summary.
z In 2019, the top three elements for attracting talent are a competitive salary package, strong employer branding and flexible work policies.
z 82% of participants plan to hire permanent personnel during 2019.
z New hiring is mainly expected in the sales and IT/technology departments.
z Employee referrals are considered the most efficient source for finding the right talent.
z Skill shortages and relevant industry work experience continue to be a problem. The majority of respondents address this through education and training programs.
z Almost 60% of the survey participants expect no change in employee turnover compared to 2018 and believe they will spend the same amount of time to fill a permanent position as in the previous year.

attracting
talent.
attracting
talent.
37© Randstad 37© Randstad

38© Randstad
key elements for attracting top talent.
2018 2019
a very competitive salary package 65,6% 66,7%
strong employer branding 60,8% 59,1%
flexible work policies/good work-life balance 36,5% 43,0%
a very attractive employee value proposition 46,6% 40,0%
high job security 48,2% 39,7%
a clear and purposeful mission 30,9% 32,8%
good international opportunities 18,8% 20,1%
other 1,9% 0,5%
the total is more than 100% because more than one answer is possible.
companies’ ability to attract top talent
key elements to attract top talent• Most of the surveyed companies are optimistic about their ability to attract talent, ranking themselves ‘7’ on a scale of 1 to 10. The key elements for attracting talent are a competitive salary package, strong employer branding and flexible work policies.
• Compared to 2018, flexible work policies, that help at sustaining a good work-life balance, have grown in importance for companies looking to attract top talent.
0,7% 0,7%
3,5%4,8%
12,2%
21,9%
27,5%
22,2%
4,4%2,1%
on a scale from 1 to 10, where 1 signifies “poor” and 10 signifies “excellent”
7 2018: 7 (24,8%)
1 2 3 4 5 6 7 8 9 10

39© Randstad
reasons for failing to attract the right talent.
2018 2019uncompetitive salary and/or benefits 53,7% 55,0%
poor reputation of organisation/weak employer brand
42,4% 45,5%
lack of internal career opportunities 40,5% 40,2%
ineffective recruitment strategies 27,3% 24,9%
ongoing talent shortages 21,3% 24,2%
unappealing work environment 30,3% 23,1%
industry is less appealing 30,7% 21,2%
lack of opportunities for creativity 15,9% 15,5%
poor leadership 19,6% 15,2%
lack of corporate direction, vision or purpose 18,4% 13,6%
lack of flexible work options 10,2% 11,5%
lack of corporate social responsibility 3,3% 3,2%
other 3,3% 3,5%
the total is more than 100% because more than one answer is possible.
• The surveyed companies identified uncompetitive wages/benefits, poor organizational reputation and lack of internal career opportunities as the main obstacles to attracting the right talent.
• “Soft” factors, such as CSR activities, flexible work options, and opportunities to apply creativity, are considered barriers by a relatively small share of the respondents.

attracting
talent.
human capital
strategy.
40© Randstad