Embed Size (px)
Citation preview

Howto: Porting the GNU DebuggerPractical Experience with theOpenRISC 1000 Architecture
Jeremy BennettEmbecosm
Application Note 3. Issue 2Published November 2008

ii Copyright © 2008 Embecosm Limited
Legal NoticeThis work is licensed under the Creative Commons Attribution 2.0 UK: England & WalesLicense. To view a copy of this license, visit http://creativecommons.org/licenses/by/2.0/uk/or send a letter to Creative Commons, 171 Second Street, Suite 300, San Francisco, California,94105, USA.
This license means you are free:• to copy, distribute, display, and perform the work
• to make derivative works
under the following conditions:• Attribution. You must give the original author, Jeremy Bennett of Embecosm
(www.embecosm.com), credit;
• For any reuse or distribution, you must make clear to others the license terms of thiswork;
• Any of these conditions can be waived if you get permission from the copyright holder,Embecosm; and
• Nothing in this license impairs or restricts the author's moral rights.
The software for GNU Debugger, including the code to support the OpenRISC 1000 written byEmbecosm and used in this document is licensed under the GNU General Public License (GNUGeneral Public License). For detailed licensing information see the files COPYING, COPYING3,COPYING.LIB and COPYING3.LIB in the source code.
Embecosm is the business name of Embecosm Limited, a private limited company registeredin England and Wales. Registration number 6577021.

iii Copyright © 2008 Embecosm Limited
Table of Contents1. Introduction ................................................................................................................ 1
1.1. Rationale .......................................................................................................... 11.2. Target Audience ................................................................................................ 11.3. Further Sources of Information ......................................................................... 1
1.3.1. Written Documentation .......................................................................... 11.3.2. Other Information Channels ................................................................... 2
1.4. About Embecosm .............................................................................................. 22. Overview of GDB Internals .......................................................................................... 3
2.1. GDB Nomenclature ........................................................................................... 32.2. Main Functional Areas and Data Structures ..................................................... 3
2.2.1. Binary File Description (BFD) ................................................................. 32.2.2. Architecture Description ......................................................................... 42.2.3. Target Operations ................................................................................... 52.2.4. Adding Commands to GDB .................................................................... 5
2.3. GDB Architecture Specification ......................................................................... 52.3.1. Looking up an Existing Architecture ....................................................... 62.3.2. Creating a New Architecture ................................................................... 72.3.3. Specifying the Hardware Data Representation ......................................... 82.3.4. Specifying the Hardware Architecture and ABI ........................................ 82.3.5. Specifying the Register Architecture ........................................................ 92.3.6. Specifying Frame Handling ................................................................... 11
2.4. Target Operations ........................................................................................... 172.4.1. Target Strata ........................................................................................ 172.4.2. Specifying a New Target ....................................................................... 172.4.3. struct target_ops Functions and Variables Providing Information ........... 182.4.4. struct target_ops Functions Controlling the Target Connection .............. 192.4.5. struct target_ops Functions to Access Memory and Registers ................. 192.4.6. struct target_ops Functions to Handle Breakpoints and Watchpoints ..... 192.4.7. struct target_ops Functions to Control Execution .................................. 20
2.5. Adding Commands to GDB ............................................................................. 202.6. Simulators ...................................................................................................... 212.7. Remote Serial Protocol (RSP) ........................................................................... 22
2.7.1. RSP Client Implementation ................................................................... 222.7.2. RSP Server Implementation .................................................................. 22
2.8. GDB File Organization .................................................................................... 222.9. Testing GDB ................................................................................................... 232.10. Documentation ............................................................................................. 232.11. Example Procedure Flows in GDB ................................................................. 23
2.11.1. Initial Start Up ................................................................................... 242.11.2. The GDB target Command ................................................................. 242.11.3. The GDB load Command .................................................................... 252.11.4. The GDB break Command .................................................................. 252.11.5. The GDB run Command ..................................................................... 262.11.6. The GDB backtrace Command ............................................................ 282.11.7. The GDB continue Command after a Breakpoint ................................. 29
2.12. Summary: Steps to Port a New Architecture to GDB ...................................... 303. The OpenRISC 1000 Architecture .............................................................................. 31
3.1. The OpenRISC 1000 JTAG Interface ................................................................ 323.2. The OpenRISC 1000 Remote JTAG Protocol .................................................... 333.3. Application Binary Interface (ABI) ................................................................... 343.4. Or1ksim: the OpenRISC 1000 Architectural Simulator .................................... 35

iv Copyright © 2008 Embecosm Limited
4. Porting the OpenRISC 1000 Architecture ................................................................... 364.1. BFD Specification ........................................................................................... 364.2. OpenRISC 1000 Architecture Specification ...................................................... 36
4.2.1. Creating struct gdbarch ........................................................................ 374.2.2. OpenRISC 1000 Hardware Data Representation .................................... 374.2.3. Information Functions for the OpenRISC 1000 Architecture .................. 384.2.4. OpenRISC 1000 Register Architecture ................................................... 394.2.5. OpenRISC 1000 Frame Handling .......................................................... 40
4.3. OpenRISC 1000 JTAG Remote Target Specification ......................................... 464.3.1. Creating struct target_ops for OpenRISC 1000 ...................................... 474.3.2. OpenRISC 1000 Target Functions and Variables Providing Information......................................................................................................................... 474.3.3. OpenRISC 1000 Target Functions Controlling the Connection ............... 484.3.4. OpenRISC 1000 Target Functions to Access Memory and Registers ........ 494.3.5. OpenRISC 1000 Target Functions to Handle Breakpoints and Watch-points ............................................................................................................. 504.3.6. OpenRISC 1000 Target Functions to Control Execution ......................... 514.3.7. OpenRISC 1000 Target Functions to Execute Commands ...................... 534.3.8. The Low Level JTAG Interface ............................................................... 53
4.4. The OpenRISC 1000 Disassembler .................................................................. 544.5. OpenRISC 1000 Specific Commands for GDB .................................................. 54
4.5.1. The info spr Command ......................................................................... 554.5.2. The spr Command ................................................................................ 55
5. Summary .................................................................................................................. 56Glossary ....................................................................................................................... 57References .................................................................................................................... 59Index .............................................................................................................................. 60

v Copyright © 2008 Embecosm Limited
List of Figures2.1. An example stack frame ......................................................................................... 122.2. Sequence diagram for GDB start up ....................................................................... 242.3. High level sequence diagram for the GDB target command ..................................... 242.4. handle_inferior_event sequence diagram in response to the GDB target command........................................................................................................................................ 252.5. Sequence diagram for the GDB load command ....................................................... 252.6. Sequence diagram for the GDB break command ..................................................... 262.7. High level sequence diagram for the GDB run command ......................................... 262.8. Sequence diagram for the GDB wait_for_inferior function as used by the run com-mand ............................................................................................................................. 272.9. Sequence diagram for the GDB normal_stop function as used by the run command........................................................................................................................................ 272.10. High level sequence diagram for the GDB backtrace command .............................. 282.11. Sequence diagram for the GDB print_frame function used by the backtrace com-mand ............................................................................................................................. 282.12. High level sequence diagram for the GDB continue command after a breakpoint........................................................................................................................................ 292.13. Sequence diagram for the GDB handle_inferior_event function after single step-ping an instruction for the continue command .............................................................. 303.1. The OpenRISC 1000 Remote JTAG Protocol data structures .................................... 344.1. The OpenRISC 1000 stack frame at the end of the prologue .................................... 41

1 Copyright © 2008 Embecosm Limited
Chapter 1. IntroductionThis document complements the existing documentation for GDB ([3], [4], [5]). It is intendedto help software engineers porting GDB to a new architecture for the first time.
This application note is based on the author's experience to date. It will be updated in futureissues. Suggestions for improvements are always welcome.
1.1. RationaleAlthough the GDB project includes a 100 page guide to its internals, that document is aimedprimarily at those wishing to develop GDB itself. The document also suffers from three limi-tations.
1. It tends to document at a detailed level. Individual functions are described well, but itis hard to get the big picture.
2. It is incomplete. Many of the most useful sections (for example on frame interpretation)are yet to be written.
3. Is tends to be out of date. For example the documentation of the UI-Independent outputdescribes a number of functions which no longer exist.
Consequently the engineer faced with their first port of GDB to a new architecture is faced withdiscovering how GDB works by reading the source code and looking at how other architectureshave been ported.
The author of this application note went through that process when porting the Open-RISC 1000 architecture to GDB. This document captures the learning experience, with theintention of helping others.
1.2. Target AudienceIf you are about to start a port of GDB to a new architecture, this document is for you. If atthe end of your endeavors you are better informed, please help by adding to this document.
If you have already been through the porting process, please help others by adding to thisdocument.
1.3. Further Sources of Information
1.3.1. Written DocumentationThe main user guide for GDB [3] provides a great deal of context about how GDB is intendedto work.
The GDB Internals document [4] is essential reading before and during any porting exercise. Itis not complete, nor is it always up to date, but it provides the first place to look for explanationof what a particular function does.
GDB relies on a separate specification of the Binary file format; for each architecture. Thathas its own comprehensive user guide [5].
The main GDB code base is generally well commented, particularly in the headers for the majorinterfaces. Inevitably this must be the definitive place to find out exactly how a particularfunction behaves.

2 Copyright © 2008 Embecosm Limited
The files making up the port for the OpenRISC 1000 are comprehensively commented, andcan be processed with Doxygen [7]. Each function's behavior, its parameters and any returnvalue is described.
1.3.2. Other Information ChannelsThe main GDB website is at sourceware.org/gdb/. It is supplemented by the less formal GDBWiki at sourceware.org/gdb/wiki/.
The GDB developer community communicate through the GDB mailing lists and using IRCchat. These are always good places to find solutions to problems.
The main mailing list for discussion is [email protected], although for detailed understand-ing, the patches mailing list, [email protected]. See the main GDB website for de-tails of subscribing to these mailing lists.
IRC is channel #gdb on irc.freenode.net.
1.4. About EmbecosmEmbecosm is a consultancy specializing in open source tools, models and training for theembedded software community. All Embecosm products are freely available under open sourcelicenses.
Embecosm offers a range of commercial services.
• Customization of open source tools and software, including porting to new architectures.
• Support, tutorials and training for open source tools and software.
• Custom software development for the embedded market, including bespoke softwaremodels of hardware.
• Independent evaluation of software tools.
For further information, visit the Embecosm website at www.embecosm.com.

3 Copyright © 2008 Embecosm Limited
Chapter 2. Overview of GDB InternalsThere are three major areas to GDB:
1. The user interface. How GDB communicates with the user.
2. The symbol side. The analysis of object files, and the mapping of the information con-tained to the corresponding source files.
3. The target side. Executing programs and analyzing their data.
GDB has a very simple view of a processor. It has a block of memory and a block of registers.Executing code contains its state in the registers and in memory. GDB maps that informationto the source level program being debugged.
Porting a new architecture to GDB means providing a way to read executable files, a descriptionof the ABI, a description of the physical architecture and operations to access the target beingdebugged.
Probably the most common use of GDB is to debug the architecture on which it is actuallyrunning. This is native debugging where the architecture of the host and target are the same.
For the OpenRISC 1000 GDB is normally run on a host separate to the target (typically aworkstation) connecting to the OpenRISC 1000 target via JTAG, using the OpenRISC 1000Remote JTAG Protocol. Remote debugging in this way is the most common method of workingfor embedded systems.
2.1. GDB NomenclatureA full Glossary is provided at the end of this document. However a number of key conceptsare worth explaining up front.
• Exec or program. An executable program, i.e. a binary file which may be run indepen-dently of other programs. Commonly the term program is found in user documentation,and exec in comments and GDB internal documentation.
• Inferior. A GDB entity representing a program or exec which has run, is running, or willrun in the future. An inferior corresponds to a process or a core dump file.
• Address space. A GDB entity which can interpret addresses (that is values of typeCORE_ADDR). Inferiors must have at least one address space and inferiors may share anaddress space.
• Thread. A single thread of control within an inferior.
The OpenRISC 1000 port for GDB is designed for "bare metal" debugging, so will have only asingle address space and inferiors with a single thread.
2.2. Main Functional Areas and Data Structures
2.2.1. Binary File Description (BFD)BFD is a package which allows applications to use the same routines to operate on object fileswhatever the object file format. A new object file format can be supported simply by creatinga new BFD back end and adding it to the library.

4 Copyright © 2008 Embecosm Limited
The BFD library back end creates a number of data structures describing the data heldin a particular type of object file. Ultimately a unique enumerated constant (of typeenum bfd_architecture) is defined for each individual architecture. This constant is then usedto access the various data structures associated with the BFD of the particular architecture.
In the case of the OpenRISC 1000, 32-bit implementation (which may be a COFF or ELFbinary), the enumerated constant is bfd_arch_or32.
BFD is part of the binutils package. A binutils implementation must be provided for any archi-tecture intending to support the GNU tool chain.
The OpenRISC 1000 is supported by the GNU tool chain. BFD back ends already exist whichare suitable for use with 32-bit OpenRISC 1000 images in ELF or COFF format as used witheither the RTEMS or Linux operating systems.
2.2.2. Architecture Description
Any architecture to be debugged by GDB is described in a struct gdbarch. When an objectfile is to be debugged, GDB will select the correct struct gdbarch using information aboutthe object file captured in its BFD.
The data in struct gdbarch facilitates both the symbol side processing (for which it also usesthe BFD information) and the target side processing (in combination with the frame and targetoperation information).
struct gdbarch is a mixture of data values (number of bytes in an integer for example) andfunctions to perform standard operations (e.g. to print the registers). The major functionalgroups are:
• Data values capturing details of the hardware architecture. For example the endianismand the number of bits in an address and in a word. Some of this data is captured inthe BFD, to which there is a reference in the struct gdbarch. There is also a structure,struct gdbarch_tdep to capture additional target specific data, beyond that which iscovered by the standard struct gdbarch.
• Data values describing how all the standard high level scalar data structures are repre-sented (char, int, double etc).
• Functions to access and display registers. GDB includes the concept of "pseudo-regis-ters", those registers which do not physically exist, but which have a meaning within thearchitecture. For example in the OpenRISC 1000, floating point registers are actually thesame as the General Purpose Registers. However a set of floating point pseudo-registerscould be defined, to allow the GPRs to be displayed in floating point format.
• Functions to access information on stack frames. This includes setting up "dummy"frames to allow GDB to evaluate functions (for example using the call command).
An architecture will need to specify most of the contents of struct gdbarch, for which a setof functions (all starting set_gdbarch_) are provided. Defaults are provided for all entries, andin a small number of cases these will be suitable.
Analysis of the stack frames of executing programs is complex with different approaches need-ed for different circumstances. A set of functions to identify stack frames and analyze theircontents is associated with each struct gdbarch.

5 Copyright © 2008 Embecosm Limited
A set of utility functions are provided to access the members of struct gdbarch. Element xyzof a struct gdbarch pointed to by g may be accessed by using gdbarch_xyz (g, ...). Thiswill check, using gdb_assert that g is defined, and in the case of functions that g->x is notNULL and return either the value g->xyz (for values) or the result of calling g->xyz (...) (forfunctions). This saves the user testing for existence before each function call, and ensures anyerrors are handled cleanly.
2.2.3. Target OperationsA set of operations is required to access a program using the target architecture described bystruct gdbarch in order to implement the target side functionality. For any given architecturethere may be multiple ways of connecting to the target, specified using the GDB target com-mand. For example with the OpenRISC 1000 architecture, the connection may be directly toa JTAG interface connected through the host computer's parallel port, or through the Open-RISC 1000 Remote JTAG Protocol over TCP/IP.
These target operations are described in a struct target_ops. As with struct gdbarch thiscomprises a mixture of data and functions. The major functional groups are:
• Functions to establish and close down a connection to the target.
• Functions to access registers and memory on the target.
• Functions to insert and remote breakpoints and watchpoints on the target.
• Functions to start and stop programs running on the target.
• A set of data describing the features of the target, and hence what operations can beapplied. For example when examining a core dump, the data can be inspected, but theprogram cannot be executed.
As with struct gdbarch, defaults are provided for the struct target_ops values. In manycases these are sufficient, so need not be provided.
2.2.4. Adding Commands to GDBGDB's command handling is intended to be extensible. A set of functions (defined in cli-decode.h) provide that extensibility.
GDB groups its commands into a number of command lists (of struct cmd_list_element),pointed to by a number of global variables (defined in cli-cmds.h). Of these, cmdlist is the listof all defined commands. Separate lists define sub-commands of various top level commands.For example infolist is the list of all info sub-commands.
Commands are also classified according the the area they address, for example commandsthat provide support, commands that examine data, commands for file handling etc. Theseclasses are specified by enum command_class, defined in command.h. These classes provide thetop level categories in which help will be given.
2.3. GDB Architecture SpecificationA GDB description for a new architecture, arch is created by defining a global function_initialize_arch_tdep, by convention in the source file arch-tdep.c. In the case of the Open-RISC 1000, this function is called _initialize_or1k_tdep and is found in the file or1k-tdep.c.

6 Copyright © 2008 Embecosm Limited
The resulting object files containing the implementation of the _initialize_arch_tdep func-tion are specified in the GDB configure.tgt file, which includes a large case statement patternmatching against the --target option of the configure command.
The new struct gdbarch is created within the _initialize_arch_tdep function by callinggdbarch_register:
void gdbarch_register (enum bfd_architecture architecture, gdbarch_init_ftype *init_func, gdbarch_dump_tdep_ftype *tdep_dump_func);
For example the _initialize_or1k_tdep creates its architecture for 32-bit OpenRISC 1000architectures by calling.
gdbarch_register (bfd_arch_or32, or1k_gdbarch_init, or1k_dump_tdep);
The architecture enumeration will identify the unique BFD for this architecture (see Sec-tion 2.2.1). The init_func is called to create and return the new struct gdbarch (see Sec-tion 2.3). The tdep_dump_func is a function which will dump the target specific details associ-ated with this architecture (also described in Section 2.3).
The call to gdbarch_register (see Section 2.2) specifies a function which will define astruct gdbarch for a particular BFD architecture.
struct gdbarch gdbarch_init_func (struct gdbarch_info info, struct gdbarch_list *arches);
For example, in the case of the OpenRISC 1000 architecture, the initialization function isor1k_gdbarch_init.
TipBy convention all target specific functions and global variables in GDB begin witha string unique to that architecture. This helps to avoid namespace pollution whenusing C. Thus all the MIPS specific functions begin mips_, the ARM specific func-tions begin arm_ etc.
For the OpenRISC 1000 all target specific functions and global variables begin withor1k_.
2.3.1. Looking up an Existing ArchitectureThe first argument to the architecture initialization function is a struct gdbarch_info con-taining all the known information about this architecture (deduced from the BFD enumerationprovided to gdbarch_register). The second argument is a list of the currently defined archi-tectures within GDB.
The lookup is done using gdbarch_list_lookup_by_info. It is passed the list of existing ar-chitectures and the struct gdbarch_info (possibly updated) and returns the first matchingarchitecture it finds, or NULL if none are found. If an architecture is found, the initializationfunction can finish, returning the found architecture as result.

7 Copyright © 2008 Embecosm Limited
2.3.1.1. struct gdbarch_info
The struct gdbarch_info has the following components:
struct gdbarch_info{ const struct bfd_arch_info *bfd_arch_info; int byte_order; bfd *abfd; struct gdbarch_tdep_info *tdep_info; enum gdb_osabi osabi; const struct target_desc *target_desc;};
bfd_arch_info holds the key details about the architecture. byte_order is an enumerationindicating the endianism. abfd is a pointer to the full BFD, tdep_info is additional customtarget specific information, gdb_osabi is an enumeration identifying which (if any) of a numberof operating specific ABIs are used by this architecture and target_desc is a set of name-valuepairs with information about register usage in this target.
When the struct gdbarch initialization function is called, not all the fields are provided—onlythose which can be deduced from the BFD. The struct gdbarch_info is used as a look-upkey with the list of existing architectures (the second argument to the initialization function)to see if a suitable architecture already exists. The tdep_info osabi and target_desc fieldsmay be added before this lookup to refine the search.
2.3.2. Creating a New ArchitectureIf no architecture is found, then a new architecture must be created, by calling gdbarch_allocusing the supplied struct gdbarch_info and and any additional custom target specific infor-mation in a struct gdbarch_tdep.
The newly created struct gdbarch must then be populated. Although there are default values,in most cases they are not what is required. For each element, X, there is a correspondingaccessor function to set the value of that element, set_gdbarch_X.
The following sections identify the main elements that should be set in this way. This is notthe complete list, but represents the functions and elements that must commonly be specifiedfor a new architecture. Many of the functions are described in the header file, gdbarch.h andmany may be found in the GDB Internals document [4].
2.3.2.1. struct gdbarch_tdep
struct gdbarch *gdbarch_alloc (const struct gdbarch_info *info, struct gdbarch_tdep *tdep);
struct gdbarch_tdep is not defined within GDB—it is up to the user to define this struct if it isneeded to hold custom target information that is not covered by the standard struct gdbarch.For example with the OpenRISC 1000 architecture it is used to hold the number of matchpointsavailable in the target (along with other information). If there is no additional target specificinformation, it can be set to NULL.

8 Copyright © 2008 Embecosm Limited
2.3.3. Specifying the Hardware Data RepresentationA set of values in struct gdbarch define how different data types are represented within thearchitecture.
• short_bit. Number of bits in a C/C++ short variable. Default is 2*TARGET_CHAR_BIT.TARGET_CHAR_BIT is a defined constant, which if not set explicitly defaults to 8.
• int_bit, long_bit, long_long_bit, float_bit, double_bit, long_double_bit. These areanalogous to short and are the number of bits in a C/C++ variable of the correspondingtime. Defaults are 4*TARGET_CHAR_BIT for int, long and float and 4*TARGET_CHAR_BITfor long long, double and long double.
• ptr_bit. Number of bits in a C/C++ pointer. Default is 4*TARGET_CHAR_BIT.
• addr_bit. Number of bits in a C/C++ address. Almost always this is the same as thenumber of bits in a pointer, but there are a small number of architectures for whichpointers cannot reach all addresses. Default is 4*TARGET_CHAR_BIT.
• float_format, double_format and long_double_format. These point to an array ofC structs (one for each endianism), defining the format for each of the floating pointtypes. A number of these arrays are predefined. They in turn are built on top of a set ofstandard types defined by the library libiberty.
• char_signed. 1 if char to be treated as signed, 0 if char is to be treated as unsigned. Thedefault is -1 (undefined), so this should always be set.
2.3.4. Specifying the Hardware Architecture and ABIA set of function members of struct gdbarch define aspects of the architecture and its ABI. Forsome of these functions, defaults are provided which will be suitable for most architectures.
• return_value. This function determines the return convention for a given data type. Forexample on the OpenRISC 1000, structs/unions and large (>32 bit) scalars are returnedas references, while small scalars are returned in GPR 11. This function should alwaysbe defined.
• breakpoint_from_pc. Returns the breakpoint instruction to be used when the PC is at aparticular location in memory. For architectures with variable length instructions, thechoice of breakpoint instruction may depend on the length of the instruction at theprogram counter. Returns the instruction sequence and its length.The default value is NULL (undefined). This function should always be defined if GDB isto support breakpointing for this architecture.
• adjust_breakpoint_address. Some architectures do not allow breakpoints to be placedat all points. Given a program counter, this function returns an address where a break-point can be placed. Default value is NULL (undefined). The function need only be definedfor architectures which cannot accept a breakpoint at all program counter locations.
• memory_insert_breakpoint and memory_remove_breakpoint. These functions in-sert or remove memory based (a.k.a. soft) breakpoints. The default valuesdefault_memory_insert_breakpoint and default_memory_remove_breakpoint are suit-able for most architectures, so in most cases these functions need not be defined.
• decr_pc_after_break. Some architectures require the program counter to be decrement-ed after a break, to allow the broken instruction to be executed on resumption. Thisfunction returns the number of bytes by which to decrement the address. The default

9 Copyright © 2008 Embecosm Limited
value is NULL (undefined) which means the program counter is left unchanged. Thisfunction need only be defined if the functionality is required.In practice this function is only of use for the very simplest architectures. It applies onlyto software breakpoints, not watchpoints or hardware breakpoints. It is more usual toadjust the program counter as required in the target to_wait and to_resume functions(see Section 2.4).
• single_step_through_delay. Returns 1 if the target is executing a delay slot and a fur-ther single step is needed before the instruction finishes. The default value is NULL (notdefined). This function should be implemented if the target has delay slots.
• print_insn. Disassemble an instruction and print it. Default value is NULL (undefined).This function should be defined if disassembly of code is to be supported.Disassembly is a function required by the binutils library. This function is defined inthe opcodes sub-directory. A suitable implementation may already exist if binutils hasalready been ported.
2.3.5. Specifying the Register ArchitectureGDB considers registers to be a set with members numbered linearly from 0 upwards. The firstpart of that set corresponds to real physical registers, the second part to any "pseudo-regis-ters". Pseudo-registers have no independent physical existence, but are useful representationsof information within the architecture. For example the OpenRISC 1000 architecture has upto 32 general purpose registers, which are typically represented as 32-bit (or 64-bit) integers.However it could be convenient to define a set of pseudo-registers, to show the GPRs repre-sented as floating point registers.
For any architecture, the implementer will decide on a mapping from hardware to GDB registernumbers. The registers corresponding to real hardware are referred to as raw registers, theremaining registers are pseudo-registers. The total register set (raw and pseudo) is called thecooked register set.
2.3.5.1. struct gdbarch Functions Specifying the Register ArchitectureThese functions specify the number and type of registers in the architecture.
• read_pc and write_pc. Functions to read the program counter. The default value is NULL(no function available). However, if the program counter is just an ordinary register, itcan be specified in struct gdbarch instead (see pc_regnum below) and it will be read orwritten using the standard routines to access registers. Thus this function need only bespecified if the program counter is not an ordinary register.
• pseudo_register_read and pseudo_register_write. These functions should be definedif there are any pseudo-registers (see Section 2.2.2 and Section 2.3.5.3 for more infor-mation on pseudo-registers). The default value is NULL.
• num_regs and num_pseudo_regs. These define the number of real and pseudo-registers.They default to -1 (undefined) and should always be explicitly defined.
• sp_regnum, pc_regnum, ps_regnum and fp0_regnum. These specify the register holding thestack pointer, program counter, processor status and first floating point register. Allexcept the first floating-point register (which defaults to 0) default to -1 (not defined).They may be real or pseudo-registers. sp_regnum must always be defined. If pc_regnumis not defined, then the functions read_pc and write_pc (see above) must be defined. Ifps_regnum is not defined, then the $ps variable will not be available to the GDB user.fp0_regnum is not needed unless the target offers support for floating point.

10 Copyright © 2008 Embecosm Limited
2.3.5.2. struct gdbarch Functions Giving Register Information
These functions return information about registers.
• register_name. This function should convert a register number (raw or pseudo) to aregister name (as a C char *). This is used both to determine the name of a register foroutput and to work out the meaning of any register names used as input. For examplewith the OpenRISC 1000, GDB registers 0-31 are the General Purpose Registers, register32 is the program counter and register 33 is the supervision register, which map to thestrings "gpr00" through "gpr31", "pc" and "sr" respectively. This means that the GDBcommand print $gpr5 should print the value of the OR1K general purpose register 5.The default value for this function is NULL. It should always be defined.Historically, GDB always had a concept of a frame pointer register, which could be ac-cessed via the GDB variable, $fp. That concept is now deprecated, recognizing that notall architectures have a frame pointer. However if an architecture does have a framepointer register, and defines a register or pseudo-register with the name "fp", then thatregister will be used as the value of the $fp variable.
• register_type. Given a register number, this function identifies the type of data it maybe holding, specified as a struct type. GDB allows creation of arbitrary types, but anumber of built in types are provided (builtin_type_void, builtin_type_int32 etc), to-gether with functions to derive types from these. Typically the program counter will havea type of "pointer to function" (it points to code), the frame pointer and stack pointerwill have types of "pointer to void" (they point to data on the stack) and all other integerregisters will have a type of 32-bit integer or 64-bit integer. This information guides theformatting when displaying out register information. The default value is NULL meaningno information is available to guide formatting when displaying registers.
• print_registers_info. Define this function to print out one or all of the reg-isters for the GDB info registers command. The default value is the functiondefault_print_registers_info which uses the type information (see register_typeabove) to determine how each register should be printed. Define this function for fullercontrol over how the registers are displayed.
• print_float_info and print_vector_info. Define this function to provide output forthe GDB info float and info vector commands respectively. The default value is NULL(not defined), meaning no information will be provided. Define each function if the targetsupports floating point or vector operations respectively.
• register_reggroup_p. GDB groups registers into different categories (general, vec-tor, floating point etc). This function given a register and group returns 1 (true)if the register is in the group and 0 otherwise. The default value is the functiondefault_register_reggroup_p which will do a reasonable job based on the type of theregister (see the function register_type above), with groups for general purpose regis-ters, floating point registers, vector registers and raw (i.e not pseudo) registers.
2.3.5.3. Register CachingCaching of registers is used, so that the target does not need to be accessed and reana-lyzed multiple times for each register in circumstances where the register value cannot havechanged.
GDB provides struct regcache, associated with a particular struct gdbarch to hold the cachedvalues of the raw registers. A set of functions is provided to access both the raw registers (withraw in their name) and the full set of cooked registers (with cooked in their name). Functions

11 Copyright © 2008 Embecosm Limited
are provided to ensure the register cache is kept synchronized with the values of the actualregisters in the target.
Accessing registers through the struct regcache routines will ensure that the appropriatestruct gdbarch functions are called when necessary to access the underlying target architec-ture. In general users should use the "cooked" functions, since these will map to the "raw"functions automatically as appropriate.
The two key functions are regcache_cooked_read and regcache_cooked_write which reador write a register to or from a byte buffer (type gdb_byte *). For conveniencethe wrapper functions regcache_cooked_read_signed, regcache_cooked_read_unsigned,regcache_cooked_write_signed and regcache_cooked_write_unsigned are provided, whichread or write the value and convert to or from a value as appropriate.
2.3.6. Specifying Frame HandlingGDB needs to understand the stack on which local (automatic) variables are stored. The areaof the stack containing all the local variables for a function invocation is known as the stackframe for that function (or colloquially just as the "frame"). In turn the function that calledthe function will have its stack frame, and so on back through the chain of functions thathave been called.
Almost all architectures have one register dedicated to point to the end of the stack (the stackpointer). Many have a second register which points to the start of the currently active stackframe (the frame pointer). The specific arrangements for an architecture are a key part of theABI.
A diagram helps to explain this. Here is a simple program to compute factorials:
1: #include <stdio.h> 2: 3: int fact( int n ) 4: { 5: if( 0 == n ) { 6: return 1; 7: } 8: else { 9: return n * fact( n - 1 );10: }11: }12: 13: main()14: {15: int i;16: 17: for( i = 0 ; i < 10 ; i++ ) {18: int f = fact( i );19: printf( "%d! = %d\n", i, f );20: }21: }
Consider the state of the stack when the code reaches line 6 after the main program has calledfact (3). The chain of function calls will be main, fact (3), fact (2), fact (1) and fact (0).

12 Copyright © 2008 Embecosm Limited
In this example the stack is falling (as used by the OpenRISC 1000 ABI). The stack pointer(SP) is at the end of the stack (lowest address) and the frame pointer (FP) is at the highestaddress in the current stack frame. Figure 2.1 shows how the stack looks.
n = 0
n = 1
n = 2
n = 3
i = 3int fact( int n ){ if( 0 == n ) { return 1; } else { return n * fact( n - 1 ); }}
main(){ int i;
for( i = 0 ; i < 10 ; i++ ) { int f = fact( i ); printf( "%d! = %d\n", i, f ); }}
FP
PC
SPfact (0)
fact (1)
fact (2)
fact (3)
main ()
#-1
#0
#1
#2
#3
#4
FrameNumber
Direction ofstack growth
f = ?
Red Zone
Figure 2.1. An example stack frame
In each stack frame, offset 0 from the stack pointer is the frame pointer of the previous frameand offset 4 (this is illustrating a 32-bit architecture) from the stack pointer is the returnaddress. Local variables are indexed from the frame pointer, with negative indexes. In thefunction fact, offset -4 from the frame pointer is the argument n. In the main function, offset-4 from the frame pointer is the local variable i and offset -8 from the frame pointer is thelocal variable f.
NoteThis is a simplified example for illustrative purposes only. Good optimizing com-pilers would not put anything on the stack for such simple functions. Indeed theymight eliminate the recursion and use of the stack entirely!
It is very easy to get confused when examining stacks. GDB has terminology it uses rigorouslythroughout. The stack frame of the function currently executing, or where execution stoppedis numbered zero. In this example frame #0 is the stack frame of the call to fact (0). The stackframe of its calling function (fact(1) in this case) is numbered #1 and so on back throughthe chain of calls.
The main GDB data structure describing frames is struct frame_info. It is not used directly,but only via its accessor functions. struct frame_info includes information about the registersin the frame and a pointer to the code of the function with which the frame is associated. Theentire stack is represented as a linked list of struct frame_info.
2.3.6.1. Frame Handling TerminologyIt is easy to get confused when referencing stack frames. GDB uses some precise terminology.

13 Copyright © 2008 Embecosm Limited
• THIS frame is the frame currently under consideration.
• The NEXT frame, also sometimes called the inner or newer frame is the frame of thefunction called by the function of THIS frame.
• The PREVIOUS frame, also sometimes called the outer or older frame is the frame of thefunction which called the function of THIS frame.
So in the example of Figure 2.1, if THIS frame is #3 (the call to fact (3)), the NEXT frame isframe #2 (the call to fact (2)) and the PREVIOUS frame is frame #4 (the call to main ()).
The innermost frame is the frame of the current executing function, or where the programstopped, in this example, in the middle of the call to fact (0)). It is always numbered frame #0.
The base of a frame is the address immediately before the start of the NEXT frame. For a fallingstack this will be the lowest address and for a rising stack this will be the highest addressin the frame.
GDB functions to analyze the stack are typically given a pointer to the NEXT frame to determineinformation about THIS frame. Information about THIS frame includes data on where theregisters of the PREVIOUS frame are stored in this stack frame. In this example the framepointer of the PREVIOUS frame is stored at offset 0 from the stack pointer of THIS frame.
The process whereby a function is given a pointer to the NEXT frame to work out informationabout THIS frame is referred to as unwinding. The GDB functions involved in this typicallyinclude unwind in their name.
The process of analyzing a target to determine the information that should go instruct frame_info is called sniffing. The functions that carry this out are called sniffers andtypically include sniffer in their name. More than one sniffer may be required to extract allthe information for a particular frame.
Because so many functions work using the NEXT frame, there is an issue about addressingthe innermost frame—it has no NEXT frame. To solve this GDB creates a dummy frame #-1,known as the sentinel frame.
2.3.6.2. Prologue CachesAll the frame sniffing functions typically examine the code at the start of the correspondingfunction, to determine the state of registers. The ABI will save old values and set new valuesof key registers at the start of each function in what is known as the function prologue.
For any particular stack frame this data does not change, so all the standard unwindingfunctions, in addition to receiving a pointer to the NEXT frame as their first argument, receivea pointer to a prologue cache as their second argument. This can be used to store valuesassociated with a particular frame, for reuse on subsequent calls involving the same frame.
It is up to the user to define the structure used (it is a void * pointer) and arrange allocationand deallocation of storage. However for general use, GDB provides struct trad_frame_cache,with a set of accessor routines. This structure holds the stack and code address of THIS frame,the base address of the frame, a pointer to the struct frame_info for the NEXT frame anddetails of where the registers of the PREVIOUS frame may be found in THIS frame.
Typically the first time any sniffer function is called with NEXT frame, the prologue sniffer forTHIS frame will be NULL. The sniffer will analyze the frame, allocate a prologue cache structureand populate it. Subsequent calls using the same NEXT frame will pass in this prologue cache,so the data can be returned with no additional analysis.

14 Copyright © 2008 Embecosm Limited
2.3.6.3. struct gdbarch Functions to Analyze FramesThese struct gdbarch functions and value provide analysis of the stack frame and allow itto be adjusted as required.
• skip_prologue. The prologue of a function is the code at the beginning of the functionwhich sets up the stack frame, saves the return address etc. The code representing thebehavior of the function starts after the prologue.This function skips past the prologue of a function if the program counter is withinthe prologue of a function. With modern optimizing compilers, this may be a far fromtrivial exercise. However the required information may be within the binary as DWARF2debugging information, making the job much easier.
The default value is NULL (not defined). This function should always be provided, but cantake advantage of DWARF2 debugging information, if that is available.
• inner_than. Given two frame or stack pointers, return 1 (true) if the first represents the"inner" stack frame and 0 (false) otherwise. This is used to determine whether the targethas a rising or a falling stack frame. See Section 2.3.6 for an explanation of "inner"frames.The default value of this function is NULL and it should always be defined. However foralmost all architectures one of the built-in functions can be used: core_addr_lessthan(for falling stacks) or core_addr_greaterthan (for rising stacks).
• frame_align. The architecture may have constraints on how its frames are aligned. Giv-en a proposed address for the stack pointer, this function returns a suitably aligned ad-dress (by expanding the stack frame). The default value is NULL (undefined). This func-tion should be defined for any architecture where it is possible the stack could becomemisaligned. The utility functions align_down (for falling stacks) and align_up (for risingstacks) will facilitate the implementation of this function.
• frame_red_zone_size. Some ABIs reserve space beyond the end of the stack for use byleaf functions without prologue or epilogue or by exception handlers (OpenRISC 1000 isin this category). This is known as a red zone (AMD terminology). The default value is 0.Set this field if the architecture has such a red zone.
2.3.6.4. struct gdbarch Functions to Access Frame DataThese functions provide access to key registers and arguments in the stack frame.
• unwind_pc and unwind_sp. These functions are given a pointer to THIS stack frame (seeSection 2.3.6 for how frames are represented) and return the value of the programcounter and stack pointer respectively in the PREVIOUS frame (i.e. the frame of the func-tion that called this one).
• frame_num_args. Given a pointer to THIS stack frame (see Section 2.3.6 for how framesare represented), return the number of arguments that are being passed, or -1 if notknown. The default value is NULL (undefined), in which case the number of argumentspassed on any stack frame is always unknown. For many architectures this will be asuitable default.
2.3.6.5. struct gdbarch Functions Creating Dummy FramesGDB can call functions in the target code (for example by using the call or print commands).These functions may be breakpointed, and it is essential that if a function does hit a break-point, commands like backtrace work correctly.

15 Copyright © 2008 Embecosm Limited
This is achieved by making the stack look as though the function had been called from thepoint where GDB had previously stopped. This requires that GDB can set up stack framesappropriate for such function calls.
The following functions provide the functionality to set up such "dummy" stack frames.
• push_dummy_call. This function sets up a dummy stack frame for the function about tobe called. push_dummy_call is given the arguments to be passed and must copy theminto registers or push them on to the stack as appropriate for the ABI. GDB will thenpass control to the target at the address of the function, and it will find the stack andregisters set up just as expected.The default value of this function is NULL (undefined). If the function is not defined, thenGDB will not allow the user to call functions within the target being debugged.
• unwind_dummy_id. This is the inverse of push_dummy_call which restores the stack andframe pointers after a call to evaluate a function using a dummy stack frame. The defaultvalue is NULL (undefined). If push_dummy_call is defined, then this function should alsobe defined.
• push_dummy_code. If this function is not defined (its default value is NULL), a dummy callwill use the entry point of the target as its return address. A temporary breakpoint willbe set there, so the location must be writable and have room for a breakpoint.It is possible that this default is not suitable. It might not be writable (in ROM possibly),or the ABI might require code to be executed on return from a call to unwind the stackbefore the breakpoint is encountered.
If either of these is the case, then push_dummy_code should be defined to push an in-struction sequence onto the end of the stack to which the dummy call should return.
NoteThis does require that code in the stack can be executed. Some Harvard ar-chitectures may not allow this.
2.3.6.6. Analyzing Stacks: Frame SniffersWhen a program stops, GDB needs to construct the chain of struct frame_info representingthe state of the stack using appropriate sniffers.
Each architecture requires appropriate sniffers, but they do not form entries instruct gdbarch, since more than one sniffer may be required and a sniffer may be suitablefor more than one struct gdbarch. Instead sniffers are associated with architectures usingthe following functions.
• frame_unwind_append_sniffer is used to add a new sniffer to analyze THIS frame whengiven a pointer to the NEXT frame.
• frame_base_append_sniffer is used to add a new sniffer which can determine informa-tion about the base of a stack frame.
• frame_base_set_default is used to specify the default base sniffer.
These functions all take a reference to struct gdbarch, so they are associated with a specificarchitecture. They are usually called in the struct gdbarch initialization function, after thestruct gdbarch has been set up. Unless a default has been set, the most recently appendedsniffer will be tried first.
The main frame unwinding sniffer (as set by frame_unwind_append_sniffer) returns a struc-ture specifying a set of sniffing functions:

16 Copyright © 2008 Embecosm Limited
struct frame_unwind{ enum frame_type type; frame_this_id_ftype *this_id; frame_prev_register_ftype *prev_register; const struct frame_data *unwind_data; frame_sniffer_ftype *sniffer; frame_prev_pc_ftype *prev_pc; frame_dealloc_cache_ftype *dealloc_cache;};
The type field indicates the type of frame this sniffer can handle: normal, dummy (seepush_dummy_call in Section 2.3), signal handler or sentinel. Signal handlers sometimes havetheir own simplified stack structure for efficiency, so may need their own handlers.
unwind_data holds additional information which may be relevant to particular types of frame.For example it may hold additional information for signal handler frames.
The remaining fields define functions that yield different types of information when given apointer to the NEXT stack frame. Not all functions need be provided. If an entry is NULL, thenext sniffer will be tried instead.
• this_id determines the stack pointer and function (code entry point) for THIS stackframe.
• prev_register determines where the values of registers for the PREVIOUS stack frameare stored in THIS stack frame.
• sniffer takes a look at THIS frame's registers to determine if this is the appropriateunwinder.
• prev_pc determines the program counter for THIS frame. Only needed if the programcounter is not an ordinary register (see prev_pc in Section 2.3).
• dealloc_cache frees any additional memory associated with the prologue cache for thisframe (see Section 2.3.6.2).
In general it is only the this_id and prev_register functions that need be defined for customsniffers.
The frame base sniffer is much simpler. It is a struct frame_base, which refers to the corre-sponding struct frame_unwind and provides functions yielding various addresses within theframe.
struct frame_base{ const struct frame_unwind *unwind; frame_this_base_ftype *this_base; frame_this_locals_ftype *this_locals; frame_this_args_ftype *this_args;};
All these functions take a pointer to the NEXT frame as argument. this_base returns the baseaddress of THIS frame, this_locals returns the base address of local variables in THIS frameand this_args returns the base address of the function arguments in this frame.

17 Copyright © 2008 Embecosm Limited
As described above the base address of a frame is the address immediately before the start ofthe NEXT frame. For a falling stack, this is the lowest address in the frame and for a risingstack it is the highest address in the frame. For most architectures the same address is alsothe base address for local variables and arguments, in which case the same function can beused for all three entries.
It is worth noting that if it cannot be determined in any other way (for example by there beinga register with the name "fp"), then the result of the this_base function will be used as thevalue of the frame pointer variable $fp in GDB
2.4. Target OperationsThe communication with the target is down to a set of target operations. These operations areheld in a struct target_ops, together with flags describing the behavior of the target. Thestruct target_ops elements are defined and documented in target.h. The sections followingdescribe the most important of these functions.
2.4.1. Target StrataGDB has several different types of target: executable files, core dumps, executing processesetc. At any time, GDB may have several sets of target operations in use. For example targetoperations for use with an executing process (which can run code) might be different from theoperations used when inspecting a core dump.
All the targets GDB knows about are held in a stack. GDB walks down the stack to find the setof target operations suitable for use. The stack is organized as a series of strata of decreasingimportance: target operations for threads, then target operations suitable for processes, targetoperations to download remote targets, target operations for core dumps, target operationsfor executable files and at the bottom target operations for dummy targets. So GDB whendebugging a running process will always select target operations from the process_stratum ifavailable, over target operations from the file stratum, even if the target operations from thefile stratum were pushed onto the stack more recently.
At any particular time, there is a current target, held in the global variable current_target.This can never be NULL—if there is no other target available, it will point to the dummy target.
target.h defines a set of convenience macros to access functions and values in thecurrent_target. Thus current_target->to_xyz can be accessed as target_xyz.
2.4.2. Specifying a New TargetSome targets (sets of target operations in a struct target_ops) are set up automatically byGDB—these include the operations to drive simulators (see Section 2.6 and the operations todrive the GDB Remote Serial Protocol (RSP) (see Section 2.7).
Other targets must be set up explicitly by the implementer, using the add_target function. Byfar the most common is the native target for native debugging of the host. Less common is toset up a non-native target, such as the JTAG target used with the OpenRISC 10001.
2.4.2.1. Native TargetsA new native target is created by defining a function _initialize_arch_os_nat for the archi-tecture, arch and operating system os, in the source file arch-os-nat.c. A fragment of a make-
1 For a new remote target of any kind, the recommended approach is to use the standard GDB Remote Serial Protocol(RSP) and have the target implement the server side of this interface. The only remote targets remaining are historiclegacy interfaces, such as the OpenRISC 1000 Remote JTAG Protocol.

18 Copyright © 2008 Embecosm Limited
file to create the binary from the source is created in the file config/arch/os.mh with a headergiving any macro definitions etc in config/arch/nm-os.h (which will be linked to nm.h at buildtime).
The _initialize_ function should create a new struct target_ops and call add_target toadd this target to the list of available targets.
For new native targets there are standard implementations which can be reused, with just oneor two changes. For example the function linux_trad_target returns a struct target_opssuitable for most Linux native targets. It may prove necessary only to alter the description fieldand the functions to fetch and store registers.
2.4.2.2. Remote TargetsFor a new remote target, the procedure is a little simpler. The source files should be added toconfigure.tgt, just as for the architectural description (see Section 2.3). Within the sourcefile, define a new function _initialize_remote_arch to implement a new remote target, arch.
For new remote targets, the definitions in remote.c used to implement the RSP provide a goodstarting point.
2.4.3. struct target_ops Functions and Variables Providing Information
These functions and variables provide information about the target. The first group identifiesthe name of the target and provides help information for the user.
• to_shortname. This string is the name of target, for use with GDBs target. Settingto_shortname to foo means that target foo will connect to the target, invoking to_openfor this target (see below).
• to_longname. A string giving a brief description of the type of target. This is printed withthe info target information (see also to_files_info below).
• to_doc. The help text for this target. If the short name of the target is foo, then thecommand help target will print target foo followed by the first sentence of this helptext. The command help target foo will print out the complete text.
• to_files_info. This function provides additional information for the info target com-mand.
The second group of variables provides information about the current state of the target.
• to_stratum. An enumerated constant indicating to which stratum thisstruct target_ops belongs
• to_has_all_memory. Boolean indicating if the target includes all of memory, or only partof it. If only part, then a failed memory request may be able to be satisfied by a differenttarget in the stack.
• to_has_memory. Boolean indicating if the target has memory (dummy targets do not)
• to_has_stack. Boolean indicating if the target has a stack. Object files do not, coredumps and executable threads/processes do.
• to_has_registers. Boolean indicating if the target has registers. Object files do not, coredumps and executable threads/processes do.
19 Copyright © 2008 Embecosm Limited
• to_has_execution. Boolean indicating if the target is currently executing. For some tar-gets that is the same as if they are capable of execution. However some remote targetscan be in the position where they are not executing until create_inferior or attachis called.
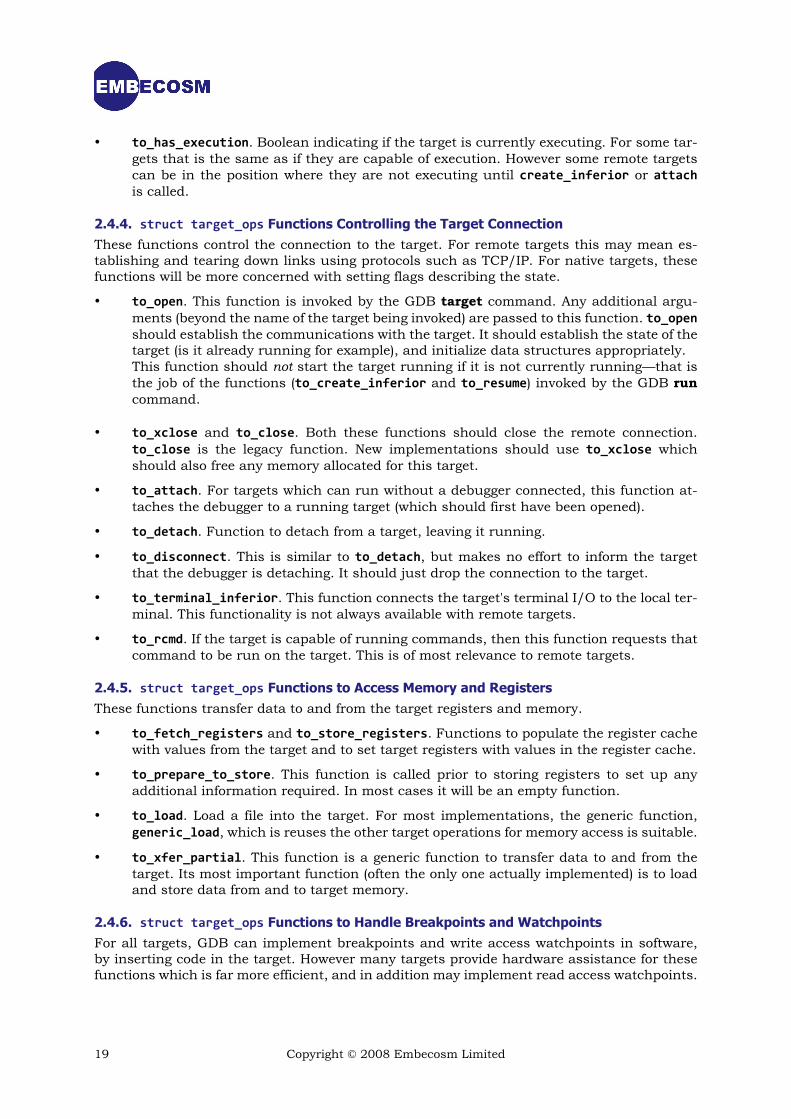
2.4.4. struct target_ops Functions Controlling the Target ConnectionThese functions control the connection to the target. For remote targets this may mean es-tablishing and tearing down links using protocols such as TCP/IP. For native targets, thesefunctions will be more concerned with setting flags describing the state.
• to_open. This function is invoked by the GDB target command. Any additional argu-ments (beyond the name of the target being invoked) are passed to this function. to_openshould establish the communications with the target. It should establish the state of thetarget (is it already running for example), and initialize data structures appropriately.This function should not start the target running if it is not currently running—that isthe job of the functions (to_create_inferior and to_resume) invoked by the GDB runcommand.
• to_xclose and to_close. Both these functions should close the remote connection.to_close is the legacy function. New implementations should use to_xclose whichshould also free any memory allocated for this target.
• to_attach. For targets which can run without a debugger connected, this function at-taches the debugger to a running target (which should first have been opened).
• to_detach. Function to detach from a target, leaving it running.
• to_disconnect. This is similar to to_detach, but makes no effort to inform the targetthat the debugger is detaching. It should just drop the connection to the target.
• to_terminal_inferior. This function connects the target's terminal I/O to the local ter-minal. This functionality is not always available with remote targets.
• to_rcmd. If the target is capable of running commands, then this function requests thatcommand to be run on the target. This is of most relevance to remote targets.
2.4.5. struct target_ops Functions to Access Memory and RegistersThese functions transfer data to and from the target registers and memory.
• to_fetch_registers and to_store_registers. Functions to populate the register cachewith values from the target and to set target registers with values in the register cache.
• to_prepare_to_store. This function is called prior to storing registers to set up anyadditional information required. In most cases it will be an empty function.
• to_load. Load a file into the target. For most implementations, the generic function,generic_load, which is reuses the other target operations for memory access is suitable.
• to_xfer_partial. This function is a generic function to transfer data to and from thetarget. Its most important function (often the only one actually implemented) is to loadand store data from and to target memory.
2.4.6. struct target_ops Functions to Handle Breakpoints and WatchpointsFor all targets, GDB can implement breakpoints and write access watchpoints in software,by inserting code in the target. However many targets provide hardware assistance for thesefunctions which is far more efficient, and in addition may implement read access watchpoints.

20 Copyright © 2008 Embecosm Limited
These functions in struct target_ops provide a mechanism to access such functionality ifit is available.
• to_insert_breakpoint and to_remove_breakpoint. These functions insert and removebreakpoints on the target. They can choose to use either hardware or software break-points. However if the insert function allows use of hardware breakpoints, then the GDBcommand set breakpoint auto-hw off will have no effect.
• to_can_use_hw_breakpoint. This function should return 1 (true) if the target can set ahardware breakpoint or watchpoint and 0 otherwise. The function is passed an enumer-ation to indicate whether watchpoints or breakpoints are being queried, and should useinformation about the number of hardware breakpoints/watchpoints currently in useto determine if a breakpoint/watchpoint can be set.
• to_insert_hw_breakpoint and to_remove_hw_breakpoint. Functions to insert and re-move hardware breakpoints. Return a failure result if no hardware breakpoint is avail-able.
• to_insert_watchpoint and to_remove_watchpoint. Functions to insert and removewatchpoints.
• to_stopped_by_watchpoint. Function returns 1 (true) if the last stop was due to a watch-point.
• to_stopped_data_address. If the last stop was due to a watchpoint, this function returnsthe address of the data which triggered the watchpoint.
2.4.7. struct target_ops Functions to Control Execution
for targets capable of execution, these functions provide the mechanisms to start and stopexecution.
• to_resume. Function to tell the target to start running again (or for the first time).
• to_wait. Function to wait for the target to return control to the debugger. Typicallycontrol returns when the target finishes execution or hits a breakpoint. It could alsooccur if the connection is interrupted (for example by ctrl-C).
• to_stop. Function to stop the target—used whenever the target is to be interrupted (forexample by ctrl-C).
• to_kill. Kill the connection to the target. This should work, even if the connection tothe target is broken.
• to_create_inferior. For targets which can execute, this initializes a program to run,ready for it to start executing. It is invoked by the GDB run command, which will sub-sequently call to_resume to start execution.
• to_mourn_inferior. Tidy up after execution of the target has finished (for exampleafter it has exited or been killed). Most implementations call the generic function,generic_mourn_inferior, but may do some additional tidying up.
2.5. Adding Commands to GDBAs noted in Section 2.2, GDB's command handling is extensible. Commands are grouped intoa number of command lists (of type struct cmd_list_element), pointed to by a number ofglobal variables (defined in cli-cmds.h). Of these, cmdlist is the list of all defined commands,

21 Copyright © 2008 Embecosm Limited
with separate lists defined for sub-commands of various top level commands. For exampleinfolist is the list of all info sub-commands.
Each command (or sub-command) is associated with a callback function which imple-ments the behavior of the functions. There are additional requirements for functionswhich set or show values within GDB. Each function also takes a documentation string(used by the help command). Functions for adding commands all return a pointer to thestruct cmd_list_element for the command added (which is not necessarily the head of itscommand list). The most useful functions are:
• add_cmd. Add a function to a command list.
• add_com. Add a function to the main command list, cmdlist. This is a convenience wrap-per for add_cmd.
• add_prefix_cmd. Add a new prefix command. This command should have its own func-tion for use if it is called on its own, and a global command list pointer specific to theprefix command to which all its sub-commands will be added. If a prefix command iscalled with an unknown sub-command, it can either give an error or call the functionof the prefix command itself. Which of these is used is specified by a flag in the call toadd_prefix_cmd.
• add_alias_cmd. Add an alias for a command already defined.
• add_info. Add a sub-command to the info. A convenience wrapper for add_cmd.
New commands are usually added in the _initialize_arch function after the struct gdbarchhas been defined.
2.6. SimulatorsGDB enables implementers to link gdb to a built-in simulator, so that a simulated target maybe executed through use of the target sim command.
The simulator should be built as a library, libsim.a, implementing the standard GDB sim-ulator interface. The location of the library is specified by setting the gdb_sim parameter inconfigure.tgt.
The interface consists of a set of functions which should be implemented. The detailed speci-fication is found in the header remote-sim.h in the include directory.
• sim_open. Initialize the simulator.
• sim_close. Destroy the simulator instance, including freeing any memory.
• sim_load. Load a program into the simulator's memory.
• sim_create_inferior. Prepare to run the simulated program. Don't actually run it untilsim_resume (see below) is called.
• sim_read and sim_write. Read and write bytes from and to the simulator's memory.
• sim_fetch_register and sim_store_register. Read and write the simulator's registers.
• sim_info. Print information for the info sim command.
• sim_resume. Resume (or start) execution of the simulated program.
• sim_stop. Stop execution of the simulated program.

22 Copyright © 2008 Embecosm Limited
• sim_stop_reason. Return the reason why the program stopped.
• sim_do_command. Execute some arbitrary command that the simulator supports.
2.7. Remote Serial Protocol (RSP)The GDB Remote Serial Protocol is a general purpose protocol for connecting to remote targets.It is invoked through the target remote and target extended-remote commands.
The protocol is a simple text command-response protocol. The GDB session acts as the clientto the protocol. It issues commands to the server, which in turn must be implemented by thetarget. Any remote target can communicate with GDB by implementing the server side of theRSP. A number of stub implementations are provided for various architectures, which can beused as the basis of new implementations. The protocol is fully documented as an appendixwithin the main GDB User Guide [3].
It is strongly recommended that any new remote target should be implemented using the RSP,rather than by creating a new remote target protocol.
2.7.1. RSP Client ImplementationThe client implementation can be found in the source files remote.h and remote.c in the gdbsubdirectory. These implement a set of target operations, as described in Section 2.4. Eachof the standard operations is mapped into a sequence of RSP interactions with the server onthe target.
2.7.2. RSP Server ImplementationRSP server implementation is a large subject in its own right, and does not form a direct partof the GDB implementation (since it is part of the target, not the debugger).
A comprehensive "Howto" has been written by Embecosm, describing the implementation tech-niques for RSP servers, illustrated by examples using the OpenRISC 1000 architectural sim-ulator, Or1ksim as RSP target [2].
2.8. GDB File OrganizationThe bulk of the GDB source code is in a small number of directories. Some components ofGDB are libraries used elsewhere (for example BFD is used in GNU binutils), and these havetheir own directory. The main directories are:
• include. Header files for information which straddles major components. For examplethe main simulator interface header is here (remote-sim.h), because it links GDB (indirectory gdb) to the simulators (in directory sim). Other headers, specific to a particularcomponent reside in the directory of that component.
• bfd. The Binary File Descriptor library. If a new object file type must be recognized, itshould be added here.
• gdb. The main GDB directory. All source files should include defs.h first and then anyother headers they reference. Headers should also include any headers they reference,but may assume that defs.h has been included.The file configure.tgt contains a huge switch statement to match targets specified tothe main configure command. Add a new target by incorporating its pattern match inthis file.
The sub-directory config contains target specific configuration information for nativetargets.

23 Copyright © 2008 Embecosm Limited
• libiberty. Before POSIX and glibc, this was a GNU project to provide a set of standardfunctions. It lives on in GDB. Most valuable are its free store management and argumentparsing functions.
• opcodes. This contains disassemblers for use by GDB (the disassemble command);. Ina directory of its own, because this code is also used in binutils.
• sim. The simulators for various targets. Each target architecture simulator is built inits own sub-directory.
2.9. Testing GDBRunning the GDB test suite requires that the DejaGNU package is installed. The tests canthen be run with:
make check
On completion of the run, the summary results will be in the gdb/testsuite directory ingdb.sum with the detailed log in gdb.log
For the most comprehensive tests in an environment where host and target differ, DejaGNUneeds some additional configuration. This can be achieved by setting the DEJAGNU environmentvariable to refer to a suitable configuration file, and defining a custom board configuration filein the directory ~/boards. These configuration files can be used to specify a suitable simulatorand how to connect it when running tests.
2.10. DocumentationSome of GDB sub-directories in turn have doc sub-directories. The documentation is writtenin texinfo [9], from which documents can be generated as PDF, PostScript, HTML or info files.The documentation is not built automatically with make all, nor with make doc.
To create documentation, change to the individual documentation directory and usemake html, make pdf, make ps or make info as required.
The main documents of interest are:
• bfd/doc/bfd.texinfo. This is the BFD manual.
• gdb/doc/gdb.texinfo. This is the main GDB user guide [3].
• gdb/doc/gdbint.texinfo. This is the internals user guide [4]. It is essential reading forany developer porting the code.
The exception to automatic building is with make install. This will build info files for anydocuments in the gdb/doc directory and install them in the info sub-directory of the installdirectory.
2.11. Example Procedure Flows in GDBIt is instructive to see how the architecture specification functions and target operations areinvoked in response to various GDB commands. This gives useful points for debugging a newarchitecture port.
In the following sections, several procedure flows are illustrated by sequence diagrams. Theseshow the calling chain for procedures. Only the key functions are shown - the actual callsusually involve several intermediate function calls.

24 Copyright © 2008 Embecosm Limited
2.11.1. Initial Start UpFigure 2.2 shows the sequence diagram for GDB start up.
gdb_main
gdb_init
initialize_all_files
_initialize_arch_tdep
_initialize_arch_remote
initialize_current_architecture
arch_gdbarch_init
current_interp_command_loop
Figure 2.2. Sequence diagram for GDB start up
On start up, the GDB initialization function, gdb_init calls all the _initialize functions,including those for any architectures or remote targets.
Having initialized all the architectures, the first alphabetically is selected as the default archi-tecture by initialize_current_architecture, and its initialization function, (by conventionarch_gdbarch_init) is called.
Control returns to gdb_main, which sits in the command interpreter, waiting for commandsto execute.
2.11.2. The GDB target CommandFigure 2.3 shows the high level sequence diagram for GDB in response to the target command.
current_interp_command_loop
target_open
start_remote
wait_for_inferior
target_wait
handle_inferior_event
normal_stop
Figure 2.3. High level sequence diagram for the GDB target command
The target command maps directly on to the current target to_open. A typical implementa-tion establishes physical connection to the target (for example by opening a TCP/IP link to aremote target). For a remote target, it then typically calls start_remote, which waits for thetarget to stop (using the current target to_wait function), determines the reason for stopping(handle_inferior_event) and then marks this as a normal stop (normal_stop).
handle_inferior_event is a central function in GDB. Whenever control is returned to GDB,via the target to_wait function, it must determine what has happened and how it should be

25 Copyright © 2008 Embecosm Limited
handled. Figure 2.4 shows the behavior of handle_inferior_event in response to the targetcommand.
handle_inferior_event
read_pc_pid
gdbarch_register_type
target_fetch_registers
watchpoints_triggered
target_stopped_by_watchpoint
repeat
Figure 2.4. handle_inferior_event sequence diagram in response to the GDB targetcommand
handle_inferior_event needs to establish the program counter at which execution stopped,so calls read_pc_pid. Since the program counter is a register, this causes creation of a regis-ter cache, for which the type of each register must be determined by gdbarch_register_type(a one-off exercise, since this never changes). Having determined register types, the regis-ter cache is populated with the value of the program counter by calling the current targetto_fetch_registers for the relevant register.
handle_inferior_event then determines if the stop was due to a breakpoint or watchpoint. Thefunction watchpoints_triggered uses the target target_stopped_by_watchpoint to determineif it was a watchpoint which triggered the stop.
The call to normal_stop also invokes the struct gdbarch functions, calling gdbarch_unwind_pcto establish the current program counter and and frame sniffer functions to establish theframe sniffer stack.
2.11.3. The GDB load CommandFigure 2.5 shows the high level sequence diagram for GDB in response to the load command.This maps to the current target's to_load function, which in most cases will end up callingthe current target's to_xfer_partial function once for each section of the image to load itinto memory.
repeat
current_interp_command_loop
target_load
target_xfer_partial
Figure 2.5. Sequence diagram for the GDB load command
The load function will capture data from the loaded file, most importantly its start addressfor execution.
2.11.4. The GDB break CommandFigure 2.6 shows the high level sequence diagram for GDB in response to the break command.This example is for the case where the target of the break is a symbol (i.e. a function name)in the target executable.

26 Copyright © 2008 Embecosm Limited
current_interp_command_loop
parse_breakpoint_sals
gdbarch_skip_prologue
break_command
Figure 2.6. Sequence diagram for the GDB break command
Most of the action with breakpoints occurs when the program is set running, at which anyactive breakpoints are installed. However for any break command, the address for the breakmust be set up in the breakpoint data structure.
For symbolic addresses, the start of the function can be obtained from the line number in-formation held for debugging purposes in the symbol table (known as symbol-and-line infor-mation, or SAL). For a function, this will yield the start address of the code. However thebreakpoint must be set after the function prologue. gdbarch_skip_prolog is used to find thataddress in the code.
2.11.5. The GDB run CommandFigure 2.7 shows the high level sequence diagram for GDB in response to the run command.
current_interp_command_loop
run_command
target_create_inferior
target_find_description
proceed
gdbarch_single_step_through_delay
target_insert_breakpoint
target_resume
wait_for_inferior
normal_stop
Figure 2.7. High level sequence diagram for the GDB run command
The run command must create the inferior, insert any active breakpoints and watchpoints,and then start execution of the inferior. Control does not return to GDB until the target reportsthat it has stopped.
The top level function implementing the run command is run_command. This creates the inferi-or, but calling the current target's to_create_inferior function. GDB supports targets whichcan give a dynamic description of their architecture (for example the number of registers avail-able). This is achieved through the to_find_description function of the current target (whichis an empty function by default).
Execution is started by the proceed. This must first determine if the code is restart-ing on an instruction which will need stepping through a delay slot (so that code nev-

27 Copyright © 2008 Embecosm Limited
er stops on a delay slot). If this functionality is required, it is implemented by thegdbarch_single_sep_through_delay function.
Active breakpoints are inserted using the current target's to_insert_breakpoint function. Thecode is then run using the to_resume function of the current target.
GDB then calls wait_for_inferior, which will wait for the target to stop, and then determinethe reason for the stop. Finally normal_stop will remove the breakpoints from the target codeand report to the user the current state of the target as appropriate.
Much of the detailed processing takes place in the wait_for_inferior and normal_stop func-tions (see also their use in Section 2.11.2). These are important functions and it is useful tolook at their behavior in more detail.
Figure 2.8 shows the sequence diagram for wait_for_inferior when handling the GDB runcommand.
wait_for_inferior
target_wait
handle_inferior_event
watchpoints_triggered
target_stopped_by_watchpoint
Figure 2.8. Sequence diagram for the GDB wait_for_inferior function as used by therun command
Once again the key work is in handle_inferior_event. The code checks for watchpoints usingthe to_stopped_by_watchpoint function of the current target. The function also checks break-points, but since it already knows the current program counter (set by target_wait when con-trol is returned), it needs no further call to the target operations. target_wait will have report-ed if it stopped due to an exception that could be due to a breakpoint. handle_inferior_eventcan then look up the program counter in the list of active breakpoints, to determine whichbreakpoint was encountered.
Figure 2.9 shows the sequence diagram for normal_stop when handling the GDB run com-mand. In this example the stop was due to the target encountering a breakpoint.
normal_stop
remove_breakpoints
target_remove_breakpoint
arch_frame_sniffer
print_stack_frame
arch_frame_this_id
repeat
Figure 2.9. Sequence diagram for the GDB normal_stop function as used by the runcommand
The first action is to remove breakpoints. This ensures that the target executable is returnedto its normal state, without any trap or similar code inserted.

28 Copyright © 2008 Embecosm Limited
The frame sniffers for the target are identified, using the frame sniffer for the architecture,arch_frame_sniffer. The current stack frame is then printed for the user. This requires use ofthe frame sniffer to identify the ID (and hence all the other data) of THIS frame from the NEXTframe (arch_frame_this_id here). print_stack_frame will start from the sentinel frame andwork inwards until it finds the stack frame containing the current stack pointer and programcounter.
2.11.6. The GDB backtrace CommandFigure 2.10 shows the high level sequence diagram for GDB in response to the backtracecommand. This sequence shows the behavior for the first call to backtrace after control hasreturned to GDB.
repeat x 2
repeat
current_interp_command_loop
backtrace_command
print_frame_info
print_frame
print_frame_args
get_func_type
Figure 2.10. High level sequence diagram for the GDB backtrace commandThe main command function is backtrace_command, which uses print_frame_info to print thename of each function on the stack with its arguments.
The first frame is already known from the program counter and stack pointer of the stoppedtarget, so is printed out by print_frame. That will ultimately use the current target'sto_xfer_partial function to get the local argument values.
Since this is the first backtrace after the program stopped, the stack pointer and programcounter are each obtained from the sentinel frame using get_func_type. print_frame is thencalled for each frame in turn as the stack is unwound until there are no more stack frames.The information in each frame is built up using the architecture's frame sniffers.
It is useful to look at print_frame in more detail. Figure 2.11 shows the sequence diagramfor the second series of calls to the print_frame function when handling the GDB backtracecommand, used to print out the stack frame.
repeat
print_frame
print_frame_args
gdbarch_unwind_pc
gdbarch_unwind_sp
read_var_value
arch_frame_prev_sniffer
Figure 2.11. Sequence diagram for the GDB print_frame function used by the backtracecommand

29 Copyright © 2008 Embecosm Limited
The information about the function on the stack frame can be obtained from the programcounter and stack pointer associated with the stack frame. These are obtained by calls to thegdbarch_unwind_pc and gdbarch_unwind_sp functions.
Then for each argument, its value must be printed out. The symbol table debug data willidentify the arguments, and enough information for GDB to work out if the value is on thestack or in a register. The frame sniffer function to get registers from the stack frame (in thisexample arch_frame_prev_register) is used to get the values of any registers as appropriate.
The precise sequence of calls depends on the functions in the stack frame, the arguments theyhave, and whether those arguments are in registers or on the stack.
2.11.7. The GDB continue Command after a BreakpointThe final sequence shows the behavior when execution is resumed after a breakpoint with thecontinue command. Figure 2.12 shows the high level sequence diagram for GDB in responseto the continue command. This sequence shows the behavior for the first call to continueafter a run stopped due to a breakpoint.
current_interp_comm...
continue_command
proceed
wait_for_inferior
target_wait
handle_inferior_event
target_resume
normal_stopsingle-stepped continuous
Figure 2.12. High level sequence diagram for the GDB continue command after abreakpoint
The command functionality is provided by the continue_command, which calls the proceedfunction for much of its behavior.
proceed calls the to_resume function of the current target to resume execution. For this firstcall, the breakpoint(s) removed when execution completed after the run command are notreplaced and the target resumption is only for a single instruction step. This allows the targetto be stepped past the breakpoint without triggering an exception.
proceed then uses wait_for_inferior to wait for control to return after the single step anddiagnose the next action. Waiting uses the to_wait function of the current target, then callshandle_inferior_event to analyze the result. In this case, handle_inferior_event determinesthat a target has just stepped past a breakpoint. It reinserts the breakpoints and calls thetarget to_resume function again, this time to run continuously.
wait_for_inferior will use the current target to_wait function again to wait for the target tostop executing, then again call the handle_inferior_event to process the result. This time,control should return to GDB, so breakpoints are removed, and handle_inferior_event andwait_for_inferior return. proceed calls normal_stop to tidy up and print out a message aboutthe current stack frame location where execution has stopped (see Section 2.11.5.).

30 Copyright © 2008 Embecosm Limited
It is useful to examine the behavior of the first call to handle_inferior_event, to see the se-quence for completing the single step and resuming continuous execution. Figure 2.13 showsthe sequence diagram for the first call to handle_inferior_event.
handle_inferior_event
repeat
target_stopped_by_watchpoint
gdbarch_single_step_through_delay
keep_going
target_insert_breakpoint
target_resume
Figure 2.13. Sequence diagram for the GDB handle_inferior_event function after singlestepping an instruction for the continue command
handle_inferior_event first determines if a watchpoint has now been triggered. If this is notthe case, it checks if the processor is now in the delay slot of an instruction (requiring anothersingle-step immediately). Having determined that continuous execution is appropriate, it callsthe function keep_going to reinsert active breakpoints (using the to_insert_breakpoint func-tion of the current target). Finally it calls the to_resume function of the current target withoutthe single-step flag set to resume continuous execution.
2.12. Summary: Steps to Port a New Architecture to GDBPorting a new architecture to GDB can be broken into a number of steps.
• Ensure a BFD exists for executables of the target architecture in the bfd directory. If onedoes not exist, create one by modifying an existing similar one.
• Implement a disassembler for the target architecture in the opcodes directory.
• Define the target architecture in the gdb directory. Add the pattern for the new targetto configure.tgt with the names of the files that contain the code. By convention thetarget architecture definition for an architecture arch is placed in arch-tdep.c.Within arch-tdep.c define the function _initialize_arch_tdep which callsgdbarch_register to create the new struct gdbarch for the architecture.
• If a new remote target is needed, consider adding a new remote target by defining a func-tion _initialize_remote_arch. However if at all possible use the Remote Serial Protocolfor this and implement the server side protocol independently with the target.
• If desired implement a simulator in the sim directory. This should create the librarylibsim.a implementing the interface in remote-sim.h (found in the include directory).
• Build and test. If desired, lobby the GDB steering group to have the new port includedin the main distribution!
• Add a description of the new architecture to the "Configuration Specific Information"section in the main GDB user guide (gdb/doc/gdb.texinfo [3]).
The remainder of this document shows how this process was used to port GDB to the Open-RISC 1000 architecture.

31 Copyright © 2008 Embecosm Limited
Chapter 3. The OpenRISC 1000 ArchitectureThe OpenRISC 1000 architecture defines a family of free, open source RISC processor cores.It is a 32 or 64-bit load and store RISC architecture designed with emphasis on performance,simplicity, low power requirements, scalability and versatility.
The OpenRISC 1000 is fully documented in its Architecture Manual [8].
From a debugging perspective, there are three data areas that are manipulated by the instruc-tion set.
1. Main memory. A uniform address space with 32 or 64-bit addressing. Provision for sep-arate or unified instruction and data and instruction caches. Provision for separate orunified, 1 or 2-level data and instruction MMUs.
2. General Purpose Registers (GPRs). Up to 32 registers, 32 or 64-bit in length.
3. Special Purpose Registers (SPRs). Up to 32 groups each with up to 2048 registers, upto 32 or 64-bit in length. These registers provide all the administrative functionalityof the processor: program counter, processor status, saved exception registers, debuginterface, MMU and cache interfaces, etc.
The Special Purpose Registers (SPRs) represent a challenge for GDB, since they representneither addressable memory, nor have the characteristics of a register set (generally modestin number).
A number of SPRs are of particular significance to the GDB implementation.
• Configuration registers. The Unit Present register (SPR 1, UPR), CPU Configuration register(SPR 2, CPUCFGR) and Debug Configuration register (SPR 7, DCFGR) identify the featuresavailable in the particular OpenRISC 1000 implementation. This includes the instructionset in use, number of general purpose registers and configuration of the hardware debuginterface.
• Program counters. The Previous Program Counter (SPR 0x12, PPC) is the address of theinstruction just executed. The Next Program Counter (SPR 0x10, NPC) is the address ofthe next instruction to be executed. The NPC is the value reported by GDBs $pc variable.
• Supervision Register. The supervision register (SPR 0x11, SR) represents the current sta-tus of the processor. It is the value reported by GDBs status register variable, $ps.
Of particular importance are the SPRs in group 6 controlling the debug unit (if present). Thedebug unit can trigger a trap exception in response to any one of up to 10 watchpoints. Watch-points are logical expressions built by combining matchpoints, which are simple point tests ofparticular behavior (has a specified address been accessed for example).
• Debug Value and Control registers. There are up to 8 pairs of Debug Value (SPR 0x3000–0x3007, DVR0 through DVR7) and Debug Control (SPR 0x3008–0x300f, DCR0 through DCR7)registers. Each pair is associated with one hardware matchpoint. The Debug Value reg-ister in each pair gives a value to compare against. The Debug Control register indicateswhether the matchpoint is enabled, the type of value to compare against (instructionfetch address, data load and/or store address data load and/or store value) and thecomparison to make (equal, not equal, less than, less than or equal, greater than, greaterthan or equal), both signed and unsigned. If the matchpoint is enabled and the test met,the corresponding matchpoint is triggered.

32 Copyright © 2008 Embecosm Limited
• Debug Watchpoint counters. There are two 16-bit Debug Watchpoint Counter registers(SPR 0x3012–0x3013, DWCR0 and DWCR1), associated with two further matchpoints. Theupper 16 bits are a value to match, the lower 16 bits a counter. The counter is incre-mented when specified matchpoints are triggered (see Debug Mode register 1). When thecount reaches the match value, the corresponding matchpoint is triggered.
!CautionThere is potential ambiguity in that counters are incremented in response tomatchpoints and also generate their own matchpoints. It is not good practiceto set a counter to increment on its own matchpoint!
• Debug Mode registers. There are two Debug Mode registers to control the behavior of thethe debug unit (SPR 0x3010–0x3011, DMR1 and DMR2). DMR1 provides a pair of bits foreach of the 10 matchpoints (8 associated with DVR/DCR pairs, 2 associated with coun-ters). These specify whether the watchpoint is triggered by the associated matchpoint,by the matchpoint AND-ed with the previous watchpoint or by the matchpoint OR-edwith the previous watchpoint. By building chains of watchpoints, complex logical testsof hardware behavior can be built up.Two further bits in DMR1 enable single step behavior (a trap exception occurs on comple-tion of each instruction) and branch step behavior (a trap exception occurs on comple-tion of each branch instruction).
DMR2 contains an enable bit for each counter, 10 bits indicating which watchpoints areassigned to which counter and 10 bits indicating which watchpoints generate a trap ex-ception. It also contains 10 bits of output, indicating which watchpoints have generateda trap exception.
• Debug Stop and Reason registers. In normal operation, all OpenRISC 1000 exceptionsare handled through the exception vectors at locations 0x100 through 0xf00. The DebugStop register (SPR 0x3014, DSR) is used to assign particular exceptions instead to theJTAG interface. These exceptions stall the processor, allowing the machine state to beanalyzed through the JTAG interface. Typically a debugger will enable this for trap ex-ceptions used for breakpointing.Where an exception has been diverted to the development interface, the Debug Reasonregister (SPR 0x3021, DRR) indicates which exception caused the diversion. Note thatalthough single stepping and branch stepping cause a trap, if they are assigned to theJTAG interface, they do not set the TE bit in the DRR. This allows an external debuggerto distinguish between breakpoint traps and single/branch step traps.
3.1. The OpenRISC 1000 JTAG InterfaceThere are two variants of the JTAG interface for use with the OpenRISC 1000.
1. The original JTAG interface was created as part of the OpenRISC SoC project, ORPSoC[10]. It provides three scan chains: one to access to all the SPRs, one to access externalmemory and one providing control of the CPU. The control scan chain reset, stall ortrace the processor.
2. A new JTAG interface was provided by Igor Mohor in 2004 [11]. It provides the sameaccess to SPRs and external memory, but offers a simpler control interface offering onlythe ability to stall or reset the processor.
At present the OpenRISC Architectural Simulator, Or1ksim, (see Section 3.4) supports thefirst of these interfaces.
Three scan chains are provided by both interfaces

33 Copyright © 2008 Embecosm Limited
• RISC_DEBUG (scan chain 1), providing read/write access to the SPRs.
• REGISTER (scan chain 4), providing control of the CPU. In the ORPSoC interface, thisprovides multiple registers which are read and written to control the CPU. Of theseregister 0, MODER, which controls hardware trace, and register 4, RISC_OP, which controlsreset and stall are the most important. Trace is enabled by setting, and disabled byclearing bit 1 in MODER. Reset and processor stall are triggered and cleared by settingand clearing respectively bit 1 and bit 0 in RISC_OP. The stall state may be determinedby reading the stall bit in RISC_OP.In the Mohor interface, there is a single control register which behaves identically toRISC_OP in the original debug interface.
• WISHBONE (scan chain 5), providing read/write access to main memory.
Since the General Purpose Registers (GPRs) are mapped to SPR group 0, this mechanism alsoallows GPRs to be read and written.
3.2. The OpenRISC 1000 Remote JTAG Protocol
!ImportantThe latest version of GDB for OpenRISC 1000 implements the GDB Remote SerialProtocol, which is the preferred mechanism for connecting to remote targets [2].
However the protocol described here is retained for backward compatibility. It isused here as a tutorial vehicle to illustrate how a custom debugging protocol canbe used within GDB
To facilitate remote debugging by GDB, the OpenRISC defines a software protocol describingJTAG accesses, suitable for transport over TCP/IP via a socket interface.
NoteThis protocol pre-dates the GDB Remote Serial Protocol (see Section 2.7). At somefuture date the OpenRISC 1000 Remote JTAG Protocol will be replaced by the RSP.
The OpenRISC 1000 Remote JTAG Protocol is a simple message send/acknowledge protocol.The JTAG request is packaged as a 32 bit command, 32-bit length and series of 32-bit datawords. The JTAG response is packaged as a 32-bit status and optionally a number of 32-bitdata words. The commands available are:
• OR1K_JTAG_COMMAND_READ (1). Read a single JTAG register. A 32-bit address is providedin the request. The response includes 64-bits of read data.
• OR1K_JTAG_COMMAND_WRITE (2). Write a single JTAG register. A 32-bit address is providedin the request and 64-bit data to be written.
• OR1K_JTAG_COMMAND_READ_BLOCK (3). Read multiple 32-bit JTAG registers. A 32-bit ad-dress of the first register and number of registers to be read is provided in the request.The response includes the number of registers read and 32-bits of data for each one read.
• OR1K_JTAG_COMMAND_WRITE_BLOCK (4). Write multiple 32-bit JTAG registers. A 32-bit ad-dress of the first register and number of registers to be written is provided in the requestfollowed by 32-bits of data to be written for each register.
• OR1K_JTAG_COMMAND_CHAIN (5). Select the scan chain. A 32-bit scan chain number is pro-vided in the request.
Where the Mohor version of the JTAG interface is being used, addresses for read/write accessesto the REGISTER scan chain are ignored—there is only one control register.

34 Copyright © 2008 Embecosm Limited
NoteThere is apparently a contradiction in this protocol. Provision is made for individualregisters to be read/written as 64 bits, whereas block read/writes (provided forcommunication efficiency) are only 32-bits.
Figure 3.1 shows the structures of all five requests and their corresponding (successful) re-sponses. Note that if a request fails, the response will only contain the status word.
OR1K_JTAG_COMMAND_READ
lengthaddress
statusdata (MS word)data (LS word)
OR1K_JTAG_COMMAND_WRITE
lengthaddress
data (MS word)data (LS word)
status
OR1K_JTAG_COMMAND_READ_BLOCK
lengthaddress
num_regs (n)
status
data (register 0)
data (register n-1)
OR1K_JTAG_COMMAND_WRITE_BLOCK
lengthaddress
num_regsdata (register 0)
data (register n-1)
num_regs (n)
status
OR1K_JTAG_COMMAND_CHAIN
lengthscan chain
status
Request Response
Read register
Write register
Read block of registers
Write block of registers
Set scan chain
Figure 3.1. The OpenRISC 1000 Remote JTAG Protocol data structures
The client side of this protocol (issuing the requests) is implemented by the GDB port forOpenRISC 1000.
Server side applications may implement this protocol to drive either physical hardware (viaits JTAG port) or simulations, which include the JTAG functionality. Examples of the formerinclude USB JTAG connectors, such as those produced by ORSoC™ AB. An example of thelatter is the OpenRISC 1000 Architectural Simulator, Or1ksim (see Section 3.4).
3.3. Application Binary Interface (ABI)The ABI for the OpenRISC 1000 is described in Chapter 16 of the Architecture Manual [8].However the actual GCC compiler implementation differs very slightly from the documented

35 Copyright © 2008 Embecosm Limited
ABI. Since precise understanding of the ABI is critical to GDB, those differences are docu-mented here.
• Register Usage: R12 is used as another callee-saved register. It is never used to returnthe upper 32 bits of a 64-bit result on a 32-bit architecture. All values greater than 32-bits are returned by a pointer.
• Although the specification requires stack frames to be double word aligned, the currentGCC compiler implements single word alignment.
• Integral values more than 32 bits (64 bits on 64-bit architectures), structures and unionsare returned as pointers to the location of the result. That location is provided by thecalling function, which passes it as a first argument in GPR 3. In other words, where afunction returns a result of this type, the first true argument to the function will appearin R4 (or R5/R6 if it is a 64-bit argument on a 32-bit architecture).
3.4. Or1ksim: the OpenRISC 1000 Architectural SimulatorOr1ksim is an instruction set simulator (ISS) for the OpenRISC 1000 architecture. At presentonly the 32-bit architecture is modeled. In addition to modeling the core processor, Or1ksimcan model a number of peripherals, to provide the functionality of a complete System-on-Chip(SoC).
Or1ksim models the OpenRISC 1000 JTAG interface and implements the OpenRISC 1000Remote JTAG protocol server side. It was used as the testbed for this port of GDB
The JTAG interface models the behavior of the old ORPSoC (with support for multiple controlregisters and hardware trace). A future release will provide an option to support Igor Mohor'sJTAG interface.
NotePorting GDB uncovered a number of bugs in Or1ksim. The implementation is nowquite old, and predates the current OpenRISC 1000 specification. A patch (availablefrom www.embecosm.com/download.html) is available to fix these bugs.

36 Copyright © 2008 Embecosm Limited
Chapter 4. Porting the OpenRISC 1000ArchitectureThis chapter describes the steps in porting the OpenRISC 1000 architecture to GDB. It usesthe information and data structures described in Chapter 2.
The OpenRISC 1000 version of GDB is documented briefly in the GDB User Guide [3].A more comprehensive tutorial [6] is provided within the gdb/doc sub-directory in the fileor1k.texinfo.
Strictly speaking this was not a new port. An old port existed for GDB 5.3. However GDBhas changed substantially since that time, and an almost complete reimplementation wasrequired.
TipWhen working with any large code base a TAGS file is invaluable. This allows im-mediate lookup of any procedure or variable across the entire code base. Normallyfor any GNU project, this is achieved with the command make tags. However thisdoes not work for GDB—there is a problem with the tags target in the opcodesdirectory.
However tags building does work in the gdb directory, so a TAGS file can be builtin that directory by:
cd gdbmake tagscd ..
4.1. BFD SpecificationThe BFD specification for OpenRISC 1000 already existed (it is part of binutils), so there wasno need to implement this. The existing code is just reused.
4.2. OpenRISC 1000 Architecture SpecificationThe code resides in the gdb sub-directory. The main architectural specification is in or1k-tdep.c, with and OpenRISC 1000 wide header in or1k-tdep.h. Support for the OpenRISC 1000Remote JTAG interface is in remote-or1k.c with the detailed protocol in or1k-jtag.c and aprotocol header in or1k-jtag.h.
There are several targets which can use the OpenRISC 1000 architecture. These all beginor16, or32 or or32. The configure.tgt is edited to add patterns for these that will pick up thebinaries generated from these source files.
or16* | or32* | or64*) # Target: OpenCores OpenRISC 1000 architecture gdb_target_obs="or1k-tdep.o remote-or1k.o or1k-jtag.o" ;;

37 Copyright © 2008 Embecosm Limited
!Cautionconfigure.tgt only specifies binaries, so cannot show dependencies on headers.To correct this, Makefile.in can be edited, so that automake and configure willgenerate a Makefile with the correct dependencies.
The architecture definition is created from the _initialize_or1k_tdep by a call togdbarch_register. That function also initializes the disassembler (build_automata) and addstwo new commands: a sub-command to the info command to read SPRs and a new top levelsupport command, spr to set the value of SPRs.
4.2.1. Creating struct gdbarchgdbarch_register is called for BFD type bfd_arch_or32 with the initialization functionor1k_gdbarch_init and the target specific dump function, or1k_dump_tdep.
Future implementations may make additional calls to use the same function to create a 64-bit version of the architecture.
gdbarch_init receives the struct gdbarch_info created from the BFD entries and the list ofexisting architectures. That list is first checked, using gdbarch_list_lookup_by_info to seeif there is already an architecture defined suitable for the given struct gdbarch_info and ifso it is returned.
Otherwise a new struct gdbarch is created. For that the target dependencies are saved in anOpenRISC 1000 specific struct gdbarch_tdep, defined in or1k-tdep.h.
struct gdbarch_tdep{ unsigned int num_matchpoints; unsigned int num_gpr_regs; int bytes_per_word; int bytes_per_address;};
This is information beyond that which is held in the struct gdbarch. By using this structure,the GDB implementation for OpenRISC 1000 can be made flexible enough to deal with both32 and 64-bit implementations and with variable numbers of registers and matchpoints.
!CautionAlthough this flexibility is built in to the code, the current implementation has onlybeen tested with 32-bit OpenRISC 32 registers.
The new architecture is then created by gdbarch_alloc, passing in the struct gdbarch_infoand the struct gdbarch_tdep. The struct gdbarch is populated using the variousset_gdbarch_ functions, and OpenRISC 1000 Frame sniffers are associated with the architec-ture.
When creating a new struct gdbarch a function must be provided to dump the target specificdefinitions in struct gdbarch_tdep to a file. This is provided in or1k_dump_tdep. It is passeda pointer to the struct gdbarch and a file handle and simply writes out the fields in thestruct gdbarch_tdep with suitable explanatory text.
4.2.2. OpenRISC 1000 Hardware Data RepresentationThe first entries in struct gdbarch initialize the size and format of all the standard data types.

38 Copyright © 2008 Embecosm Limited
set_gdbarch_short_bit (gdbarch, 16);set_gdbarch_int_bit (gdbarch, 32);set_gdbarch_long_bit (gdbarch, 32);set_gdbarch_long_long_bit (gdbarch, 64);set_gdbarch_float_bit (gdbarch, 32);set_gdbarch_float_format (gdbarch, floatformats_ieee_single);set_gdbarch_double_bit (gdbarch, 64);set_gdbarch_double_format (gdbarch, floatformats_ieee_double);set_gdbarch_long_double_bit (gdbarch, 64);set_gdbarch_long_double_format (gdbarch, floatformats_ieee_double);set_gdbarch_ptr_bit (gdbarch, binfo->bits_per_address);set_gdbarch_addr_bit (gdbarch, binfo->bits_per_address);set_gdbarch_char_signed (gdbarch, 1);
4.2.3. Information Functions for the OpenRISC 1000 ArchitectureThese struct gdbarch functions provide information about the architecture.
set_gdbarch_return_value (gdbarch, or1k_return_value);set_gdbarch_breakpoint_from_pc (gdbarch, or1k_breakpoint_from_pc);set_gdbarch_single_step_through_delay (gdbarch, or1k_single_step_through_delay);set_gdbarch_have_nonsteppable_watchpoint (gdbarch, 1);switch (gdbarch_byte_order (gdbarch)) { case BFD_ENDIAN_BIG: set_gdbarch_print_insn (gdbarch, print_insn_big_or32); break;
case BFD_ENDIAN_LITTLE: set_gdbarch_print_insn (gdbarch, print_insn_little_or32); break;
case BFD_ENDIAN_UNKNOWN: error ("or1k_gdbarch_init: Unknown endianism"); break; }
• or1k_return_value. This function tells GDB how a value of a particular type would bereturned by the ABI. Structures/unions and large scalars (> 4 bytes) are placed in mem-ory and returned by reference (RETURN_VALUE_ABI_RETURNS_ADDRESS. Smaller scalars arereturned in GPR 11 (RETURN_VALUE_REGISTER_CONVENTION).
• or1k_breakpoint_from_pc returns the breakpoint function to be used at a given programcounter address. Since all OpenRISC 1000 instructions are the same size, this functionalways returns the same value, the instruction sequence for a l.trap instruction.
• or1k_single_step_through_delay. This function is used to determine if a single steppedinstruction is actually executing a delay slot. This is the case if the previously executedinstruction was a branch or jump.

39 Copyright © 2008 Embecosm Limited
• print_insn_big_or32 and print_insn_little_or32. There are two variants of the dis-assembler, depending on the endianism. The disassembler is discussed in more detailin Section 4.4.
4.2.4. OpenRISC 1000 Register ArchitectureThe register architecture is defined by two groups of struct gdbarch functions and fields. Thefirst group specifies the number of registers (both raw and pseudo) and the register numbersof some "special" registers.
set_gdbarch_pseudo_register_read (gdbarch, or1k_pseudo_register_read);set_gdbarch_pseudo_register_write (gdbarch, or1k_pseudo_register_write);set_gdbarch_num_regs (gdbarch, OR1K_NUM_REGS);set_gdbarch_num_pseudo_regs (gdbarch, OR1K_NUM_PSEUDO_REGS);set_gdbarch_sp_regnum (gdbarch, OR1K_SP_REGNUM);set_gdbarch_pc_regnum (gdbarch, OR1K_PC_REGNUM);set_gdbarch_ps_regnum (gdbarch, OR1K_SR_REGNUM);set_gdbarch_deprecated_fp_regnum (gdbarch, OR1K_FP_REGNUM);
The second group of functions provides information about registers.
set_gdbarch_register_name (gdbarch, or1k_register_name);set_gdbarch_register_type (gdbarch, or1k_register_type);set_gdbarch_print_registers_info (gdbarch, or1k_registers_info);set_gdbarch_register_reggroup_p (gdbarch, or1k_register_reggroup_p);
The representation of the raw registers (see Section 2.3.5.3) is: registers 0-31 are the corre-sponding GPRs, register 32 is the previous program counter, 33 is the next program counter(often just called the program counter) and register 34 is the supervision register. For conve-nience, constants are defined in the header, or1k_tdep.h, for all the special registers.
#define OR1K_SP_REGNUM 1#define OR1K_FP_REGNUM 2#define OR1K_FIRST_ARG_REGNUM 3#define OR1K_LAST_ARG_REGNUM 8#define OR1K_LR_REGNUM 9#define OR1K_RV_REGNUM 11#define OR1K_PC_REGNUM (OR1K_MAX_GPR_REGS + 0)#define OR1K_SR_REGNUM (OR1K_MAX_GPR_REGS + 1)
In this implementation there are no pseudo-registers. A set could have been provided to rep-resent the GPRs in floating point format (for use with the floating point instructions), but thishas not been implemented. Constants are defined for the various totals
#define OR1K_MAX_GPR_REGS 32#define OR1K_NUM_PSEUDO_REGS 0#define OR1K_NUM_REGS (OR1K_MAX_GPR_REGS + 3)#define OR1K_TOTAL_NUM_REGS (OR1K_NUM_REGS + OR1K_NUM_PSEUDO_REGS)

40 Copyright © 2008 Embecosm Limited
!CautionThese totals are currently hard-coded constants. They should really draw on thedata in the struct gdbarch_tdep, providing support for architectures which haveless than the full complement of 32 registers. This functionality will be providedin a future implementation.
One consequence of providing no pseudo-registers is that the frame pointer variable, $fp inGDB will not have its correct value. The provision of this register as an intrinsic part of GDB isno longer supported. If it is wanted then it should be defined as a register or pseudo-register.
However if there is no register with this name, GDB will use either the value of thedeprecated_fp_regnum value in struct gdbarch or the current frame base, as reported by theframe base sniffer.
For the time being, the deprecated_fp_regnum is set. However the longer term plan will be torepresent the frame-pointer as a pseudo-register, taking the value of GPR 2.
The register architecture is mostly a matter of setting the values required in struct gdbarch.However two functions, or1k_pseudo_register_read and or1k_pseudo_register_write are de-fined to provide access to any pseudo-register. These functions are defined to provide hooksfor the future, but in the absence of any pseudo-registers they do nothing.
There are set of functions which yield information about the name and type of registers andwhich provide the output for the GDB info registers command.
• or1k_register_name. This is a simple table lookup to yield the register name from itsnumber.
• or1k_register_type. This function must return the type as a struct type. This GDBdata structure contains detailed information about each type and its relationship toother types.For the purposes of this function, a number of standard types are predefined, withutility functions to construct other types from them. For most registers the predefinedbuiltin_type_int32 is suitable. The stack pointer and frame pointer are pointers to ar-bitrary data, so the equivalent of void * is required. This is constructed by applyingthe function lookup_pointer_type to the predefined builtin_type_void. The programcounter is a pointer to code, so the equivalent of a pointer to a void function is appro-priate. This is constructed by applying lookup_pointer_type and lookup_function_typeto builtin_type.
• or1k_register_info. This function is used by the info registers command to displayinformation about one or more registers.This function is not really needed. It is just a wrapper fordefault_print_registers_info, which is the default setting for this function anyway.
• or1k_register_reggroup_p. This predicate function returns 1 (true) if a given register isin a particular group. This is used by the command info registers when registers in aparticular category are requested.The function as implemented is little different from the default function(default_register_reggroup_p), which is called for any unknown cases anyway. How-ever it does make use of the target dependent data (struct gdbarch_tdep), thus provid-ing flexibility for different OpenRISC 1000 architectures.
4.2.5. OpenRISC 1000 Frame HandlingThe OpenRISC 1000 frame structure is described in its ABI [8]. Some of the detail is slightlydifferent in current OpenRISC implementations—this is described in Section 3.3.

41 Copyright © 2008 Embecosm Limited
The key to frame handling is understanding the prologue (and possibly epilogue) in each func-tion which is responsible for initializing the stack frame. For the OpenRISC 1000, GPR 1 isused as the stack pointer, GPR 2 as the frame pointer and GPR 9 as the return address. Theprologue sequence is:
l.addi r1,r1,-frame_sizel.sw save_loc(r1),r2l.addi r2,r1,frame_sizel.sw save_loc-4(r1),r9l.sw x(r1),ry
The OpenRISC 1000 stack frame accommodates any local (automatic) variables and tempo-rary values, then the return address, then the old frame pointer and finally any stack basedarguments to functions called by this function. This last rule means that the return addressand old frame pointer are not necessarily at the end of the stack frame - enough space willbe left to build up any arguments for called functions that must go on the stack. Figure 4.1shows how the stack looks at the end of the prologue.
Previous FPReturn Address
Local variablesand temporary
values
Stack argumentsto called functions
Stack argumentsto this function FP
FP+4
FP-4FP-8FP-12
SP
StackFrame
Callee savedregisters
SP+save_loc+8SP+save_loc+4SP+save_locSP+save_loc-4
Figure 4.1. The OpenRISC 1000 stack frame at the end of the prologue
Not all fields are always present. The function need not save its return address to stack, andthere may be no callee-saved registers (i.e. GPRs 12, 14, 16, 18, 20, 22, 24, 26, 28 and 30)which require saving. Leaf functions are not required to set up a new stack frame at all.
The epilogue is the inverse. Callee-saved registers are restored, the return address placed inGPR 9 and the stack and frame pointers restored before jumping to the address in GPR 9.
l.lwz ry,x(r1)l.lwz r9,save_loc-4(r1)l.lwz r2,save_loc(r1)l.jr r9l.addi r1,r1,frame_size
Only those parts of the epilogue which correspond to the prologue need actually appear. TheOpenRISC 1000 has a delay slot after branch instructions, so for efficiency the stack restora-tion can be placed after the l.jr instruction.
4.2.5.1. OpenRISC 1000 Functions Analyzing FramesA group of struct gdbarch functions and a value provide information about the current stackand how it is being processed by the target program.

42 Copyright © 2008 Embecosm Limited
set_gdbarch_skip_prologue (gdbarch, or1k_skip_prologue);set_gdbarch_inner_than (gdbarch, core_addr_lessthan);set_gdbarch_frame_align (gdbarch, or1k_frame_align);set_gdbarch_frame_red_zone_size (gdbarch, OR1K_FRAME_RED_ZONE_SIZE);
• or1k_skip_prologue. This function returns the end of the function prologue, if the pro-gram counter is currently in a function prologue.The initial approach is to use the DWARF2 symbol-and-line (SAL) information to identifythe start of the function (find_pc_partial_function and hence the end of the prologue(skip_prologue_using_sal).
If this information is not available, or1k_skip_prologue reuses the helper functionsfrom the frame sniffer function, or1k_frame_unwind_cache (see Section 4.2.5.5) to stepthrough code that appears to be function prologue.
• core_addr_lessthan. This standard function returns 1 (true) if its first argument is alower address than its second argument. It provides the functionality required by thestruct gdbarch inner_than function for architectures like OpenRISC 1000, which havefalling stack frames.
• or1k_frame_align. This function takes a stack pointer and returns a value (expandingthe frame) which meets the stack alignment requirements of the ABI. Since the Open-RISC 1000 ABI uses a falling stack, this uses the built-in function, align_down. Thealignment is specified in the constant OR1K_STACK_ALIGN defined in or1k-tdep.h.
NoteThe OpenRISC 1000 ABI specifies that frames should be double-word aligned.However the version of GCC in the current OpenRISC tool chain imple-ments single-word alignment. So the current GDB implementation specifiesOR1K_STACK_ALIGN to be 4, not 8.
• OR1K_FRAME_RED_ZONE_SIZE. The OpenRISC 1000 reserves the 2,560 bytes below thestack pointer for use by exception handlers and frameless functions. This is knownas a red zone (an AMD term). This constant is recorded in the struct gdbarchframe_red_zone_size field. Any dummy stack frames (see Section 4.2.5.3) will be placedafter this point.
4.2.5.2. OpenRISC 1000 Functions for Accessing Frame Data
set_gdbarch_unwind_pc (gdbarch, or1k_unwind_pc);set_gdbarch_unwind_sp (gdbarch, or1k_unwind_sp);
There are only two functions required here, or1k_unwind_pc and or1k_unwind_sp. Given apointer to the NEXT frame, these functions return the value of respectively the program counterand stack pointer in THIS frame.
Since the OpenRISC architecture defines standard frame sniffers, and both these reg-isters are raw registers, the functions can be implemented very simply by a call toframe_unwind_register_unsigned.
4.2.5.3. OpenRISC 1000 Functions to Create Dummy Stack FramesTwo struct gdbarch provide support for calling code in the target inferior.

43 Copyright © 2008 Embecosm Limited
set_gdbarch_push_dummy_call (gdbarch, or1k_push_dummy_call);set_gdbarch_unwind_dummy_id (gdbarch, or1k_unwind_dummy_id);
• or1k_push_dummy_call. This function creates a dummy stack frame, so that GDB canevaluate a function within the target code (for example in a call command). The inputarguments include all the parameters for the call, including the return address and anaddress where a structure should be returned.The return address for the function is always breakpointed (so GDB can trap the re-turn). This return address is written into the link register (in the register cache) usingregcache_cooked_write_unsigned).
If the function is to return a structure, the address where the structure is to go is passedas a first argument, in GPR 3.
The next arguments are passed in the remaining argument registers (up to GPR 8).Structures are passed by reference to their locating in memory. For 32-bit architecturespassing 64-bit arguments, a pair of registers (3 and 4, 5 and 6 or 7 and 8) are used.
Any remaining arguments must be pushed on the end of the stack. There is a difficultyhere, since pushing each argument may leave the stack misaligned (OpenRISC 1000specifies double-word alignment). So the code first works out the space required, thenadjusts the resulting stack pointer to the correct alignment. The arguments can then bewritten to the stack in the correct location.
• or1k_unwind_dummy_id. This is the inverse of or1k_push_dummy_call. Given a pointer tothe NEXT stack frame (which will be the frame of the dummy call), it returns the frameID (that is the stack pointer and function entry point address) of THIS frame.This is not completely trivial. For a dummy frame, the NEXT frame information aboutTHIS frame is not necessarily complete, so a simple call to frame_unwind_id recurs-es back to this function ad infinitum. Instead the frame information is built by un-wind the stack pointer and program counter and attempting to use DWARF2 sym-bol-and-line (SAL) information to find the start of the function from the PC withfind_pc_partial_function. If that information is not available, the program counter isused as a proxy for the function start address.
4.2.5.4. OpenRISC 1000 Frame SniffersThe preceding functions all have a 1:1 relationship with struct gdbarch. However for stackanalysis (or "sniffing") more than one approach may be appropriate, so a list of functions ismaintained.
The low level stack analysis functions are set by frame_unwind_append_sniffer. The Open-RISC 1000 has its own sniffers for finding the ID of a frame and getting the value of a registeron the frame specified by or1k_frame_sniffer. For all other sniffing functions, the defaultDWARF2 frame sniffer is used, dwarf2_frame_sniffer.
The high level sniffer finds the base of the stack frame. OpenRISC defines its own base sniffer,or1k_frame_base as default. It provides all the functionality needed, so can be used as thedefault base sniffer, set using frame_base_set_default. The frame base is a structure, withentries pointing to the corresponding frame sniffer and functions to give the base address ofthe frame, the arguments on the frame and the local variables on the frame. Since these areall the same for the OpenRISC 1000, the same function, or1k_frame_base_address is usedfor all three.

44 Copyright © 2008 Embecosm Limited
4.2.5.5. OpenRISC 1000 Frame Base SnifferThe same function, or1k_frame_base_address is used to provide all three base functions: forthe frame itself, the local variables and any arguments. In the OpenRISC 1000 these are allthe same value.
or1k_frame_base.unwind = or1k_frame_sniffer (NULL);or1k_frame_base.this_base = or1k_frame_base_address;or1k_frame_base.this_locals = or1k_frame_base_address;or1k_frame_base.this_args = or1k_frame_base_address;frame_base_set_default (gdbarch, &or1k_frame_base);
The specification of this function requires the end of the stack, i.e. the stack pointer.Rather confusingly the function is also used to determine the value of the $fp variable ifdeprecated_fp_regnum has not been set and there is no register with the name "fp". However,as noted earlier, GDB is moving away from an intrinsic understanding of frame pointers. Forthe OpenRISC 1000, deprecated_fp_regnum is currently defined, although in time a pseudoregister will be defined, with the name of fp and mapping to GPR 2.
Like all the frame sniffers, this function is passed the address of the NEXT frame, and requiresthe value for THIS frame, so the value of the stack pointer is unwound from the stack by usingthe generic register unwinder, frame_unwind_register_unsigned.
4.2.5.6. OpenRISC 1000 Low Level Frame SniffersThe function or1k_frame_sniffer returns a pointer to struct frame_unwind with entries forthe functions defined by this sniffer. For the OpenRISC 1000, this defines a custom function toconstruct the frame ID of THIS frame given a pointer to the NEXT frame (or1k_frame_this_id)and a custom function to give the value of a register in THIS frame given a pointer to the NEXTframe (or1k_frame_prev_register).
• or1k_frame_this_id. This function's inputs are a pointer to the NEXT frame and theprologue cache (if any exists) for THIS frame. It uses the main OpenRISC 1000 frameanalyzer, or1k_frame_unwind_cache to generate the prologue cache if it does not exist(see below).From the cached data, the function returns the frame ID. This comprises two values, thestack pointer for this frame and the address of the code (typically the entry point) forthe function using this stack frame
NoteStrictly speaking frame IDs can have a third value, the special address foruse with architectures which have more complex frame structures. Howeverthis is rarely used.
The result is returned in a struct frame_id passed by reference as a third argument.Since the implementation uses the built in struct trad_frame_cache for its registercache, the code can use the trad_frame_get_id function to decode the frame ID fromthe cache.
• or1k_frame_prev_register. This function's inputs are a pointer to the NEXT frame,the prologue cache (if any exists) for THIS frame and a register number. It uses themain OpenRISC 1000 frame analyzer, or1k_frame_unwind_cache to generate the pro-logue cache if it does not exist (see below).From the cached data, a flag is returned indicating if the register has been optimized out(this is never the case), what sort of l-value the register represents (a register, memory

45 Copyright © 2008 Embecosm Limited
or not an l-value), the address where it is saved in memory (if it is saved in memory), thenumber of a different register which holds the value of this register (if that is the case) andif a buffer is provided the actual value as obtained from memory or the register cache.
Since the implementation uses the built in struct trad_frame_cache for its registercache, the code can use the trad_frame_get_register function to decode all this infor-mation from the cache.
The OpenRISC 1000 low level sniffers rely on or1k_frame_unwind_cache. This is the heart ofthe sniffer. It must determine the frame ID for THIS frame given a pointer to the NEXT frameand then the information in THIS frame about the values of registers in the PREVIOUS frame.
All this data is returned in a prologue cache (see Section 2.3.6), a reference to which is passedas an argument. If the cache already exists for THIS frame it can be returned immediatelyas the result.
If the cache does not yet exist, it is allocated (using trad_frame_cache_zalloc). The first stepis to unwind the start address of this function from the NEXT frame. The DWARF2 informationin the object file can be used to find the end of the prologue (using skip_prologue_using_sal).
The code then works through each instruction of the prologue to find the data required.
!CautionThe analysis must only consider prologue instructions that have actually been ex-ecuted. It is quite possible the program counter is in the prologue code, and onlyinstructions that have actually been executed should be analyzed.
The stack pointer and program counter are found by simply unwinding the NEXT frame.The stack pointer is the base of THIS frame, and is added to the cache data usingtrad_frame_set_this_base.
end_iaddr marks the end of the code we should analyze. Only instructions with addresses lessthan this will be considered.
The l.addi instruction should be first and its immediate constant field is the size of the stack.If it is missing, then this is a frameless call to a function. If the program counter is right atthe start of the function, before the stack and frame pointers are set up, then it will also looklike a frameless function.
Unless it is subsequently found to have been saved on the stack, the program counter of thePREVIOUS frame is the link register of THIS frame and can be recorded in the register cache.
TipIt is essential to save the register data using the correct function.
• Use trad_frame_set_reg_realreg when a register in the PREVIOUS frame isobtained from a register in THIS frame.
• Use trad_frame_set_reg_addr when a register in the PREVIOUS frame is ob-tained from an address in THIS frame.
• Use trad_frame_set_reg_value when a register in the PREVIOUS frame is aparticular value in THIS frame.
The default entry for each register is that its value in the PREVIOUS frame is ob-tained from the same register in THIS frame.
For a frameless call, there is no more information to be found, so the rest of the code analysisonly applies if the frame size was non-zero.
46 Copyright © 2008 Embecosm Limited
The second instruction in the prologue is where the frame pointer of the PREVIOUS frameis saved. It is an error if this is missing. The address where it is saved (the stack point-er of THIS frame plus the offset in the l.sw instruction) is saved in the cache usingtrad_frame_set_reg_addr.
The third instruction should be an l.addi instruction which sets the frame pointer. The framesize set in this instruction should match the frame size set in the first instruction. Once thishas been set up, the frame pointer can be used to yield the stack pointer of the previous frame.This information is recorded in the register cache.
The fourth instruction is optional and saves the return address to the stack. If this instructionis found, the entry in the register cache for the program counter in the PREVIOUS frame mustbe changed using trad_frame_set_reg_addr to indicate it is found at an address in this frame.
All the subsequent instructions in the prolong should be saves of callee-savable registers.These are checked for until the code address has reached the end of the prologue. For eachinstruction that is found, the save location of the register is recorded in the cache usingtrad_frame_set_reg_addr.
The detailed analysis in or1k_frame_unwind_cache uses a series of helper func-tions: or1k_frame_size, or1k_frame_fp_loc, or1k_frame_size_check, or1k_link_address andor1k_get_saved_reg. These helper routines check each of the instructions in the prologue. Bybreaking out this code into separate functions, they can be reused by or1k_skip_prologue.
4.3. OpenRISC 1000 JTAG Remote Target SpecificationThe code for the remote target specification for the OpenRISC Remote JTAG protocol is foundin the gdb sub-directory. remote-or1k.c contains the target definition. The low-level interfaceis found in or1k-jtag.c with a shared header in or1k-jtagh.
The low-level interface is abstracted to a set of OpenRISC 1000 specific functions relating tothe behavior of the target. Two implementations are provided (in or1k-jtag.c), one for targetsconnected directly through the host's parallel port, and one for targets connected over TCP/IP using the OpenRISC 1000 Remote JTAG Protocol.
void or1k_jtag_init (char *args);void or1k_jtag_close ();ULONGEST or1k_jtag_read_spr (unsigned int sprnum);void or1k_jtag_write_spr (unsigned int sprnum, ULONGEST data);int or1k_jtag_read_mem (CORE_ADDR addr, gdb_byte *bdata, int len);int or1k_jtag_write_mem (CORE_ADDR addr, const gdb_byte *bdata, int len);void or1k_jtag_stall ();void or1k_jtag_unstall ();void or1k_jtag_wait (int fast);
The choice of which implementation to use is determined by the argument to or1k_jtag_init.
• or1k_jtag_init and or1k_jtag_close. Initialize and close a connection to the target.or1k_jtag_init is passed an argument string with the address of the target (either a

47 Copyright © 2008 Embecosm Limited
local device or a remote TCP/IP port address). An optional second argument, reset canbe provided to indicate the target should be reset once connected.
• or1k_jtag_read_spr and or1k_jtag_write_spr. Read or write a special purpose register.
• or1k_jtag_read_mem and or1k_jtag_write_mem. Read or write a block of memory.
• or1k_jtag_stall and or1k_jtag_unstall. Stall or unstall the target.
• or1k_jtag_wait. Wait for the target to stall.
The binaries for the remote target interface (remote-or1k.o and or1k-jtag.o) are added tothe configure.tgt file for the OpenRISC targets. As noted in Section 4.2, this only specifiesbinaries, so dependencies on headers cannot be captured. To do this requires editing theMakefile.in.
TipAs a shortcut for a simple port, editing Makefile.in can be omitted. Instead, touchthe target specific C source files before calling make to ensure they are rebuilt.
4.3.1. Creating struct target_ops for OpenRISC 1000
The remote target is created by defining the function _initialize_remote_or1k. A newstruct target_ops, or1k_jtag_target is populated and added as a target by callingadd_target.
The majority of the target operations are generic to OpenRISC 1000, and independent of theactual low level interface. This is achieved by abstracting the low level interface through theinterface functions described in Section 4.3.
Having established all the target functions, the target is added by calling add_target
When a target is selected (with the GDB target jtag command), the set of target operationschosen for use with the OpenRISC 1000 architecture will be referred to by the global variable,or1k_target, defined in or1k-tdep.c.
NoteGDB has its own global variable, current_target, which refers to the current setof target operations. However this is not sufficient, since even though a target maybe connected via the OpenRISC remote interface, it may not be the current target.The use of strata by GDB means there could possibly be another target which isactive at the same time.
Much of the operation of the target interface involves manipulating the debug SPRs. Ratherthan continually writing them out to the target, a cache of their values is maintained inor1k_dbgcache, which is flushed prior to any operation that will unstall the target (thus caus-ing it to execute).
4.3.2. OpenRISC 1000 Target Functions and Variables Providing InformationA group of variables and functions give the name of the interface and different types of infor-mation.
• to_shortname. This is the name of the target for use when connecting in GDB. For theOpenRISC 1000, it is "jtag", so connection in GDB will be established by using thecommand target jtag ....

48 Copyright © 2008 Embecosm Limited
• to_longname. A brief description of the command for use by the GDB info target com-mand.
• to_doc. The help text for this target. The first sentence is used for general help aboutall targets, the full text for help specifically about this target. The text explains how toconnect both directly and over TCP/IP.
• or1k_files_info. This function provides the initial information for info target. For theOpenRISC 1000 it provides the name of the program being run on the target, if known.
OpenRISC remote targets are always executable, with full access to memory, stack, registersetc once the connection is established. A set of variables in struct target_ops for Open-RISC 1000 records this.
• to_stratum. Since the OpenRISC 1000 target can execute code, this field is set toprocess_stratum.
• to_has_all_memory, to_has_memory, to_has_stack and to_has_registers. Once theOpenRISC 1000 target is connected, it has access to all its memory, a stack and regis-ters, so all these fields are set to 1 (true).
• to_has_execution. When the connection is initially established, the OpenRISC 1000processor will be stalled, so is not actually executing. So this field is initialized to 0 (false).
• to_have_steppable_watchpoint and to_have_continuable_watchpoint. These flags in-dicate whether the target can step through a watchpoint immediately after it has beenexecuted, or if the watchpoint can be immediate continued without having any effect.If the OpenRISC 1000 triggers a hardware watchpoint, the instruction affected will nothave completed execution, so must be re-executed (the code cannot continue). Further-more the watchpoint must be temporarily disabled while re-executing, or it will triggeragain (it is not steppable). Thus both these flags are set to 0 (false).
4.3.3. OpenRISC 1000 Target Functions Controlling the ConnectionThese functions control the connection to the target. For remote targets this involves settingup and closing down a TCP/IP socket link to the server driving the hardware. For local targetsit involves opening and closing the device.
• or1k_open. This is passed the arguments to the target jtag command and establishesthe connection to the target. The arguments are the address of the target (either a localdevice, or a TCP/IP host/port specification) and an optional second argument resetindicating the target should be reset on connection.Any existing connections are tidied up by target_preopen and any instances of thistarget are removed from the target stack by unpush_target.
Connection is then established through the low level interface routine, or1k_jtag_init,which resets the target if requested.
With the connection established, the target's Unit Present SPR is checked to verify it hasa debug unit available. Data about the number of GPRs and matchpoints is read fromthe CPU Configuration SPR and used to update struct gdbarch_tdep.
The target processor is then stalled, to prevent further execution, with a 1000μs waitto allow the stall to complete.
The debug cache is cleared, and the Debug Stop SPR set to trigger the JTAG interface ontrap exceptions (which are used for debug breakpoints, watchpoints and single stepping).The cache will be written out to the SPRs before execution recommences.

49 Copyright © 2008 Embecosm Limited
Having established a connection, the target is pushed on to the stack. It is markedrunning, which sets all the flags associated with a running process and updates thechoice of current target (which depending on the stratum could be this target). How-ever, the OpenRISC connection is established with the target processor stalled, so theto_has_execution flag is cleared by setting the macro target_has_execution to 0. It willbe set when or1k_resume unstalls the target.
As a matter of good housekeeping, any shared library symbols are cleared usingno_shared_libraries.
GDB identifies all inferior executables by their process and thread ID. This port of theOpenRISC 1000 is for bare metal debugging, so there is no concept of different processesthat may be executing. Consequently the null_ptid is used as the process/thread IDfor the target. This is set in the GDB global variable inferior_pid.
NoteIt is important that the inferior process/thread ID is established at this earlystage, so that the target can always be uniquely identified.
Finally the generic start_remote is called to set up the new target ready for execution. Itis possible this could fail, so the call is wrapped in a function, or1k_start_remote, whichhas the correct prototype to run using catch_exception. If failure occurs, the target canbe popped, before the exception is thrown on to the top level.
• or1k_close. This closes the connection by calling the low level interface function,or1k_jtag_close. The target will already have been unpushed and the inferior mourned(see Section 4.3.6), so these actions are not required.
• or1k_detach. This just detaches from the target being debugged, which is achieved bycalling or1k_close.There is no explicit function to reattach to the target, but a call to or1k_open (by givinga target jtag command in GDB) will achieve the same effect.
4.3.4. OpenRISC 1000 Target Functions to Access Memory and RegistersThese are a group of functions to access the registers and memory of the target.
• or1k_fetch_registers. This function populates the register cache from the actual targetregisters. The interface to the OpenRISC 1000 only provides for reading of memory orSPRs. However the GPRs are mapped into the SPR space, so can be read in this way.
• or1k_store_registers. This is the inverse of or1k_fetch_registers. It writes the con-tents of the register cache back to the physical registers on the target.
• or1k_prepare_to_store. GDB allows for targets which need some preparatory work be-fore storing, so provides this function. It is not needed for the OpenRISC 1000, so justreturns.
• or1k_xfer_partial. This is the generic function for reading and writing objects fromand to the target. However the only class of object which needs be supported isread and write from memory. This is achieved through the low-level interface routinesor1k_jtag_read_mem and or1k_jtag_write_mem.
• generic_load. This generic function is used as the to_load function of the target opera-tions. There is nothing special about loading OpenRISC 1000 images. This function willcall the or1k_xfer_partial function to transfer the bytes for each section of the image.

50 Copyright © 2008 Embecosm Limited
4.3.5. OpenRISC 1000 Target Functions to Handle Breakpoints and WatchpointsThe OpenRISC 1000 can support hardware breakpoints and watchpoints, if matchpoints arefree in the debug unit.
NoteBeware of confusion over the term "watchpoint". It is used in GDB to mean a loca-tion, being watched for read or write activity. These may be implemented in hard-ware or software.
If implemented in hardware, they may make use of the OpenRISC 1000 DebugUnit mechanism, which also uses the term watchpoint. This document uses theterms "GDB watchpoint" and "OpenRISC 1000 watchpoint" where there is any riskof confusion.
• or1k_set_breakpoint. This is the underlying OpenRISC 1000 function which sets ahardware breakpoint if one is available. This is controlled through the Debug Value Reg-ister and Debug Control Register. This function is used by the target operation functionsor1k_insert_breakpoint and or1k_insert_hw_breakpoint.The first free hardware matchpoint is found by searching through the DebugControl Registers for a register without its DVR/DCR Preset (DP) flag set usingor1k_first_free_matchpoint.
The Debug Value Register is set to the address of the breakpoint and the Debug ControlRegister to trigger when the unsigned effective address of the fetched instruction is equalto the Debug Value Register. The corresponding OpenRISC 1000 watchpoint is markedas unchained in Debug Mode Register 1 and set to trigger a trap exception in DebugMode Register 2.
• or1k_clear_breakpoint. This is the counterpart to or1k_set_breakpoint. It is called bythe target operation functions remove_breakpoint and remove_hw_breakpoint.The Debug Control Registers are searched for an entry matching the given address (usingor1k_matchpoint_equal). If a register is found, its DVR/DCR Present flag is cleared, andthe matchpoint marked unused in Debug Mode Register 2.
• or1k_insert_breakpoint. This function inserts a breakpoint. It tries to inserta hardware breakpoint using or1k_set_breakpoint. If this fails, the genericmemory_insert_breakpoint is used to set a software breakpoint.
• or1k_remove_breakpoint. This is the counterpart to or1k_insert_breakpoint. It tries toclear a hardware breakpoint, and if that fails tries to clear a software breakpoint usingthe generic memory_remove_breakpoint.
• or1k_insert_hw_breakpoint and or1k_remove_hw_breakpoint. These functions are sim-ilar to or1k_insert_breakpoint and or1k_remove_breakpoint. However if a hardwarebreakpoint is not available, they do not attempt to use a software (memory) breakpointinstead.
• or1k_insert_watchpoint. This function attempts to insert a GDB hardware watchpoint.For this it requires a pair of OpenRISC 1000 watchpoints chained together. The firstwill check for a memory access greater than or equal to the start address of interest.The second will check for a memory access less than or equal to the end address ofinterest. If both criteria are met. The access type can be the load effective address (forGDB rwatch watchpoints), store effective address (for GDB watch watchpoints) or both(for GDB awatch watchpoints).The pair of OpenRISC 1000 watchpoints must be adjacent (so they can be chained to-gether using Debug Mode Register 1), but it is possible that successive breakpoints

51 Copyright © 2008 Embecosm Limited
have fragmented the use of OpenRISC 1000 watchpoints. or1k_watchpoint_gc is usedto shuffle up all the existing OpenRISC 1000 watchpoints which can be moved, to finda pair if possible.
• or1k_remove_watchpoint. This is the counterpart of or1k_insert_watchpoint. Itsearches for an adjacent pair of OpenRISC 1000 watchpoints that match usingor1k_matchpoint_equal. If found both are marked unused in their Debug Control Reg-ister and cleared from triggering in Debug Mode Register 2.
• or1k_stopped_by_watchpoint and or1k_stopped_data_address. These functions arecalled to find out about GDB watchpoints which may have triggered. Both makeuse of the utility function, or1k_stopped_watchpoint_info, which determines if aGDB watchpoint was triggered, if so which watchpoint and for what address.or1k_stopped_watchpoint just returns a Boolean to indicate if a watchpoint was trig-gered. or1k_stopped_data_address is called once for each watchpoint that has triggered.It returns the address that triggered the watchpoint and must also clear the watchpoint(in Debug Mode Register 2).
4.3.6. OpenRISC 1000 Target Functions to Control ExecutionWhen the run command is used to start execution with GDB it needs to establish the exe-cutable on the inferior, and then start execution. This is done using the to_create_inferiorand to_resume functions of the target respectively.
Once execution has started, GDB waits until the target to_wait function returns control.
In addition the target provides operations to stop execution.
• or1k_resume. This is the function which causes the target program to run. It is called inresponse to the run, step, stepi, next and nexti instructions.The behavior of this function is far simpler than its counterpart in GDB 5.3, whichrequired complex logic to re-execute instructions after a breakpoint or watchpoint.GDB 6.8 will sort out all the issues of re-execution after a breakpoint or watchpoint hasbeen encountered (see or1k_wait below for more on this).
The function clears the Debug Reason Register, clears any watchpoint status bits inDebug Mode Register 2 and then commits the debug registers.
If the caller has requested single stepping, this is set using Debug Mode Register 1,otherwise this is cleared.
Finally the target can be marked as executing (the first time or1k_resume is called itwill not be marked as executing), the debug registers written out, and the processorunstalled.
• or1k_wait . This function waits for the target to stall, and analyzes the cause. Informa-tion about why the target stalled is returned to the caller via the status argument. Thefunction returns the process/thread ID of the process which stalled, although for theOpenRISC 1000 this will always be the same value.While waiting for the target to stall (using or1k_jtag_wait), a signal handler is installed,so the user can interrupt execution with ctrl-C.
After the wait returns, all register and frame caches are invalid, These are cleared bycalling registers_changed (which in turn clears the frame caches).
When the processor stalls, the Debug Reason Register (a SPR) shows the reason for thestall. This will be due to any exception set in the Debug Stop Register (currently only

52 Copyright © 2008 Embecosm Limited
trap), due to a single step, due to a reset (the debugger stalls the processor on reset) or(when the target is the architectural simulator, Or1ksim) due to an exit l.nop 1 beingexecuted.
In all cases the previous program counter SPR points to the instruction just executed andthe next program counter SPR to the instruction about to be executed. For watchpointsand breakpoints, which generate a trap however the instruction at the previous programcounter will not have completed execution. As a result, when the program resumes, thisinstruction should be re-executed without the breakpoint/watchpoint enabled.
GDB understands this. It is sufficient to set the program counter to the previous programcounter. GDB will realize that the instruction corresponds to a breakpoint/watchpointthat has just been encountered, lift the breakpoint, single step past the instruction andreimpose the breakpoint. This is achieved by a call to write_pc with the previous programcounter value.
The OpenRISC 1000 imposes a slight problem here. The standard GDB approach worksfine, except if the breakpoint was in the delay slot of a branch or jump instruction. In thiscase the re-execution must be not just of the previous instruction, but the one before that(restoring the link register as well if it was a jump-and-link instruction). Furthermorethis must only be in the case where the branch was truly the preceding instruction,rather than the delay slot having been the target of a different branch instruction.
In the absence of a "previous previous" program counter, this restart cannot be correctunder all circumstances. For the time being, breakpoints on delay slots are not expectedto work. However it is highly unlikely a source level debugger would ever place a break-point in a delay slot.
A more complete solution for the future would use the struct gdbarchadjust_breakpoint_address to move any breakpoint requested for a delay slot, to insistthe breakpoint is placed on the preceding jump or branch. This would work for all butthe most unusual code, which used a delay slot as a branch target.
Having sorted out the program counter readjustment, any single step is marked asthough it were a trap. Single step does not set the trap exception, nor does it need re-executing, but by setting the flag here, the exception will be correctly mapped to theTARGET_SIGNAL_TRAP for return to GDB
The response is marked as a a stopped processor (TARGET_WAITKIND_STOPPED). All excep-tions are mapped to their corresponding GDB signals. If no exception has been raised,then the signal is set to the default, unless the instruction just executed was l.nop 1,which is used by the architectural simulator to indicate termination. In this case theresponse is marked as TARGET_WAITKIND_EXITED, and the associate value set to the exitreturn code.
The debug reason register (which is sticky) can now be cleared and the process/threadID returned.
• or1k_stop. This stops the processor executing. To achieve this cleanly, the processoris stalled, single step mode is set and the processor unstalled, so execution will havestopped at the end of an instruction.
• or1k_kill. This is a more dramatic termination, when or1k_stop has failed to give sat-isfaction. Communication with the target is assumed to have broken down, so the targetis then mourned, which will close the connection.
• or1k_create_inferior. This sets up a program to run on the target, but does not actuallystart it running. It is called in response to the GDB run command and is passed any

53 Copyright © 2008 Embecosm Limited
arguments to that command. However the OpenRISC 1000 JTAG protocol has no wayto send arguments to the target, so these are ignored.Debugging is much easier if a local copy of the executable symbol table has been loadedwith the file command. This is checked for and a warning issued. However if it is notpresent, it is perfectly acceptable to debug code on the OpenRISC 1000 target withoutsymbol data.
All static data structures (breakpoint lists etc) are then cleared within GDB by callinginit_wait_for_inferior.
TipIf GDB for the OpenRISC 1000 is used with ddd the warning about passingarguments will often be triggered. This occurs when ddd is asked to run aprogram in a separate execution window, which it attempts to achieve bycreating an xterm and redirecting I/O via pseudo-TTYs to that xterm. Theredirections are arguments to the GDB run command.
GDB for OpenRISC 1000 does not support this. The run in separate windowoption should be disabled with ddd.
• or1k_mourn_inferior. This is the counterpart to or1k_create_inferior, calledafter execution has completed. It tidies up by calling the generic functiongeneric_mourn_inferior. If the target is still shown as having execution, it is marked asexited, which will cause the selection of a new current target.
4.3.7. OpenRISC 1000 Target Functions to Execute CommandsThe OpenRISC 1000 target does not really have a way to execute commands. However imple-menting SPR access as remote commands provides a mechanism for access, which is inde-pendent of the target access protocol. In particular the GDB architecture need know nothingabout the actual remote protocol used.
SPR access is implemented as though the target were able to run two commands, readspr to geta value from a SPR and writespr to set a value in a SPR. Each takes a first argument, specifiedin hexadecimal, which is the SPR number. writespr takes a second argument, specified inhexadecimal, which is the value to be written. readspr returns the value read as a numberin hexadecimal.
When access is needed to the SPRs it is achieved by passing one of these commands as argu-ment to the to_rcmd function of the target.
• or1k_rcmd. The command to execute (readspr or writespr) is passed as the first argu-ment. Results of the command are written back throug the second argument, which isa UI independent file handle.readspr is mapped to the corresponding call to or1k_jtag_read_spr. writespr is mappedto the corresponding call to or1k_jtag_write_spr. In the case of an error (for examplebadly formed command), the result "E01" is returned. If writespr is successful, "OK"is returned as result. If readspr is successful, the value as hexadecimal is returned asresult. In all cases the result is written as a string to the UI independent file handlespecified as second argument to the function.
4.3.8. The Low Level JTAG InterfaceThe interface to the OpenRISC JTAG system is found in gdb/or1k-jtag.c and gdb/or1k-jtag.h. The details are not directly relevant to porting GDB so only an overview is given here.Full details are found in the commenting within the source code.

54 Copyright © 2008 Embecosm Limited
The interface is layered, to maximize use. In particular much of the functionality is the samewhether the target is connected remotely over TCP/IP or directly via a JP1 header connectedto the parallel port.
• The highest level is the public function interface, which operate in terms of entities thatare visible in GDB: open and close the connection, read and write SPRs, read and writememory, stall, unstall and wait for the processor. These functions always succeed andhave function prefixes or1k_jtag_.
• The next level is the abstraction provided by the OR1K JTAG protocol: read/write a JTAGregister, read/write a block of JTAG registers and select a scan chain. These functionsmay encounter errors and will deal with them, but otherwise return no error result.These are static functions (i.e. local to this file), with prefixes or1k_jtag_.
• The next level is in two sets, one for use with a locally connected (JP1) JTAG and one fora remote connection over TCP/IP corresponding to the functions in the previous layer.These functions detect with errors and return an error code to indicate an error hasoccurred. These are static functions with prefixes: jp1_ and jtr_ respectively.
• The final level comes in separate flavors for locally connected JTAG (low level routines todrive the JP1 interface) and remote use (to build and send/receive packets over TCP/IP).These functions detect errors and return an error code to indicate an error has occurred.These are static function with prefixes jp1_ll_ and jtr_ll_ respectively.
Errors are either dealt with silently or (if fatal) via the GDB error function.
!CautionFew people now use the JP1 direct connection, and there is no confidence that thiscode works at all!
4.4. The OpenRISC 1000 DisassemblerThe OpenRISC 1000 disassembler is part of the wider binutils utility set and is foundin the opcodes sub-directory. It provides two versions of the disassembly function,print_insn_big_or32 and print_insn_little_or32 for use with big-endian and little-endianimplementations of the architecture in or32-dis.c
The instruction decode uses a finite state automaton (FSA) in or32-opc.c. This is constructedat start-up by the function build_automata from a table describing the instruction set. Thisfunction is invoked from the _initialize_or1k_tdep function immediately after the Open-RISC 1000 architecture has been defined.
The disassembler takes advantage of any symbol table information to replace branch and jumptargets by symbolic names where possible.
4.5. OpenRISC 1000 Specific Commands for GDBSection 2.5 describes how to extend the GDB command set. For the OpenRISC 1000 architec-ture, the info command is extended to show the value of SPRs (info spr) and a new command,spr is added to set the value of a SPR1.
Both these commands are added in _initialize_or1k_tdep after the architecture has beencreated and the disassembler automata initialized.
1 There is a strong case for this being a new sub-command of the set. However the spr command was introduced inGDB 5.0, and there is no point in replacing it now.

55 Copyright © 2008 Embecosm Limited
4.5.1. The info spr CommandThe new sub-command for info is added using add_info
add_info ("spr", or1k_info_spr_command, "Show the value of a special purpose register");
The functionality is provided in or1k_info_spr_command. The user can specify a group by nameor number (the value of all registers in that group is displayed), or a register name (the valueof that register is displayed) or a group name/number and register name/number (the valueof that register in the group is displayed).
The arguments are broken out from the text of the command using or1k_parse_params, whichalso handles any errors in syntax or semantics. If the arguments are successfully parsed theresults are then printed out using the UI independent function, ui_out_field_fmt.
The SPR is read using the convenience function or1k_read_spr. This converts the access toa call of the command readspr, which can be passed to the target usings its to_rcmd targetoperation (see Section 4.3.7). This will allow the SPR to be accessed in the way most appropriateto the current target access method.
4.5.2. The spr CommandThis new top level command is added, classified as a support command (class_support), usingthe add_com command.
The functionality is provided in or1k_spr_command. This also uses or1k_parse_spr_params toparse the arguments, although there is now one more (the value to set). The new value iswritten into the relevant SPR and the change recorded using ui_out_field_fmt.
The SPR is written using the convenience function or1k_write_spr. This converts the accessto a call of the command writespr, which can be passed to the target usings its to_rcmdtarget operation (see Section 4.3.7). This will allow the SPR to be accessed in the way mostappropriate to the current target access method.

56 Copyright © 2008 Embecosm Limited
Chapter 5. SummaryThis application note has described in detail the steps required to port GDB to a new archi-tecture. That process has been illustrated using the port for the OpenRISC 1000 architecture.
Suggestions for corrections or improvements are welcomed. Please contact the author [email protected].

57 Copyright © 2008 Embecosm Limited
Glossary
Application Binary InterfaceThe low-level interface between an application program and the operating system, thusensuring binary compatibility between programs.
big endianA description of the relationship between byte and word addressing on a computer archi-tecture. In a big endian architecture, the least significant byte in a data word resides atthe highest byte address (of the bytes in the word) in memory.The alternative is little endian addressing.
See also: little endian.
Binary File Descriptor (BFD)A package which allows applications to use the same routines to operate on object fileswhatever the object file format [5]. A new object file format can be supported simply bycreating a new BFD back end and adding it to the library.
Common Object File Format (COFF)A specification of a format for executable, object code, and shared library computer filesused on Unix systems. Now largely replaced by ELFSee also: Executable and Linkable Format (ELF).
Executable and Linkable Format (ELF)a common standard file format for executables, object code, shared libraries, and coredumps. It is the standard binary file format for Unix and Unix-like systems on x86, whereit has largely replaced COFF.Formerly known as the Extensible Linking Format.
See also: Common Object File Format (COFF).
frame pointerIn stack based languages, the stack pointer typically refers to the end of the local frame.The frame pointer is a second register, which refers to the beginning of the local frame.Not all stack based architectures make use of a frame pointer.See also: Stack Frame.
General Purpose Register (GPR)In the OpenRISC 1000 architecture, one of between 16 and 32 general purpose integerregisters.Although these registers are general purpose, some have specific roles defined by the ar-chitecture and the ABI. GPR 0 is always 0 and should not be written to. GPR 1 is the stackpointer, GPR 2 the frame pointer and GPR 9 the return address set by l.jal (known as thelink register) and l.jalr instructions. GPR 3 through GPR 8 are used to pass argumentsto functions, with scalar results returned in GPR 11.
See also: Application Binary Interface.

58 Copyright © 2008 Embecosm Limited
Joint Test Action Group (JTAG)JTAG is the usual name used for the IEEE 1149.1 standard entitled Standard Test AccessPort and Boundary-Scan Architecture for test access ports used for testing printed circuitboards and chips using boundary scan.This standard allows external reading of state within the board or chip. It is thus a naturalmechanism for debuggers to connect to embedded systems.
little endianA description of the relationship between byte and word addressing on a computer archi-tecture. In a little endian architecture, the least significant byte in a data word resides atthe lowest byte address (of the bytes in the word) in memory.The alternative is big endian addressing.
See also: big endian.
Memory Management Unit (MMU)A hardware component which maps virtual address references to physical memory ad-dresses via a page lookup table. An exception handler may be required to bring non-exis-tent memory pages into physical memory from backing storage when accessed.On a Harvard architecture (i.e. with separate logical instruction and data address spaces),two MMUs are typically needed.
Real Time Executive for Multiprocessor Systems (RTEMS)An operating system for real-time embedded systems offering a POSIX interface. It offersno concept of processes or memory management.
Special Purpose Register (GPR)In the OpenRISC 1000 architecture, one of up to 65536 registers controlling all aspects ofthe processor. The registers are arranged in groups of 2048 registers. The present archi-tecture defines 12 groups in total.In general each group controls one component of the processor. Thus there is a group tocontrol the DMMU, the IMMU the data and instruction caches and the debug unit. Group0 is the system group and includes all the system configuration registers, the next andprevious program counters, supervision register and saved exception registers.
stack frameIn procedural languages, a dynamic data structure used to hold the values of local vari-ables in a procedure at a particular point of execution.Typically successive stack frames are placed next to each other in a linear data area. Thelast address of the current stack frame is pointed to by a register, known as the stackpointer. It will be the first address of the next stack pointer.
See also: frame pointer.
System on Chip (SoC)A silicon chip which includes one or more processor cores.

59 Copyright © 2008 Embecosm Limited
References[1] Embecosm Application Note 2. The OpenCores OpenRISC 1000 Simulator and Tool Chain:
Installation Guide. Issue 3. Embecosm Limited, November 2008.
[2] Embecosm Application Note 4. Howto: GDB Remote Serial Protocol: Writing a RSP Server.Embecosm Limited, November 2008.
[3] Debugging with GDB: The GNU Source-Level Debugger, Richard Stallman, Roland Pesch,Stan Shebbs, et al, issue 9. Free Software Foundation 2008 . http://sourceware.org/gdb/current/onlinedocs/gdb_toc.html
[4] GDB Internals: A guide to the internals of the GNU debugger, John Gillmore and StanShebbs, issue 2. Cygnus Solutions 2006 . http://sourceware.org/gdb/current/on-linedocs/gdbint_toc.html
[5] libbfd: The Binary File Descriptor Library, Steve Chamberlain, issue 1. Cygnus Solutions2006.
[6] Debugging the OpenRISC 1000 with GDB: Target Processor Manual, Jeremy Bennett,issue 1. Embecosm Limited June 2008 . http://www.embecosm.com/downloads/or1k/or1k.html
[7] Doxygen: Source code documentation generator tool, Dimitri van Heesch, 2008 . http://www.doxygen.org
[8] OpenRISC 1000 Architectural Manual, Damjan Lampret, Chen-Min Chen, Marko Mlinar,Johan Rydberg, Matan Ziv-Av, Chris Ziomkowski, Greg McGary, Bob Gardner, RohitMathur and Maria Bolado, November 2005 . http://www.opencores.org/cvsget.cgi/or1k/docs/openrisc_arch.pdf
[9] Texinfo: The GNU Documentation Format Robert J Chassell and Richard Stallman, issue4.12. Free Software Foundation 9 April, 2008 .
[10] OpenRISC 1000: ORPSoC Damjan Lampret et al. OpenCores http://opencores.org/projects.cgi/web/or1k/orpsoc
[11] SoC Debug Interface Igor Mohor, issue 3.0. OpenCores 14 April, 2004 . http://opencores.org/cvsweb.shtml/dbg_interface/doc/DbgSupp.pdf

60 Copyright © 2008 Embecosm Limited
IndexSymbols_initialize functions, 21, 24_initialize_arch_os_nat, 18_initialize_arch_remote, 24_initialize_arch_tdep, 5, 24, 30_initialize_or1k_tdep, 6, 6, 37, 54, 54_initialize_remote_arch, 18, 30_initialize_remote_or1k, 47
AABI, 57
and function prologue, 13OpenRISC 1000 (see OpenRISC 1000)
accessor functionsstruct gdbarch, 5
address space, 3add_com, 55add_info, 55add_target, 18, 47align_down, 14align_up, 14Application Binary Interface (see ABI)arch-os-nat.c file, 18arch-tdep.c file, 30arch_frame_prev_register, 29arch_frame_prev_sniffer, 29arch_frame_sniffer, 28arch_frame_this_id, 28arch_gdbarch_init, 24
Bbacktrace_command, 28BFD, 4, 30, 57
back end, 4OpenRISC 1000 (see OpenRISC 1000)User Guide, 1, 59
source (see documentation)bfd directory, 22bfd.texinfo file, 23bfd_arch_or32, 4, 37Binary File Descriptor (see BFD)binutils, 4, 22, 23
disassembly function, 9, 54breakpoint
functions in struct gdbarch, 8, 8, 8, 9functions in struct target_ops, 20, 20, 20in hardware, 20, 20
for OpenRISC 1000, 49, 50, 50, 50
insertion and removal, 8instruction
for OpenRISC 1000, 38restriction on location, 8size, 8
program counter adjustment after, 9reinsertion when continuing, 29, 30, 52restarting after, 52
problem with OpenRISC 1000, 52break_command, 26build_automata, 37, 54byte order, 7
Ccatch_exception, 49class_support, 55cli-cmds.h file, 21cmdlist, 21, 21COFF, 4
and OpenRISC 1000, 4config sub-directory, 22
(see also gdb directory)config/arch/nm-os.h file, 18config/arch/os.mh file, 18configure command, 22configure.tgt
header file dependencies, 37OpenRISC 1000 targets supported, 36
configure.tgt file, 6, 18, 30, 47(see also GDB configuration)gdb_sim parameter, 21target matching, 22
continue_command, 29convenience macros
for struct target_ops, 17core_addr_greaterthan, 14core_addr_lessthan, 14, 42CPU Configuration Register (see SpecialPurpose Register )CPUCFGR (see Special Purpose Register )current target (see target operations)current_interp_command_loop, 24, 24, 25,26, 26, 28, 29current_target, 17, 47
DDCFGR (see Debug Configuration Register)DCR (see Debug Control Register)ddd

61 Copyright © 2008 Embecosm Limited
problem with argument passing, 53Debug Configuration Register (see SpecialPurpose Register)Debug Control Register (see Special PurposeRegister)Debug Mode Register (see Special PurposeRegister)Debug Reason Register (see Special PurposeRegister)Debug Stop Register (see Special PurposeRegister)Debug Unit, 31
availability, 48GDB hardware breakpoint
insertion, 50removal, 50
GDB hardware watchpointinsertion, 50removal, 51restarting after, 48
JTAG interface, 32access to General Purpose Registers, 33access to main memory, 33access to Special Purpose Registers, 33CPU control, 33direct connection (parallel port), 46error handling, 54Igor Mohor version, 32, 34, 59JP1 interface limitations, 54layered interface, 54ORPSoC version, 32, 59remote connection over TCP/IP (see Re-mote JTAG Protocol)scan chains, 32
matchpoint, 32, 50registers (see Special Purpose Register)watchpoint, 32, 49watchpoint counter, 32
Debug Value Register (see Special PurposeRegister)Debug Watchpoint Counter Register (seeSpecial Purpose Register)default_memory_insert_breakpoint , 8default_memory_remove_breakpoint , 8default_print_registers_info , 10default_register_reggroup_p , 10defs.h file, 22DejaGNU, 23delay slot
in OpenRISC 1000, 38, 41struct gdbarch functions to handle, 9
disassembly, 9, 23, 30for OpenRISC 1000, 39, 54
DMR (see Debug Mode Register)documentation, 30
building, 23automatic, 23
HTML output format, 23info output format, 23PDF output format, 23PostScript output format, 23source, 23
BFD User Guide, 23GDB Internals document, 23GDB User Guide, 23, 30OpenRISC 1000 Target GDB UserGuide, 36, 59
Doxygen, 59use with GDB for OpenRISC 1000, 2
DRR (see Debug Reason Register)DSR (see Debug Stop Register)dummy frame (see stack frame)dummy target (see target operations)DVR (see Debug Value Register)DWARF2, 43, 45dwarf2_frame_sniffer, 43DWCR (see Debug Watchpoint Counter Reg-ister)
EELF, 4
and OpenRISC 1000, 4Embecosm, 2endianism, 57, 58enum bfd_architecture, 4enum command_class, 5exec, 3
(see also program)executable (see exec)
Ffind_pc_partial_function, 42, 43frame (see stack frame)frame base sniffer (see struct frame_base)frame number (see stack frame)frame pointer, 11, 12, 57
in OpenRISC 1000, 39, 57value in $fp (see GDB)value in stack frame (see stack frame)
frameless function (see stack frame)frame_base_append_sniffer, 15frame_base_set_default, 15, 43frame_pointer
in OpenRISC 1000, 44frame_unwind_append_sniffer, 15, 15, 43frame_unwind_id, 43

62 Copyright © 2008 Embecosm Limited
frame_unwind_register_unsigned , 42, 44frame ID (see stack frame)function epilogue (see OpenRISC 1000)function prologue, 13 (see OpenRISC 1000)
cache (see prologue cache)
GGDB
built in variables$fp, 10, 17, 44$pc, 31$ps, 9, 31
configuration, 6(see also configure.tgt file)
Internals document, 1, 1, 7, 36, 59source (see documentation)
naming conventions, 6new architecture description, 6signals, 52TAGS file, 36target creation, 17UI independent output, 55, 55User Guide, 1, 59
source (see documentation)value types (see struct type)
GDB commandsadding new commands, 5, 21
for OpenRISC 1000, 54awatch, 50backtrace, 15, 28break, 25call, 4, 14, 43classification, 5continue, 29disassemble, 23file, 53hbreak, 50help, 21help target, 18help target, 48help target jtag , 48implementation functions
add_alias_cmd, 21add_cmd, 21add_com, 21add_info, 21add_prefix_cmd, 21callback functions, 21
info, 21, 55info sim, 21info spr, 37, 54, 55info target, 18, 18info registers, 40
info target, 48, 48internal representation, 5next, 51nexti, 51print, 15procedure flows (see procedure flows)run, 19, 26, 51, 51, 53rwatch, 50set breakpoint auto-hw off , 20spr, 37, 54, 55step, 51stepi, 51target, 18, 19, 24, 25target remote, 22target jtag, 47, 47target sim, 21watch, 50
gdb directory, 22, 30, 36, 46gdb.log file, 23gdb.sum file, 23gdb.texinfo file, 23, 30gdb/or1k-jtag.c file, 53gdb/or1k-jtag.h file, 54gdb/testsuite sub-directory, 23gdbarch.h file, 7gdbarch_alloc, 7, 37gdbarch_list_lookup_by_info, 6, 37gdbarch_register, 6, 6, 30, 37, 37gdbarch_register_type (see accessor func-tions)gdbarch_single_step_through_delay (see ac-cessor functions)gdbarch_skip_prologue (see accessor func-tions)gdbarch_unwind_pc (see accessor_functions)gdbarch_unwind_sp (see accessor_functions)gdbint.texinfo file, 23gdb_byte, 11gdb_init, 24gdb_main, 24General Purpose Register, 31, 57
access via JTAG interface (see DebugUnit, JTAG interface, access to GeneralPurpose Registers )
generic_load, 49generic_mourn_inferior, 53get_func_type, 28glibc, 23GPRs (see General Purpose Register)
Hhandle_inferior_event, 24, 27, 29hardware breakpoint (see breakpoint)

63 Copyright © 2008 Embecosm Limited
hardware watchpoint (see watchpoint)Harvard architecture, 15, 58header dependencies, 47
(see also Makefile.in file)
Iinclude directory, 22, 30inferior, 3
process IDfor OpenRISC 1000, 49
remote creation, 20, 51, 53remote destruction (mourning), 20, 52, 53
inferior_pid, 49info spr (see GDB commands)infolist, 21initialize_current_architecture, 24init_wait_for_inferior, 53
Jjp1_ functions, 54jp1_ll_ functions, 54JTAG, 58 (see Debug Unit)jtr_ functions, 54jtr_ll_ functions, 54
Kkeep_going, 30
Llibiberty, 23
floating point formats, 8libsim.a file, 21, 30Linux
and OpenRISC 1000, 4linux_trad_target, 18
MMakefile.in file, 47
touch command as alternative to chang-ing , 47
matchpoint (see Debug Unit)
Nnative debugging, 3
target creation, 17, 18next frame (see stack frame)Next Program Counter (see Special PurposeRegister)nm.h file, 18normal_stop, 24, 27, 27, 29no_shared_libraries, 49NPC (see Next Program Counter)null_ptid, 49
Oopcodes directory, 23, 54OpenRISC 1000
ABI, 8, 41, 43argument passing, 35result return register, 35stack frame alignment, 35, 42variations from documented standard,35, 42
additional GDB commands, 37architecture, 31
GPRs (see General Purpose Register)information functions, 38main memory, 31manual, 59SPRs (see Special Purpose Register)
bare metal debugging, 3, 49BFD, 37
variations from documented standard,36
breakpoint instruction, 38creating new struct gdbarch for, 6creating new struct target_ops for, 47endianism, 39frame handling, 41function epilogue, 41function prologue, 41hardware data representation, 38hardware matchpoints and watchpoints,50, 50
distinction from GDB watchpoint, 50interrupt during debugging, 51legacy GDB 5.3 port, 36link register, 43, 45, 46, 52, 57naming conventions, 6red zone, 14, 42register assignment in GDB, 10, 39, 41register types in GDB, 40Remote JTAG Protocol (see Remote JTAGProtocol)source files for GDB port, 36supported targets in GDB, 36tool chain, 4, 59
or1k-jtag.c, 36or1k-jtag.c file, 46or1k-jtag.h, 36or1k-jtag.h file, 46or1k-jtag.o file, 47or1k-tdep.c, 36or1k-tdep.c file, 47or1k-tdep.h, 36or1k-tdep.h file, 37

64 Copyright © 2008 Embecosm Limited
Or1ksim, 35bug fixes, 35debug interface variants, 35exit handling in GDB, 52
or1k_breakpoint_from_pc, 38or1k_clear_breakpoint, 50or1k_close, 49, 49or1k_create_inferior, 53or1k_dbgcache, 47, 49or1k_detach, 49or1k_dump_tdep, 37, 37or1k_fetch_registers, 49or1k_files_info, 48or1k_first_free_matchpoint, 50OR1K_FP_REGNUM, 39or1k_frame_align, 42or1k_frame_base, 43or1k_frame_base_address, 43, 44or1k_frame_fp_loc, 46or1k_frame_prev_register, 44, 44OR1K_FRAME_RED_ZONE_SIZE, 42or1k_frame_size, 46or1k_frame_size_check, 46or1k_frame_sniffer, 43, 44, 44or1k_frame_this_id, 44or1k_frame_unwind_cache, 42, 44, 44or1k_gdbarch_init, 6, 37or1k_get_saved_reg, 46or1k_info_spr_command, 55or1k_insert_breakpoint, 50, 50or1k_insert_hw_breakpoint, 50, 50or1k_insert_watchpoint, 50or1k_jtag_ functions, 54, 54or1k_jtag_close, 47, 49OR1K_JTAG_COMMAND_CHAIN, 33OR1K_JTAG_COMMAND_READ, 33OR1K_JTAG_COMMAND_READ_BLOCK, 33OR1K_JTAG_COMMAND_WRITE, 33OR1K_JTAG_COMMAND_WRITE_BLOCK ,33or1k_jtag_init, 47, 48or1k_jtag_read_mem, 47, 49or1k_jtag_read_spr, 47or1k_jtag_stall, 47or1k_jtag_target, 47or1k_jtag_unstall, 47or1k_jtag_wait, 47, 51or1k_jtag_write_mem, 47, 49or1k_jtag_write_spr, 47or1k_kill, 52or1k_link_address, 46or1k_matchpoint_equal, 51or1k_mourn_inferior, 53
OR1K_NUM_PSEUDO_REGS, 39OR1K_NUM_REGS, 39or1k_open, 48, 49or1k_parse_params, 55, 55OR1K_PC_REGNUM, 39or1k_prepare_to_store, 49or1k_pseudo_register_read, 40or1k_pseudo_register_write, 40or1k_push_dummy_call, 43or1k_rcmd, 53or1k_read_spr, 55or1k_register_info, 40or1k_register_name, 40or1k_register_reggroup_p, 40or1k_register_type, 40or1k_remove_breakpoint, 50, 50or1k_remove_hw_breakpoint, 50, 50or1k_remove_watchpoint, 51or1k_resume, 49, 51or1k_return_value, 38or1k_set_breakpoint, 50or1k_single_step_through_delay , 38or1k_skip_prologue, 42, 46or1k_spr_command, 55OR1K_SP_REGNUM, 39OR1K_SR_REGNUM, 39OR1K_STACK_ALIGN, 42or1k_start_remote, 49or1k_stop, 52or1k_stopped_by_watchpoint, 51or1k_stopped_data_address, 51or1k_stopped_watchpoint_info , 51or1k_store_registers, 49or1k_target, 47or1k_unwind_dummy_id, 43or1k_unwind_pc, 42or1k_unwind_sp, 42or1k_wait, 51or1k_watchpoint_gc, 51or1k_write_spr, 55, 55or1k_xfer_partial, 49or32-dis.c file, 54or32-opc.c file, 54
Pparse_breakpoint_sals, 26POSIX, 23PPC (see Previous Program Counter)previous frame (see stack frame)Previous Program Counter (see Special Pur-pose Register)print_frame, 28print_frame_args, 28
65 Copyright © 2008 Embecosm Limited
print_frame_info, 28print_insn_big_or32, 39, 54print_insn_little_or32, 39, 54print_stack_frame, 28procedure flows, 23
initial start up, 24target command, 24
proceed, 27, 29process and thread ID
for OpenRISC 1000, 49null value, 49
program, 3(see also exec)
program counteras Special Purpose Register, 31functions in struct gdbarch, 9, 14in OpenRISC 1000, 39value in stack frame, 16, 28
program_countervalue in stack frame
for OpenRISC 1000, 42, 45prologue cache, 13
and stack frame sniffer, 14memory management, 16
for OpenRISC 1000, 44invalidating, 51
pseudo-register, 4, 9
Rreadspr, 53read_pc_pid, 25read_var_value, 29red zone (see stack frame)regcache_cooked_read, 11regcache_cooked_read_signed, 11regcache_cooked_read_unsigned , 11regcache_cooked_write, 11regcache_cooked_write_signed , 11regcache_cooked_write_unsigned , 11, 43register
architecture for OpenRISC 1000, 39availability in OpenRISC 1000 target, 48cache, 10
invalidating, 51synchronization with target, 19
cache access functions, 11, 11cooked, 9, 11fields in struct gdbarch, 9, 9floating point, 10functions for OpenRISC 1000, 42, 45, 49,49, 49functions in struct gdbarch, 9, 9, 10, 10,10, 10, 10, 14
functions in struct target_ops, 19, 19pseudo- (see pseudo-register)raw, 9, 11simulator functions, 21vector, 10
registers_changed, 51remote debugging, 3
remote command execution, 19Remote Serial Protocol (see Remote SerialProtocol)remote terminal access, 19target creation, 17, 18
remote inferior (see inferior)Remote JTAG Protocol, 5, 46
commandsblock read registers, 33block write registers, 33read register, 33setting scan chain, 33write register, 33
execution status, 48, 49implementation over TCP/IP, 33interface functions, 46, 47packet format, 33reattaching to target, 49replacement by Remote Serial Protocol, 33resetting the target, 47, 48server side, 34
Remote Serial Protocol, 17, 18, 22, 30, 59server side implementation, 22
remote-or1k.c, 36remote-or1k.c file, 46remote-or1k.o file, 47remote-sim.a file, 21remote-sim.h file, 22, 30remote.c file, 18remove_breakpoints, 27run_command, 26
Ssentinel frame (see stack frame)sim directory, 23simulator library, 21
creation, 30directory for code, 23functions
sim_close, 21sim_create_inferior, 21sim_do_command, 22sim_fetch_register, 21sim_info, 21sim_load, 21sim_open, 21

66 Copyright © 2008 Embecosm Limited
sim_read, 21sim_resume, 21sim_stop, 21sim_stop_reason, 22sim_store_register, 21sim_write, 21
sim_close (see simulator library)sim_create_inferior (see simulator library)sim_do_command (see simulator library)sim_fetch_register (see simulator library)sim_info (see simulator library)sim_load (see simulator library)sim_open (see simulator library)sim_read (see simulator library)sim_resume (see simulator library)sim_stop (see simulator library)sim_stop_reason (see simulator library)sim_store_register (see simulator library)sim_write (see simulator library)single step execution, 51, 52, 52
in hardwarefor OpenRISC 1000, 49
skip_prologue_using_sal, 42, 45sniffer (see stack frame)Special Purpose Register, 31, 58
access via JTAG interface (see DebugUnit, JTAG interface, access to SpecialPurpose Registers )configuration registers
CPU Configuration Register , 31, 48Debug Configuration Register , 31Unit Present Register , 31, 48
Debug UnitDebug Control Register, 50Debug Control Registers , 31Debug Mode Register, 50, 51, 51, 51,51Debug Mode Registers , 32Debug Reason Register , 32, 51, 52debug register cache, 47, 49Debug Stop Register , 32, 52Debug Value Register, 50Debug Value Registers , 31Debug Watchpoint Counter Registers ,32
examining in GDB, 55program counters
Next Program Counter, 31, 52Previous Program Counter, 31, 52
setting in GDB, 55Supervision Register, 31, 39
spr (see GDB commands)SPRs (see Special Purpose Register)
SR (see Supervision Register)stack frame, 11, 58
alignment, 14for OpenRISC 1000, 35, 42, 43
analysis, 14backtrace, 28base address, 17
for OpenRISC 1000, 43dummy, 15
for OpenRISC 1000, 43functions in struct gdbarch, 15, 15, 15
example, 11falling, 14
OpenRISC 1000 as example, 42fields in struct gdbarch, 14frame #-1 (see stack frame)frame ID, 44
(see also struct frame_id)frame number, 12frame pointer value in
for OpenRISC 1000, 46frameless function
for OpenRISC 1000, 42, 45functions for OpenRISC 1000, 42, 42, 43functions in struct gdbarch, 14, 14, 14,14, 14, 15, 15, 15red zone, 12, 14return address
for OpenRISC 1000, 46rising, 14, 42sentinel frame, 13sniffer, 13, 15, 28, 29
and prologue cache (see prologue cache)for OpenRISC 1000, 43functions, 15, 15, 15
stack pointer value in, 16, 28for OpenRISC 1000, 42, 45
terminology, 12frame base, 13inner frame (see next frame)innermost frame, 13newer frame (see next frame)next frame, 13older frame (see previous frame)outer frame (see previous frame)previous frame, 13this frame, 13
unwinder, 13, 14for OpenRISC 1000, 42, 42, 43
stack pointer, 11, 12, 58functions in struct gdbarch, 14in OpenRISC 1000, 39, 57value in stack frame (see stack frame)

67 Copyright © 2008 Embecosm Limited
start_remote, 24, 49status register (see GDB)strata (see target strata)struct frame_unwind, 16
fieldstype, 16unwind_data, 16
functionsdealloc_cache, 16prev_pc, 16prev_register, 16sniffer, 16this_id, 16
struct cmd_list_element, 21struct frame_base, 16
fieldsunwind, 16
for OpenRISC 1000, 43, 44functions
this_args, 17, 44this_base, 17, 44this_locals, 17, 44
struct frame_id, 44struct frame_info, 12struct frame_unwind
for OpenRISC 1000, 44functions
this_id, 28struct gdbarch, 4
architecture lookup, 7(see also gdbarch_list_lookup_by_info)
creating new instance, 6, 7, 30for OpenRISC 1000, 37
data representation, 4, 8default values, 4fields
addr_bit, 8, 38char_signed, 8, 38deprecated_fp_regnum, 39, 44double_bit, 8, 38double_format, 8, 38float_bit, 8, 38float_format, 8, 38fp0_regnum, 9frame_red_zone_size, 14, 42int_bit, 8, 38long_bit, 8, 38long_double_bit, 8, 38long_double_format, 8, 38long_long_bit, 8, 38num_pseudo_regs, 9, 39num_regs, 9, 39pc_regnum, 9, 9, 39
ps_regnum, 9, 39ptr_bit, 8, 38short_bit, 38sp_regnum, 9, 39values for OpenRISC 1000, 38
fields and functionsshort_bit, 8
functionsadjust_breakpoint_address , 8, 52breakpoint_from_pc, 8, 38decr_pc_after_break, 9frame_align, 14, 42frame_num_args, 14implementations for OpenRISC 1000,38inner_than, 14, 42memory_insert_breakpoint, 8memory_remove_breakpoint, 8print_float_info, 10print_insn, 9, 39print_registers_info, 10print_vector_info, 10pseudo_register_read, 9, 40pseudo_register_write, 9, 40push_dummy_call, 15, 43push_dummy_code, 15read_pc, 9, 9register_info, 40register_name, 10, 40register_reggroup_p, 10, 40register_type, 10, 10, 25, 40return_value, 8, 38single_step_through_delay , 9, 27, 30,38skip_prologue, 14, 26, 42, 46unwind_dummy_id, 15, 43unwind_pc, 14, 25, 29, 42unwind_sp, 14, 29, 42write_pc, 9, 9
reference to BFD, 4, 6register handling, 4set_gdbarch functions, 4, 4, 37stack frame handling, 4
struct gdbarch_info, 6byte order, 7fields in the structure, 7for OpenRISC 1000, 37
struct gdbarch_tdep, 8for OpenRISC 1000, 37, 40
struct target_ops, 5, 17breakpoint handling, 5convenience macros (see conveniencemacros)

68 Copyright © 2008 Embecosm Limited
creation, 17, 18for OpenRISC 1000, 47
creation>, 30default values, 5fields
to_doc, 18, 48to_has_all_memory, 18, 48to_has_execution, 19, 48, 49to_has_memory, 18, 48to_has_registers, 18, 48to_has_stack, 18, 48to_longname, 18, 48to_shortname, 18, 47to_stratum, 18, 48
functionsto_attach, 19to_can_use_hw_breakpoint, 20to_close, 19to_create_inferior, 20, 26, 51, 53to_detach, 19, 19to_disconnect, 19to_fetch_registers, 19, 25, 49to_files_info, 18, 18, 48to_find_description, 26to_insert_breakpoint, 20, 27, 30, 50, 50to_insert_hw_breakpoint, 20to_insert_watchpoint, 20, 50to_kill, 20, 52to_load, 19, 25, 49to_mourn_inferior, 20, 53to_open, 18, 19, 24, 48to_prepare_to_store, 19, 49to_print_insn, 54to_rcmd, 19, 53, 53to_remove_breakpoint, 20, 28, 50, 50to_remove_hw_breakpoint, 20to_remove_watchpoint, 20, 51to_resume, 9, 20, 27, 29, 51, 51to_stop, 20, 52to_stopped_by_watchpoint, 20, 25, 27,30to_stopped_data_address, 20to_store_registers, 19, 49to_terminal_inferior, 19to_wait, 9, 20, 24, 27, 29, 51, 51to_xclose, 19to_xfer_partial, 19, 25, 49
memory management, 19opening and closing a connection, 5register access, 5starting and stopping programs, 5state information, 5to_have_continuable_watchpoint , 48
to_have_steppable_watchpoint , 48to_insert_hw_breakpoint , 50, 50to_remove_hw_breakpoint , 50, 50to_stopped_by_watchpoint , 51to_stopped_data_address , 51
struct trad_frame_cache , 13, 44choice of register data function, 45meaning of cached data fields, 45
struct typebuilt in types
builtin_type_int32, 10builtin_type_void, 10
Supervision Register (see Special PurposeRegister )symbol side, 3, 4symbol-and-line (SAL) information, 26, 42,45
TTAGS file (see GDB)target operations, 17
(see also struct target_ops)current target, 17dummy target, 17for OpenRISC 1000, 46macros (see convenience macros)
target side, 3, 4target strata, 17, 18target.h, 17target.h file, 17TARGET_CHAR_BIT, 8target_create_inferior (see conveniencemacros)target_fetch_registers (see conveniencemacros)target_find_description (see conveniencemacros)target_has_execution (see conveniencemacros)target_insert_breakpoint (see conveniencemacros)target_load (see convenience macros)target_open (see convenience macros)target_preopen, 48target_remove_breakpoint (see conveniencemacros)target_resume (see convenience macros)TARGET_SIGNAL_TRAP, 52target_stopped_by_watchpoint (see conve-nience macros)target_strata, 47
for OpenRISC 1000, 48target_wait (see convenience macros)

69 Copyright © 2008 Embecosm Limited
TARGET_WAITKIND_EXITED, 52TARGET_WAITKIND_STOPPED, 52target_xfer_partial (see convenience macros)testing, 30
running tests, 23test results, 23
this frame (see stack frame)thread, 3touch command
instead of changing Makefile.in , 47trad_frame_cache_zalloc, 45trad_frame_get_id, 44trad_frame_get_register, 45trad_frame_set_reg_addr , 45trad_frame_set_reg_realreg , 45trad_frame_set_reg_value , 45trad_frame_set_this_base, 45
Uui_out_field_fmt, 55, 55Unit Present Register (see Special PurposeRegister)unpush_target, 48unwinder (see stack frame)UPR (see Unit Present Register)user interface, 3
Wwait_for_inferior, 24, 27, 29watchpoint
functions in struct target_ops, 20, 20, 20,20in hardware, 20
for OpenRISC 1000, 49, 50, 50in OpenRISC 1000 (see Debug Unit)reinsertion when continuing, 30, 52restarting after, 52
problem with OpenRISC 1000, 52watchpoints_triggered, 25, 27writespr, 53write_pc, 52


![Howto: Porting newlib - Embecosm · Cache Initialization ... subject is well covered by Dan Kegel's Crosstool project [2]. ... As part of its commitment to the open source community,](https://img.pdfslide.us/doc/110x75/5af62dbb7f8b9a92718fe8ba/howto-porting-newlib-embecosm-initialization-subject-is-well-covered-by-dan.jpg)