Embed Size (px)
Citation preview

How Users Drive Value in Two-sided Markets:
Platform Designs That Matter
Zhou Zhou⇤ Lingling Zhang† Marshall Van Alstyne‡
June 3, 2021
Abstract
One of the deepest platform challenges is understanding how users create net-work value for each other and which investments provide leverage. Is morevalue created by advertising to attract users, discounting to subsidize users,or investing in architecture to connect and retain users? Having grown a usernetwork, which promotes “winner-take-all” dominance, why do platforms withlarge user bases fail? To address these challenges, we build a theoretical andempirical model to simultaneously measure within and across period networke↵ects for two-sided markets. This yields three main results. First, we extendthe customer lifetime value (CLV) literature to network markets, allowing usto measure how di↵erent interventions drive CLV on both sides of two-sidedmarkets. Second, we apply our model to the case of Groupon and empiricallyestimate the strength of within period and across period attraction. We findsignificant within period attraction between merchants and consumers thatdoes not persist through time. This o↵ers one explanation for the puzzle thateven strong network e↵ects might not yield market dominance. Third, we findthat users attract users more strongly in experience than search goods mar-kets, as user input drives CLV more than price does. Together these resultsprovide numerous points of leverage for understanding and boosting CLV inorder to increase platform value.
⇤Boston University. Email: [email protected].†University of Maryland. Email: [email protected].‡Boston University. Email: [email protected].
1

1 Introduction
If the world’s first trillion-dollar businesses are platforms based on network e↵ects
(Cusumano et al., 2020), why might firms with strong networks falter? Stronger
network e↵ects drive platforms toward greater market dominance (Katz and Shapiro,
1985, 1986; Shapiro and Varian, 1998; Schilling, 1999; Park, 2004; Dube et al., 2010).
This encourages platforms to invest in user growth, hoping that jump-starting a user
base leads to self-propagating growth. Empirically, however, platforms with large
user bases have both succeeded and failed (McIntyre and Srinivasan, 2017; Hagiu
and Rothman, 2016). Firms such as Apple, Amazon, Google, and Facebook have
grown large user bases, and with high margins and market shares, their valuations
have followed. On the other hand, platforms such as Uber, DiDi, Lending Club,
and Groupon have grown large user bases yet their valuations have fallen. Venture
capitalists have subsidized such firms, despite an absence of profits, under the belief
that investing in user growth until network e↵ects achieve critical mass can lead
to market dominance. Success simply takes patient capital. Central questions for
both platform investors and managers are: When is a large user base insu�cient
for a “winner-take-all” market, and which user investments create the most value?
Answering these questions informs both investment and strategy.
Focusing on platforms, this research explores the role network e↵ects play in
creating long term customer value. Current models of customer lifetime value (CLV),
however, omit network e↵ects (Gupta et al., 2004; Pfeifer and Farris, 2004; Zhang
et al., 2012; McCarthy and Fader, 2018), missing the positive externalities they
create for each other. Standard models of network e↵ects are static (Rochet and
2

Tirole, 2003; Parker and Van Alstyne, 2005; Armstrong, 2006), missing the chain
of value creation over time. The main contribution of this research is to build a
dynamic within and across period model of two-sided network e↵ects, from which
we develop a two-sided model of customer lifetime value, CLV2. We validate this
empirically, then show how it applies across di↵erent users, goods, and locations. Our
theoretical question is how to properly measure network e↵ects over time in order
to understand CLV2. Using this model, our empirical question is to measure the
strength of attraction in a two-sided market, accounting for time and transacting
across various goods and services. Our point of leverage is to use time, within
and across periods, to see if we can observe attraction, spillovers, and stickiness.
Observing these factors, we also identify precursors that moderate CLV2. Answers
thus provide not only investment advice but also insight into odd market behaviors
such as low market values despite strong network e↵ects. In the case of Groupon, for
example, we find significant cross-side attraction but not stickiness suggesting that
better platform design and investment strategies are warranted.
We take “network e↵ect” to mean that a product or service has the property
of rising in value as more parties consume it (Katz and Shapiro, 1985; Liebowitz
and Margolis, 1994; Shapiro and Varian, 1998). This rise in value naturally attracts
consumers whose usage then naturally creates value. Interaction of these properties
creates the flywheel investors hope lead to market dominance. This conventional
definition of a network e↵ect, however, has several nuances worth clarifying. One is
that how users create value can be intentional or unintentional (Parker et al., 2016).
The explicit case is represented by reviews, user generated content, and users actively
3

linking to other users. The implicit case arises when machine learning algorithms
observe users’ behavior and improve the experience of other users or o↵er value
adding recommendations. The latter requires no intentional act to create value for
other users. Network e↵ects can also exhibit strength or weakness based on whether
they are local or non-local (Sundararajan, 2008; Parker et al., 2016). Rideshare,
home services, and food delivery, for example, give rise to stronger local than non-
local attraction as it makes no sense to match a rider in New York to a driver in Paris.
By contrast, e-commerce, operating systems, and social networks have stronger non-
local network e↵ects because a match need not be location specific.
Further, network e↵ects can be classified based on whether they are “same-side”
versus “cross-side” (Eisenmann et al., 2006; Rochet and Tirole, 2006) meaning that
the e↵ect operates within group or across groups respectively.1 In our context, a
same-side network e↵ect is represented by the value that consumers create for other
consumers or the value that merchants create for other merchants. A cross-side
e↵ect is represented by the value that consumers create for merchants and vice versa.
Thus a two-sided market can exhibit up to four network e↵ects – two same-side and
two cross-side – with no requirement that these necessarily exist or have equivalent
strengths. For example, competition among online merchants or among rideshare
drivers could eliminate positive spillovers and attraction among them. Adding the
time dimension, representing within and across periods, doubles this count to eight
possible factors. We will find it convenient to simplify this complexity in the analysis
that follows.1Certain literature also uses the terms “direct” and “indirect” for same-side and cross-side
network e↵ects respectively (Clements, 2004; Church et al., 2008).
4
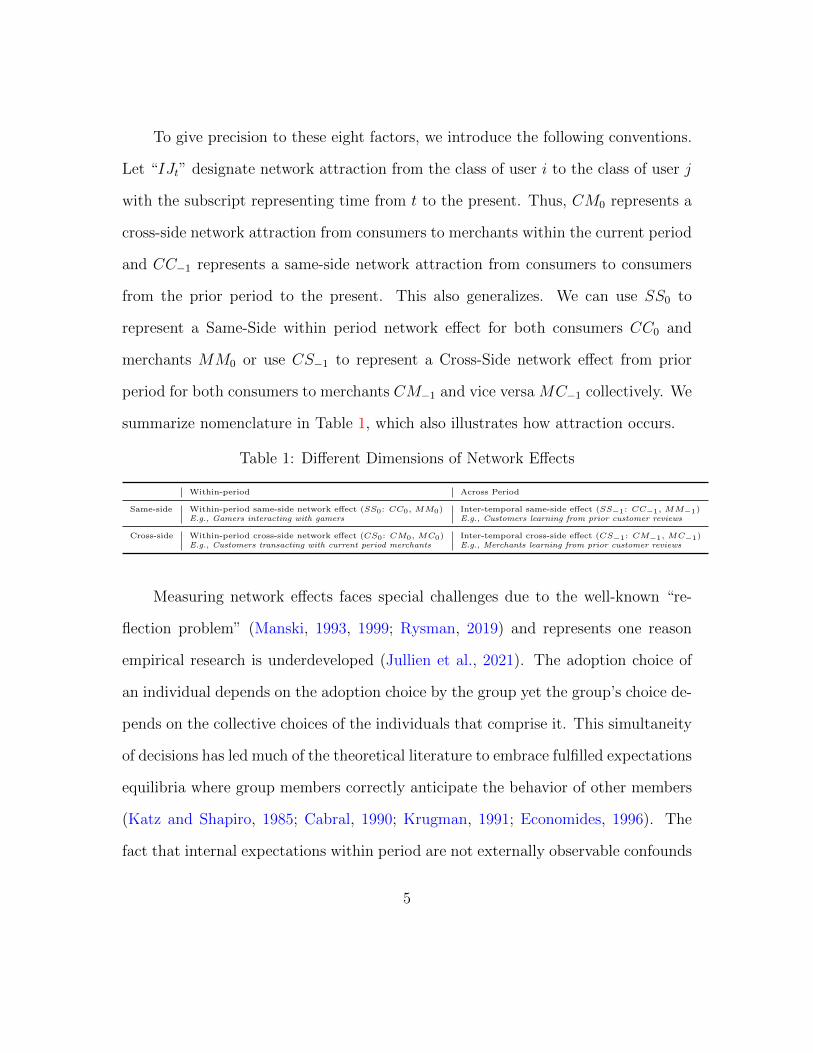
To give precision to these eight factors, we introduce the following conventions.
Let “IJt” designate network attraction from the class of user i to the class of user j
with the subscript representing time from t to the present. Thus, CM0 represents a
cross-side network attraction from consumers to merchants within the current period
and CC�1 represents a same-side network attraction from consumers to consumers
from the prior period to the present. This also generalizes. We can use SS0 to
represent a Same-Side within period network e↵ect for both consumers CC0 and
merchants MM0 or use CS�1 to represent a Cross-Side network e↵ect from prior
period for both consumers to merchants CM�1 and vice versa MC�1 collectively. We
summarize nomenclature in Table 1, which also illustrates how attraction occurs.
Table 1: Di↵erent Dimensions of Network E↵ects
Within-period Across Period
Same-side Within-period same-side network e↵ect (SS0: CC0, MM0) Inter-temporal same-side e↵ect (SS�1: CC�1, MM�1)E.g., Gamers interacting with gamers E.g., Customers learning from prior customer reviews
Cross-side Within-period cross-side network e↵ect (CS0: CM0, MC0) Inter-temporal cross-side e↵ect (CS�1: CM�1, MC�1)E.g., Customers transacting with current period merchants E.g., Merchants learning from prior customer reviews
Measuring network e↵ects faces special challenges due to the well-known “re-
flection problem” (Manski, 1993, 1999; Rysman, 2019) and represents one reason
empirical research is underdeveloped (Jullien et al., 2021). The adoption choice of
an individual depends on the adoption choice by the group yet the group’s choice de-
pends on the collective choices of the individuals that comprise it. This simultaneity
of decisions has led much of the theoretical literature to embrace fulfilled expectations
equilibria where group members correctly anticipate the behavior of other members
(Katz and Shapiro, 1985; Cabral, 1990; Krugman, 1991; Economides, 1996). The
fact that internal expectations within period are not externally observable confounds
5

empirical measurement because even use of instruments treats all members of that
group the same. Much of this work, however, predates development of two-sided
network models (Parker and Van Alstyne, 2000; Rochet and Tirole, 2003; Caillaud
and Jullien, 2003) that allow choices of one group to depend on those of a matched
but di↵erent group. We therefore follow Rysman (2019) and identify instrumental
variables that treat only one side of our two-sided network. Further, by introduc-
ing the time dimension, choices within group may depend on group choice in the
prior period, which is externally verifiable (Zhang et al., 2012; Chu and Manchanda,
2016).2 Careful measurement thus motivates our focus on same-side prior-period
network e↵ects and on cross-side within-period network e↵ects. Using our notation,
these are SS�1 and CS0 respectively. This focus not only reduces complexity but
also avoids the reflection problem.
Di↵erent factors modulate product attraction. User generated content (UGC),
for example, is more valuable for products with higher uncertainty (Li et al., 2011).
Prior sales information also has a greater impact on a customer’s choice of an experi-
ence good than of a search good (Li and Wu, 2018). In the same vein, we hypothesize
that same-side attraction for experience goods is stronger than that for search goods
based on peer to peer learning e↵ects (Hagiu and Wright, 2020). Greater information
asymmetry renders accumulated information more valuable for goods that must be
tried in order to know their value than for goods whose price is the deciding factor.
Distance might also matter (Sundararajan, 2008). Since Groupon customers trans-
2Another way to resolve the reflection problem is to shrink the time interval of the observationwindow. This can shift observation of a specific behavior from the current to a prior period, avoidinga simultaneous choice. We thank an anonymous referee for this insight, which also motivates a focuson SS�1 rather than SS0.
6

act with Groupon merchants in their local markets, we expect local network e↵ects
to prove stronger than non-local network e↵ects. Using our model of inter-temporal
attraction, we explore both factors and find that both matter. Among customers,
same side attraction CC�1 is estimated to be positive and significant for experience
goods but insignificant for search goods. For both experience and search goods, how-
ever, the cross side e↵ect of merchants on customers MC0 is estimated to be positive
and significant. Among merchants, same side MM�1 and cross side CM0 e↵ects are
estimated to be positive and significant for both experience goods and search goods,
but MM�1 for experience goods is approximately 2.5 times as large as that for search
goods while CM0 is qualitatively similar across these categories.
Using model coe�cients, we can also account for two-sided market spillovers and
explore marketing and information systems interventions to boost customer and mer-
chant lifetime value CLV2 and MLV2. For example, does CLV2 rise more based on
adding another customer, another merchant, increasing consumption, or increasing
retention? Marketing interventions might add same or cross side market participants.
Information systems interventions might capture and present user data or use data
to boost stickiness. Interestingly, in the extreme where same side e↵ects SS�1 are
absent on the platform, strong cross-side e↵ects CS0 only create value in one period,
and CLV2 is equal to the value created in the current period. However, when SS�1
is significant and positve, users continue creating value in future periods.
In practical terms, these tools allow investment analysis of di↵erent options such
as methods to enhance user participation (Huang et al., 2019; Chen et al., 2019) or to
alter user behaviors that drive di↵erences in platform value (McIntyre and Srinivasan,
7

2017). Amazon was among the first platforms to invest in recommender systems and
UGC to make their undi↵erentiated books more valuable (Dellarocas, 2003). Using
information systems data to present consumers with their own “best value” ranking
can drive adoption (Ghose et al., 2012). In SAP’s enterprise software ecosystem,
independent software vendors (ISVs) compete for contracts and initially hid their
expertise from one another. The launch of SAP’s developer network, however, re-
warded partners for sharing ideas and answering each other’s questions in a public
forum, which also boosted adoption and retention. ISVs have increased each other’s
sales, and thus customer value, at statistically significant levels (Ceccagnoli et al.,
2012). Airbnb’s host forum, likewise, helps hosts solve problems, deal with unruly
guests, and share tips for improved ratings (Hardy and Dolnicar, 2017). Platforms
can also design information systems to simplify user adoption and avoid disinterme-
diation (Zhu and Iansiti, 2012; Halaburda et al., 2016). For example, platforms can
schedule bookings, process payments, and handle logistics to drive platform adop-
tion and retention. As platform users and merchants become stickier due to these
value-added services, customer and merchant lifetime value increase, such that user
(and/or merchant) acquisition strategies become cost-e↵ective. Parameter estimates
for strengths of these relationships help target investments.
This research o↵ers theoretical and practical insights. First, we develop a model
of inter-temporal network e↵ects and within-period network e↵ects to complement
the static models of two-sided markets in extant literature. Strong within-period
attraction does not necessarily imply strong inter-temporal attraction across periods.
When the inter-temporal network e↵ect is weak, the within-period network e↵ect
8

may not persist, and a user growth strategy is not e↵ective. Given this model, we
further propose a framework to estimate the customer and merchant lifetime values,
CLV2 and MLV2, in two-sided markets. Existing CLV models do not capture the
value created through network e↵ects and underestimate that of platforms such as
Amazon and eBay (Gupta and Mela, 2008; Zhang et al., 2012). Our innovation
extends this literature to a pair of joint calculations accounting for spillovers across
time and across sides of two-sided markets. To the best of our knowledge, this is the
first study that proposes a theory-driven customer and merchant value calculation
that can be adopted easily by practice.
Second, this paper empirically distinguishes and estimates di↵erent network ef-
fects based on time, location, and type of good. In our context, the inter-temporal
network e↵ect is weak overall, yielding poor user stickiness. A user growth strategy
is less e↵ective for such platforms. All else equal, CLV 2 and MLV 2 are higher in
markets with higher same side inter-temporal attraction SS�1. For markets with
weak SS�1, we show that platform design interventions that enhance stickiness and
spillovers can increase lifetime value, whereby acquisition strategies through mar-
keting interventions become cost-e↵ective. Overall, these findings remind platform
managers not to overemphasize user growth when user or merchant stickiness and
spillovers are poor and, instead, to focus on platform designs that enhance stickiness
and spillovers as well as attraction.
Our paper proceeds as follows. Section 2 reviews related literature. Section 3
introduces our theoretical and empirical models. Section 4 then describes our data
set and identification strategies. We present empirical findings in Section 5. Follow-
9

ing coe�cient estimation, Section 6 analyses strategic responses when a platform’s
user stickiness is poor. Section 7 o↵ers commentary on limitations and directions for
future research. Finally, Section 8 concludes with managerial and investor implica-
tions, and highlights research contributions.
2 Related Literature
Our research builds on contributions from four research streams including two-sided
markets, market dynamics, customer lifetime value, and platform design. Research
extensions and contrasts for each stream appear below.
2.1 Static Models of Two-sided Markets
Static models have developed to study the price structure of two-sided markets, how
they lead to free goods markets, and which side merits a subsidy (Rochet and Ti-
role, 2003; Caillaud and Jullien, 2003; Parker and Van Alstyne, 2005; Armstrong,
2006). These theoretical models highlight how one side of a market attracts the
other side, requiring use of a coordination mechanism, such as free pricing or a price
stimulus to one side, in order to get both sides on board. Empirical works in this
context have focused on estimating network e↵ect size and discussing implications
for platform competition (Rysman, 2004). Due to the intrinsicly dynamic nature
of platform growth, however, static models are insu�cient for understanding time
dependent aspects of user adoption on a platform’s net present value. Our paper
extends the static two-sided market framework by adding time. Although the per-
10

sistence of network e↵ects plays a critical role in platforms’ user growth strategies,
little empirical work has investigated their inter-temporal durability (McIntyre and
Srinivasan, 2017). Considering market entry, Biglaiser et al. (2019) discuss how in-
cumbents maintain a profit advantage via network e↵ects even as entrants match
or exceed price and quality. In this research, we control for factors such as plat-
form quality, the presence of a competitor, and how users themselves contribute to
persistent network e↵ects.
2.2 Dynamic Models of Network E↵ect Markets
Network e↵ects have attracted a long-standing interest in market coordination and
evolution. The adoption decision is often modeled as a function of users’ expecta-
tions of network size (Katz and Shapiro, 1994; Shapiro and Varian, 1998; Cabral,
2011; Krugman, 1991; Farrell and Klemperer, 2007). Empirical contributions in this
domain have estimated the magnitude of di↵erent cross-side network e↵ects. For ex-
ample, Chu and Manchanda (2016) quantified the extent to which current consumers
attract future suppliers (and vice versa) in online retail. Zhang et al. (2012) exam-
ined how UGC contributors created value for UGC consumers. Importantly, these
models use only lagged prior period terms, and not within period terms, omitting
measures of current period attraction. We include current period attraction and use
an instrumental variables approach to address the reflection problem.
Li et al. (2020) further studied user growth across multiple categories of goods
and across di↵erent time periods in a two-sided market. Insights from these studies
show how to optimize investments in user growth conditional on the e↵ectiveness of
11
di↵erent cross-side network e↵ects.
The assumption that cross-side network e↵ects depend on user beliefs of network
size is reasonable when user switching costs are high. Platform research has shown
that switching cost is an important determinant of user value (Farrell and Klemperer,
2007; Metcalfe, 2013; Katz and Shapiro, 1985). At present, however, user switching
costs are low on many digital platforms. In search, rideshare, group-buying, and
e-commerce, for example, users can easily observe competing platform o↵ers and
switch without lock-in. The possibility of platform switching can dissipate rents and
intensify competition (Rysman, 2009). A large supplier base in one period does not
necessarily guarantee consumer adoption in the next period. Cross-side attraction in
existing papers, often cast as an inter-temporal e↵ect (Chu and Manchanda, 2016),
corresponds to the mixture of SS�1 and CS0 in our model. Since di↵erent types
of user e↵ects correspond to di↵erent mechanisms and imply a need for di↵erent
platform strategies, we distinguish them and estimate them separately. Our model
shows that platform user stickiness plays a critical role: when user stickiness is poor,
no user growth strategies can generate high returns on investment (ROI) because the
network is just a “leaky bucket.” In contrast to conventional wisdom, investing in
either side or in di↵erent categories of goods might not be cost e↵ective. Rather, we
suggest that a platform should improve its design so as to enhance user stickiness.
Our user-value strategy is particularly relevant when switching costs are low, as is
the case for many digital platforms.
12
2.3 Network E↵ect Design
The importance of network e↵ects is such that they imply changes in the structure of
the firm. Parker et al. (2017) show that product firms transition to platform firms as
the strength of network e↵ects increase. Because network e↵ects scale faster among
external users than among internal employees, the firm “inverts” in the sense that
value creation shifts from inside to outside. Network e↵ects, however, are not simply
exogenous environmental factors but might instead be the consequence of conscious
design (Schrage, 2012).
Platforms can enhance network e↵ects through investments in connecting users
to one another, enabling file sharing, creating complements, and hacking compat-
ibility (McIntyre and Subramaniam, 2009). Piggybacking on social media to pro-
mote word-of-mouth (WOM) can generate social influence. Capturing and present-
ing user-generated-content (UGC) builds engagement. Extant research has shown
that reviews, ratings, and other UGC a↵ect the attractiveness of a platform over
time (Dellarocas, 2003; Forman et al., 2008; Li et al., 2011). Several recent stud-
ies also model network e↵ects as a learning mechanism because UGC sheds light on
product/service quality, which reduces uncertainty as customers make their purchase
decisions (Hagiu and Wright, 2018; Wu et al., 2015). Firms also give away reference
designs and system developer toolkits (Boudreau, 2010), or open application pro-
gramming interfaces (Benzell et al., 2017). These design choices attract developers
who improve platform quality, which attracts users, creating platform value (Tellis
et al., 2009; Zhu and Iansiti, 2012). Of particular importance for our paper, network
size alone might not be the best predictor of value, which might instead depend more
13
on network density or topology (Suarez, 2005).
Complementing these works, our paper proposes a framework to manage user
stickiness modeled as di↵erent categories of same-side and cross-side network ties
. We show that investments in network designs can make current users more valu-
able for future users, magnifying each user’s lifetime value, and raising the value
of the platform. This is consistent with investing for the purpose of “making cus-
tomers better to make better customers” (Schrage, 2012). As a further illustration,
Airbnb trained hosts to take more attractive photos of their homes, which increased
guest bookings, which inn turn increased guest listings. Network e↵ects need not be
assumed, they may be designed.
2.4 Customer Lifetime Value
An important stream of research that is closely related to firm value is the concept
of CLV in marketing (Gupta et al., 2004; McCarthy and Fader, 2018). This line of
research emphasizes user stickiness and explicitly incorporates user retention in CLV
calculation (Gupta et al., 2004; Pfeifer and Farris, 2004; Gupta, 2005). However,
extant literature is largely restricted to businesses without network externalities.
Despite its popularity, the extant CLV calculation is insu�cient to estimate the
true value of users on digital platforms. One primary objective of our research is
to explicitly model how network externalities create value across groups and across
time. We thus extend the CLV framework to two-sided markets. Furthermore,
extant CLV research does not distinguish how di↵erent factors contribute to user
value. Following Zhang et al. (2012) and Li et al. (2020), we control for factors such
14

as platform quality and focus on analyzing how di↵erent types of network e↵ects
a↵ect value creation.
Our study is distinct from extant studies that also addressed network e↵ects
(Tucker and Zhang, 2011; Chu and Manchanda, 2016; Li et al., 2020). Whereas those
studies focus on choosing a preferred investment side or within versus cross-category
investment, our research explicitly provides a framework that not only quantifies
CLV2 for both sides in a two-sided markets but also sheds light on the relative
contributions of network e↵ects and net margin in boosting user value. This makes a
comparison of advertising, discounting, and architectural design investments feasible.
3 Modeling Approach
This section presents our model specification. First, we explain how di↵erent types of
network e↵ects influence the dynamics of two-sided markets and specify an aggregate-
data discrete-choice model to study users’ participation choices (Berry et al., 1995).
Second, based on the estimates of network e↵ect sizes, we develop a model to calculate
consumer and merchant lifetime values, CLV 2 and MLV 2 , in two-sided markets.
We discuss platform heterogeneity and demonstrate how the strength of SS�1 a↵ects
the e↵ectiveness of the user growth strategy.
3.1 Demand Dynamics in Two-sided Markets
Built upon the static model of Parker and Van Alstyne (2005) and the dynamic
model of Chu and Manchanda (2016), we incorporate the time dimension and study
15

demand dynamics in two-sided markets. Figure 1 describes the demand evolution on
the two sides of a online market, which allows consumers (merchants) in the pervious
period to influence consumers (merchants) in the current period. To illustrate market
evolution, consider a shock to consumer base at t�1 and its dynamic e↵ect, as shown
in Figure 1. First, the shock to consumer base at t� 1 a↵ects the consumer base at
t via SS�1. Second, an increase in the current consumer base would lead to growth
in the current merchant base via the CS0. The prices and sizes of each user group
combinedly determine the profit during each period in the dynamic system. Here
nt,mt, pnt , pmt correspond to the consumer base, merchant base, price for consumers,
and price for merchants, respectively, in period t. The same logic applies to a shock to
the merchant base. Next, we present how these di↵erent network e↵ects are modeled
empirically. For exposition, we refer to the two sides as the “consumer side” and the
“merchant side”, although our modeling framework can be applied to a two-sided
market beyond the retailing setting.
3.1.1 Consumer Side
On the consumer side, several factors jointly determine the utility that a represen-
tative buyer i derives from using the platform in market j week t. First, the utility
is related to the platform’s attractiveness, which is further decomposed into four
components: (1) consumer i0s intrinsic preference for the focal platform ↵nj (in sub-
sequent analysis, superscript ‘n’ denotes the consumer side), which is assumed to
be varying by market but constant over time; (2) the number of consumers in the
previous period nj,t�1, to capture CC�1 that is attributable to word-of-mouth and
16

Figure 1: Each period shows dynamic participation of consumers (nt) and merchants(mt). Link nt�1 �! nt represents CC�1 while link nt �! mt represents CM0. Links
anchored at mt�1 and mt are symmetric in network e↵ects MM�1 and MC0 respectively.
UGC; (3) the number of merchants mjt, to capture MC0 that is due to the amount
of supply;3 and (4) average price pjt and other product characteristics Xjt. Further-
more, the utility depends on (i) the attractiveness of the rival platform Rjt (Rochet
and Tirole, 2003; Armstrong, 2006), which includes rivals’ user base in market j at t,
ii) the macro-economic trends of the industry and seasonalities that are common to
all markets and unobserved to researchers T nt , (iii) the unobserved market and time
specific shocks to the demand ⇠njt, and (iv) the idiosyncratic error "nijt. Formally, the
net indirect utility is specified as follows:
Unijt = f(↵n
j , nj,t�1,mjt, pjt, Xjt)f(Rjt)f(Tnt , ⇠
njt, ✏
nijt). (1)
3The lags of merchant base are excluded from Equation 2 because we model a setting withtrivial switching cost. In such a context, consumers make decisions after observing current supplyon competing platforms, and thus, they do not need to form expectations about current supplybased on past supply.
17

We assume that the utility takes the Cobb-Douglas form (Chu and Manchanda,
2016) and rewrite the indirect net utility as:
unijt = ↵n
j + �1 lnnj,t�1 + �1 lnmjt + ⇢1 ln pjt + ⌘1Xjt
+ ✓1 lnRjt + �1Tnt + ⇠njt + "nijt.
(2)
The inter-temporal and within-period network e↵ect parameters are our pri-
mary interest in Equation 2. There are also market-specific demand shocks ⇠njt that
make the platform more or less attractive across di↵erent markets over time. These
shocks are observed by platforms and users but unobserved to researchers, causing
an endogeneity concern. All other factors are absorbed in the idiosyncratic errors
"nijt.
We now denote the utility as unijt = �njt + "nijt and normalize the utility of the
outside option as zero, which corresponds to consumers choosing the rivals or not
participating in the market. Assuming that "nijt follows independent and identically
distributed (i.i.d.) Type-I extreme value distribution, we derive the market share of
the focal platform as:
snjt =e�
njt
1 + e�njt. (3)
Thus, the platform’s relative market share is:
lnsnjtsn0jt
= lnnjt/Njt�
Njt � njt
�/Njt
= ↵nj + �1 lnnj,t�1 + �1 lnmjt + ⇢1 ln pjt + ⌘1Xjt
+ ✓1 lnRjt + �1Tnt + ⇠njt,
(4)
18

where sn0jt is the market share of the outside option and Njt is the market size for
buyers in market j time t. Estimating the parameters of interest based on Equation
4 poses challenges due to endogeneity and market heterogeneity. We discuss our
identification strategy in detail in Section 6.
3.1.2 Merchant Side
The utility specification for the merchants is similar to that of the consumer side.
For a representative merchant (seller) l in market j at time t, its utility of working
with the platform is related to the following factors: (1) merchants l0s preference for
the focal platform ↵mj (in subsequent analysis, superscript ‘m’ denotes the merchant
side), which is assumed to be varying by market but constant over time; (2) the
number of existing merchants mj,t�1 to capture MM�1; (3) the number of current
consumers njt to capture CM0; (4) product price Pljt; and (5) whether the merchant
has experiences with the platform Xljt, which captures the switching cost on the
platform.
Note that the merchant base in the past, the MM�1, can a↵ect the participation
decision for a current merchant for several reasons. Existing merchants could create a
word-of-mouth e↵ect, which helps the platform to attract new merchants. Too many
merchants, however, could increase competition and deter future entry, causing a
negative same-side network e↵ect. Thus, the MM�1 on the merchant side could be
positive or negative, depending on which e↵ect dominates. The CM0 from consumers
to merchants is expected to be positive, because more consumers would bring higher
19

sales and profits, increasing the attractiveness of the platform to merchants 4. For
specific platforms such as Groupon, the consumer base helps increase the consumer
reach and awareness for the merchant’s brand, creating a marketing e↵ect (Dholakia,
2011; Edelman et al., 2016). Nevertheless, the CM0 term in our model captures the
cross-side e↵ect of consumers on both the current profits and future profits.
The merchant’s utility further depends on (i) the attractiveness of the rival
platform Rjt, (ii) the macro-economic trends of the industry that are common to
all markets and unobserved to researchers Tmt , (iii) the unobserved market and time
specific shocks to the demand ⇠mjt , and (iv) the idiosyncratic error "mljt. Formally, the
net indirect utility for a merchant is specified as follows:
umljt = ↵m
j + �2 lnmj,t�1 + �2 lnnjt + ⇢2 ln pljt + ⌘2Xljt
+ ✓2 lnRjt + �2Tmt + ⇠mjt + "mljt.
(5)
Following a similar step as for the consumer side, we denote the utility as umljt =
�mjt+"mljt and normalize the utility of outside option as zero. Assuming that "mijt is i.i.d.
Type-I extreme value distributed, we derive the relative market share of merchants
choosing the platform as follows:
lnsmjtsm0jt
= lnmjt/Mjt�
Mjt �mjt
�/Mjt
= ↵mj + �2 lnmj,t�1 + �2 lnnjt + ⇢2 ln pjt + ⌘2Xjt
+ ✓2 lnRjt + �2Tmt + ⇠mjt ,
(6)
4Following Li et al. (2017), the lags of the consumer base are excluded from Equation 5 becausemerchants have correct expectations about future demand.
20

where sm0jt is the market share for merchants choosing the outside option and Mjt
is the market size for potential merchants. Variables pjt and Xjt are the average
deal price and characteristics in market j week t. Our estimation and identification
strategy is discussed in Section 6.
Table 2 provides a summary of all variable and parameter definitions used in
our model.
Table 2: Variable and Parameter Definitions
Notation Definition Notation Definitionn consumer base �1, �2 CC�1, MM�1
m merchant base �1, �2 MC0, CM0
N consumer market size ↵nj ,↵
mj user preference
M merchant market size snjt, smjt market share
R rival user base and price ✓1, ✓2 competitive e↵ectp price ⇢1, ⇢2 price elasticityX product features ⌘1, ⌘2 product attractivenessT industry-level common trend �1, �2 time e↵ects
⇠njt, ⇠mjt unobserved shocks
3.2 Customer Lifetime Value in Two-sided Markets
In their classic work, Gupta et al. (2004) define the CLV as the expected sum of
discounted future earnings generated by a customer. Following their definition, we
develop a model to estimate the CLV 2. Take the consumer’s CLV 2 as an example.
We assume a one-unit increase in the consumer base and quantify the increase of
user bases on both sides of the market. To compute the CLV 2, we transform the
estimated elasticity of the market share into a marginal e↵ect of the user base using
21
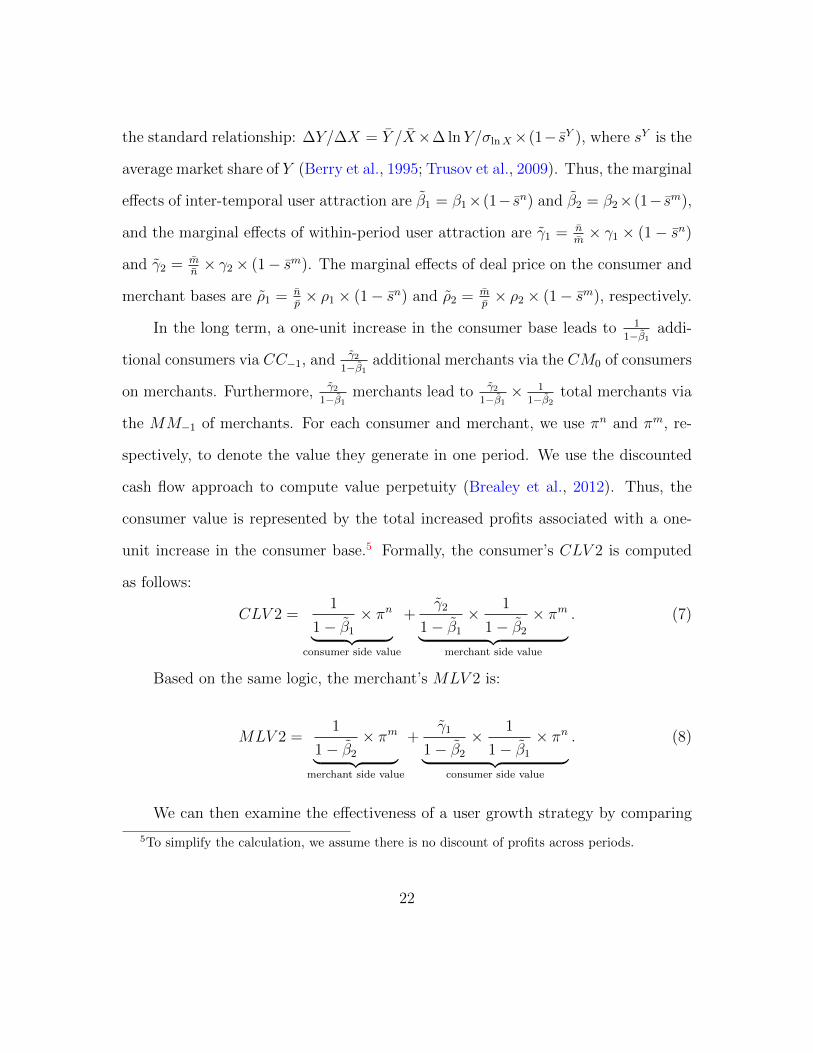
the standard relationship: �Y/�X = Y /X⇥� lnY/�lnX⇥(1� sY ), where sY is the
average market share of Y (Berry et al., 1995; Trusov et al., 2009). Thus, the marginal
e↵ects of inter-temporal user attraction are �1 = �1⇥(1� sn) and �2 = �2⇥(1� sm),
and the marginal e↵ects of within-period user attraction are �1 =nm ⇥ �1 ⇥ (1� sn)
and �2 =mn ⇥ �2 ⇥ (1� sm). The marginal e↵ects of deal price on the consumer and
merchant bases are ⇢1 =np ⇥ ⇢1 ⇥ (1� sn) and ⇢2 =
mp ⇥ ⇢2 ⇥ (1� sm), respectively.
In the long term, a one-unit increase in the consumer base leads to 11��1
addi-
tional consumers via CC�1, and�2
1��1additional merchants via the CM0 of consumers
on merchants. Furthermore, �21��1
merchants lead to �21��1
⇥ 11��2
total merchants via
the MM�1 of merchants. For each consumer and merchant, we use ⇡n and ⇡m, re-
spectively, to denote the value they generate in one period. We use the discounted
cash flow approach to compute value perpetuity (Brealey et al., 2012). Thus, the
consumer value is represented by the total increased profits associated with a one-
unit increase in the consumer base.5 Formally, the consumer’s CLV 2 is computed
as follows:
CLV 2 =1
1� �1
⇥ ⇡n
| {z }consumer side value
+�2
1� �1
⇥ 1
1� �2
⇥ ⇡m
| {z }merchant side value
. (7)
Based on the same logic, the merchant’s MLV 2 is:
MLV 2 =1
1� �2
⇥ ⇡m
| {z }merchant side value
+�1
1� �2
⇥ 1
1� �1
⇥ ⇡n
| {z }consumer side value
. (8)
We can then examine the e↵ectiveness of a user growth strategy by comparing
5To simplify the calculation, we assume there is no discount of profits across periods.
22

the CLV 2 and the consumer acquisition cost, and the MLV 2 and the merchant
acquisition cost, respectively. We denote the consumer acquisition cost and merchant
acquisition cost as ACn and ACm, respectively. A user growth strategy is e↵ective
only when CLV 2 > ACn or MLV 2 > ACm.
Importantly, Equations 7 and 8 can also be used to answer the question: what
is a free customer worth (Gupta and Mela, 2008). The direct e↵ect of ⇡n in the first
equation or of ⇡m in the second equation could be zero and yet both CLV 2 and
MLV 2 could be positive due to non-zero cross-side value.
3.3 Platform Heterogeneity in User Growth Strategy
An interesting question to consider is why the e↵ectiveness of a user growth strategy
varies by platforms with strong CS0. According to Equation 7 and 8, the CLV 2 and
MLV 2 are jointly determined by the strength of both SS�1 and CS0. The existence
of SS�1 makes the influence of CS0 persist over time and thus amplifies the impact
of CS0 on CLV 2 and MLV 2.
Table 3: How SS�1 Amplifies The Impact of CS0 on CLV 2.
ASn 1 2 3 4 5 6 7 8 9 10�1 0 0.5 0.667 0.75 0.8 0.833 0.857 0.875 0.889 0.9
To illustrate the impact of SS�1 on CLV 2, we vary the value of �1 while keep
other parameters unchanged, then compute the changes in CLV 2. We use ASn to
denote the amplification size of the consumer’s SS�1 on CLV 2. According to our
23
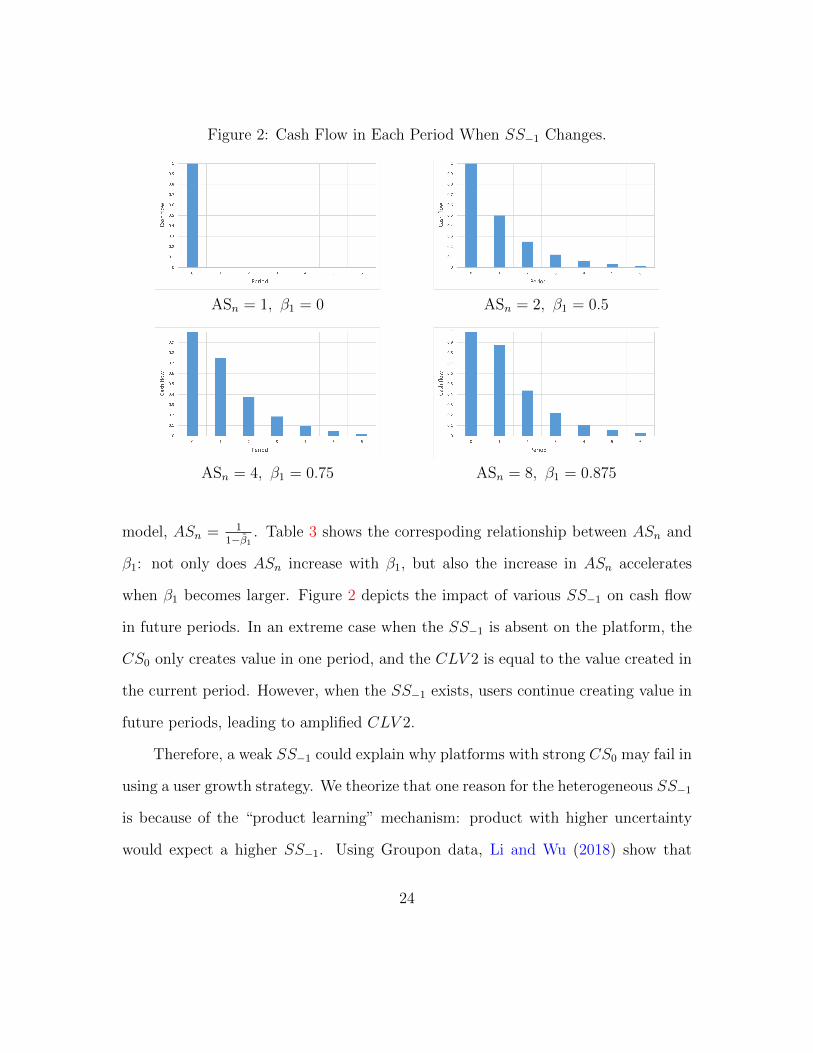
Figure 2: Cash Flow in Each Period When SS�1 Changes.
ASn = 1, �1 = 0 ASn = 2, �1 = 0.5
ASn = 4, �1 = 0.75 ASn = 8, �1 = 0.875
model, ASn = 11��1
. Table 3 shows the correspoding relationship between ASn and
�1: not only does ASn increase with �1, but also the increase in ASn accelerates
when �1 becomes larger. Figure 2 depicts the impact of various SS�1 on cash flow
in future periods. In an extreme case when the SS�1 is absent on the platform, the
CS0 only creates value in one period, and the CLV 2 is equal to the value created in
the current period. However, when the SS�1 exists, users continue creating value in
future periods, leading to amplified CLV 2.
Therefore, a weak SS�1 could explain why platforms with strong CS0 may fail in
using a user growth strategy. We theorize that one reason for the heterogeneous SS�1
is because of the “product learning” mechanism: product with higher uncertainty
would expect a higher SS�1. Using Groupon data, Li and Wu (2018) show that
24

previous sales information has a greater impact on consumer choices in the category
of experience goods than search goods because experienced goods are associated with
higher uncertainty. In the same vein, we hypothesize that the SS�1 of experienced
goods is stronger than that of search goods. In the following sections, we discuss our
identification strategies and test this hypothesis.
4 Data and Estimation
This section presents the empirical setting and our identification strategy.
4.1 Empirical Setting and Data
We estimate our model and discuss the analysis of the user growth strategy using data
from the daily deal market. Daily deal platforms such as Groupon emerged around
2008 as two-sided markets connecting merchants and consumers with discounted
deals. Figure 3 shows the growth of Groupon’s consumer base, profit, revenue, and
market value over the past ten years. Groupon experienced rapid convex growth in
its first several years, before reaching 2013 revenues of $2.6 billion, but then it almost
stopped growing. As a forecast of future growth, its market value experienced a sharp
decline in 2012. Analysts observed that the consumer base and revenues had a highly
correlated trend. For years, a central question for Groupon senior management was:
Should Groupon further promote the growth of its user base? This question makes
Groupon a valuable setting for our research.
The daily deal market is ideal to answer our research questions for several rea-
25

sons. The market was largely dominated by two leading platforms: Groupon and
LivingSocial, making it easier to control for the competition e↵ects. Around our
data collection period, Groupon and LivingSocial made up roughly 59% and 17% of
the total revenue in the U.S. daily deal market, respectively.6 In our estimation, we
use Groupon as the focal platform to estimate the parameters of interest and use
LivingSocial to control for competition. Perhaps more importantly, it is critical for
us to examine how SS�1 and CS0 vary by product categories (especially between
experience goods and search goods) after the overall quality and brand name of the
platform are controlled for. Comparing di↵erent platforms would face tremendous
identification challenges, because the nature of products o↵ered by di↵erent platforms
would be indistinguishable from the intrinsic quality of the platforms. Fortunately,
Groupon o↵ers products from both experience and search categories. By leveraging
the panel data structure across categories and markets, we can estimate the e↵ects
of users after eliminating the e↵ects attributable to platform quality or brand name.
Our sample includes Groupon’s largest 108 markets from January 2012 to De-
cember 2012. Table 4 provides summary statistics by market and week. Note that
the platform’s consumer base is not directly observed in this study. In the estima-
tion, it is represented using the transaction volume. Using transaction volume has
an advantage of capturing the number of active users rather than dormant users
who did not make a purchase. Compared with the number of registered accounts,
transaction volume is better aligned with the decision-making process underlying
Equations 2 and 5, because consumers and merchants can observe the transaction
6Statistica 2013, http://www.statista.com/statistics/322293/groupon-market-share-us/.
26
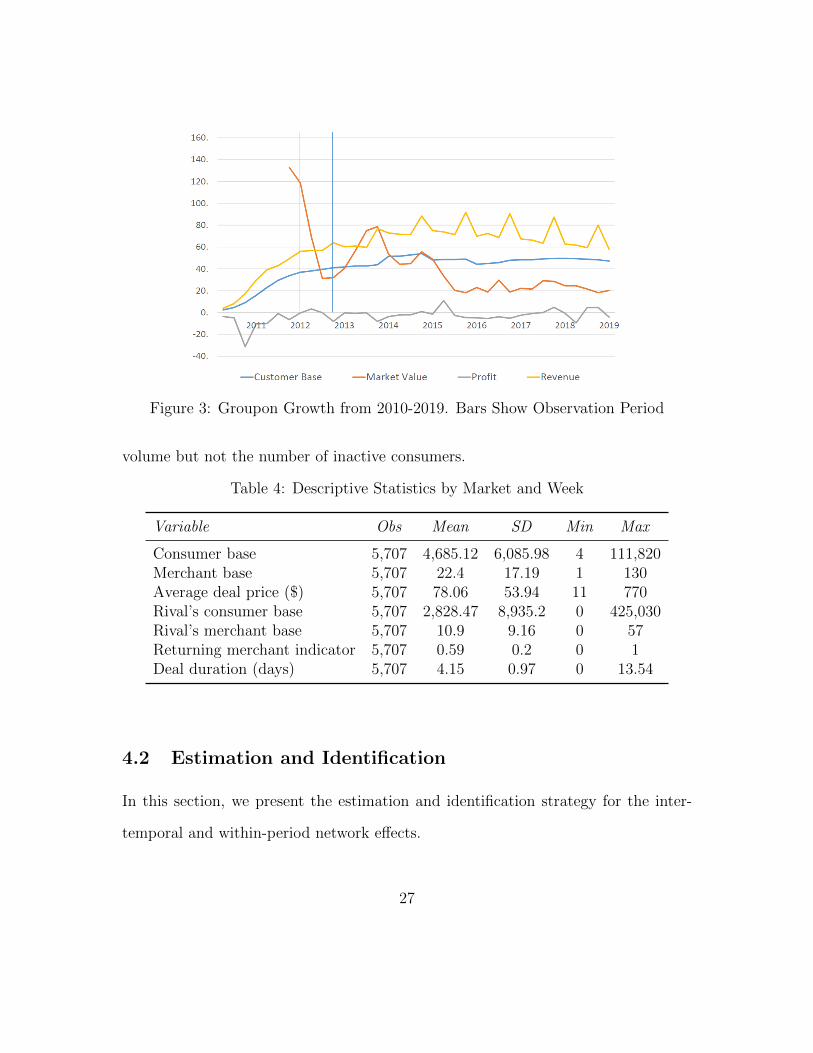
Figure 3: Groupon Growth from 2010-2019. Bars Show Observation Period
volume but not the number of inactive consumers.
Table 4: Descriptive Statistics by Market and Week
Variable Obs Mean SD Min Max
Consumer base 5,707 4,685.12 6,085.98 4 111,820Merchant base 5,707 22.4 17.19 1 130Average deal price ($) 5,707 78.06 53.94 11 770Rival’s consumer base 5,707 2,828.47 8,935.2 0 425,030Rival’s merchant base 5,707 10.9 9.16 0 57Returning merchant indicator 5,707 0.59 0.2 0 1Deal duration (days) 5,707 4.15 0.97 0 13.54
4.2 Estimation and Identification
In this section, we present the estimation and identification strategy for the inter-
temporal and within-period network e↵ects.
27

4.2.1 Identification for the Inter-temporal Network E↵ect
We begin by discussing the estimation for the SS�1. As shown in Equations 2 and
5, the SS�1 is captured by the lag(s) of the consumer base and merchant base. As
the dependent variable, i.e., the logarithm of relative market share, is also a function
of the user base, our specification is a variant of the dynamic panel linear model.
This specification has the advantage of controlling for heterogeneity and allowing
the distinction between the short-run and long-run dynamics, but calls for special
attention on estimation.
It is well known that the ordinary least square (OLS) estimator for the lagged
user base (i.e., �1 and �2) is biased in dynamic panel linear models. By construction,
lnnj,t�1 in Equation 2 and lnmj,t�1 in Equation 5 are correlated with the market
fixed e↵ects. To eliminate the unobserved market e↵ects, we apply the first-di↵erence
approach proposed by Anderson and Hsiao (1981) and Arellano and Bond (1991).
Take Equation 2 as an example. After the first-di↵erence transformation, it becomes
� lnY nj,t = �1� lnnj,t�1+�1� lnmjt+⇢1� ln pjt+✓1� lnRjt+⌘1�Xjt+�1�T n
t +�⇠njt,
where Y nj,t = snjt/s
n0jt, � lnY n
j,t = lnY nj,t � lnY n
j,t�1, � lnnj,t�1 = lnnj,t�1 � lnnj,t�2
and so on. The error terms are assumed to have zero serial correlations for the same
cross-sectional unit, i.e., E(⇠njt⇠njt0) = 0 for all t 6= t0 7.
Furthermore, the levels of the dependent variable lagged two periods or more
are valid instruments in the equation of first-di↵erences (Arellano and Bond, 1991).
7The test results for the auto-correlation assumption is presented in the results section.
28

The identification restriction is specified as
E(lnnj,t�p�⇠njt) = 0,where p 2 {2, 3, .., t� 1}; t 2 {3, 4, ..., T}.
The instruments are used to form the objective function for the generalized
method of moments (GMM) (Hansen, 1982; Wooldridge, 2010), forming the Di↵er-
ence GMM (DGMM) estimator (Arellano and Bover, 1995).
4.2.2 Identification for the Within-period Network E↵ect
The identification challenge underlying the parameters for the classic network ef-
fect is that the consumer base and merchant base are simultaneously determined in
Equations 2 and 5, causing an endogeneity concern. We address this problem by
providing instrumental variables for lnnjt and lnmjt, respectively.
We first present the instrumental variables for the merchant base lnmjt in Equa-
tion 2. A valid instrument should be correlated with the number of merchants but
orthogonal to the demand shock ⇠njt. We used two sets of instruments here. First,
following the pre-determined variable in Arellano and Bond (1991), we use the lag of
merchant size (after logarithm transformation) as the instrument. The argument is
that the demand shock to consumer base in period t should not be correlated with
the merchant size in period t � 2, after controlling for all the other variables in the
model. Second, we also leverage political advertising as an exogenous variation for
identification. Our data collection year, 2012, happened to be a presidential election
year in the U.S.. During an election year, political candidates and interest groups
(including party committees and outside political action groups known as PACs and
29

superPACs) invest heavily in television advertising, leading to an increase in ad prices
(Moshary et al., 2021). The increased cost of advertising leads merchants to look for
alternative marketing avenues such as participating in daily deals (Dholakia, 2011;
Edelman et al., 2016). Thus, the number of merchants on deal platforms should be
correlated with the amount of political election advertising in the market.8
We collect data on political advertisements across four types of elections that
year (presidential, gubernatorial, House, and Senate elections) (Fowler and Ridout,
2015), and compute the total amount of air time and ad spending across all can-
didates and parties in each market j during week t.9 In this empirical setting, it
often takes some time for the merchants to negotiate with the platform to determine
the terms (Li et al., 2017). Thus, we use the political advertising in period t � 1
as the instrument because such a specification captures the time lag associated with
the merchant base in t. The lagged advertising variable also helps the exogenous
assumption in that past political advertising should not directly a↵ect the current
deal demand ⇠njt.
We follow a similar identification strategy for the consumer base lnnjt in Equa-
tion 5. We use two sets of instruments: (1) the lag of consumer base with a degree
8In our data, we find positive correlations between merchant base and political advertising (thePearson correlation coe�cient was 0.19 (p<0.001) with ad spending and 0.05 (p<0.001) with airtime, indicating that there was a positive association between the number of merchants on Grouponand the amount of TV election ads in the market. We provide the detailed first-stage analysis inthe results section.
9The data on political advertising are at the designated market area (DMA) level. We mapthe advertising data onto the Groupon divisions (i.e., markets). The markets that fall into thesame DMA have the same value for the advertising variables. Including ads from gubernatorial,House, and Senate elections helped address the unequal allocation of campaign resources betweenbattleground and non-battleground states for presidential elections. In our data, only 5 (4.7%)DMAs received zero political advertising in 2012 and the remaining 95.3% all had some levels ofelection advertising on TV.
30
of 2, and (2) the precipitation and temperature in each market. The identification
argument for precipitation and temperature is based on the finding that consumers’
online shopping behaviors are shown to be influenced by weather conditions. Using
data from large-scale field experiments, Li et al. (2017) provided robust evidence that
consumer online shopping behaviors deviate significantly on rainy days from sunny
days, because of the impacts of weather on the mood and psychological states of
consumers. Based on these, we argue that the local weekly temperature and precip-
itation should correlate with consumers’ intention to shop Groupon deals, providing
the first-stage variation for identification. However, precipitation and temperature at
time t should not be correlated with the supply-side error ⇠mj,t, because the merchant
base has been determined prior to t due to the processing and negotiation time gap
required for merchants to show up on the platform. Thus, the exogenous requirement
for using precipitation and temperature as the instrumental variable is met.
4.2.3 Other Variables
Market size. Our specification requires the “size” for each market. On the con-
sumer side, the market size is defined as the total number of users who could partic-
ipate in the daily deal market. Because anyone with Internet access could use a deal
site, we use the number of Internet users as the measure of market size. The data
are retrieved from the “October 2012 School Enrollment and Internet Use Survey,”
a supplement to the Current Population Survey (CPS) by the U.S. Census Bureau.
On the merchant size, we measure the market size using the number of businesses
in each local market in 2012, which is extracted from the County Business Patterns
31

(CBP) database from the the U.S. Census Bureau 10. This data source tracks the
number of businesses in each market along with the NAICS industry code and a
short description. We matched the NAICS with the merchant types in Groupon and
LivingSocial and selected the business categories that have participated in the daily
deal industry.
Experience versus Search Goods. We code product categories on Groupon into
experience goods and search goods based on the nature of the product and services.
Following Li and Wu (2018), we administered an online survey to classify whether
a good or service possesses more experience attributes or search attributes. A total
of 818 respondents were asked to imagine that “user reviews are not available” on a
platform and then asked to assess for each category, “to what extent it is easy (hard)
to evaluate the quality without seeing or trying it.”11 The score closer to “easy”
(coded as 1) corresponds to more of a search good, and vice versa for experience
goods if the score is closer to “hard” (coded as 7) (Nelson, 1974). To ensure that
respondents can finish the survey within 5 minutes, each respondent answered a
random selection of 15 categories (on average, each category was rated by 136.3
respondents).
Table 5 presents the summary statistics from the survey. Across the total of 78
categories, the mean score is 4.72 (Standard Deviation = 1.02) and the median is
4.97. We used the median split and code each category into two groups: experience
10https://www.census.gov/programs-surveys/cbp/data/datasets.html. Accessed Feb 2021.11A total of 1,112 respondents were recruited on Amazon MTurk to participate the survey. 294
(26%) respondents failed the attention filler questions and hence were removed from the analysis.The detailed survey design and summary statistics are included in the Appendix.
32
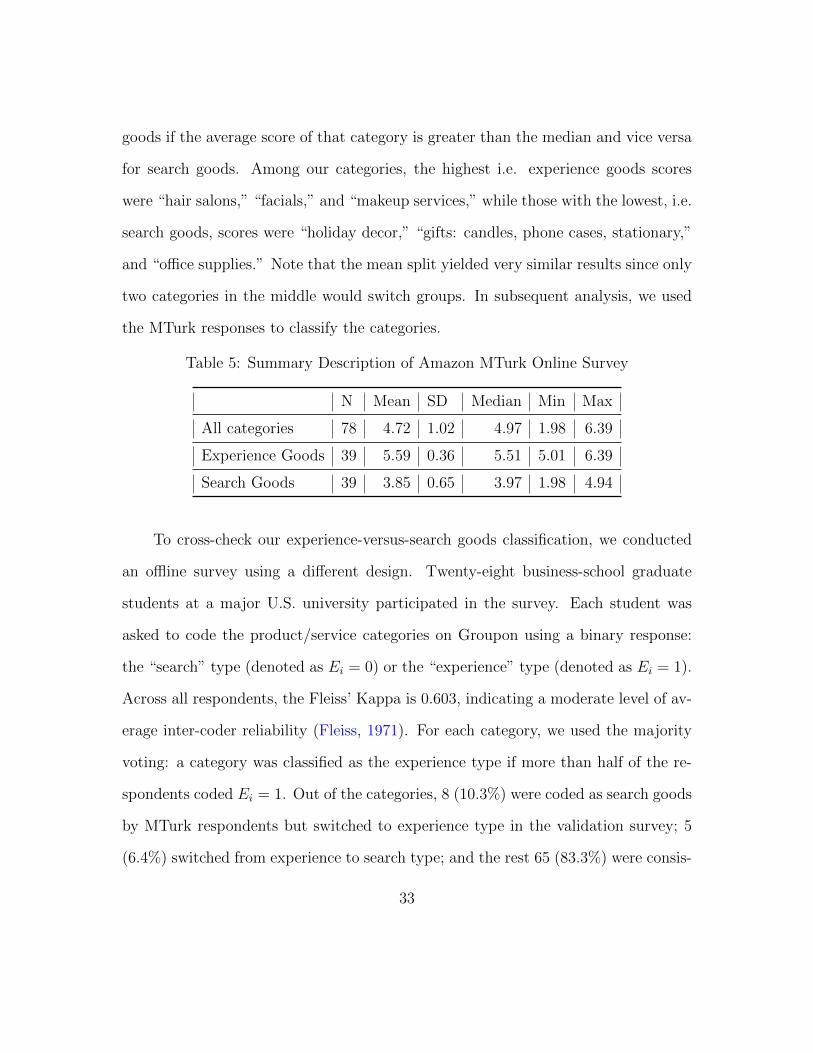
goods if the average score of that category is greater than the median and vice versa
for search goods. Among our categories, the highest i.e. experience goods scores
were “hair salons,” “facials,” and “makeup services,” while those with the lowest, i.e.
search goods, scores were “holiday decor,” “gifts: candles, phone cases, stationary,”
and “o�ce supplies.” Note that the mean split yielded very similar results since only
two categories in the middle would switch groups. In subsequent analysis, we used
the MTurk responses to classify the categories.
Table 5: Summary Description of Amazon MTurk Online Survey
N Mean SD Median Min Max
All categories 78 4.72 1.02 4.97 1.98 6.39
Experience Goods 39 5.59 0.36 5.51 5.01 6.39
Search Goods 39 3.85 0.65 3.97 1.98 4.94
To cross-check our experience-versus-search goods classification, we conducted
an o✏ine survey using a di↵erent design. Twenty-eight business-school graduate
students at a major U.S. university participated in the survey. Each student was
asked to code the product/service categories on Groupon using a binary response:
the “search” type (denoted as Ei = 0) or the “experience” type (denoted as Ei = 1).
Across all respondents, the Fleiss’ Kappa is 0.603, indicating a moderate level of av-
erage inter-coder reliability (Fleiss, 1971). For each category, we used the majority
voting: a category was classified as the experience type if more than half of the re-
spondents coded Ei = 1. Out of the categories, 8 (10.3%) were coded as search goods
by MTurk respondents but switched to experience type in the validation survey; 5
(6.4%) switched from experience to search type; and the rest 65 (83.3%) were consis-
33

tent between the two surveys. We estimated the main models based on the validation
survey and obtained qualitatively similar results. The detailed model estimates are
presented in the appendix.
Price. Lastly, deal price in Equations 2 and 5 could also be endogenous. A rational
platform would strategically adjust the deal price in response to an expected shock
in demand and supply. For example, if the demand is expected to be low, a platform
would be incentivized to reduce the price. In the same vein, if the supply is expected
to be strong, the platform would also be incentivized to adjust prices to increase
profits. To address this issue, we use the lagged deal prices as the instrument for
pjt, as proposed and tested in Villas-Boas and Winer (1999). The identification
assumption is that, the prices from the previous periods should be correlated with
the current price due to the common cost factors. But after controlling for the
market fixed e↵ects and other variables, they should be exogenous to the demand
and supply shock in the current period. We consider this assumption reasonable in
the Groupon setting, because many merchants on the platform provide services to
local customers and thus the cost of service within the market should be correlated
over time. However, Groupon typically feature di↵erent merchants in consecutive
weeks and thus the lagged prices should be uncorrelated with the current demand or
supply shock.
34
5 Empirical Findings
5.1 Parameter Estimates
In this section, we present the parameter estimates. As aforementioned, we lever-
age the fact that Groupon o↵ers products and services of di↵erent categories in
di↵erent markets, which allows us to estimate di↵erent types of network e↵ects in
a quasi multi-platform context. We estimate the consumer-side model (Equation
2) for search and experience goods, respectively, and present the results in Table
6. Similarly, the estimates for the merchant-side model (Equation 5) for search
and experience goods are presented in Table 7. For each table, we present the
fixed e↵ect estimator and the results based on the DGMM estimator after applying
first-di↵erencing and the instruments. In the subsequent section, we interpret the
coe�cients based on the DGMM results.
On the consumer side, the SS�1 is estimated to heterogeneous between expe-
rience and search goods. While the SS�1 is positive and significant for experience
goods (0.096, p < 0.05), it is insignificant for search goods (-0.034, p>0.10). As
hypothesized, because of the higher uncertainty prior to consumption, more existing
consumers can shed light on the quality of goods on the platform and attract more
future consumers, yielding a positive SS�1. However, the quality uncertainty for
search goods can be reduced through information search (for example, doing online
searches or reading consumer reports), the size of existing consumer base is no longer
found important for attracting future consumers.
The pattern is di↵erent for the CS0. The e↵ect of merchants on consumers is
35
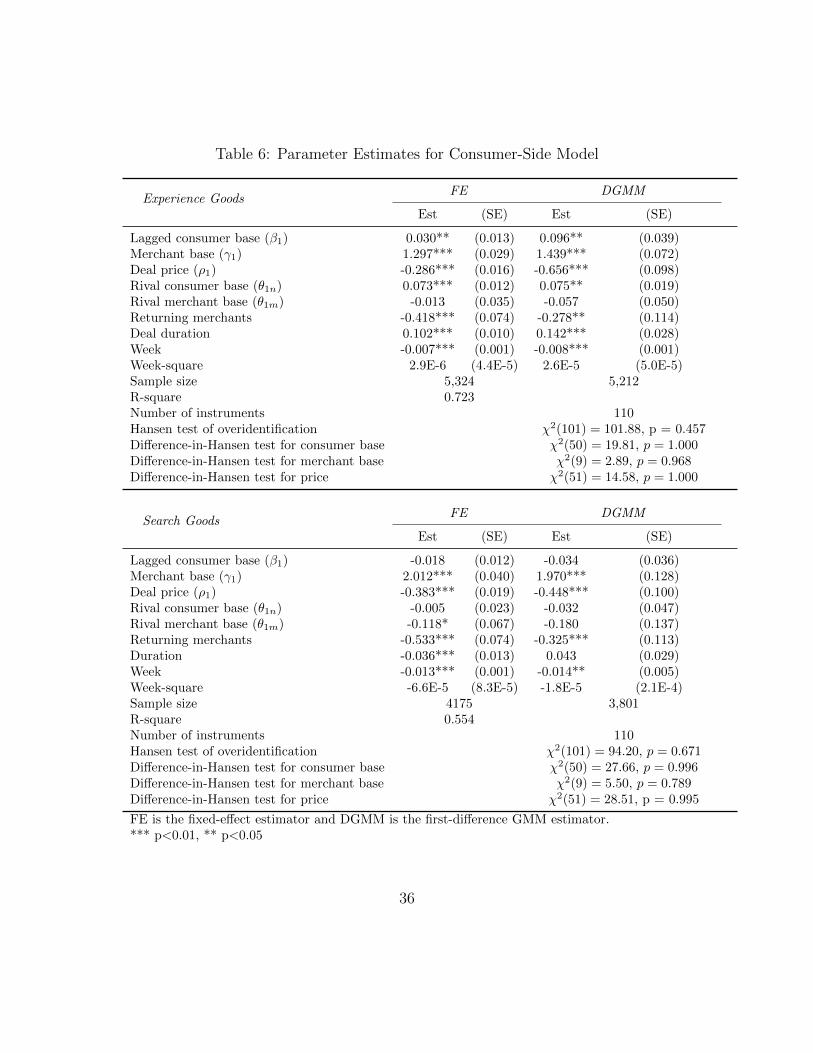
Table 6: Parameter Estimates for Consumer-Side Model
Experience GoodsFE DGMM
Est (SE) Est (SE)
Lagged consumer base (�1) 0.030** (0.013) 0.096** (0.039)Merchant base (�1) 1.297*** (0.029) 1.439*** (0.072)Deal price (⇢1) -0.286*** (0.016) -0.656*** (0.098)Rival consumer base (✓1n) 0.073*** (0.012) 0.075** (0.019)Rival merchant base (✓1m) -0.013 (0.035) -0.057 (0.050)Returning merchants -0.418*** (0.074) -0.278** (0.114)Deal duration 0.102*** (0.010) 0.142*** (0.028)Week -0.007*** (0.001) -0.008*** (0.001)Week-square 2.9E-6 (4.4E-5) 2.6E-5 (5.0E-5)Sample size 5,324 5,212R-square 0.723Number of instruments 110Hansen test of overidentification �2(101) = 101.88, p = 0.457Di↵erence-in-Hansen test for consumer base �2(50) = 19.81, p = 1.000Di↵erence-in-Hansen test for merchant base �2(9) = 2.89, p = 0.968Di↵erence-in-Hansen test for price �2(51) = 14.58, p = 1.000
Search GoodsFE DGMM
Est (SE) Est (SE)
Lagged consumer base (�1) -0.018 (0.012) -0.034 (0.036)Merchant base (�1) 2.012*** (0.040) 1.970*** (0.128)Deal price (⇢1) -0.383*** (0.019) -0.448*** (0.100)Rival consumer base (✓1n) -0.005 (0.023) -0.032 (0.047)Rival merchant base (✓1m) -0.118* (0.067) -0.180 (0.137)Returning merchants -0.533*** (0.074) -0.325*** (0.113)Duration -0.036*** (0.013) 0.043 (0.029)Week -0.013*** (0.001) -0.014** (0.005)Week-square -6.6E-5 (8.3E-5) -1.8E-5 (2.1E-4)Sample size 4175 3,801R-square 0.554Number of instruments 110Hansen test of overidentification �2(101) = 94.20, p = 0.671Di↵erence-in-Hansen test for consumer base �2(50) = 27.66, p = 0.996Di↵erence-in-Hansen test for merchant base �2(9) = 5.50, p = 0.789Di↵erence-in-Hansen test for price �2(51) = 28.51, p = 0.995
FE is the fixed-e↵ect estimator and DGMM is the first-di↵erence GMM estimator.*** p<0.01, ** p<0.05
36
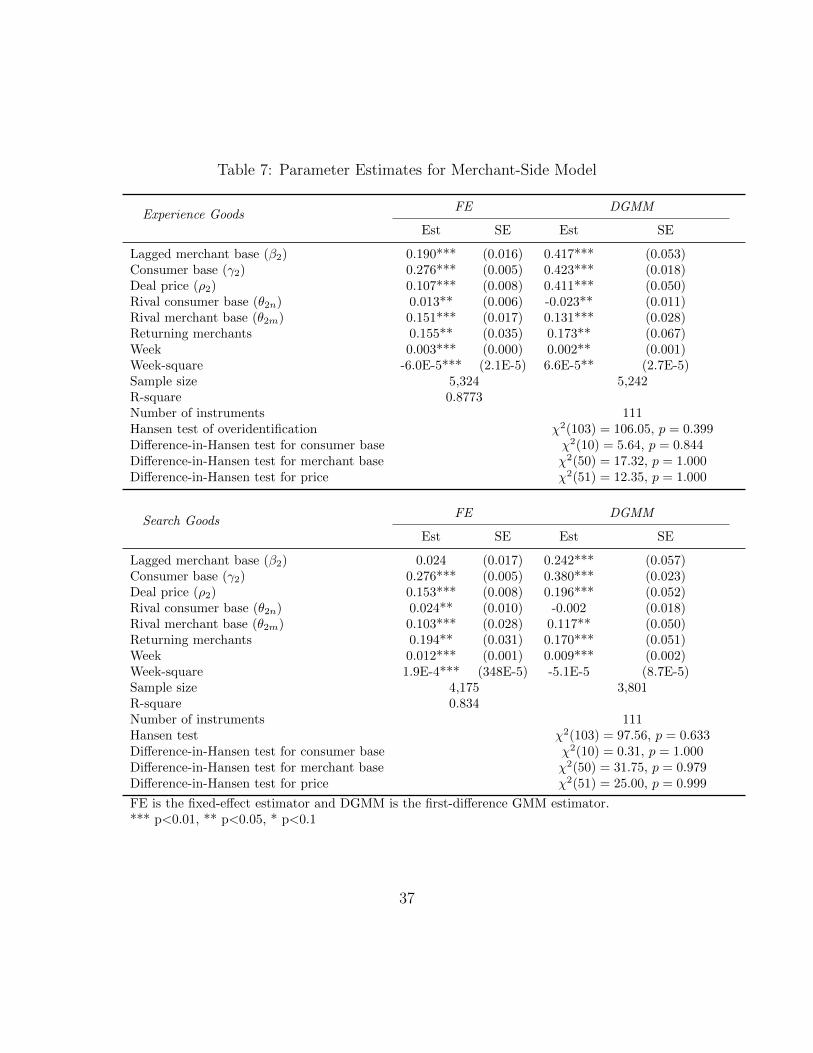
Table 7: Parameter Estimates for Merchant-Side Model
Experience GoodsFE DGMM
Est SE Est SE
Lagged merchant base (�2) 0.190*** (0.016) 0.417*** (0.053)Consumer base (�2) 0.276*** (0.005) 0.423*** (0.018)Deal price (⇢2) 0.107*** (0.008) 0.411*** (0.050)Rival consumer base (✓2n) 0.013** (0.006) -0.023** (0.011)Rival merchant base (✓2m) 0.151*** (0.017) 0.131*** (0.028)Returning merchants 0.155** (0.035) 0.173** (0.067)Week 0.003*** (0.000) 0.002** (0.001)Week-square -6.0E-5*** (2.1E-5) 6.6E-5** (2.7E-5)Sample size 5,324 5,242R-square 0.8773Number of instruments 111Hansen test of overidentification �2(103) = 106.05, p = 0.399Di↵erence-in-Hansen test for consumer base �2(10) = 5.64, p = 0.844Di↵erence-in-Hansen test for merchant base �2(50) = 17.32, p = 1.000Di↵erence-in-Hansen test for price �2(51) = 12.35, p = 1.000
Search GoodsFE DGMM
Est SE Est SE
Lagged merchant base (�2) 0.024 (0.017) 0.242*** (0.057)Consumer base (�2) 0.276*** (0.005) 0.380*** (0.023)Deal price (⇢2) 0.153*** (0.008) 0.196*** (0.052)Rival consumer base (✓2n) 0.024** (0.010) -0.002 (0.018)Rival merchant base (✓2m) 0.103*** (0.028) 0.117** (0.050)Returning merchants 0.194** (0.031) 0.170*** (0.051)Week 0.012*** (0.001) 0.009*** (0.002)Week-square 1.9E-4*** (348E-5) -5.1E-5 (8.7E-5)Sample size 4,175 3,801R-square 0.834Number of instruments 111Hansen test �2(103) = 97.56, p = 0.633Di↵erence-in-Hansen test for consumer base �2(10) = 0.31, p = 1.000Di↵erence-in-Hansen test for merchant base �2(50) = 31.75, p = 0.979Di↵erence-in-Hansen test for price �2(51) = 25.00, p = 0.999
FE is the fixed-e↵ect estimator and DGMM is the first-di↵erence GMM estimator.*** p<0.01, ** p<0.05, * p<0.1
37

found to be positive and significant for both categories. The CS0 for experience
goods is estimated to be 1.439 (p<0.01), and the CS0 for search goods is estimated
to be even 37% higher than the former (1.970, p<0.01).
On the merchant side, the SS�1 is estimated to be positive and significant for
experience goods (0.417, p<0.01) and search goods (0.242, p<0.01). The CS0 of
consumers on merchants is also estimated to exist for both product markets. The
CS0 for experience goods is estimated to be 0.423 (p<0.01), and the CS0 for search
goods is estimated to be 0.380 (p<0.01).
In sum, on the merchant side, the SS�1 for experience goods is found to be
approximately 1.7 as large as that for search goods, while the CS0 is qualitatively
similar between these two categories. This is again consistent with our hypothesized
e↵ects. In the experience-goods category, merchants benefit from the UGC that
existing consumers have contributed, because it can help reduce quality uncertainty
and create demand. Thus, the SS�1 of the merchants is found to be larger for
merchants of experience goods. In contrast, merchants o↵ering search goods do not
benefit as much from existing UGC, and the SS�1 in the search-goods category is
significant but weaker.
Next, we present the results for control variables. Not surprisingly, price is
estimated to have a negative e↵ect on consumer base and a positive e↵ect on the
merchant base. For experience goods, the consumer price elasticity is estimated to be
-0.656 (p<0.01), and the merchant price elasticity is estimated to be 0.411 (p<0.01).
For search goods, the consumer price elasticity is estimated to be -0.448 (p<0.01),
the merchant price elasticity is estimated to be 0.196 (p<0.01).
38

Furthermore, after controlling for SS�1 and CS0, the number of returning mer-
chant is found to be negatively related with consumer base for experience goods
(-0.278, p < 0.05) and search goods (-0.325, p < 0.01), indicating that consumers
overall respond more positively to new merchants. This finding is consistent with
the “switching risk reduction” hypothesis in (Li et al., 2011): because user reviews
are more helpful for informing consumers for experience goods, consumers find it
less risky to try new products rather than sticking with known products, resulting
in a negative association between returning merchants and the consumer base. In
other words, consumers respond more positively to new merchants than to existing
merchants.
5.2 Robustness Analyses
To verify the validity of our results, it is critical to assess the extent to which the
assumptions are met for the DGMM estimator. The first important assumption is
that the instrumental variables used for identification should be exogenous to the
errors. We present the results from the Hansen test of overidentification restrictions.
On the consumer side, the Hansen test statistics are �2(101) = 101.88 (p = 0.457)
and �2(101) = 94.20 (p = 0.671) for experience and search goods, respectively. On
the merchant side, the test statistics are �2(103) = 106.05 (p = 0.399) for experience
goods and �2(103) = 97.56 (p = 0.633) for search goods. These results indicate
that the null hypothesis of that all IVs are exogenous should not be rejected at
0.05 level. Furthermore, Tables 6 and 7 include the Di↵erence-in-Hansen test for
each endogenous variable in our models. The results indicate that the exogenous IV
39
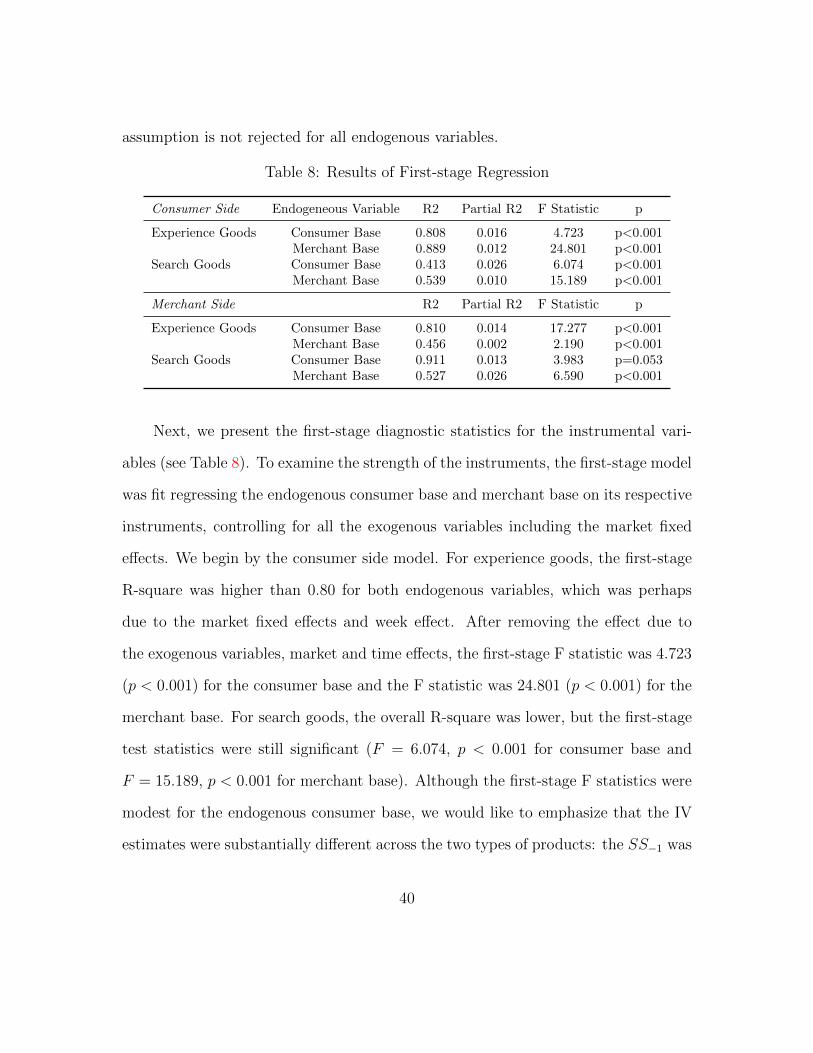
assumption is not rejected for all endogenous variables.
Table 8: Results of First-stage Regression
Consumer Side Endogeneous Variable R2 Partial R2 F Statistic p
Experience Goods Consumer Base 0.808 0.016 4.723 p<0.001Merchant Base 0.889 0.012 24.801 p<0.001
Search Goods Consumer Base 0.413 0.026 6.074 p<0.001Merchant Base 0.539 0.010 15.189 p<0.001
Merchant Side R2 Partial R2 F Statistic p
Experience Goods Consumer Base 0.810 0.014 17.277 p<0.001Merchant Base 0.456 0.002 2.190 p<0.001
Search Goods Consumer Base 0.911 0.013 3.983 p=0.053Merchant Base 0.527 0.026 6.590 p<0.001
Next, we present the first-stage diagnostic statistics for the instrumental vari-
ables (see Table 8). To examine the strength of the instruments, the first-stage model
was fit regressing the endogenous consumer base and merchant base on its respective
instruments, controlling for all the exogenous variables including the market fixed
e↵ects. We begin by the consumer side model. For experience goods, the first-stage
R-square was higher than 0.80 for both endogenous variables, which was perhaps
due to the market fixed e↵ects and week e↵ect. After removing the e↵ect due to
the exogenous variables, market and time e↵ects, the first-stage F statistic was 4.723
(p < 0.001) for the consumer base and the F statistic was 24.801 (p < 0.001) for the
merchant base. For search goods, the overall R-square was lower, but the first-stage
test statistics were still significant (F = 6.074, p < 0.001 for consumer base and
F = 15.189, p < 0.001 for merchant base). Although the first-stage F statistics were
modest for the endogenous consumer base, we would like to emphasize that the IV
estimates were substantially di↵erent across the two types of products: the SS�1 was
40

positive and significant (0.096, p < 0.05) for the experience goods and insignificant
for search goods (-0.034, p > 0.010). Thus, the heterogeneous SS�1 between expe-
rience and search products is not driven by the di↵erence in the explanatory power
of the IVs. The first-stage statistics are qualitatively similar for the merchant size
model. The F statistics are modest for both endogenous variables but the p-values
were all smaller than 0.1, even after controlling for all the exogenous variables, the
time e↵ect, and the extensive set of market fixed e↵ects.
We conduct another robustness analysis to validate our estimates of the network
e↵ects. Specifically, we replace the focal market’s SS�1 and CS0 e↵ects with the non-
local counterparts. For the new SS�1, we add up the customer size and merchant
size (for Equations 2 and 5 respectively) in the previous period across all the markets
on Groupon other than the focal market. The CS0 variables are constructed simi-
larly. Because these variables reflect the (lagged) customer size and merchant size
of the platform in other markets, they capture the network e↵ects due to non-local
influences (if any). The parameters are presented in Tables 18 and 19. From the
results, we see that the non-local network e↵ects are all estimated to be close to zero
and weaker than the local network e↵ects, indicating that consumers and merchants
on Groupon are attracted bySS�1 and CS0 within the same local market.
This analysis also provides additional validation for the IV estimates of our main
models. The non-local variables should be uncorrelated with the local market politi-
cal advertising and weather conditions, and thus our instruments would not provide
the needed variation for identification. As expected, the corresponding coe�cient es-
timates are much reduced, providing validation evidence for using the instrumental
41
variables to identify the local network e↵ects.
5.3 The Analysis of A User Growth Strategy
In this section, we calculate CLV 2 and MLV 2 based on the parameter estimates
from the foregoing models and examine the e↵ectiveness of the user growth strategy.
5.3.1 The Customer Lifetime Value in Two-sided Markets
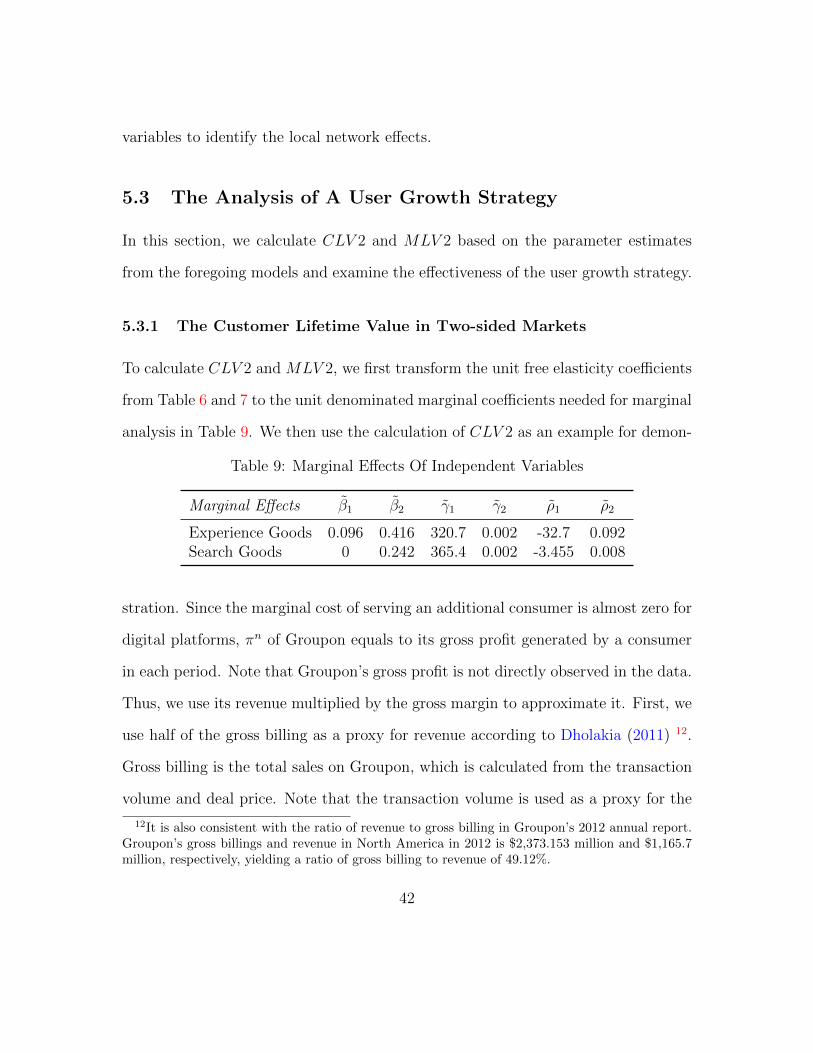
To calculate CLV 2 and MLV 2, we first transform the unit free elasticity coe�cients
from Table 6 and 7 to the unit denominated marginal coe�cients needed for marginal
analysis in Table 9. We then use the calculation of CLV 2 as an example for demon-
Table 9: Marginal E↵ects Of Independent Variables
Marginal E↵ects �1 �2 �1 �2 ⇢1 ⇢2
Experience Goods 0.096 0.416 320.7 0.002 -32.7 0.092Search Goods 0 0.242 365.4 0.002 -3.455 0.008
stration. Since the marginal cost of serving an additional consumer is almost zero for
digital platforms, ⇡n of Groupon equals to its gross profit generated by a consumer
in each period. Note that Groupon’s gross profit is not directly observed in the data.
Thus, we use its revenue multiplied by the gross margin to approximate it. First, we
use half of the gross billing as a proxy for revenue according to Dholakia (2011) 12.
Gross billing is the total sales on Groupon, which is calculated from the transaction
volume and deal price. Note that the transaction volume is used as a proxy for the
12It is also consistent with the ratio of revenue to gross billing in Groupon’s 2012 annual report.Groupon’s gross billings and revenue in North America in 2012 is $2,373.153 million and $1,165.7million, respectively, yielding a ratio of gross billing to revenue of 49.12%.
42

consumer base. Thus, we use the increased consumer base multiplied by the deal
price to calculate the gross billing. Second, in Groupon’s 2012 annual report, the
gross profit accounted for less than 70% of Groupon’s revenue. In later years, this
percentage decreased to around 50%. We use 70% of Groupon’s revenue to represent
the gross profit, which sets an upper bound of CLV 2.
According to Equation 7, we calculate CLV 2 in experience-goods and search-
goods markets, respectively. The same logic applies to the MLV 2. Table 10 reports
the CLV 2 and MLV 2 in experience-goods and search-goods markets. According to
our calculation, a consumer is worth $62 and a merchant is worth $31,654 in the
experience-goods market. In the search-goods market, a consumer is worth $54 and
a merchant is worth $26,338. Although the CS0 of experience goods and search
goods are all positive and significant, the CLV 2 and MLV 2 in the experience goods
market are larger than those in the search goods market, as a result of the di↵erences
in SS�1. In the experience-goods market, the SS�1 of consumers amplifies the CLV 2
by 1.15 times, and the SS�1 of merchants amplifies the MLV 2 by 1.66 times. In the
search-goods market, due to the absence of a significant SS�1 of consumers and a
relative weaker SS�1 of merchants, the value created on both sides of the market has
less opportunity to be amplified over time. The positive shocks that a market may
receive in one period quickly dissipate and do not result in persistent value creation.
Table 10: Estimated Customer Lifetime Value
Customer Lifetime Value CLV 2 MLV 2
Experience Goods($) 62 31,654Search Goods ($) 54 26,338
43

5.3.2 The User Acquisition Cost
To boost growth, platforms can consider marketing to increase their consumer base,
hoping that the incremental consumer base could lead to future increases in the
consumer base and merchant base. In this section, we consider two commonly used
marketing strategies: (1) advertising to buy consumers, and (2) implementing price
discounts. We then compare the CLV 2 computed in the previous section to the
consumer acquisition cost. Note that this analysis can be applied to both consumer
side and merchant side. However, platforms’ cost to acquire merchants is typically
unavailable to researchers, which is the case for Groupon. In its annual report,
Groupon reported neither the expense of acquiring merchants nor the growth of its
merchant base. As a result, our cost-and-benefit analysis focuses on the consumer
side.
Intervention – Acquisition Through Marketing. We first look at the scenario
when the platform uses advertising marketing as the user-growth strategy. The con-
sumer acquisition cost (CAC) in this case is calculated as the total marketing expense
divided by the total number of acquired consumers (Gupta et al., 2004; McCarthy
and Fader, 2018). In its 2012 annual report, Groupon reported a total marketing
expense of $336.85 million with 7.3 million consumers acquired worldwide, yielding
an acquisition cost of $46 per new consumer globally. In North America, the mar-
keting expense was $105.9 million, but the report did not include the total number
of consumers acquired in North America. Based on the proportion of gross billing
in North America ($2.37 billion) relative to worldwide sales ($5.38 billion), we esti-
44

mated the number of new consumers in North America as 3.22 million, which yields
an estimated cost of $33 to acquire a new consumer. Table 11 reports Groupon’s
net CLV 2 in North America, which is equal to CLV 2 minus CAC. It represents
a net CLV 2 of $29 in the experience-goods market but a net CLV 2 of $21 in the
search-goods market, which implies that the consumer acquisition through market-
ing is less e↵ective in the search-goods market than the experience goods market due
to di↵erent CLV 2 in these markets. Note that fixed costs and operating costs as-
sociated with serving consumers are not included in this calculation. If we amortize
these costs to each consumer, the net CLV 2 will become negative.
Table 11: Cost-and-Benefit Analysis of Marketing Acquisition
Experience Goods Search Goods
Consumer Lifetime Value ($) 62 54Consumer Acquisition Cost ($) 33 33Net Consumer Lifetime Value ($) 29 21
Intervention – Price Cut. In a two-sided market, a price cut can stimulate
greater participation on the discounted side and the other side of the market through
various network e↵ects. We analyze the cost and benefit of a price cut on each side of
the market. We use the formula of the marginal e↵ect of the deal price in Section 5.2.1
to calculate the increase in the consumer base and merchant base for the promotion
on each side, which is then multiplied by the CLV 2 and MLV 2 to obtain the total
increased value.
Table 12 illustrates these results. For experience goods, a $1 cut in the deal
price brings 33.2 additional consumers and 0.063 additional merchants, yielding a
45

total increased value of $4,035. Based on the average transaction volume of each
market, the promotion cost is calculated to be $3,959. Thus, the net gain from deal
promotion is $ 76. For search goods, a $1 cut in the deal price brings 4.03 additional
consumers and 0.008 additional merchants, yielding a total increased value of $435.
Based on the average transaction volume of each market, the promotion cost is
calculated to be $704. Thus, the net gain from deal promotion is $ -269. Due to
the di↵erence between the CLV 2 and MLV 2 in the experience-goods and search-
goods markets, the deal promotion for experience goods is cost-e↵ective but the deal
promotion for search goods is not cost-e↵ective.
Table 12: Cost-and-Benefit Analysis of Price Promotion
$1 price cut Experience Goods Search Goods
Increase in consumer base 33.2 4.03Increase in merchant base 0.063 0.008Total increase in value ($) 4,035 435
Promotion cost ($) 3,959 704
Net gain ($) 76 -269
6 Managerial Implications: Platform Designs to
Enhance User Stickiness
For platforms with a strong CS0 but a weak SS�1, platform design choices that en-
hance user stickiness may o↵er greater leverage than common marketing strategies
that bring users to a platform. In this research, we define user stickiness as the
ability of the platform to continually attract users in each period. We first calculate
46

the CLV 2 and MLV 2 in simulations when the user stickiness is enhanced, and then
discuss two methods of enhancing user stickiness. One method considers platform
design choices such as improved reputation systems that are derived from user net-
work e↵ects. The second method considers the design choices that are not derived
from user network e↵ects but from the improved platform quality. For example, the
development of a merchant information management system reduces the risk of disin-
termediation and reroutes transactions through the platform rather than conducting
them o↵-platform. The direct implications of this design intervention is that users
become stickier on the platform, leading to increases in CLV 2 and MLV 2. Lastly,
we discuss the feasibility of these platform design choices as compared to a similar
platform.
6.1 Simulating Enhanced User Stickiness
We use the CLV 2 and MLV 2 in the experience-goods market as an example to
simulate the impact of changing the strength of SS�1 of consumers (i.e., modifying
�1). We simulate three scenarios of �1: 0.1, 0.5, and 0.9, and compute the corre-
sponding updated CLV 2 and MLV 2. Similarly, we simulate the impact of changing
the strength of SS�1 of merchants by modifying �2. Table 13 presents the results.
When the SS�1 of consumers or merchants changes, it has a substantial impact
on CLV 2 and MLV 2. Boosting �1 from 0.096 to 0.5 would improve the CLV 2 by
1.8 times and the MLV 2 by 1.4 times. Boosting �1 from 0.096 to 0.9 would improve
the CLV 2 by 9 times and the MLV 2 by 5.2 times. Boosting �2 from 0.417 to 0.5
would improve the CLV 2 by 1.1 times and the MLV 2 by 1.2 times. Boosting �1
47
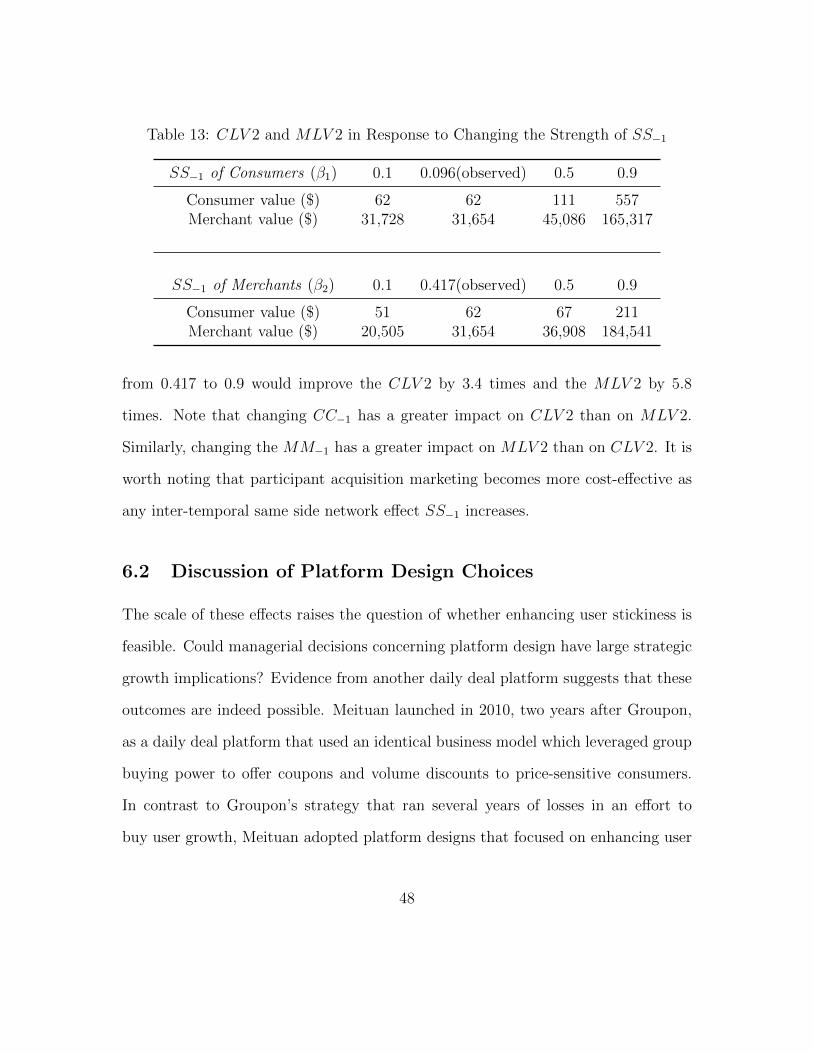
Table 13: CLV 2 and MLV 2 in Response to Changing the Strength of SS�1
SS�1 of Consumers (�1) 0.1 0.096(observed) 0.5 0.9
Consumer value ($) 62 62 111 557Merchant value ($) 31,728 31,654 45,086 165,317
SS�1 of Merchants (�2) 0.1 0.417(observed) 0.5 0.9
Consumer value ($) 51 62 67 211Merchant value ($) 20,505 31,654 36,908 184,541
from 0.417 to 0.9 would improve the CLV 2 by 3.4 times and the MLV 2 by 5.8
times. Note that changing CC�1 has a greater impact on CLV 2 than on MLV 2.
Similarly, changing the MM�1 has a greater impact on MLV 2 than on CLV 2. It is
worth noting that participant acquisition marketing becomes more cost-e↵ective as
any inter-temporal same side network e↵ect SS�1 increases.
6.2 Discussion of Platform Design Choices
The scale of these e↵ects raises the question of whether enhancing user stickiness is
feasible. Could managerial decisions concerning platform design have large strategic
growth implications? Evidence from another daily deal platform suggests that these
outcomes are indeed possible. Meituan launched in 2010, two years after Groupon,
as a daily deal platform that used an identical business model which leveraged group
buying power to o↵er coupons and volume discounts to price-sensitive consumers.
In contrast to Groupon’s strategy that ran several years of losses in an e↵ort to
buy user growth, Meituan adopted platform designs that focused on enhancing user
48
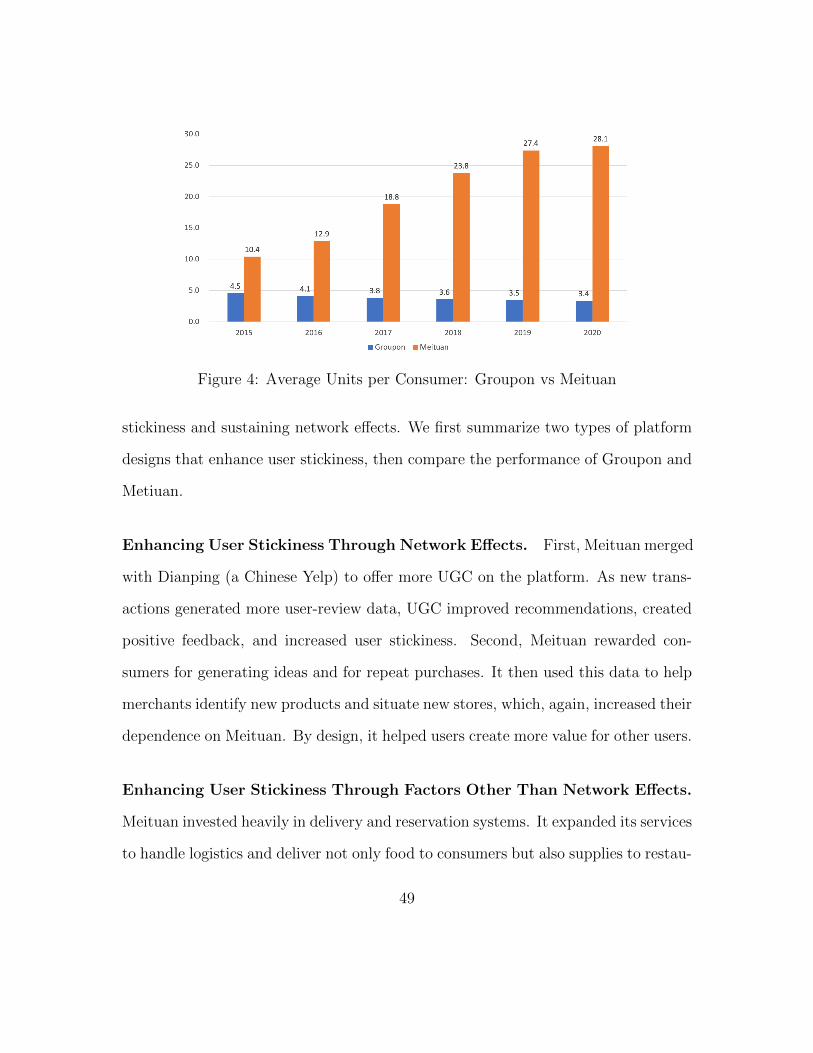
Figure 4: Average Units per Consumer: Groupon vs Meituan
stickiness and sustaining network e↵ects. We first summarize two types of platform
designs that enhance user stickiness, then compare the performance of Groupon and
Metiuan.
Enhancing User Stickiness Through Network E↵ects. First, Meituan merged
with Dianping (a Chinese Yelp) to o↵er more UGC on the platform. As new trans-
actions generated more user-review data, UGC improved recommendations, created
positive feedback, and increased user stickiness. Second, Meituan rewarded con-
sumers for generating ideas and for repeat purchases. It then used this data to help
merchants identify new products and situate new stores, which, again, increased their
dependence on Meituan. By design, it helped users create more value for other users.
Enhancing User Stickiness Through Factors Other Than Network E↵ects.
Meituan invested heavily in delivery and reservation systems. It expanded its services
to handle logistics and deliver not only food to consumers but also supplies to restau-
49
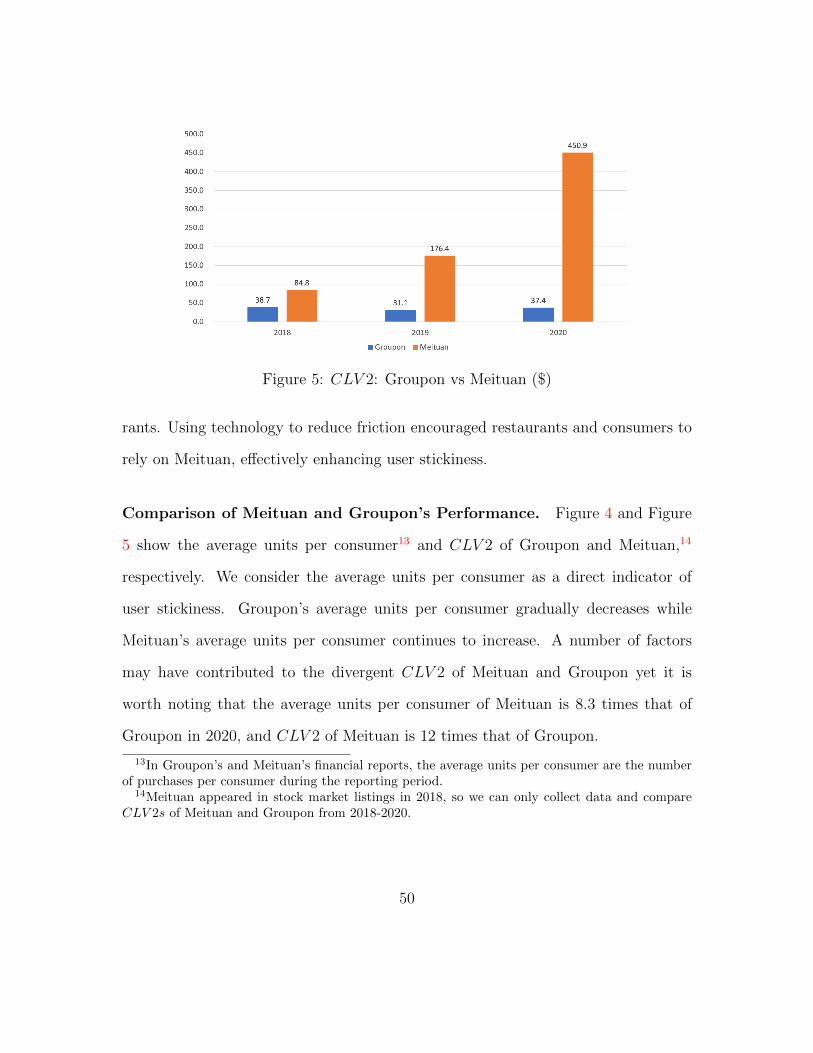
Figure 5: CLV 2: Groupon vs Meituan ($)
rants. Using technology to reduce friction encouraged restaurants and consumers to
rely on Meituan, e↵ectively enhancing user stickiness.
Comparison of Meituan and Groupon’s Performance. Figure 4 and Figure
5 show the average units per consumer13 and CLV 2 of Groupon and Meituan,14
respectively. We consider the average units per consumer as a direct indicator of
user stickiness. Groupon’s average units per consumer gradually decreases while
Meituan’s average units per consumer continues to increase. A number of factors
may have contributed to the divergent CLV 2 of Meituan and Groupon yet it is
worth noting that the average units per consumer of Meituan is 8.3 times that of
Groupon in 2020, and CLV 2 of Meituan is 12 times that of Groupon.
13In Groupon’s and Meituan’s financial reports, the average units per consumer are the numberof purchases per consumer during the reporting period.
14Meituan appeared in stock market listings in 2018, so we can only collect data and compareCLV 2s of Meituan and Groupon from 2018-2020.
50
7 Limitations & Research Opportunities
There are several directions for future research. First, platforms have multiple
ways to improve their long-term value. Should a platform invest in user growth,
the design of network e↵ects, key assets, brand, or other factors? It is worth gath-
ering real data on the comparative costs and benefits of these strategies before the
platform makes investment decisions. Second, in our empirical setting, we include
the competition e↵ect from the primary competing platform. Although this should
capture the competition in many markets, we acknowledge that, in some markets,
there could be other major platforms as a key player. Future analysis can improve
the competition analysis. Third, our CLV 2 model is not based on accounting profit
in each future period. Following Zhang et al. (2012) and Li et al. (2020), we iden-
tify users’ impact on future profits. Since we want to estimate the value created by
users, our model is suitable for this research. However, our model cannot capture
the impact of increased platform quality on future profits, it may underestimate the
CLV 2 when platform quality increases during the observation period. It would be
valuable to develop a CLV 2 model that can capture the impact of network e↵ects as
well as platform quality on future profits. Lastly, the strengths of the inter-temporal
e↵ects and within-period e↵ects can di↵er strongly across di↵erent markets. We have
shown that they vary by product categories on one platform, and in future research,
we aim to identify and compare the inter-temporal e↵ects across multiple platforms.
51

8 Conclusions
We study how users drive nework value in two-sided markets. Introducing time, we
develop a discrete-choice model to estimate both within and across period network
e↵ects, which have been under-studied in empirical research (Jullien et al., 2021).
Our model underscores, in particular, the importance of same-side intertemporal
attraction. For certain platforms, weak same-side e↵ects SS�1 yield poor user stick-
iness and the impacts of strong cross-side e↵ects CS0 may not persist. Based on our
estimates, we develop a model to calculate consumer (CLV 2) and merchant (MLV 2)
lifetime value in two-sided markets. By comparing CLV 2 and user acquisition costs,
a platform can examine the e↵ectiveness of di↵erent user growth strategies. We
theorize that the mechanism behind heterogeneous SS�1 is the “product learning”
e↵ect: products with higher uncertainty garner a higher value from user contribu-
tions (Hagiu and Wright, 2020; Li et al., 2017). Our theoretical simulations and
empirical estimates confirm di↵erent levels of SS�1 between search and experience
goods. We then discuss platform strategic responses when cross-side e↵ects CS0 are
strong but same-side e↵ects SS�1 are weak. Results show that stickiness enhanc-
ing platform designs can increase CLV 2 and MLV 2. After users become stickier,
user acquisition marketing becomes more cost-e↵ective. Data on customer lifetime
value at Meituan demontrates that enhancing user stickiness is feasible and can be
designed. Overall, our findings remind managers not to overemphasize user growth
when the user stickiness is poor and instead focus on platform designs that increase
user to user stickiness.
We believe these results o↵er the following three contributions. First, theoretical
52

models of network e↵ects have largely been static. Empirical models of network
e↵ects have largely been absent or have struggled to address the reflection problem.
Extending these works, our model addresses dynamic network e↵ects, including both
within and across period attraction, for two-sided markets. We address the reflection
problem by using prior period instruments for both sides as well as current period
instruments a↵ecting only one side. Main results are economically and statistically
significant. In cases where our instruments are not strong, we contrast within market
estimates to demonstrate key results hold.
Second, the customer lifetime value literature has omitted network spillovers in
CLV calculations (Gupta and Mela, 2008). Our research provides a straightforward
set of tools for making these estimates, accounting for how CLV2 and MLV2 a↵ect
each other. This can also account for the lifetime value of “free” customers, who
attract other sides of the market but do not themselves pay. Of necessity, these
calculations are interdependent when network e↵ects are present. Our results show
spillovers are, in fact, present confirming the need for such a model.
Third, we identify factors that can strengthen or weaken each of the four sets
of network e↵ects in our study. As illustration, selling experience goods raises the
importance of same-side customer adoption whereas selling search goods does not.
By contrast, both matter for merchants’ network attraction. Other salient factors
include a competitor’s customer and merchant bases, own and rival prices, and local
versus non-local interaction. Equipped with the ability to estimate attraction, reten-
tion, and now cross-market spillovers, managers and investors can design marketing
and information systems interventions that o↵er greater lifetime value leverage. Be-
53
yond the suggestive examples of Amazon, SAP, Airbnb and others, case analyses of
Meituan and Groupon provide helpful guidance.
References
Anderson, T. W. and C. Hsiao (1981). Estimation of dynamic models with errorcomponents. Journal of the American Statistical Association 76 (375), 598–606.
Arellano, M. and S. Bond (1991). Some tests of specification for panel data: Montecarlo evidence and an application to employment equations. The Review of Eco-nomic Studies 58 (2), 277–297.
Arellano, M. and O. Bover (1995). Another look at the instrumental variable esti-mation of error-components models. Journal of Econometrics 68 (1), 29–51.
Armstrong, M. (2006). Competition in two-sided markets. The RAND Journal ofEconomics 37 (3), 668–691.
Benzell, S., G. Lagarda, and M. W. Van Alstyne (2017). The Impact of APIs onFirm Performance. SSRN Working Paper 2843326.
Berry, S., J. Levinsohn, and A. Pakes (1995). Automobile prices in market equilib-rium. Econometrica: Journal of the Econometric Society , 841–890.
Biglaiser, G., E. Calvano, and J. Cremer (2019). Incumbency advantage and itsvalue. Journal of Economics & Management Strategy 28 (1), 41–48.
Boudreau, K. (2010). Open platform strategies and innovation: Granting access vs.devolving control. Management Science 56 (10), 1849–1872.
Brealey, R. A., S. C. Myers, F. Allen, and P. Mohanty (2012). Principles of CorporateFinance. Tata McGraw-Hill Education.
Cabral, L. (2011). Dynamic price competition with network e↵ects. The Review ofEconomic Studies 78 (1), 83–111.
Cabral, L. M. (1990). On the adoption of innovations with ‘network’externalities.Mathematical Social Sciences 19 (3), 299–308.
54

Caillaud, B. and B. Jullien (2003). Chicken & egg: Competition among intermedia-tion service providers. RAND journal of Economics , 309–328.
Ceccagnoli, M., C. Forman, P. Huang, and D. Wu (2012). Cocreation of value ina platform ecosystem: The case of enterprise software. MIS Quarterly 36 (1),263–290.
Chen, W., B. Gu, Q. Ye, and K. X. Zhu (2019). Measuring and managing the exter-nality of managerial responses to online customer reviews. Information SystemsResearch 30 (1), 81–96.
Chu, J. and P. Manchanda (2016). Quantifying cross and direct network e↵ects inonline consumer-to-consumer platforms. Marketing Science 35 (6), 870–893.
Church, J., N. Gandal, and D. Krause (2008). Indirect network e↵ects and adoptionexternalities. Review of Network Economics 7 (3).
Clements, M. T. (2004). Direct and indirect network e↵ects: are they equivalent?International Journal of Industrial Organization 22 (5), 633–645.
Cusumano, M. A., D. B. Yo�e, and A. Gawer (2020, February). The future ofplatforms. MIT Sloan Management Review .
Dellarocas, C. (2003). The digitization of word of mouth: Promise and challenges ofonline feedback mechanisms. Management Science 49 (10), 1407–1424.
Dholakia, U. M. (2011, June 13). How businesses fare with daily deals: A multi-siteanalysis of Groupon, Livingsocial, Opentable, Travelzoo, and Buywithme promo-tions. SSRN Working Paper 1863466.
Dube, J.-P. H., G. J. Hitsch, and P. K. Chintagunta (2010). Tipping and concentra-tion in markets with indirect network e↵ects. Marketing Science 29 (2), 216–249.
Economides, N. (1996). The economics of networks. International journal of indus-trial organization 14 (6), 673–699.
Edelman, B., S. Ja↵e, and S. D. Kominers (2016). To groupon or not to groupon:The profitability of deep discounts. Marketing Letters 27 (1), 39–53.
Eisenmann, T., G. Parker, and M. W. Van Alstyne (2006). Strategies for two-sidedmarkets. Harvard business review 84 (10), 92.
55
Farrell, J. and P. Klemperer (2007). Coordination and lock-in: Competition withswitching costs and network e↵ects. Handbook of Industrial Organization 3, 1967–2072.
Fleiss, J. L. (1971). Measuring nominal scale agreement among many raters. Psy-chological bulletin 76 (5), 378.
Forman, C., A. Ghose, and B. Wiesenfeld (2008). Examining the relationship betweenreviews and sales: The role of reviewer identity disclosure in electronic markets.Information Systems Rresearch 19 (3), 291–313.
Fowler, Erika Franklin, M. M. F. and T. N. Ridout (2015). “Political Advertisingin 2012” Version 1.0 [dataset]. Middletown, CT: The Wesleyan Media Project,Department of Government at Wesleyan University.
Ghose, A., P. G. Ipeirotis, and B. Li (2012). Designing ranking systems for ho-tels on travel search engines by mining user-generated and crowdsourced content.Marketing Science 31 (3), 493–520.
Gupta, S. (2005). Managing Customers as Investments. Pearson Education India.
Gupta, S., D. R. Lehmann, and J. A. Stuart (2004). Valuing customers. Journal ofMarketing Research 41 (1), 7–18.
Gupta, S. and C. F. Mela (2008). What is a free customer worth? armchair cal-culations of nonpaying customers’ value can lead to flawed strategies. HarvardBusiness Review 86 (11), 102–9.
Hagiu, A. and S. Rothman (2016). Network e↵ects aren’t enough. Harvard BusinessReview 94 (4), 64–71.
Hagiu, A. and J. Wright (2018). Platforms and the exploration of new products.Management Science, forthcoming .
Hagiu, A. and J. Wright (2020). Data-enabled learning, network e↵ects and compet-itive advantage. In working paper.
Halaburda, H., B. Jullien, and Y. Yehezkel (2016). Dynamic competition with net-work externalities: Why history matters. Available at SSRN 2335716 .
Hansen, L. P. (1982). Large sample properties of generalized method of momentsestimators. Econometrica: Journal of the Econometric Society , 1029–1054.
56
Hardy, A. and S. Dolnicar (2017). Networks and hosts – a love-hate relationship. InS. Dolnicar (Ed.), Peer-to-Peer Accommodation Networks, Chapter 16, pp. 182–193. Oxford: Oxford: Goodfellow Publishers.
Huang, N., G. Burtch, B. Gu, Y. Hong, C. Liang, K. Wang, D. Fu, and B. Yang(2019). Motivating user-generated content with performance feedback: Evidencefrom randomized field experiments. Management Science 65 (1), 327–345.
Jullien, B., A. Pavan, and M. Rysman (2021). Two-sided markets, pricing andnetwork e↵ects. Handbook of Industrial Organization 4, (forthcoming).
Katz, M. L. and C. Shapiro (1985). Network externalities, competition, and com-patibility. American Economic Review 75 (3), 424–440.
Katz, M. L. and C. Shapiro (1986). Technology adoption in the presence of networkexternalities. Journal of Political Economy 94 (4), 822–841.
Katz, M. L. and C. Shapiro (1994). Systems competition and network e↵ects. Journalof Economic Perspectives 8 (2), 93–115.
Krugman, P. (1991). History versus expectations. The Quarterly Journal of Eco-nomics 106 (2), 651–667.
Li, C., X. Luo, C. Zhang, and X. Wang (2017). Sunny, rainy, and cloudy with achance of mobile promotion e↵ectiveness. Marketing Science 36 (5), 762–779.
Li, H., Q. Shen, and Y. Bart (2017). Local market characteristics and online-to-o✏ine commerce: an empirical analysis of groupon. Management Science 64 (4),1860–1878.
Li, H., Q. Shen, and Y. Bart (2020). Dynamic resource allocation on multi-categorytwo-sided platforms. Management Science.
Li, X., L. M. Hitt, and Z. J. Zhang (2011). Product reviews and competition inmarkets for repeat purchase products. Journal of Management Information Sys-tems 27 (4), 9–42.
Li, X. and L. Wu (2018). Herding and social media word-of-mouth: Evidence fromgroupon. Forthcoming at MISQ .
Liebowitz, S. J. and S. E. Margolis (1994). Network externality: An uncommontragedy. Journal of economic perspectives 8 (2), 133–150.
57
Manski, C. F. (1993). Identification of endogenous social e↵ects: The reflectionproblem. The Review of Economic Studies 60 (3), 531–542.
Manski, C. F. (1999). Identification problems in the social sciences. Harvard Uni-versity Press.
McCarthy, D. M. and P. S. Fader (2018). Customer-based corporate valuation forpublicly traded noncontractual firms. Journal of Marketing Research 55 (5), 617–635.
McIntyre, D. P. and A. Srinivasan (2017). Networks, platforms, and strategy: Emerg-ing views and next steps. Strategic Management Journal 38 (1), 141–160.
McIntyre, D. P. and M. Subramaniam (2009). Strategy in network industries: Areview and research agenda. Journal of Management 35 (6), 1494–1517.
Metcalfe, B. (2013). Metcalfe b. metcalfe’s law after 40 years of ethernet. IEEEComputer (12), 26–31.
Moshary, S., B. T. Shapiro, and J. Song (2021). How and when to use the politicalcycle to identify advertising e↵ects. Marketing Science 40 (2), 283–304.
Nelson, P. (1974). Advertising as information. Journal of political economy 82 (4),729–754.
Park, S. (2004). Quantitative analysis of network externalities in competing tech-nologies: The VCR case. Review of Economics and Statistics 86 (4), 937–945.
Parker, G. and M. Van Alstyne (2005). Two-sided network e↵ects: A theory ofinformation product design. Management Science 51 (10), 1494–1504.
Parker, G., M. Van Alstyne, and X. Jiang (2017). Platform ecosystems: How devel-opers invert the firm. MIS Quarterly 41 (1), 255–266.
Parker, G. G. and M. W. Van Alstyne (2000). Internetwork externalities and freeinformation goods. In Proceedings of the 2nd ACM Conference on Electronic Com-merce, pp. 107–116.
Parker, G. G., M. W. Van Alstyne, and S. P. Choudary (2016). Platform Revolution:How Networked Markets Are Transforming the Economy and How to Make ThemWork for You. WW Norton & Company.
58

Pfeifer, P. E. and P. W. Farris (2004). The elasticity of customer value to retention:The duration of a customer relationship. Journal of Interactive Marketing 18 (2),20–31.
Rochet, J.-C. and J. Tirole (2003). Platform Competition in Two-Sided Markets.Journal of the European Economic Association, 990–1029.
Rochet, J.-C. and J. Tirole (2006). Two-sided markets: a progress report. TheRAND journal of economics 37 (3), 645–667.
Rysman, M. (2004). Competition between networks: A study of the market foryellow pages. The Review of Economic Studies 71 (2), 483–512.
Rysman, M. (2009). The economics of two-sided markets. Journal of economicperspectives 23 (3), 125–43.
Rysman, M. (2019). The reflection problem in network e↵ect estimation. Journal ofEconomics & Management Strategy 28 (1), 153–158.
Schilling, M. (1999). Winning the standards race:: Building installed base and theavailability of complementary goods. European Management Journal 17 (3), 265–274.
Schrage, M. (2012). Who do you want your customers to become? Harvard BusinessPress.
Shapiro, C. and H. Varian (1998). Information rules: a strategic guide to the networkeconomy. Harvard Business Press.
Suarez, F. F. (2005). Network e↵ects revisited: the role of strong ties in technologyselection. Academy of Management Journal 48 (4), 710–720.
Sundararajan, A. (2008). Local network e↵ects and complex network structure. TheBE Journal of Theoretical Economics 7 (1).
Tellis, G. J., E. Yin, and R. Niraj (2009). Does quality win? network e↵ects versusquality in high-tech markets. Journal of Marketing Research 46 (2), 135–149.
Trusov, M., R. E. Bucklin, and K. Pauwels (2009). E↵ects of word-of-mouth versustraditional marketing: findings from an internet social networking site. Journal ofMarketing 73 (5), 90–102.
59

Tucker, C. and J. Zhang (2011). How does popularity information a↵ect choices? afield experiment. Management Science 57 (5), 828–842.
Villas-Boas, J. M. and R. S. Winer (1999). Endogeneity in brand choice models.Management science 45 (10), 1324–1338.
Wooldridge, J. M. (2010). Econometric analysis of cross section and panel data. MITpress.
Wu, C., H. Che, T. Y. Chan, and X. Lu (2015). The economic value of online reviews.Marketing Science 34 (5), 739–754.
Zhang, K., T. Evgeniou, V. Padmanabhan, and E. Richard (2012). Content con-tributor management and network e↵ects in a ugc environment. Marketing Sci-ence 31 (3), 433–447.
Zhu, F. and M. Iansiti (2012). Entry into platform-based markets. Strategic Man-agement Journal 33 (1), 88–106.
Appendices
A Survey Design
We conducted an Amazon MTurk online survey and asked the respondents to code
all the categories on Groupon (a total of 78 categories). The respondents were first
asked to review the definition and examples of “search” and “experience” goods as
follows:
In this study, imagine you are browsing a deal website, for example, Groupon.
For some goods, you must see, try or experience them at least once to judge their
quality. For example, you might need to taste the cuisine at a specific restaurant or
60

try a particular haircut to know if you like the result. These goods are referred to as
“experience goods.”
For other goods, you can easily judge their value without having to try them. For
example, one brand of table salt is like any other brand of table salt. And a gallon
of regular gas at one gas station is indistinguishable from a gallon of regular gas at
a di↵erent gas station. These goods are referred to as “search goods.” You can often
evaluate the quality of search goods simply by reading its product description.
Next, you will be provided with 15 goods and asked to evaluate each of them
according to the extent they are “experience” versus “search” goods.
Please assume that there are no product reviews available.
The respondents were then asked to assess for each of the 15 categories, “to
what extent it is easy (hard) to evaluate the quality without seeing or trying it.”
The 15 questions included “haircut” and “gas,” both of which are NOT the original
Groupon categories. These two products are used as the filler questions to check
whether respondents paid attention in replying.
A total of 818 respondents passed the two attention filler questions and their
responses were aggregated to calculate the score for each category. The score closer
to “easy” (“hard”) corresponds to search (experience) goods. Based on the scores,
we used the median split and code the categories into two groups: experience goods
and search goods. We also used the mean split and yielded qualitative similar results.
The detailed survey responses are presented in Tables 14 and 15.
61

Table 14: MTurk Online Survey: Experience Goods
Groupon Category N Mean SD Min Max
Haircut (Attention Checking Question) 818 6.46 7 0.71 5Hair Salons 175 6.39 7 0.93 2Facials 159 6.21 7 1.08 1Makeup Services 195 6.13 6 1.20 1Spa Treatment 164 6.12 7 1.18 2Health & Beauty Services 153 6.11 6 1.16 2Restaurants 133 6.11 6 1.18 1Dance Classes 122 6.01 7 1.46 1Massage 145 5.99 7 1.46 1Wine Tasting 135 5.88 6 1.47 1Comedy Clubs 127 5.87 6 1.27 2Personal Trainer 109 5.85 6 1.41 1Concerts 136 5.77 6 1.70 1Shows 134 5.74 6 1.45 1Martial Arts Classes 128 5.73 6 1.48 1Skin Care 159 5.67 6 1.25 1Nail Care 140 5.66 6 1.47 1Chiropractor Classes 132 5.60 6 1.60 1Photography Service 105 5.54 6 1.62 1Waxing 157 5.52 6 1.60 1Teeth Whitening 168 5.51 6 1.50 1Life Skills Classes 158 5.50 6 1.53 1Boot Camp 105 5.50 6 1.66 1Dental Clinic and Dental Care 129 5.48 6 1.53 1Outdoor Adventures 138 5.47 6 1.88 1City Tours 148 5.47 6 1.63 1Fitness Classes 119 5.45 6 1.71 1Bridal Services 123 5.44 6 1.75 1Kids Activities: Summer camp, play party 120 5.43 6 1.84 1Museums 144 5.40 6 1.61 1Bars & Lounges 149 5.33 6 1.71 1Tanning 166 5.29 6 1.93 1Dessert 115 5.28 6 1.84 1Food: seafood orders, healthy snacks 123 5.18 6 1.79 1Skiing 144 5.13 6 1.76 1Yoga 125 5.10 6 1.75 1Home Services 138 5.09 5 1.65 1Pilates 119 5.07 6 1.93 1Skydiving 127 5.02 6 2.16 1Wine 151 5.01 6 1.91 1
62

Table 15: MTurk Online Survey: Search Goods
Groupon Category N Mean SD Min Max
Vision and Eye Care 142 4.94 5 1.81 1Women’s Clothing 136 4.85 5 1.62 1Travel Packages 125 4.65 5 2.02 1Gym Membership 114 4.58 5 1.84 1Men’s Fashion 150 4.53 5 1.83 1Automotive Services 135 4.50 5 1.89 1Sweets 133 4.48 5 1.95 1Home Improvement 123 4.46 5 1.82 1Women’s Fashion 119 4.40 5 1.99 1Photo Services 139 4.38 4 1.81 1Entertainment Goods: movies, magazine subscription 153 4.35 4 2.05 1Co↵ee & Tea 99 4.32 5 1.91 1Golf 119 4.28 5 2.05 1Men’s Clothing 138 4.22 4 1.74 1Women’s (Clearance Sale) 124 4.14 4 1.96 1College Test Prep Courses 143 4.11 4 1.85 1Decor 142 4.08 4 2.14 1Organic Produce and Food 153 4.07 4 1.98 1Pet Products and Services 117 4.01 4 1.63 1Home Theater 138 3.97 4 1.89 1Personal Electronics 111 3.81 3 1.95 1Furniture 147 3.79 4 1.91 1Gadgets: Headphone, speaker dock, electronic clock 128 3.78 4 1.96 1Bowling 133 3.75 4 2.00 1Men’s (Clearance Sale) 148 3.72 4 1.92 1Women’s Accessories 144 3.65 4 2.01 1Cameras 115 3.64 4 1.98 1Men’s Accessories 140 3.43 3 1.66 1Baby Products: Clothing, Diapers, Monitors 133 3.38 3 1.91 1Home Goods 138 3.36 3 1.79 1T-Shirts 144 3.34 3 1.63 1GPS & Navigation 120 3.21 3 1.78 1Computers & Hardware 144 3.21 3 1.86 1Cooking Gadgets 141 3.21 3 1.68 1Groceries 150 3.07 3 1.69 1Sports Tickets 141 3.01 2 2.09 1Holiday Decor 124 2.98 2 1.87 1Gifts: candles, phone cases, stationary 142 2.60 2 1.68 1O�ce Supplies 132 1.98 2 1.34 1Gas (Attention Checking Question) 818 1.24 1 0.50 1
63
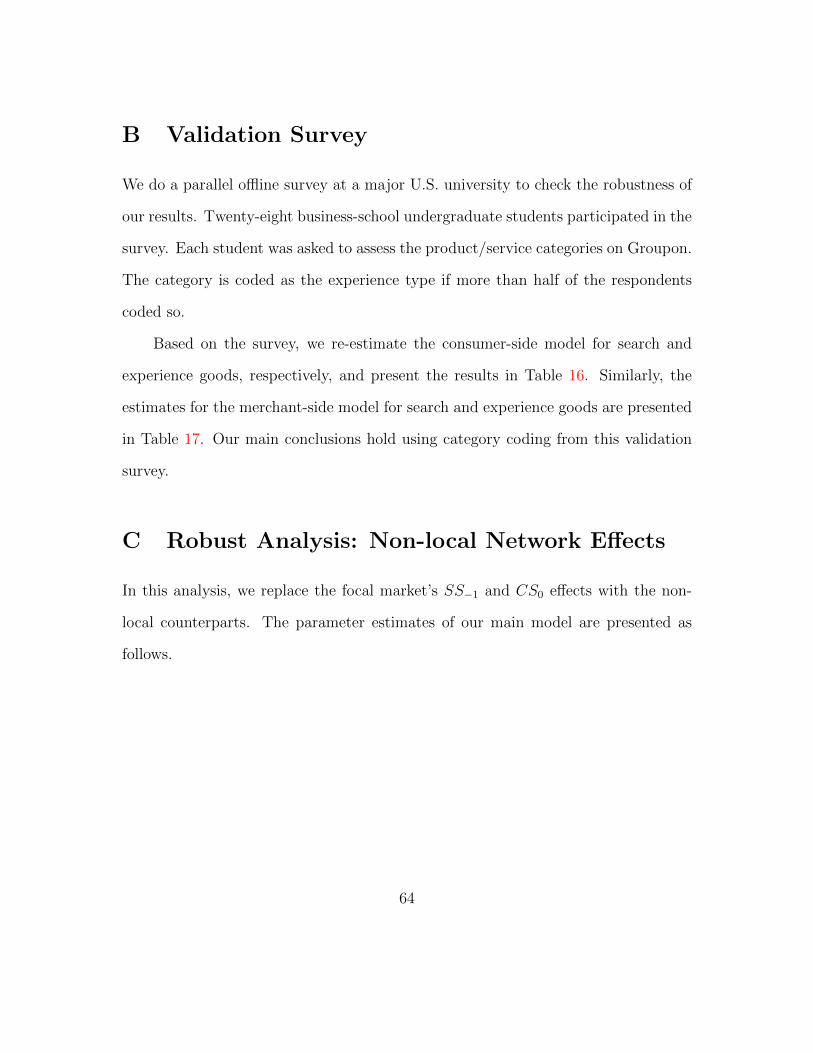
B Validation Survey
We do a parallel o✏ine survey at a major U.S. university to check the robustness of
our results. Twenty-eight business-school undergraduate students participated in the
survey. Each student was asked to assess the product/service categories on Groupon.
The category is coded as the experience type if more than half of the respondents
coded so.
Based on the survey, we re-estimate the consumer-side model for search and
experience goods, respectively, and present the results in Table 16. Similarly, the
estimates for the merchant-side model for search and experience goods are presented
in Table 17. Our main conclusions hold using category coding from this validation
survey.
C Robust Analysis: Non-local Network E↵ects
In this analysis, we replace the focal market’s SS�1 and CS0 e↵ects with the non-
local counterparts. The parameter estimates of our main model are presented as
follows.
64
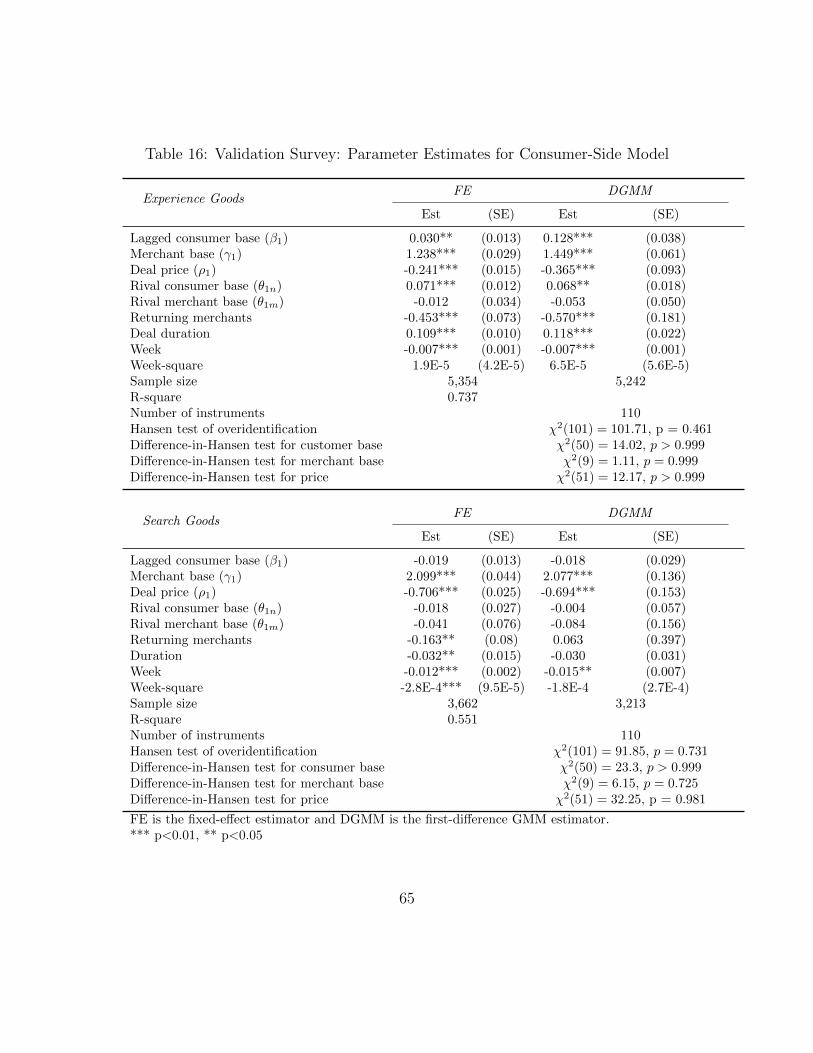
Table 16: Validation Survey: Parameter Estimates for Consumer-Side Model
Experience GoodsFE DGMM
Est (SE) Est (SE)
Lagged consumer base (�1) 0.030** (0.013) 0.128*** (0.038)Merchant base (�1) 1.238*** (0.029) 1.449*** (0.061)Deal price (⇢1) -0.241*** (0.015) -0.365*** (0.093)Rival consumer base (✓1n) 0.071*** (0.012) 0.068** (0.018)Rival merchant base (✓1m) -0.012 (0.034) -0.053 (0.050)Returning merchants -0.453*** (0.073) -0.570*** (0.181)Deal duration 0.109*** (0.010) 0.118*** (0.022)Week -0.007*** (0.001) -0.007*** (0.001)Week-square 1.9E-5 (4.2E-5) 6.5E-5 (5.6E-5)Sample size 5,354 5,242R-square 0.737Number of instruments 110Hansen test of overidentification �2(101) = 101.71, p = 0.461Di↵erence-in-Hansen test for customer base �2(50) = 14.02, p > 0.999Di↵erence-in-Hansen test for merchant base �2(9) = 1.11, p = 0.999Di↵erence-in-Hansen test for price �2(51) = 12.17, p > 0.999
Search GoodsFE DGMM
Est (SE) Est (SE)
Lagged consumer base (�1) -0.019 (0.013) -0.018 (0.029)Merchant base (�1) 2.099*** (0.044) 2.077*** (0.136)Deal price (⇢1) -0.706*** (0.025) -0.694*** (0.153)Rival consumer base (✓1n) -0.018 (0.027) -0.004 (0.057)Rival merchant base (✓1m) -0.041 (0.076) -0.084 (0.156)Returning merchants -0.163** (0.08) 0.063 (0.397)Duration -0.032** (0.015) -0.030 (0.031)Week -0.012*** (0.002) -0.015** (0.007)Week-square -2.8E-4*** (9.5E-5) -1.8E-4 (2.7E-4)Sample size 3,662 3,213R-square 0.551Number of instruments 110Hansen test of overidentification �2(101) = 91.85, p = 0.731Di↵erence-in-Hansen test for consumer base �2(50) = 23.3, p > 0.999Di↵erence-in-Hansen test for merchant base �2(9) = 6.15, p = 0.725Di↵erence-in-Hansen test for price �2(51) = 32.25, p = 0.981
FE is the fixed-e↵ect estimator and DGMM is the first-di↵erence GMM estimator.*** p<0.01, ** p<0.05
65

Table 17: Validation Survey: Parameter Estimates for Merchant-Side Model
Experience GoodsFE DGMM
Est SE Est SE
Lagged merchant base (�2) 0.182*** (0.016) 0.398*** (0.056)Consumer base (�2) 0.278*** (0.006) 0.420*** (0.019)Deal price (⇢2) 0.099*** (0.007) 0.360*** (0.048)Rival consumer base (✓2n) 0.013** (0.006) -0.028*** (0.010)Rival merchant base (✓2m) 0.158*** (0.016) 0.149*** (0.027)Returning merchants 0.149** (0.036) 0.236*** (0.064)Week 0.004*** (0.0004) 0.001*** (0.001)Week-square -8.3E-5*** (2.0E-5) -8.3E-5 (2.0E-5)Sample size 5,354 5,242R-square 0.882Number of instruments 111Hansen test of overidentification �2(103) = 106.05, p = 0.399Di↵erence-in-Hansen test for consumer base �2(10) = 2.34, p = 0.993Di↵erence-in-Hansen test for merchant base �2(50) = 14.77, p > 0.999Di↵erence-in-Hansen test for price �2(51) = 9.65, p > 0.999
Search GoodsFE DGMM
Est SE Est SE
Lagged merchant base (�2) 0.025 (0.017) 0.192*** (0.061)Consumer base (�2) 0.275*** (0.006) 0.369*** (0.019)Deal price (⇢2) 0.263*** (0.01) 0.362*** (0.058)Rival consumer base (✓2n) 0.037*** (0.01) 0.031* (0.015)Rival merchant base (✓2m) 0.065** (0.029) 0.024 (0.045)Returning merchants 0.081** (0.036) 0.078 (0.057)Week 0.010*** (0.001) 0.006* (0.003)Week-square 3.8E-4*** (3.8E-5) 7.0E-5 (1.3E-4)Sample size 3,662 3,213R-square 0.833Number of instruments 111Hansen test �2(103) = 92.88, p = 0.753Di↵erence-in-Hansen test for consumer base �2(10) = 2.34, p = 0.993Di↵erence-in-Hansen test for merchant base �2(50) = 14.77, p > 0.999Di↵erence-in-Hansen test for price �2(51) = 25.33, p = 0.999
FE is the fixed-e↵ect estimator and DGMM is the first-di↵erence GMM estimator.*** p<0.01, ** p<0.05, * p<0.1
66
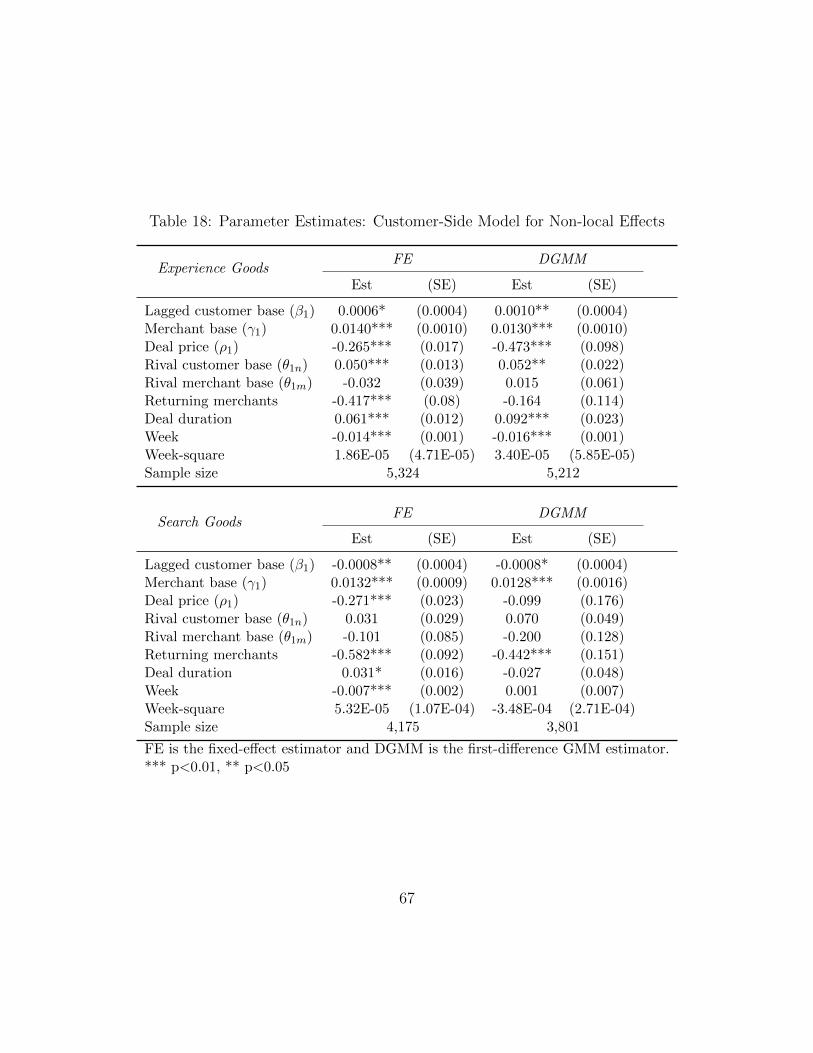
Table 18: Parameter Estimates: Customer-Side Model for Non-local E↵ects
Experience GoodsFE DGMM
Est (SE) Est (SE)
Lagged customer base (�1) 0.0006* (0.0004) 0.0010** (0.0004)Merchant base (�1) 0.0140*** (0.0010) 0.0130*** (0.0010)Deal price (⇢1) -0.265*** (0.017) -0.473*** (0.098)Rival customer base (✓1n) 0.050*** (0.013) 0.052** (0.022)Rival merchant base (✓1m) -0.032 (0.039) 0.015 (0.061)Returning merchants -0.417*** (0.08) -0.164 (0.114)Deal duration 0.061*** (0.012) 0.092*** (0.023)Week -0.014*** (0.001) -0.016*** (0.001)Week-square 1.86E-05 (4.71E-05) 3.40E-05 (5.85E-05)Sample size 5,324 5,212
Search GoodsFE DGMM
Est (SE) Est (SE)
Lagged customer base (�1) -0.0008** (0.0004) -0.0008* (0.0004)Merchant base (�1) 0.0132*** (0.0009) 0.0128*** (0.0016)Deal price (⇢1) -0.271*** (0.023) -0.099 (0.176)Rival customer base (✓1n) 0.031 (0.029) 0.070 (0.049)Rival merchant base (✓1m) -0.101 (0.085) -0.200 (0.128)Returning merchants -0.582*** (0.092) -0.442*** (0.151)Deal duration 0.031* (0.016) -0.027 (0.048)Week -0.007*** (0.002) 0.001 (0.007)Week-square 5.32E-05 (1.07E-04) -3.48E-04 (2.71E-04)Sample size 4,175 3,801
FE is the fixed-e↵ect estimator and DGMM is the first-di↵erence GMM estimator.*** p<0.01, ** p<0.05
67
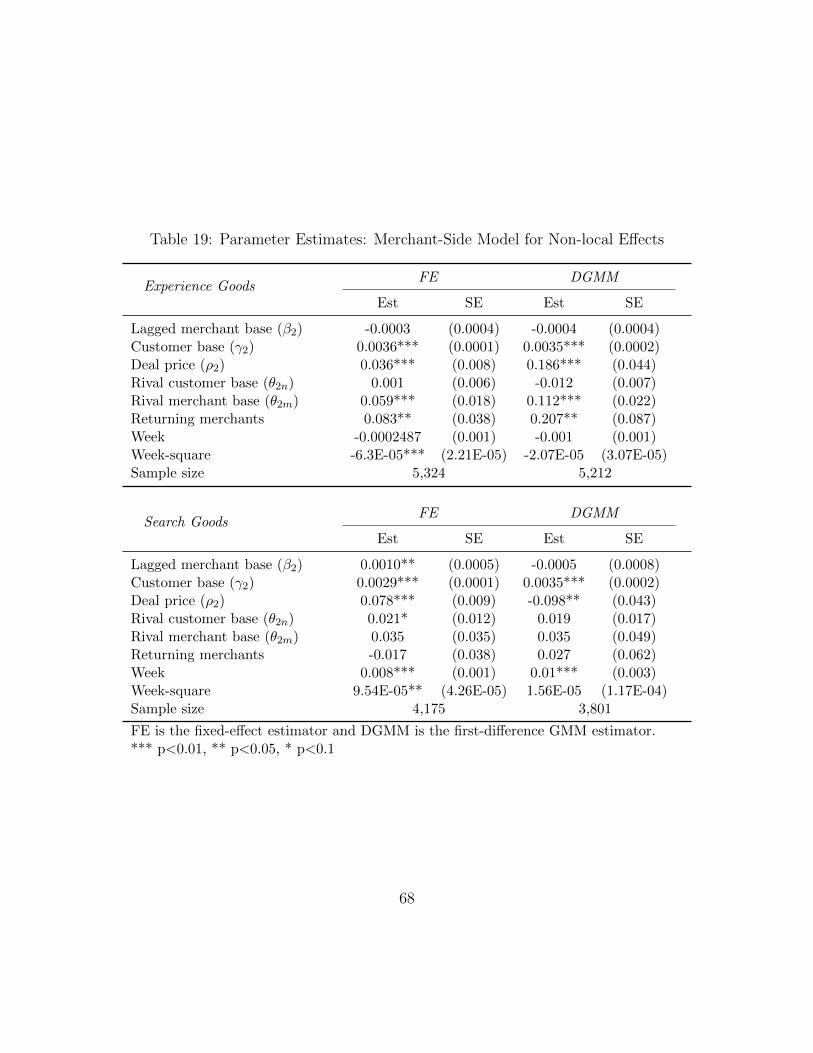
Table 19: Parameter Estimates: Merchant-Side Model for Non-local E↵ects
Experience GoodsFE DGMM
Est SE Est SE
Lagged merchant base (�2) -0.0003 (0.0004) -0.0004 (0.0004)Customer base (�2) 0.0036*** (0.0001) 0.0035*** (0.0002)Deal price (⇢2) 0.036*** (0.008) 0.186*** (0.044)Rival customer base (✓2n) 0.001 (0.006) -0.012 (0.007)Rival merchant base (✓2m) 0.059*** (0.018) 0.112*** (0.022)Returning merchants 0.083** (0.038) 0.207** (0.087)Week -0.0002487 (0.001) -0.001 (0.001)Week-square -6.3E-05*** (2.21E-05) -2.07E-05 (3.07E-05)Sample size 5,324 5,212
Search GoodsFE DGMM
Est SE Est SE
Lagged merchant base (�2) 0.0010** (0.0005) -0.0005 (0.0008)Customer base (�2) 0.0029*** (0.0001) 0.0035*** (0.0002)Deal price (⇢2) 0.078*** (0.009) -0.098** (0.043)Rival customer base (✓2n) 0.021* (0.012) 0.019 (0.017)Rival merchant base (✓2m) 0.035 (0.035) 0.035 (0.049)Returning merchants -0.017 (0.038) 0.027 (0.062)Week 0.008*** (0.001) 0.01*** (0.003)Week-square 9.54E-05** (4.26E-05) 1.56E-05 (1.17E-04)Sample size 4,175 3,801
FE is the fixed-e↵ect estimator and DGMM is the first-di↵erence GMM estimator.*** p<0.01, ** p<0.05, * p<0.1
68