Embed Size (px)
Citation preview
2015-08-17
how to view images and quantify signal from IVIS 20150817
p. 1
View images and Quantify Signal from IVISView images and Quantify Signal from IVISView images and Quantify Signal from IVISView images and Quantify Signal from IVIS
Computers INVIVOINVIVOINVIVOINVIVO----ANALYANALYANALYANALYSSSSISISISIS and analiza-4 are normally never shut down and are accessible on
the Network from all computers in the building under MicrosoftMicrosoftMicrosoftMicrosoft Windows Network Windows Network Windows Network Windows Network ���� MedicineMedicineMedicineMedicine.
To access, in Windows go to Start � Run and enter \\\\\\\\INVIVOINVIVOINVIVOINVIVO----ANALYSISANALYSISANALYSISANALYSIS \\\\\\\\IVISIVISIVISIVIS_Data_Data_Data_Data
Please back up your data from INVIVOINVIVOINVIVOINVIVO----ANALYANALYANALYANALYSSSSISISISIS or aaaanalizanalizanalizanaliza----4444 to your computer or to your
Dropbox (or similar) account.
Data from IIIIVISVISVISVIS are stored on INVIVOINVIVOINVIVOINVIVO----ANALYANALYANALYANALYSSSSISISISIS in the following location:
C:C:C:C:\\\\ IVISIVISIVISIVIS_Data_Data_Data_Data \\\\[[[[IVISIVISIVISIVIS year]year]year]year]\\\\mmmmmmmm----yyyyyyyyyyyyyyyy\\\\[PI][PI][PI][PI]
Individual experiment folders saved on IVISIVISIVISIVIS contain a PNG file (which can be opened with
common imaging or system software programs) along with TXT files of experiment information
and settings.
Data set folder and PNG file are named according to PI initials, acquisition date and time:
PIyyyymmddhhPIyyyymmddhhPIyyyymmddhhPIyyyymmddhhmmssmmssmmssmmss
Always use locally stored file copies when you perform analysis.
Use Living Image 3.Living Image 3.Living Image 3.Living Image 3.2222, an offline software version.
When prompted to Select User use your PI’s initials.
Visualization ofVisualization ofVisualization ofVisualization of experimentsexperimentsexperimentsexperiments File � Browse
You may choose a folder which contains a series of data set (experiment) folders or one data set
folder.
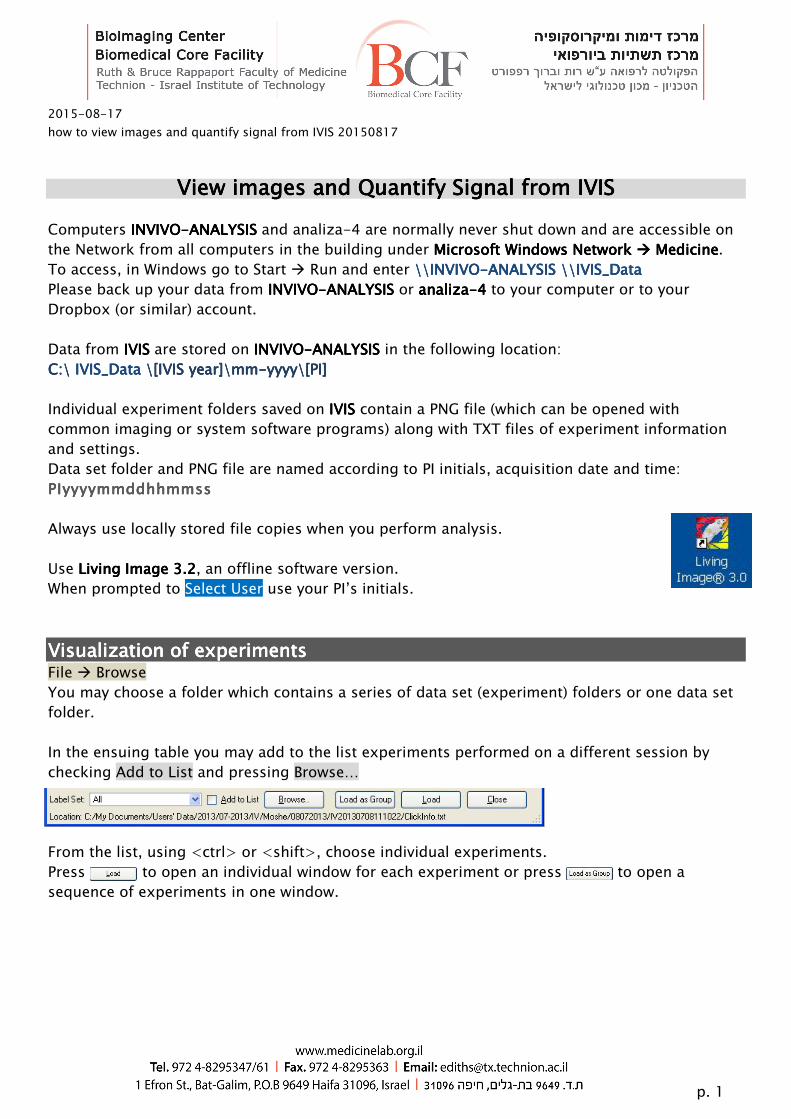
In the ensuing table you may add to the list experiments performed on a different session by
checking Add to List and pressing Browse…
From the list, using <ctrl> or <shift>, choose individual experiments.
Press to open an individual window for each experiment or press to open a
sequence of experiments in one window.
p. 2
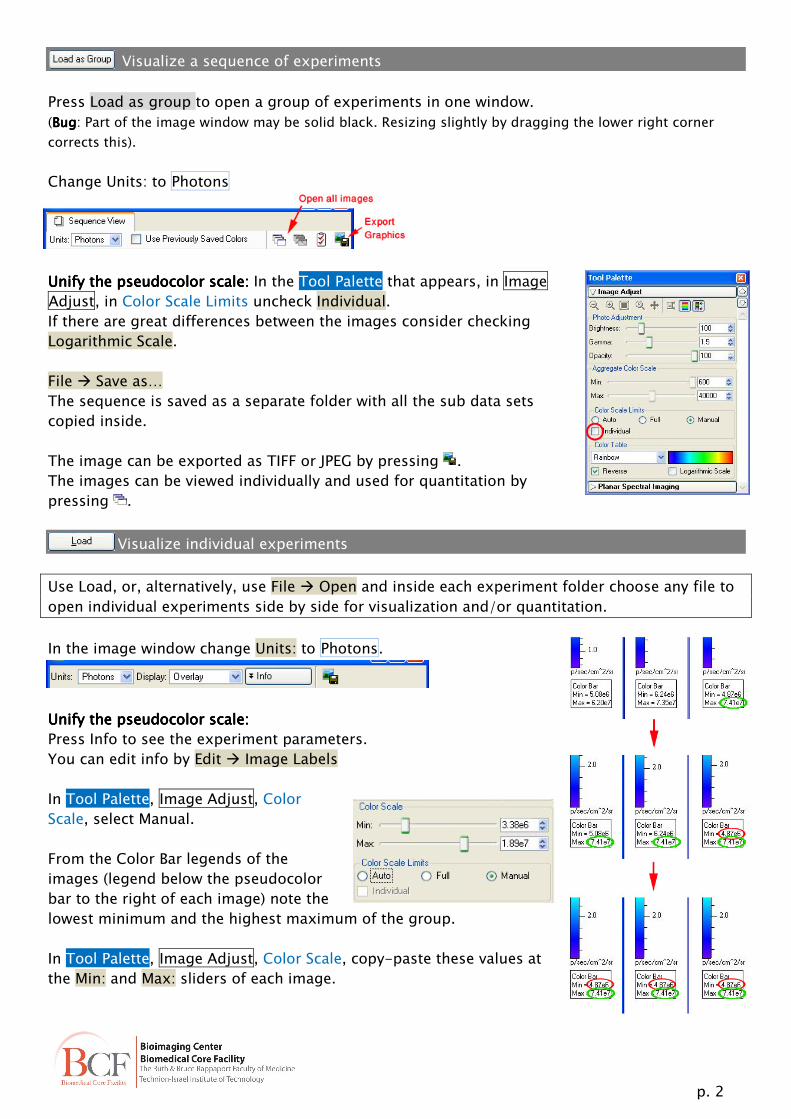
Visualize a sequence of experiments
Press Load as group to open a group of experiments in one window.
(BugBugBugBug: Part of the image window may be solid black. Resizing slightly by dragging the lower right corner
corrects this).
Change Units: to Photons
Unify the pseudocolor scale:Unify the pseudocolor scale:Unify the pseudocolor scale:Unify the pseudocolor scale: In the Tool Palette that appears, in Image
Adjust, in Color Scale Limits uncheck Individual.
If there are great differences between the images consider checking
Logarithmic Scale.
File � Save as…
The sequence is saved as a separate folder with all the sub data sets
copied inside.
The image can be exported as TIFF or JPEG by pressing .
The images can be viewed individually and used for quantitation by
pressing .
Visualize individual experiments
Use Load, or, alternatively, use File � Open and inside each experiment folder choose any file to
open individual experiments side by side for visualization and/or quantitation.
In the image window change Units: to Photons.
UUUUnify the pseudocolor scale:nify the pseudocolor scale:nify the pseudocolor scale:nify the pseudocolor scale:
Press Info to see the experiment parameters.
You can edit info by Edit � Image Labels
In Tool Palette, Image Adjust, Color
Scale, select Manual.
From the Color Bar legends of the
images (legend below the pseudocolor
bar to the right of each image) note the
lowest minimum and the highest maximum of the group.
In Tool Palette, Image Adjust, Color Scale, copy-paste these values at
the Min: and Max: sliders of each image.
p. 3
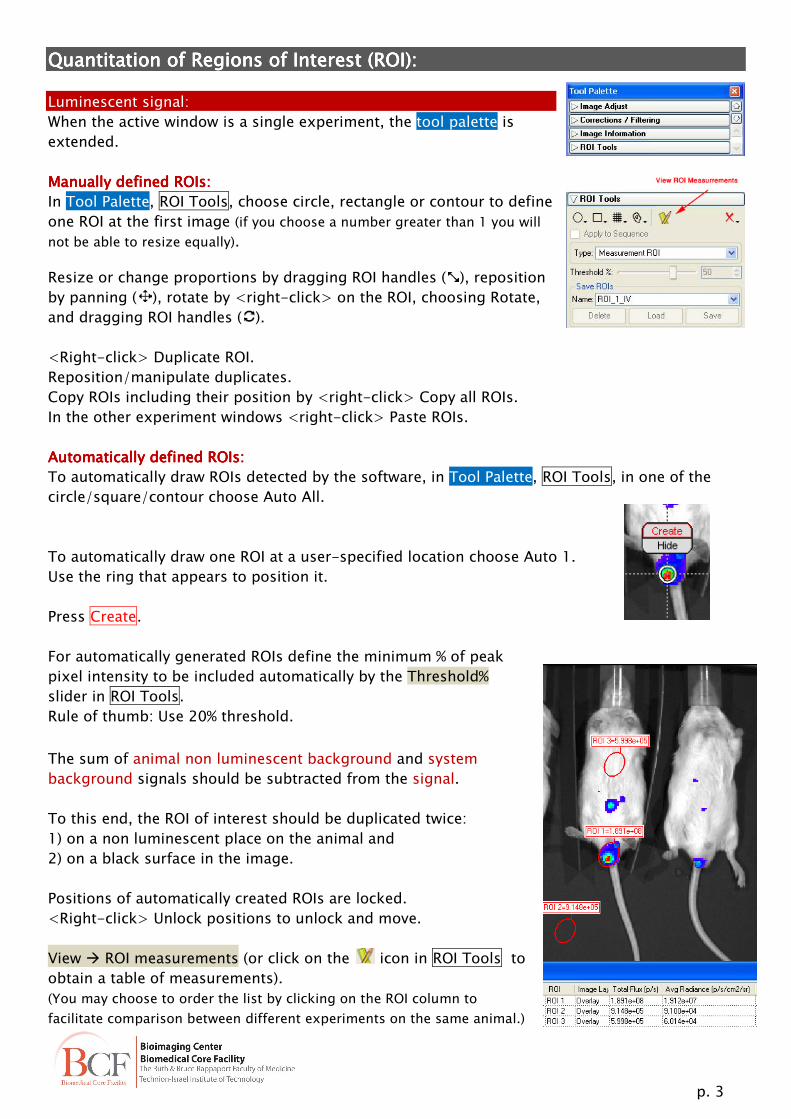
Quantitation of Quantitation of Quantitation of Quantitation of Regions of Interest (ROI)Regions of Interest (ROI)Regions of Interest (ROI)Regions of Interest (ROI)::::
Luminescent signal:
When the active window is a single experiment, the tool palette is
extended.
Manually defined ROIs:Manually defined ROIs:Manually defined ROIs:Manually defined ROIs:
In Tool Palette, ROI Tools, choose circle, rectangle or contour to define
one ROI at the first image (if you choose a number greater than 1 you will
not be able to resize equally).
Resize or change proportions by dragging ROI handles ( ), reposition
by panning ( ), rotate by <right-click> on the ROI, choosing Rotate,
and dragging ROI handles ( ).
<Right-click> Duplicate ROI.
Reposition/manipulate duplicates.
Copy ROIs including their position by <right-click> Copy all ROIs.
In the other experiment windows <right-click> Paste ROIs.
Automatically defined ROIs:Automatically defined ROIs:Automatically defined ROIs:Automatically defined ROIs:
To automatically draw ROIs detected by the software, in Tool Palette, ROI Tools, in one of the
circle/square/contour choose Auto All.
To automatically draw one ROI at a user-specified location choose Auto 1.
Use the ring that appears to position it.
Press Create.
For automatically generated ROIs define the minimum % of peak
pixel intensity to be included automatically by the Threshold%
slider in ROI Tools.
Rule of thumb: Use 20% threshold.
The sum of animal non luminescent background and system
background signals should be subtracted from the signal.
To this end, the ROI of interest should be duplicated twice:
1) on a non luminescent place on the animal and
2) on a black surface in the image.
Positions of automatically created ROIs are locked.
<Right-click> Unlock positions to unlock and move.
View � ROI measurements (or click on the icon in ROI Tools to
obtain a table of measurements).
(You may choose to order the list by clicking on the ROI column to
facilitate comparison between different experiments on the same animal.)
p. 4
Average RadianceAverage RadianceAverage RadianceAverage Radiance, in photons/second/cm2/steradian is a
commonly used measurement of interest in luminescence.
The table can be exported by pressing Export and choosing
CSV which is opened by EXCEL.
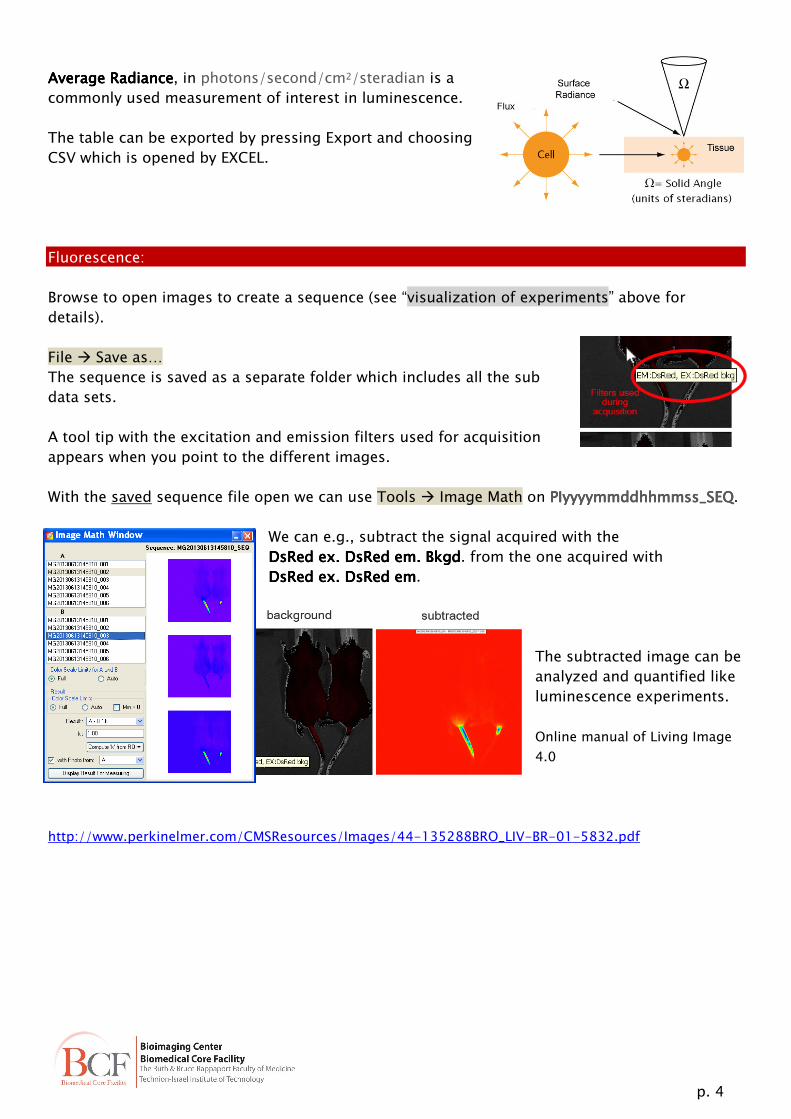
Fluorescence:
Browse to open images to create a sequence (see “visualization of experiments” above for
details).
File � Save as…
The sequence is saved as a separate folder which includes all the sub
data sets.
A tool tip with the excitation and emission filters used for acquisition
appears when you point to the different images.
With the saved sequence file open we can use Tools � Image Math on PIyyyymmddhhmmss_SEQPIyyyymmddhhmmss_SEQPIyyyymmddhhmmss_SEQPIyyyymmddhhmmss_SEQ.
We can e.g., subtract the signal acquired with the
DsRedDsRedDsRedDsRed ex.ex.ex.ex. DsRed em.DsRed em.DsRed em.DsRed em. BkgdBkgdBkgdBkgd. from the one acquired with
DsRedDsRedDsRedDsRed ex.ex.ex.ex. DsRedDsRedDsRedDsRed emememem.
The subtracted image can be
analyzed and quantified like
luminescence experiments.
Online manual of Living Image
4.0
http://www.perkinelmer.com/CMSResources/Images/44-135288BRO_LIV-BR-01-5832.pdf