Embed Size (px)
Citation preview

1
HOW TO USE GOOGLE FUSION®
Some basic instructions for use are provided below. For additional information on using Google Fusion Tables, visit: https://support.google.com/fusiontables#topic=1652595 (it can also be accessed from the Help menu in Fusion Tables by clicking on Help Fusion Tables Help Center).
Users can select the data they want using a menu-driven graphical user interface, and then export (download) the selected data (or all data) as a file to their own computer for their own use. This file will contain the data from the option (selected or all data) chosen by the user. The data can also be viewed on the web page, without exporting/downloading.
NOTE: Due to Google Fusion limitations, all data (wells) selected may not display on the map until the user zooms in sufficiently. These wells will be included in the table of results regardless of the zoom level. Getting a full, statewide view showing all of the selected wells is unlikely.
The function for mapping the data in Google Maps does not work ideally at this time; since each monitoring site is normally associated with multiple data records, only one data record would be shown on the pop-up for that site.
To select specific data: Click Filter. In the drop-down menu, select the parameter(s) you want to filter on (for example, county name, chemical name, total chemical detections, etc.). Then, depending on the data type in the selected parameter, you can either type in your values of interest (for example, for unique chemicals detected, you will see two boxes to input your selection, below which you will see the total number of values and the range of values) or select the boxes with desired values (for example, for county name, you will see a list of counties with corresponding values. Just select the box for the county (ies) you are interested in), or type the name of the county in the box (under county name) and click Find.
The visible table (or map) will change to show the data corresponding to filtered parameters only. You can do multiple filters – just click on Filter and select different criteria on which you would like to filter the data. Proceed as described above.
To remove all filters and see the entire data set, click Filter again and then click on “x” next to the parameter(s) (for example, county name, chemical name, total chemical detections, etc.) where filter was applied on earlier.
NOTE: Filter only works for the active window (or should we say tab). For example, if you are filtering the data in map view and want to save the data on your computer, then you should download the data in map view itself. If you change the view to another tab, then you need to apply the filters again before downloading the selected data. The filtered data can be sorted (only in Rows tab) on any field by clicking on the down arrow next to the field name and selecting either 'sort 1 to 100' or 'sort 100 to 1'. For example, one could filter for all detections of a specific chemical and sort in descending order to see the maximum concentrations.
To export (save) the results of your query (filter), click FILE DOWNLOAD. In the resulting dialog box, select if you want to download All rows or just the Filtered rows (default), and in Format select CSV as it is easier to import CSV files into Microsoft Excel, etc. Then click on Download. In the resulting dialog box, you can choose to either OPEN the file or SAVE to the desired location. Note that the data that will be saved depends on the

2
options selected above, all rows or just your filtered data -the data returned from your query/filter parameters.
In newer versions of Excel, you can simply drag and drop the CSV file into a new blank workbook and it will import correctly. Note also that in some files there are over 200,000 records; some operations may occasionally be slow.
Clicking the “Back to Classic look” link (under Help) will modify the layout of the data, and the instructions provided here will no longer apply (although the process in that alternate format is very similar). In this case, you can return to the correct layout through “Switch to new look” link located on the top right hand side of your screen.
A filtering example for the Detection Detail Table is provided below:

3
Example: How to filter data in Fusion Tables.
Let’s say you are working with Detection Detail table and are interested in the data for the wells in Fresno county that had atrazine detections between 0.05 ppb – 0.74 ppb.
Click here (Filter).

4
Click here (COUNTY_NAME).

5
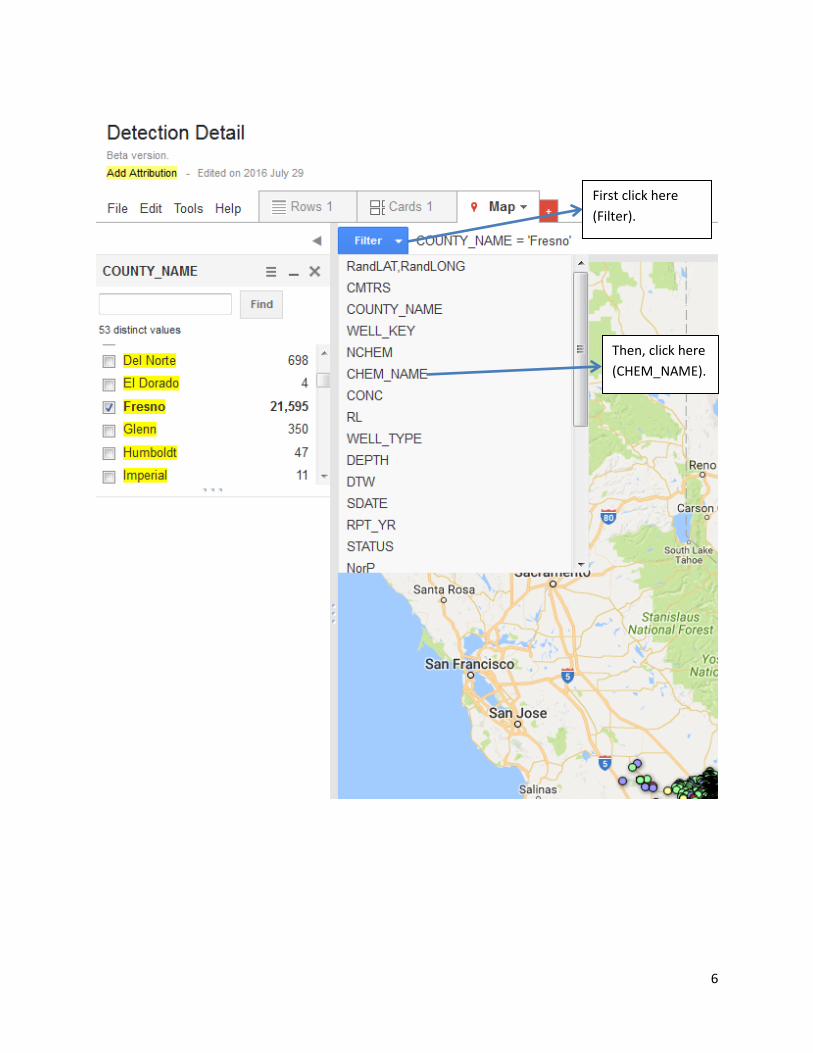
Click here (It will add a tick mark next to selected county, Fresno, in our case). Map will update to show wells with all chemicals detected in Fresno County only.
Scroll down till you see the county you are interested in, e.g., Fresno in our case (or you can also write the name in the search box, next to Find (under COUNTY_NAME)).
6
Then, click here (CHEM_NAME).
First click here (Filter).

7
Click here (It will add a tick mark next to selected chemical name, Atrazine, in our case). Map will update to show wells with Atrazine detections in Fresno County only.
Scroll down till you see Atrazine here (or you can also write the name in the search box, next to Find (under CHEM_NAME).

8
Then, click here (CONC).
First click here (Filter).

9
Enter the range of concentration you are interested in, and then click Find (under CONC). Notice that Fusion Table shows the range of values.

10
You can see here the filters that have been applied.
Map will update to show wells with Atrazine detections in Fresno County in the range of 0.05 – 0.74 ppb only.

11
Now, to download the filtered results to your computer:
Click on File, and then on
Download

12
Make sure and CSV arthen click
that Fie selec
Downlo
ltered rows ted, and ad.
That’s it. Now you have the filtered results saved on your computer as a .csv file. This file can be opened in Excel.


![A Synchronization Protocol for ODK Tables and ODK Aggregate...3.2 Google Fusion Tables Google Fusion Tables [6] is a service o ered as part of Google Docs which provides access to](https://img.pdfslide.us/doc/110x75/5f362a9666c2416aa8416f6a/a-synchronization-protocol-for-odk-tables-and-odk-aggregate-32-google-fusion.jpg)