Embed Size (px)
Citation preview

How to Surprise by being a Linux Performance "know-it-all"
Christian EhrhardtIBM Germany Research & Development GmbH
9th August 2012Session Number 11615
2
Agenda
• Tools are your swiss army knife• ps• top• sadc/sar• iostat• vmstat• netstat
IBM, the IBM logo, and ibm.com are trademarks or registered trademarks of International Business Machines Corp., registered in many jurisdictions worldwide. Other product and service names might be trademarks of IBM or other companies. A current list of IBM trademarks is available on the Web at www.ibm.com/legal/copytrade.shtml.

3
Agenda
• Tools are your swiss army knife• ps• top• sadc/sar• iostat• vmstat• netstat

4
Agenda
• Your swiss army knife for the complex cases• htop• dstat• pidstat• irqstats• strace/ltrace• blktrace• hyptop• profiling• valgrind• iptraf• tracepoints

5
General thoughts on performance tools
• Things that are always to consider• Monitoring can impact the system• Most data gathering averages over a certain period of time
→ this flattens peaks• Start with defining the problem
• which parameter(s) from the application/system indicates the problem• which range is considered as bad, what is considered as good
• monitor the good case and save the results• comparisons when a problem occurs can save days and weeks
• Staged approach saves a lot of work• Try to use general tools to isolate the area of the issue• Create theories and try to quickly verify/falsify them• Use advanced tools to debug the identified area
6
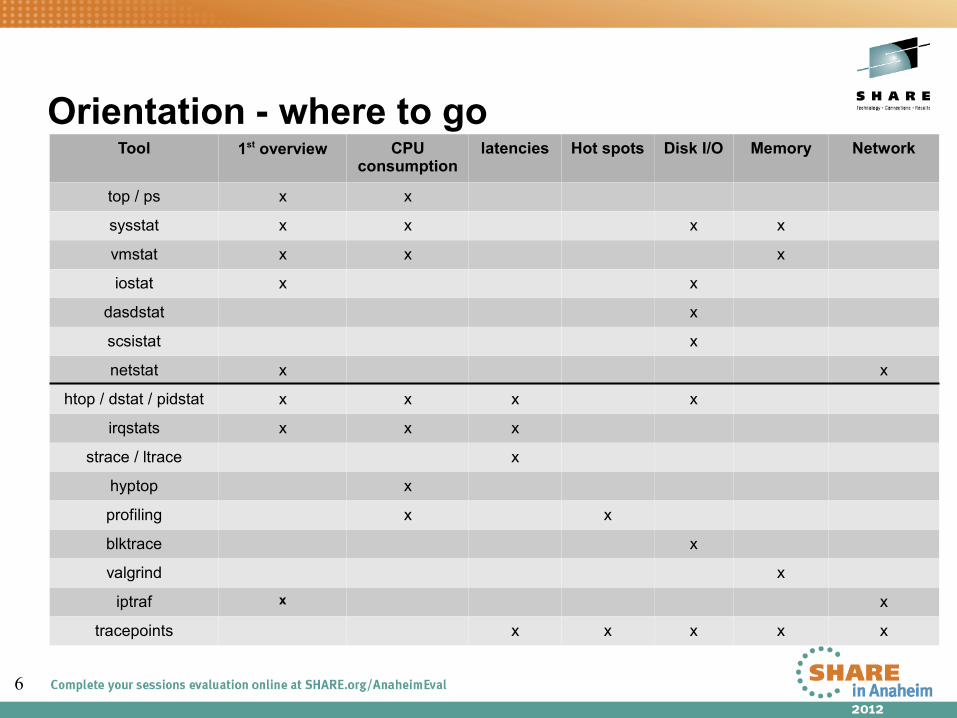
Tool 1st overview CPU consumption
latencies Hot spots Disk I/O Memory Network
top / ps x x
sysstat x x x x
vmstat x x x
iostat x x
dasdstat x
scsistat x
netstat x x
htop / dstat / pidstat x x x x
irqstats x x x
strace / ltrace x
hyptop x
profiling x x
blktrace x
valgrind x
iptraf x x
tracepoints x x x x x
Orientation - where to go

7
DSTAT
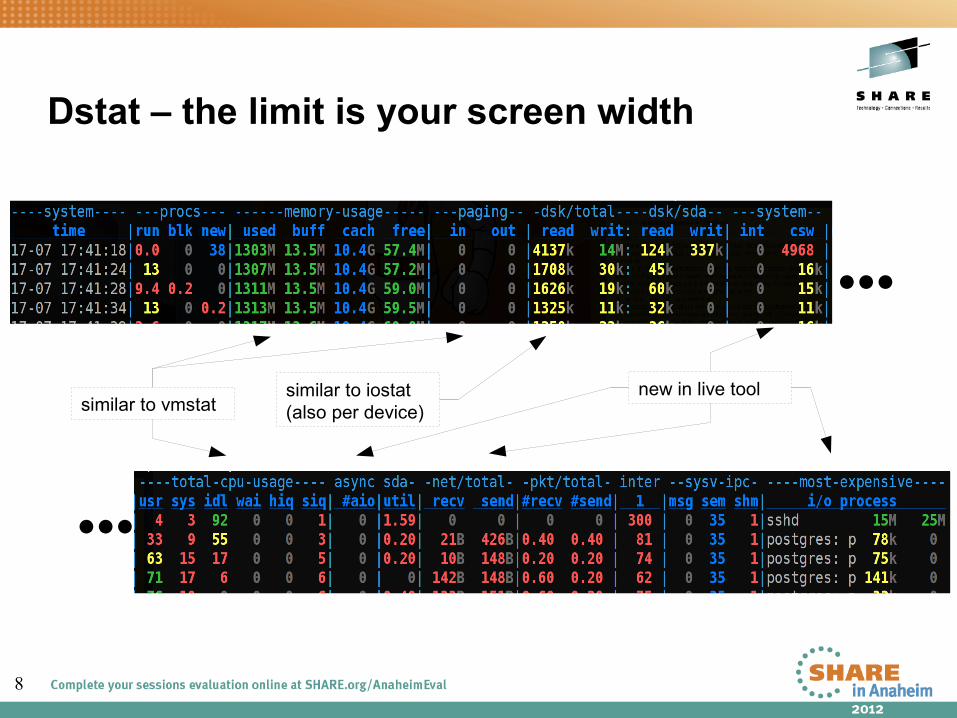
• Characteristics: Live easy to use full system information• Objective: Flexible set of statistics• Usage: dstat -tv –aio –disk-util -n –net-packets -i –ipc -D total,[diskname] –top-io [...] [interval]
• Short: dstat -tinv
• Shows• Throughput• Utilization• Summarized and per Device queue information• Much more … it more or less combines several classic tools like iostat and vmstat
• Hints• Powerful plugin concept
• “--top-io” for example identifies the application causing the most I/Os
• Colorization allows fast identification of deviations
8
Dstat – the limit is your screen width
●●●
●●●
similar to vmstatsimilar to iostat(also per device)
new in live tool
9
HTOP
• Characteristics: Process overview with extra features• Objective: Get a understanding about your running processes• Usage: htop
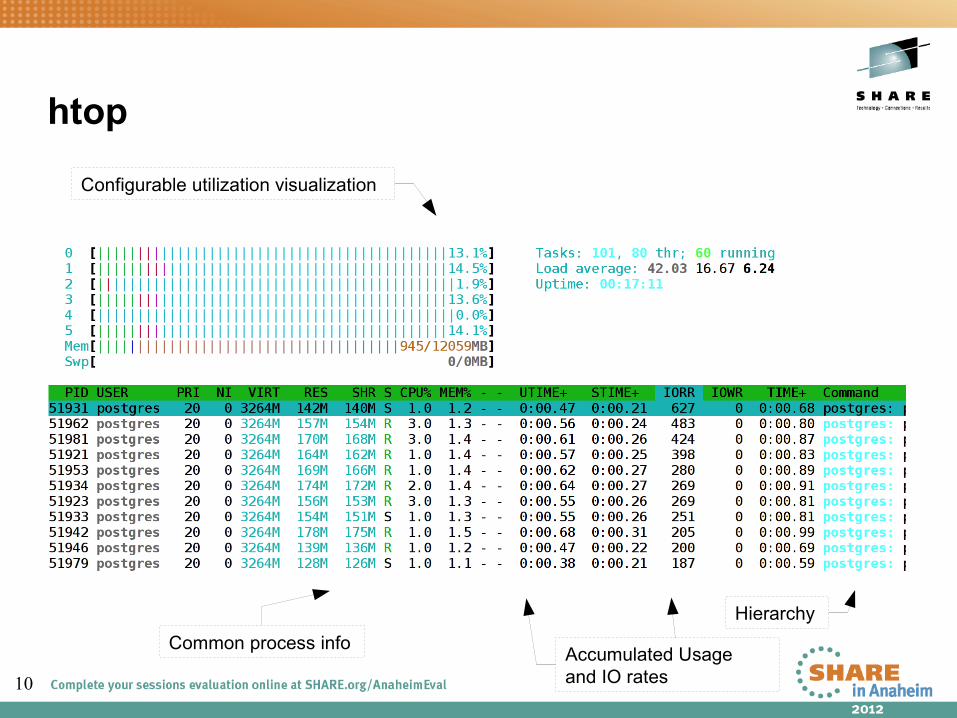
• Shows• Running processes• CPU and memory utilization• Accumulated times• I/O rates• System utilization visualization
• Hints• Htop can display more uncommon fields (in menu)• Able to send signals out of its UI for administration purposes• Processes can be sorted/filtered for a more condensed view
10
htop
Configurable utilization visualization
Common process infoAccumulated Usageand IO rates
Hierarchy
11
PIDSTAT
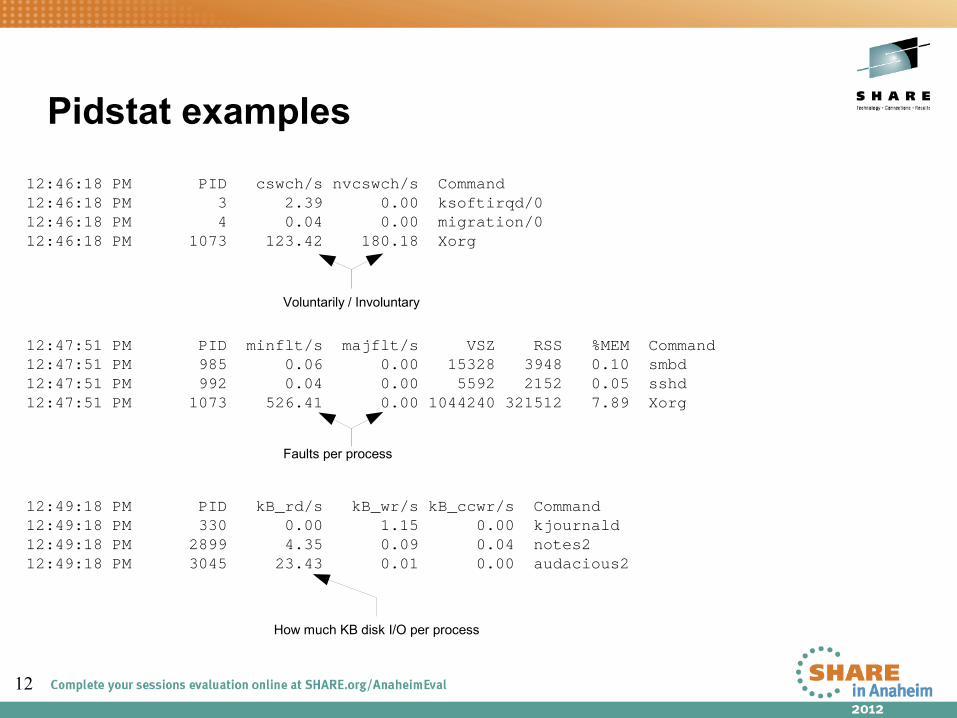
• Characteristics: Easy to use extended per process statistics• Objective: Identify processes with peak activity• Usage: pidstat [-w|-r|-d]
• Shows• -w context switching activity and if it was voluntary• -r memory statistics, especially minor/major faults per process• -d disk throughput per process
• Hints• Also useful if run as background log due to its low overhead
• Good extension to sadc in systems running different applications/services
• -p <pid> can be useful to track activity of a specific process
12
Pidstat examples
12:46:18 PM PID cswch/s nvcswch/s Command12:46:18 PM 3 2.39 0.00 ksoftirqd/012:46:18 PM 4 0.04 0.00 migration/012:46:18 PM 1073 123.42 180.18 Xorg
12:47:51 PM PID minflt/s majflt/s VSZ RSS %MEM Command12:47:51 PM 985 0.06 0.00 15328 3948 0.10 smbd12:47:51 PM 992 0.04 0.00 5592 2152 0.05 sshd12:47:51 PM 1073 526.41 0.00 1044240 321512 7.89 Xorg
12:49:18 PM PID kB_rd/s kB_wr/s kB_ccwr/s Command12:49:18 PM 330 0.00 1.15 0.00 kjournald12:49:18 PM 2899 4.35 0.09 0.04 notes212:49:18 PM 3045 23.43 0.01 0.00 audacious2
Voluntarily / Involuntary
How much KB disk I/O per process
Faults per process

13
IRQ Statistics
• Characteristics: Low overhead IRQ information • Objective: Condensed overview of IRQ activity• Usage: cat /proc/interrupts
• Shows• Which interrupts happen on which cpu
• Hints• Recent Versions (SLES11-SP2) much more useful• If interrupts are unintentionally unbalanced• If the amount of interrupts matches I/O
• This can point to non-working IRQ avoidance
14
IRQ Statistics
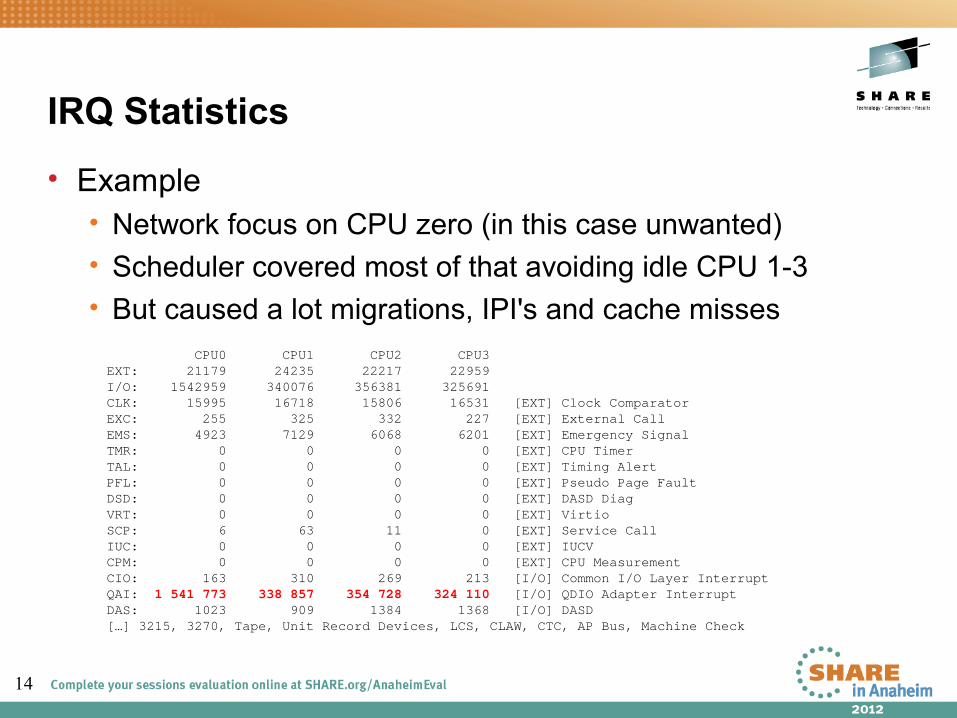
• Example• Network focus on CPU zero (in this case unwanted)• Scheduler covered most of that avoiding idle CPU 1-3• But caused a lot migrations, IPI's and cache misses
CPU0 CPU1 CPU2 CPU3 EXT: 21179 24235 22217 22959 I/O: 1542959 340076 356381 325691 CLK: 15995 16718 15806 16531 [EXT] Clock ComparatorEXC: 255 325 332 227 [EXT] External CallEMS: 4923 7129 6068 6201 [EXT] Emergency Signal TMR: 0 0 0 0 [EXT] CPU TimerTAL: 0 0 0 0 [EXT] Timing AlertPFL: 0 0 0 0 [EXT] Pseudo Page FaultDSD: 0 0 0 0 [EXT] DASD DiagVRT: 0 0 0 0 [EXT] Virtio SCP: 6 63 11 0 [EXT] Service CallIUC: 0 0 0 0 [EXT] IUCVCPM: 0 0 0 0 [EXT] CPU MeasurementCIO: 163 310 269 213 [I/O] Common I/O Layer InterruptQAI: 1 541 773 338 857 354 728 324 110 [I/O] QDIO Adapter InterruptDAS: 1023 909 1384 1368 [I/O] DASD[…] 3215, 3270, Tape, Unit Record Devices, LCS, CLAW, CTC, AP Bus, Machine Check

15
STRACE
• Characteristics: High overhead, high detail tool• Objective: Get insights about the ongoing system calls of a program• Usage: strace -p [pid of target program]
• Shows• Identify kernel entries called more often or taking too long
• Can be useful if you search for increased system time
• Time in call (-T)• Relative timestamp (-r)
• Hints• The option “-c” allows medium overhead by just tracking counters and
durations
16
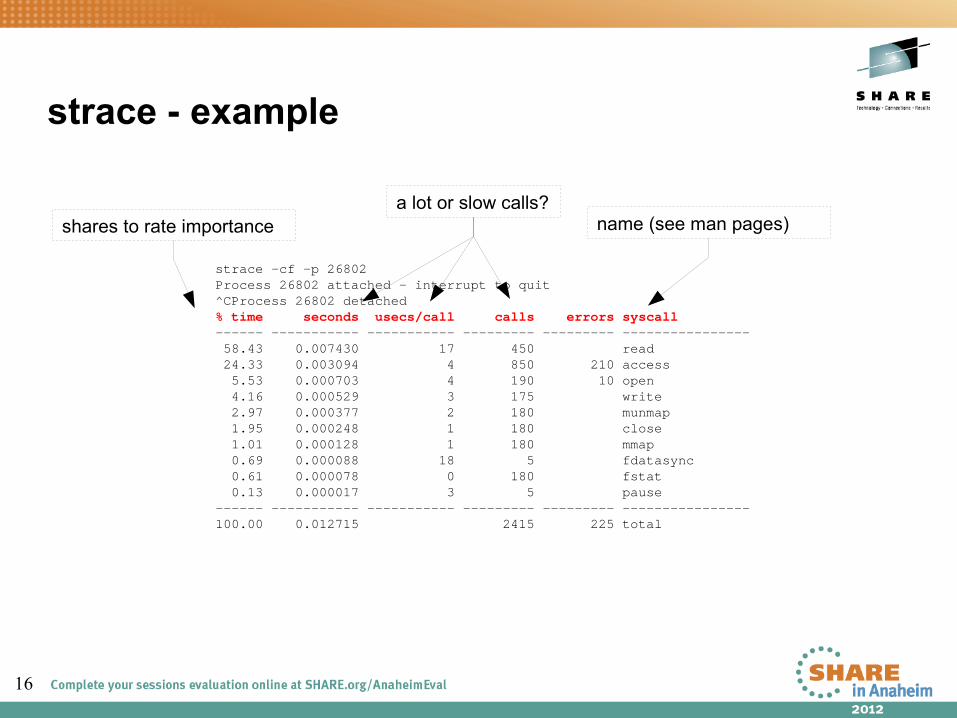
strace - example
strace -cf -p 26802Process 26802 attached - interrupt to quit^CProcess 26802 detached% time seconds usecs/call calls errors syscall------ ----------- ----------- --------- --------- ---------------- 58.43 0.007430 17 450 read 24.33 0.003094 4 850 210 access 5.53 0.000703 4 190 10 open 4.16 0.000529 3 175 write 2.97 0.000377 2 180 munmap 1.95 0.000248 1 180 close 1.01 0.000128 1 180 mmap 0.69 0.000088 18 5 fdatasync 0.61 0.000078 0 180 fstat 0.13 0.000017 3 5 pause ------ ----------- ----------- --------- --------- ----------------100.00 0.012715 2415 225 total
shares to rate importancea lot or slow calls?
name (see man pages)
17
LTRACE
• Characteristics: High overhead, high detail tool• Objective: Get insights about the ongoing library calls of a program• Usage: ltrace -p [pid of target program]
• Shows• Identify library calls that are too often or take too long
• Good if you search for additional user time• Good if things changed after upgrading libs
• Time in call (-T)• Relative timestamp (-r)
• Hints• The option “-c” allows medium overhead by just tracking counters and durations• The option -S allows to combine ltrace and strace

18
ltrace - example
ltrace -cf -p 26802% time seconds usecs/call calls function------ ----------- ----------- --------- -------------------- 98.33 46.765660 5845707 8 pause 0.94 0.445621 10 42669 strncmp 0.44 0.209839 25 8253 fgets 0.08 0.037737 11 3168 __isoc99_sscanf 0.07 0.031786 20 1530 access 0.04 0.016757 10 1611 strchr 0.03 0.016479 10 1530 snprintf 0.02 0.010467 1163 9 fdatasync 0.02 0.008899 27 324 fclose 0.02 0.007218 21 342 fopen 0.01 0.006239 19 315 write 0.00 0.000565 10 54 strncpy------ ----------- ----------- --------- --------------------100.00 47.560161 59948 total
shares to rate importancea lot or slow calls?
name (see man pages)

19
strace / ltrace – full trace
• Without -c both tools produce a full detail log• Via -f child processes can be traced as well• Extra options “-Tr” are useful to search for latencies
follow time in call / relative timestamp• Useful to “read” what exactly goes on when
Example strace'ing a sadc data gatherer0.000028 write(3, "\0\0\0\0\0\0\0\17\0\0\0\0\0\0\0\17\0\0\0\0\0\0\0\0\0\0\0\0\0\0\0\0"..., 680) = 680 <0.000007>0.000027 write(3, "\0\0\0\0\0\0\0\17\0\0\0\0\0\0\0\17\0\0\0\0\0\0\0\0\0\0\0\0\0\0\0\0"..., 680) = 680 <0.000007>0.000026 fdatasync(3) = 0 <0.002673>0.002688 pause() = 0 <3.972935>3.972957 --- SIGALRM (Alarm clock) @ 0 (0) ---0.000051 rt_sigaction(SIGALRM, {0x8000314c, [ALRM], SA_RESTART}, {0x8000314c, [ALRM], SA_RESTART}, 8) = 0 <0.000005>0.000038 alarm(4) = 0 <0.000005>0.000031 sigreturn() = ? (mask now []) <0.000005>0.000024 stat("/etc/localtime", {st_mode=S_IFREG|0644, st_size=2309, ...}) = 0 <0.000007>0.000034 open("/proc/uptime", O_RDONLY) = 4 <0.000009>0.000024 fstat(4, {st_mode=S_IFREG|0444, st_size=0, ...}) = 0 <0.000005>0.000029 mmap(NULL, 4096, PROT_READ|PROT_WRITE, MAP_PRIVATE|MAP_ANONYMOUS, -1, 0) = 0x3fffd20a000 <0.000006>0.000028 read(4, "11687.70 24836.04\n", 1024) = 18 <0.000010>0.000027 close(4) = 0 <0.000006>0.000020 munmap(0x3fffd20a000, 4096) = 0 <0.000009>
20
BLKTRACE
• Characteristics: High detail info of the block device layer actions• Objective: Understand whats going with your I/O in the kernel and devices• Usage: blktrace -d [device(s)]
Then: blkparse -st [commontracefilepart]
• Shows• Events like merging, request creation, I/O submission, I/O completion, ...• Timestamps and disk offsets for each event• Associated task and executing CPU• Application and CPU summaries
• Hints• Filter masks allow lower overhead if only specific events are of interest• Has an integrated client/server mode to stream data away
• Avoids extra disk I/O on a system with disk I/O issues

21
Blktrace – when is it useful
• Often its easy to identify that I/O is slow, but→ Where?→ Because of what?
• Blocktrace allows to• Analyze Disk I/O characteristics like sizes and offsets
• Maybe your I/O is split in a layer below
• Analyze the timing with details about all involved Linux layers• Often useful to decide if HW or SW causes stalls
• Summaries per CPU / application can identify imbalances
22
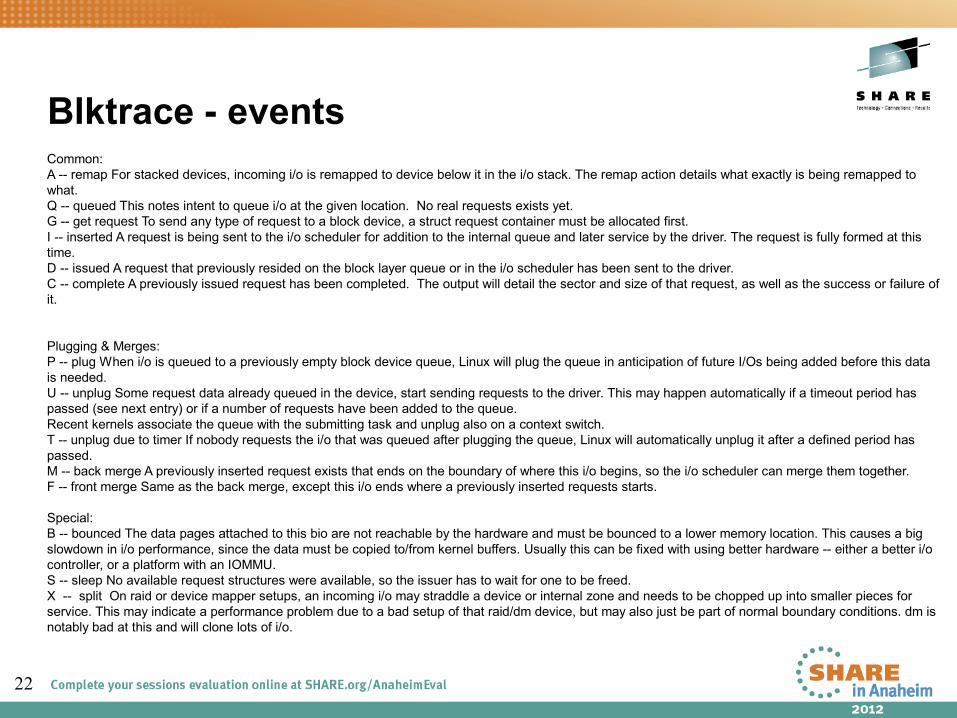
Blktrace - eventsCommon:A -- remap For stacked devices, incoming i/o is remapped to device below it in the i/o stack. The remap action details what exactly is being remapped to what.Q -- queued This notes intent to queue i/o at the given location. No real requests exists yet.G -- get request To send any type of request to a block device, a struct request container must be allocated first.I -- inserted A request is being sent to the i/o scheduler for addition to the internal queue and later service by the driver. The request is fully formed at this time.D -- issued A request that previously resided on the block layer queue or in the i/o scheduler has been sent to the driver.C -- complete A previously issued request has been completed. The output will detail the sector and size of that request, as well as the success or failure of it.
Plugging & Merges:P -- plug When i/o is queued to a previously empty block device queue, Linux will plug the queue in anticipation of future I/Os being added before this data is needed.U -- unplug Some request data already queued in the device, start sending requests to the driver. This may happen automatically if a timeout period has passed (see next entry) or if a number of requests have been added to the queue.Recent kernels associate the queue with the submitting task and unplug also on a context switch.T -- unplug due to timer If nobody requests the i/o that was queued after plugging the queue, Linux will automatically unplug it after a defined period has passed.M -- back merge A previously inserted request exists that ends on the boundary of where this i/o begins, so the i/o scheduler can merge them together.F -- front merge Same as the back merge, except this i/o ends where a previously inserted requests starts.
Special:B -- bounced The data pages attached to this bio are not reachable by the hardware and must be bounced to a lower memory location. This causes a big slowdown in i/o performance, since the data must be copied to/from kernel buffers. Usually this can be fixed with using better hardware -- either a better i/o controller, or a platform with an IOMMU.S -- sleep No available request structures were available, so the issuer has to wait for one to be freed.X -- split On raid or device mapper setups, an incoming i/o may straddle a device or internal zone and needs to be chopped up into smaller pieces for service. This may indicate a performance problem due to a bad setup of that raid/dm device, but may also just be part of normal boundary conditions. dm is notably bad at this and will clone lots of i/o.

23
Blktrace - eventsCommon:A -- remap For stacked devices, incoming i/o is remapped to device below it in the i/o stack. The remap action details what exactly is being remapped to what.Q -- queued This notes intent to queue i/o at the given location. No real requests exists yet.G -- get request To send any type of request to a block device, a struct request container must be allocated first.I -- inserted A request is being sent to the i/o scheduler for addition to the internal queue and later service by the driver. The request is fully formed at this time.D -- issued A request that previously resided on the block layer queue or in the i/o scheduler has been sent to the driver.C -- complete A previously issued request has been completed. The output will detail the sector and size of that request, as well as the success or failure of it.
Plugging & Merges:P -- plug When i/o is queued to a previously empty block device queue, Linux will plug the queue in anticipation of future I/Os being added before this data is needed.U -- unplug Some request data already queued in the device, start sending requests to the driver. This may happen automatically if a timeout period has passed (see next entry) or if a number of requests have been added to the queue.Recent kernels associate the queue with the submitting task and unplug also on a context switch.T -- unplug due to timer If nobody requests the i/o that was queued after plugging the queue, Linux will automatically unplug it after a defined period has passed.M -- back merge A previously inserted request exists that ends on the boundary of where this i/o begins, so the i/o scheduler can merge them together.F -- front merge Same as the back merge, except this i/o ends where a previously inserted requests starts.
Special:B -- bounced The data pages attached to this bio are not reachable by the hardware and must be bounced to a lower memory location. This causes a big slowdown in i/o performance, since the data must be copied to/from kernel buffers. Usually this can be fixed with using better hardware -- either a better i/o controller, or a platform with an IOMMU.S -- sleep No available request structures were available, so the issuer has to wait for one to be freed.X -- split On raid or device mapper setups, an incoming i/o may straddle a device or internal zone and needs to be chopped up into smaller pieces for service. This may indicate a performance problem due to a bad setup of that raid/dm device, but may also just be part of normal boundary conditions. dm is notably bad at this and will clone lots of i/o.
Good as documentation, but hard to
understand/remember

24
Block device layer – events (simplified)
App / A / X
C
Q
G
I
D
P
U
M / Fmergeable Y N
Merge with anexisting request
Need to Generate anew request
Plug queue and wait a bit iffollowing requests can be merged
Time from Dispatch to Complete
Unplug on upper limit (stream) orTime reached / submitting task ctx switch
Dispatch from block devicelayer to device driverAdd device driver info like dasdstat and
scsi sysfs statistics to fill this gapand gain a full circle latency insight
25
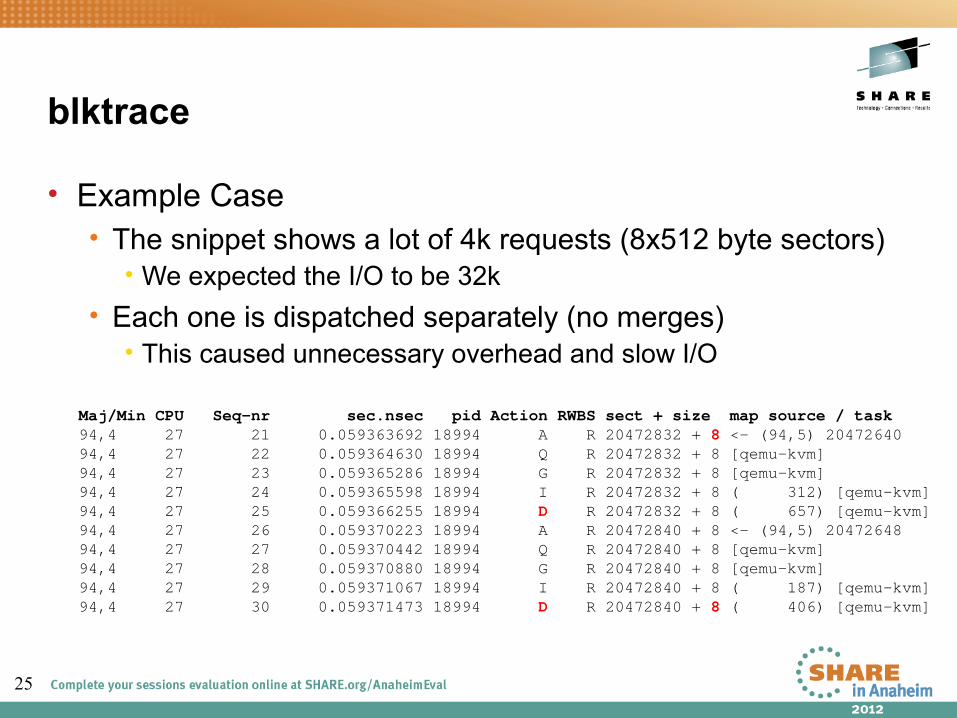
blktrace
• Example Case• The snippet shows a lot of 4k requests (8x512 byte sectors)
• We expected the I/O to be 32k
• Each one is dispatched separately (no merges)• This caused unnecessary overhead and slow I/O
Maj/Min CPU Seq-nr sec.nsec pid Action RWBS sect + size map source / task94,4 27 21 0.059363692 18994 A R 20472832 + 8 <- (94,5) 2047264094,4 27 22 0.059364630 18994 Q R 20472832 + 8 [qemu-kvm]94,4 27 23 0.059365286 18994 G R 20472832 + 8 [qemu-kvm]94,4 27 24 0.059365598 18994 I R 20472832 + 8 ( 312) [qemu-kvm]94,4 27 25 0.059366255 18994 D R 20472832 + 8 ( 657) [qemu-kvm]94,4 27 26 0.059370223 18994 A R 20472840 + 8 <- (94,5) 2047264894,4 27 27 0.059370442 18994 Q R 20472840 + 8 [qemu-kvm]94,4 27 28 0.059370880 18994 G R 20472840 + 8 [qemu-kvm]94,4 27 29 0.059371067 18994 I R 20472840 + 8 ( 187) [qemu-kvm]94,4 27 30 0.059371473 18994 D R 20472840 + 8 ( 406) [qemu-kvm]

26
blktrace
• Example Case• Analysis turned out that the I/O was from the swap code
• Same offsets were written by kswapd
• A recent code change there disabled the ability to merge• The summary below shows the difference after a fixTotal initially Reads Queued: 560,888, 2,243MiB Writes Queued: 226,242, 904,968KiB Read Dispatches: 544,701, 2,243MiB Write Dispatches: 159,318, 904,968KiB Reads Requeued: 0 Writes Requeued: 0 Reads Completed: 544,716, 2,243MiB Writes Completed: 159,321, 904,980KiB Read Merges: 16,187, 64,748KiB Write Merges: 61,744, 246,976KiB IO unplugs: 149,614 Timer unplugs: 2,940
Total after Fix Reads Queued: 734,315, 2,937MiB Writes Queued: 300,188, 1,200MiB Read Dispatches: 214,972, 2,937MiB Write Dispatches: 215,176, 1,200MiB Reads Requeued: 0 Writes Requeued: 0 Reads Completed: 214,971, 2,937MiB Writes Completed: 215,177, 1,200MiB Read Merges: 519,343, 2,077MiB Write Merges: 73,325, 293,300KiB IO unplugs: 337,130 Timer unplugs: 11,184
27
Hyptop
• Characteristics: Easy to use Guest/LPAR overview• Objective: Check CPU and overhead statistics of your own and sibling images• Usage: hyptop
• Shows• CPU load & Management overhead• Memory usage• Can show image overview or single image details
• Hints• Good “first view” tool for linux admins that want to look “out of their linux”• Requirements:
• For z/VM the Guest needs Class B• For LPAR “Global performance data control” checkbox in HMC
28
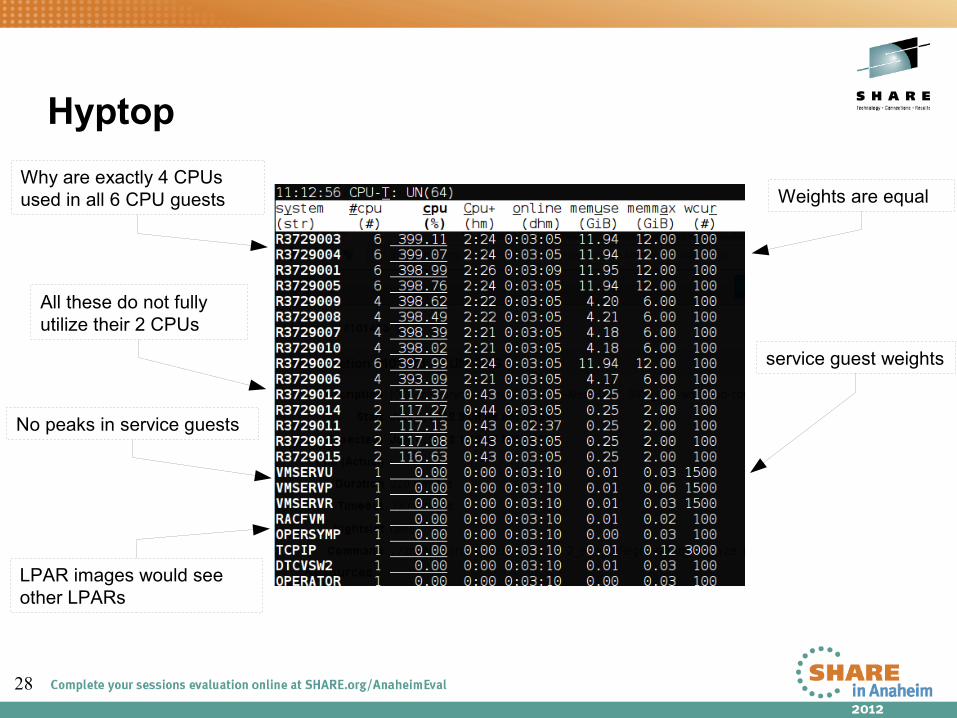
Hyptop
Why are exactly 4 CPUs used in all 6 CPU guests Weights are equal
All these do not fully utilize their 2 CPUs
No peaks in service guests
service guest weights
LPAR images would see other LPARs

29
Profiling
• Characteristics: Easy to use profiling and kernel tracing• Objective: Get detailed information where & why CPU is consumed• Usage: perf top (to begin with)
• Shows• Sampling for CPU hotspots
• Annotated source code along hotspot
• CPU event counters• Further integrated non-sampling tools
• Hints• Without HW support only userspace can be reasonably profiled• “successor” of oprofile that is available with HW support (SLES11-SP2)• Perf HW support code upstream, wait for next distribution releases
30
Profiling
• What profiling can and what it can't• + Search hotspots of CPU consumption worth to optimize• + List functions according to their usage• - Search where time is lost (I/O, Stalls)
• Perf is not just a sampling tool• Integrated tools to evaluate tracepoints like
“perf sched”, “perf timechart”, …• Opposite to real sampling this can help to search for stalls
31
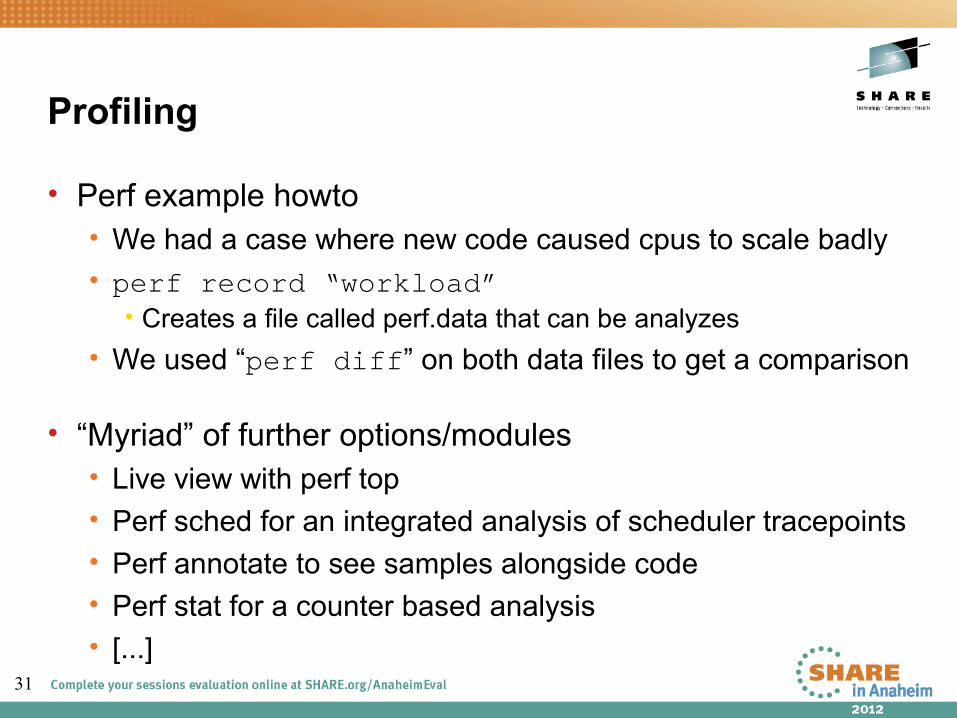
Profiling
• Perf example howto• We had a case where new code caused cpus to scale badly• perf record “workload”
• Creates a file called perf.data that can be analyzes
• We used “perf diff” on both data files to get a comparison
• “Myriad” of further options/modules• Live view with perf top• Perf sched for an integrated analysis of scheduler tracepoints• Perf annotate to see samples alongside code• Perf stat for a counter based analysis• [...]

32
Profiling
• Perf example (perf diff)• found a locking issue causing increased cpu consumption
# Baseline Delta Symbol
# ........ .......... ................... ......
#
12.14% +8.07% [kernel.kallsyms] [k] lock_acquire
8.96% +5.50% [kernel.kallsyms] [k] lock_release
4.83% +0.38% reaim [.] add_long
4.22% +0.41% reaim [.] add_int
4.10% +2.49% [kernel.kallsyms] [k] lock_acquired
3.17% +0.38% libc-2.11.3.so [.] msort_with_tmp
3.56% -0.37% reaim [.] string_rtns_1
3.04% -0.38% libc-2.11.3.so [.] strncat

33
Valgrind
• Characteristics: In depth memory analysis• Objective: Find out where memory is leaked, sub-optimally
cached, ...• Usage: valgrind [program]
• Shows• Memory leaks• Cache profiling• Heap profiling
• Hints• Runs on binaries, therefore easy to use• Debug Info not required but makes output more useful

34
Valgrind Overview
Binary000000008000062c <main>:stmg %r9,%r15,72(%r15)lay %r15,-80160(%r15)lhi %r12,0lhi %r10,10000la %r9,160(%r15)lgr %r13,%r9lgr %r11,%r9lghi %r2,1brasl %r14,8000044c <malloc@plt>lgfr %r1,%r12ahi %r12,1stg %r2,0(%r11)sllg %r1,%r1,3aghi %r11,8pfd 2,96(%r1,%r9)brct %r10,8000064c <main+0x20>lay %r12,80160(%r15)lg %r2,0(%r13)aghi %r13,8brasl %r14,8000048c <free@plt>cgrjne %r12,%r13,8000067e <main+0x52>lhi %r13,0lhi %r12,10000lgfr %r2,%r13ahi %r13,1brasl %r14,800005c0 <stacker>brct %r12,8000069c <main+0x70>lg %r4,80272(%r15)lmg %r9,%r15,80232(%r15)br %r4
valgrind
translationinto IR
instrumentation
translationTo machine code
kernel
Sys
tem
cal
l int
erf
a ce
Newbinary
xxx
libraries
Replace some of
The library calls byUsing a preloadlibrary
System callwrapper
• Technology is based on a JIT (Just-in-Time Compiler)• Intermediate language allows debugging instrumentation
35
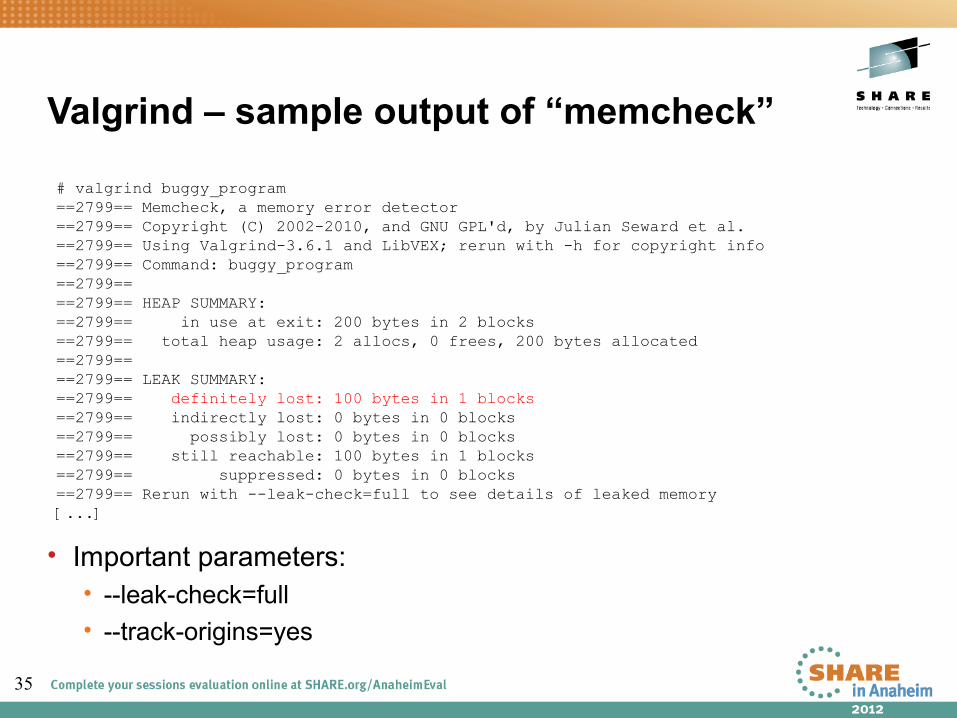
Valgrind – sample output of “memcheck”
# valgrind buggy_program==2799== Memcheck, a memory error detector==2799== Copyright (C) 2002-2010, and GNU GPL'd, by Julian Seward et al.==2799== Using Valgrind-3.6.1 and LibVEX; rerun with -h for copyright info==2799== Command: buggy_program==2799== ==2799== HEAP SUMMARY:==2799== in use at exit: 200 bytes in 2 blocks==2799== total heap usage: 2 allocs, 0 frees, 200 bytes allocated==2799== ==2799== LEAK SUMMARY:==2799== definitely lost: 100 bytes in 1 blocks==2799== indirectly lost: 0 bytes in 0 blocks==2799== possibly lost: 0 bytes in 0 blocks==2799== still reachable: 100 bytes in 1 blocks==2799== suppressed: 0 bytes in 0 blocks==2799== Rerun with --leak-check=full to see details of leaked memory[...]
• Important parameters:• --leak-check=full • --track-origins=yes
36
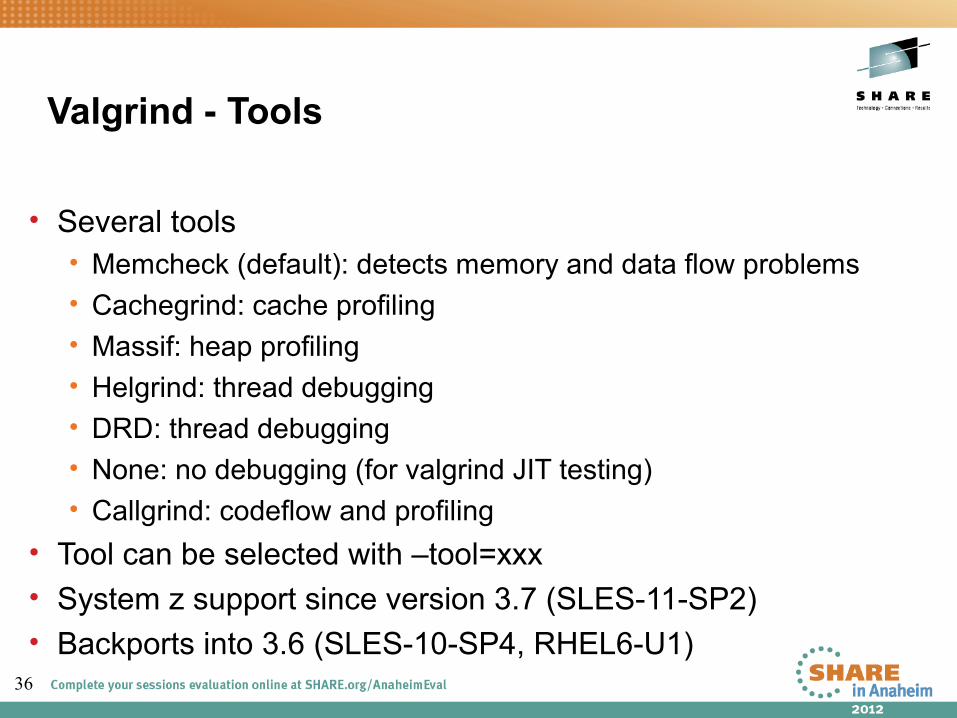
Valgrind - Tools
• Several tools• Memcheck (default): detects memory and data flow problems• Cachegrind: cache profiling• Massif: heap profiling• Helgrind: thread debugging• DRD: thread debugging• None: no debugging (for valgrind JIT testing)• Callgrind: codeflow and profiling
• Tool can be selected with –tool=xxx• System z support since version 3.7 (SLES-11-SP2)• Backports into 3.6 (SLES-10-SP4, RHEL6-U1)
37
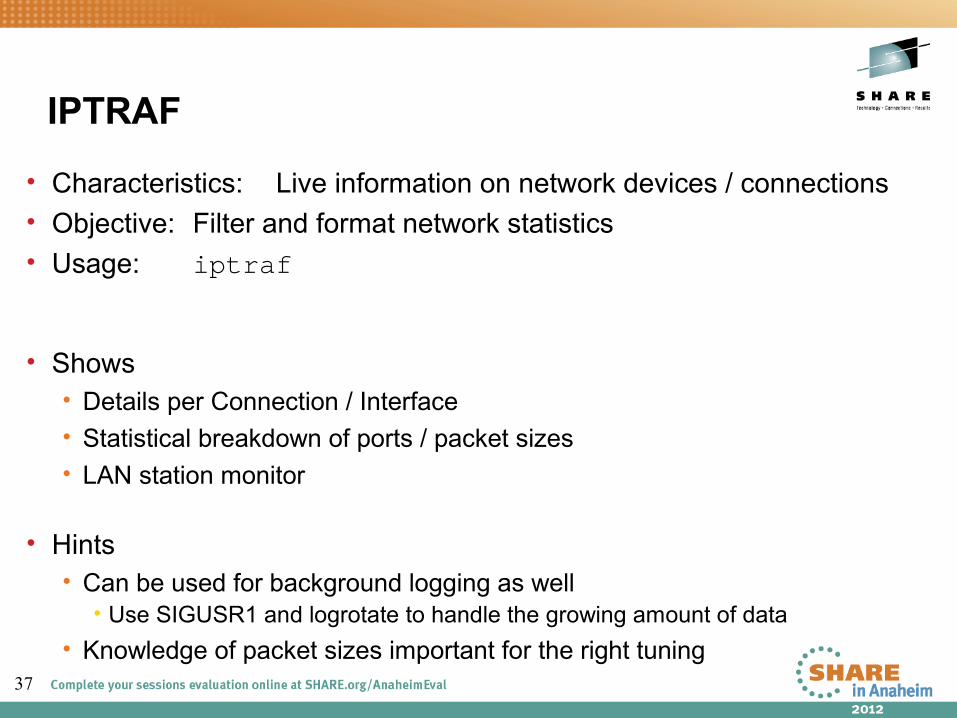
IPTRAF
• Characteristics: Live information on network devices / connections• Objective: Filter and format network statistics• Usage: iptraf
• Shows• Details per Connection / Interface• Statistical breakdown of ports / packet sizes• LAN station monitor
• Hints• Can be used for background logging as well
• Use SIGUSR1 and logrotate to handle the growing amount of data
• Knowledge of packet sizes important for the right tuning
38
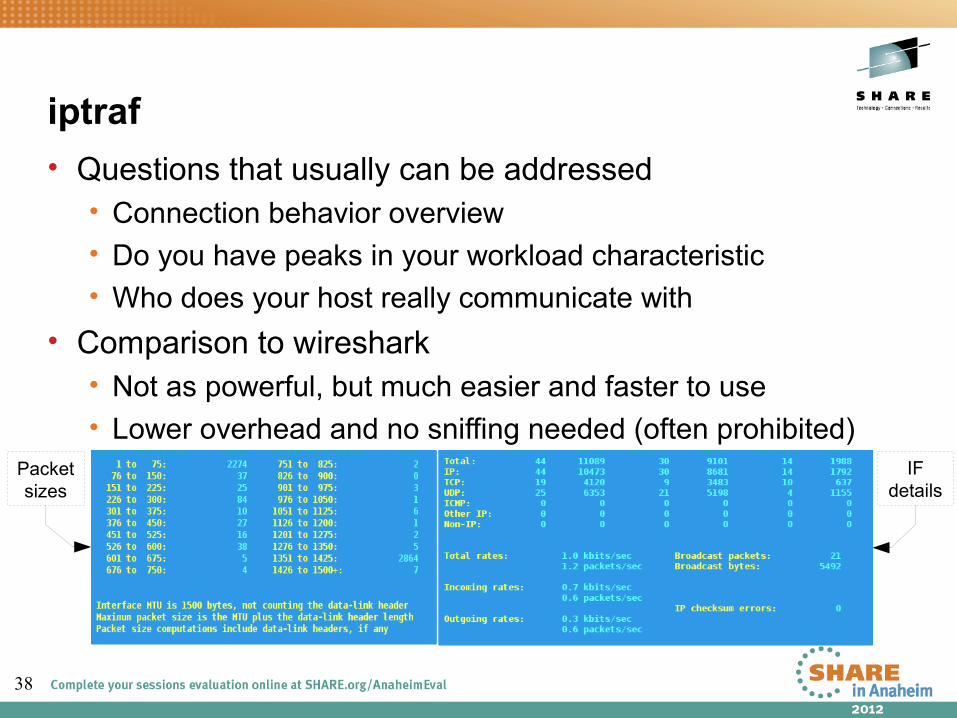
iptraf
• Questions that usually can be addressed• Connection behavior overview• Do you have peaks in your workload characteristic• Who does your host really communicate with
• Comparison to wireshark• Not as powerful, but much easier and faster to use• Lower overhead and no sniffing needed (often prohibited)
IFdetails
Packetsizes

39
Tracepoints (Events)
• Characteristics: Complex interface, but a vast source of information• Objective: In kernel latency and activity insights• Usage: Access debugfs mount point /tracing
• Shows• Timestamp and activity name• Tracepoints can provide event specific context data• Infrastructure adds extra common context data like cpu, preempts depth, ...
• Hints• Very powerful and customizable, there are hundreds of tracepoints
• Some tracepoints have tools to be accessed “perf sched”, “blktrace” both base on them• Others need custom postprocessing
• There are much more things you can handle with tracepoints check outKernel Documentation/trace/tracepoint-analysis.txt (via perf stat)
Kernel Documentation/trace/events.txt (custom access)
40
Tracepoints – example I/III
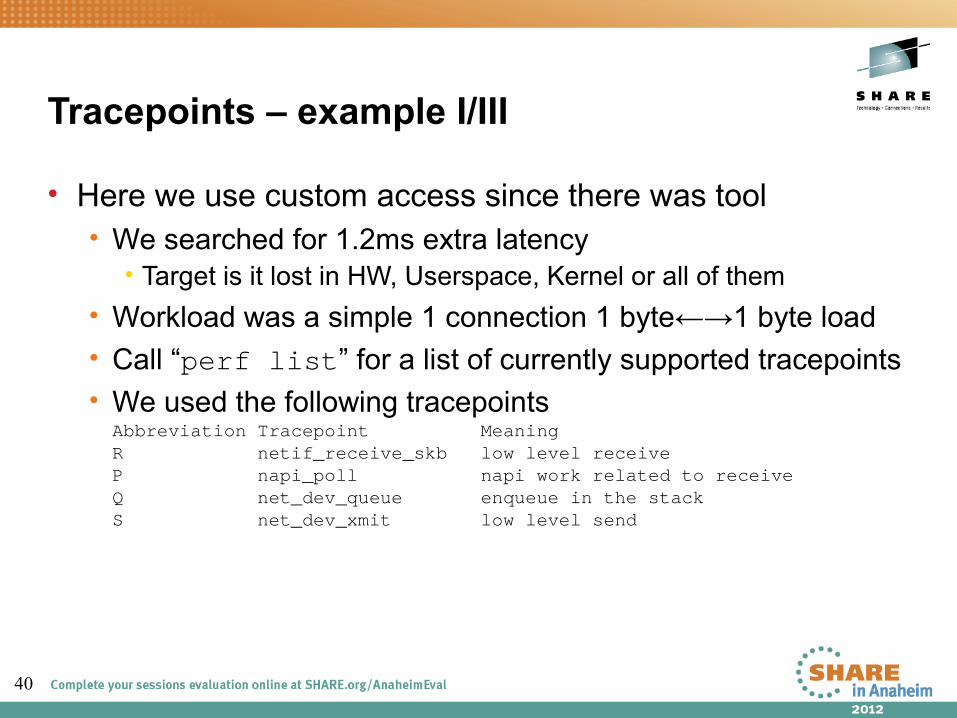
• Here we use custom access since there was tool• We searched for 1.2ms extra latency
• Target is it lost in HW, Userspace, Kernel or all of them
• Workload was a simple 1 connection 1 byte←→1 byte load• Call “perf list” for a list of currently supported tracepoints• We used the following tracepoints
Abbreviation Tracepoint MeaningR netif_receive_skb low level receiveP napi_poll napi work related to receiveQ net_dev_queue enqueue in the stackS net_dev_xmit low level send
41
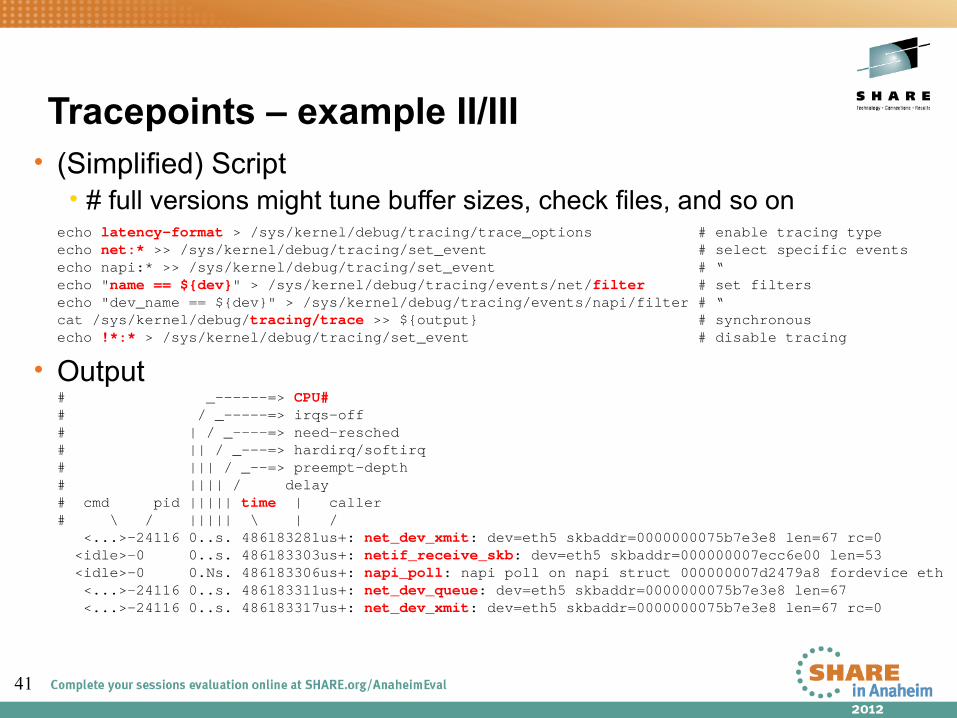
Tracepoints – example II/III• (Simplified) Script
• # full versions might tune buffer sizes, check files, and so onecho latency-format > /sys/kernel/debug/tracing/trace_options # enable tracing typeecho net:* >> /sys/kernel/debug/tracing/set_event # select specific eventsecho napi:* >> /sys/kernel/debug/tracing/set_event # “echo "name == ${dev}" > /sys/kernel/debug/tracing/events/net/filter # set filtersecho "dev_name == ${dev}" > /sys/kernel/debug/tracing/events/napi/filter # “cat /sys/kernel/debug/tracing/trace >> ${output} # synchronousecho !*:* > /sys/kernel/debug/tracing/set_event # disable tracing
• Output# _------=> CPU# # / _-----=> irqs-off # | / _----=> need-resched # || / _---=> hardirq/softirq # ||| / _--=> preempt-depth # |||| / delay # cmd pid ||||| time | caller # \ / ||||| \ | / <...>-24116 0..s. 486183281us+: net_dev_xmit: dev=eth5 skbaddr=0000000075b7e3e8 len=67 rc=0 <idle>-0 0..s. 486183303us+: netif_receive_skb: dev=eth5 skbaddr=000000007ecc6e00 len=53 <idle>-0 0.Ns. 486183306us+: napi_poll: napi poll on napi struct 000000007d2479a8 fordevice eth <...>-24116 0..s. 486183311us+: net_dev_queue: dev=eth5 skbaddr=0000000075b7e3e8 len=67 <...>-24116 0..s. 486183317us+: net_dev_xmit: dev=eth5 skbaddr=0000000075b7e3e8 len=67 rc=0

42
Tracepoints – example III/III
• Example postprocessed
SUM COUNT AVERAGE MIN MAX STD-DEVP2Q: 8478724 1572635 5.39 4 2140 7.41 Q2S: 12188675 1572638 7.65 3 71 4.89 S2R: 38562294 1572636 24.42 1 2158 9.08 R2P: 4197486 1572633 2.57 1 43 2.39 SUM: 63427179 1572635 40.03 SUM COUNT AVERAGE MIN MAX STD-DEVP2Q: 7191885 1300897 5.53 4 171 1.31 Q2S: 10622270 1300897 8.17 3 71 5.99 S2R: 32078550 1300898 24.66 2 286 5.88 R2P: 3707814 1300897 2.85 1 265 2.59 SUM: 53600519 1300897 41.20
• Confirmed that most of the 1.2 ms were list in our image• Confirmed that it was not at/between a specific function
• Eventually it was an interrupt locality issue causing bad caching

43
Tool 1st overview CPU consumption
latencies Hot spots Disk I/O Memory Network
top / ps x x
sysstat x x x x
vmstat x x x
iostat x x
dasdstat x
scsistat x
netstat x x
htop / dstat / pidstat x x x x
irqstats x x x
strace / ltrace x
hyptop x
profiling x x
blktrace x
valgrind x
iptraf x x
tracepoints x x x x x
Orientation - where to go

Questions
• Further information is available at• Linux on System z – Tuning hints and tips
http://www.ibm.com/developerworks/linux/linux390/perf/index.html
• Live Virtual Classes for z/VM and Linuxhttp://www.vm.ibm.com/education/lvc/
Research & DevelopmentSchönaicher Strasse 22071032 Böblingen, Germany
Christian EhrhardtLinux on System zPerformance Evaluation
45
Backup
• Basic Tools• vmstat• systat• iostat• dasdstat / scsi statistics• netstat• ss• top / ps
• Further complex tools (no slides)• ftrace• systemtap

46
Valgrind - Good to know
• No need to recompile, but• Better results with debug info• Gcc option -O0 might result in more findings(the compiler might
hide some errors)• Gcc option -fno-builtin might result in more findings
• --trace-children=yes will also debug child processes• Setuid programs might cause trouble
• Valgrind is the process container (→ no setuid)• Possible solution: remove setuid and start as the right user, check
documentation for other ways
• The program will be slower• 5-30 times slower for memcheck
47
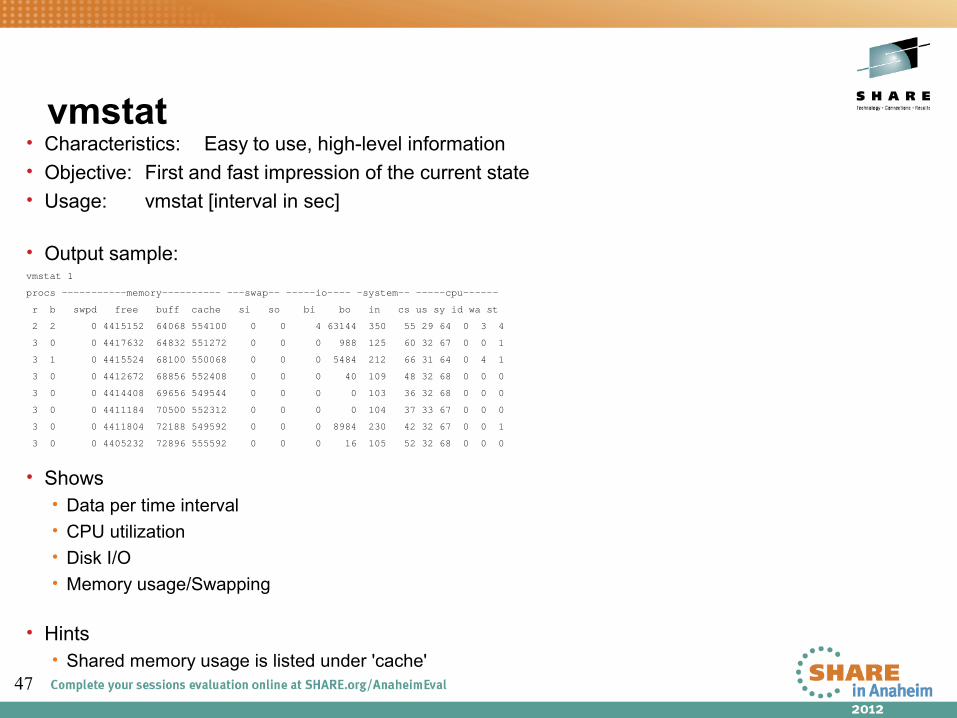
vmstat• Characteristics: Easy to use, high-level information• Objective: First and fast impression of the current state• Usage: vmstat [interval in sec]
• Output sample:vmstat 1
procs -----------memory---------- ---swap-- -----io---- -system-- -----cpu------
r b swpd free buff cache si so bi bo in cs us sy id wa st
2 2 0 4415152 64068 554100 0 0 4 63144 350 55 29 64 0 3 4
3 0 0 4417632 64832 551272 0 0 0 988 125 60 32 67 0 0 1
3 1 0 4415524 68100 550068 0 0 0 5484 212 66 31 64 0 4 1
3 0 0 4412672 68856 552408 0 0 0 40 109 48 32 68 0 0 0
3 0 0 4414408 69656 549544 0 0 0 0 103 36 32 68 0 0 0
3 0 0 4411184 70500 552312 0 0 0 0 104 37 33 67 0 0 0
3 0 0 4411804 72188 549592 0 0 0 8984 230 42 32 67 0 0 1
3 0 0 4405232 72896 555592 0 0 0 16 105 52 32 68 0 0 0
• Shows• Data per time interval• CPU utilization• Disk I/O• Memory usage/Swapping
• Hints• Shared memory usage is listed under 'cache'
48
sadc/sar• Characteristics: Very comprehensive, statistics data on device level• Objective: Suitable for permanent system monitoring and detailed analysis• Usage (recommended):
• monitor /usr/lib64/sa/sadc -d [interval in sec] [outfile]• view sar -A -f [outfile]
• Shows• CPU utilization• Disk I/O overview and on device level• Network I/O and errors on device level• Memory usage/Swapping• … and much more• Reports statistics data over time and creates average values for each item
• Hints• Specify -d parameter to sadc to include disk device statistics (increase size of outfile)• Shared memory is listed under 'cache'• [outfile] is a binary file, which contains all values. It is formatted using sar
• enables the creation of item specific reports, e.g. network only• enables the specification of a start and end time → time of interest
49
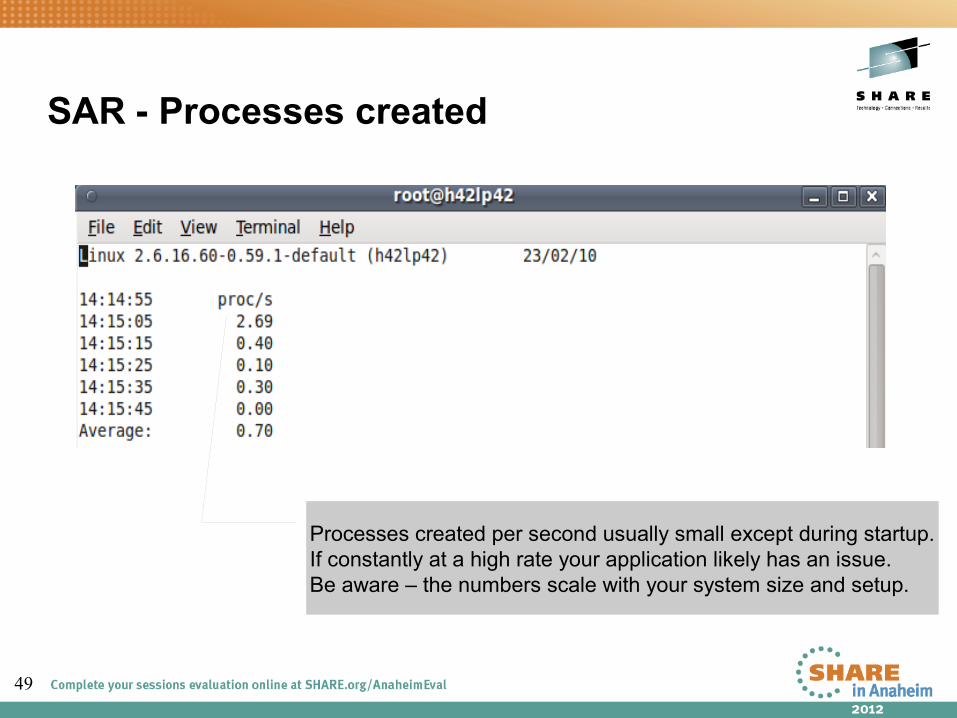
SAR - Processes created
Processes created per second usually small except during startup.If constantly at a high rate your application likely has an issue.Be aware – the numbers scale with your system size and setup.
50
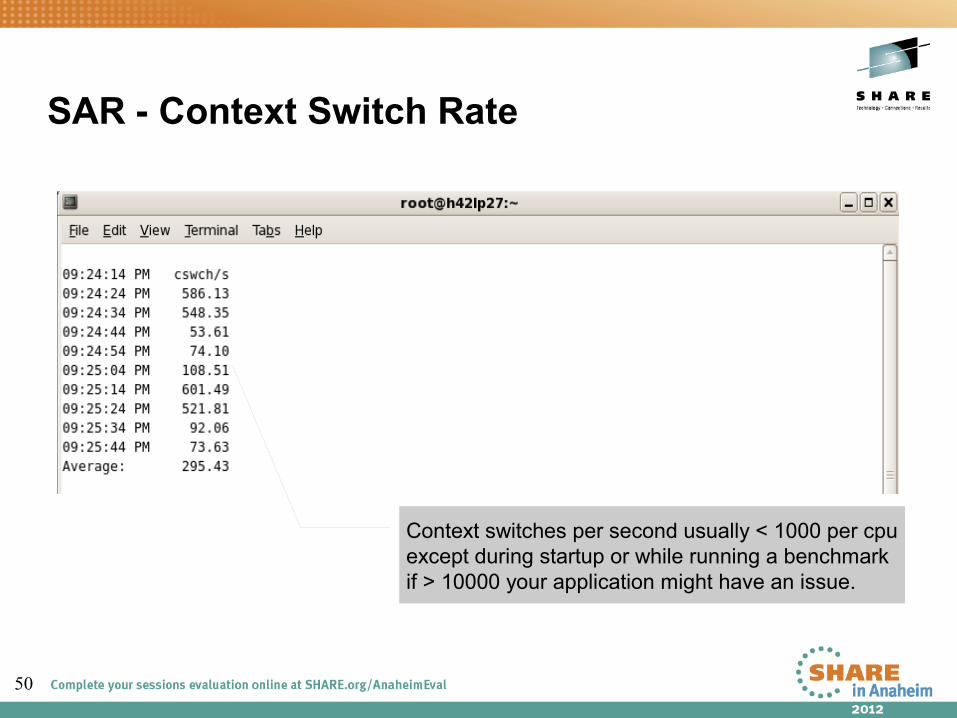
SAR - Context Switch Rate
Context switches per second usually < 1000 per cpuexcept during startup or while running a benchmarkif > 10000 your application might have an issue.
51
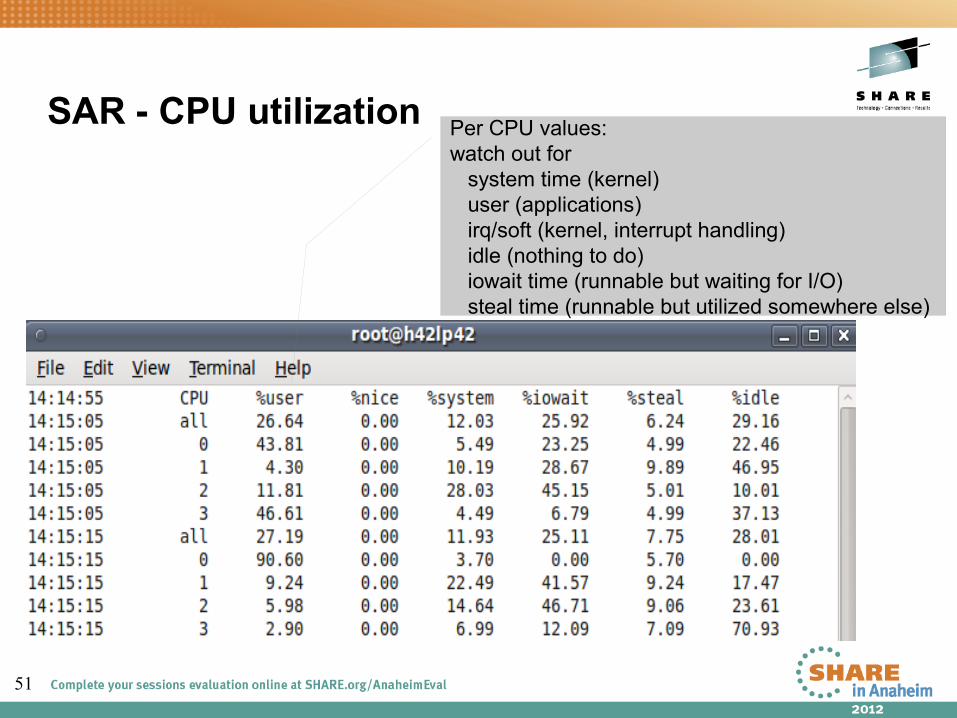
SAR - CPU utilization Per CPU values:watch out for system time (kernel) user (applications) irq/soft (kernel, interrupt handling) idle (nothing to do) iowait time (runnable but waiting for I/O) steal time (runnable but utilized somewhere else)
52
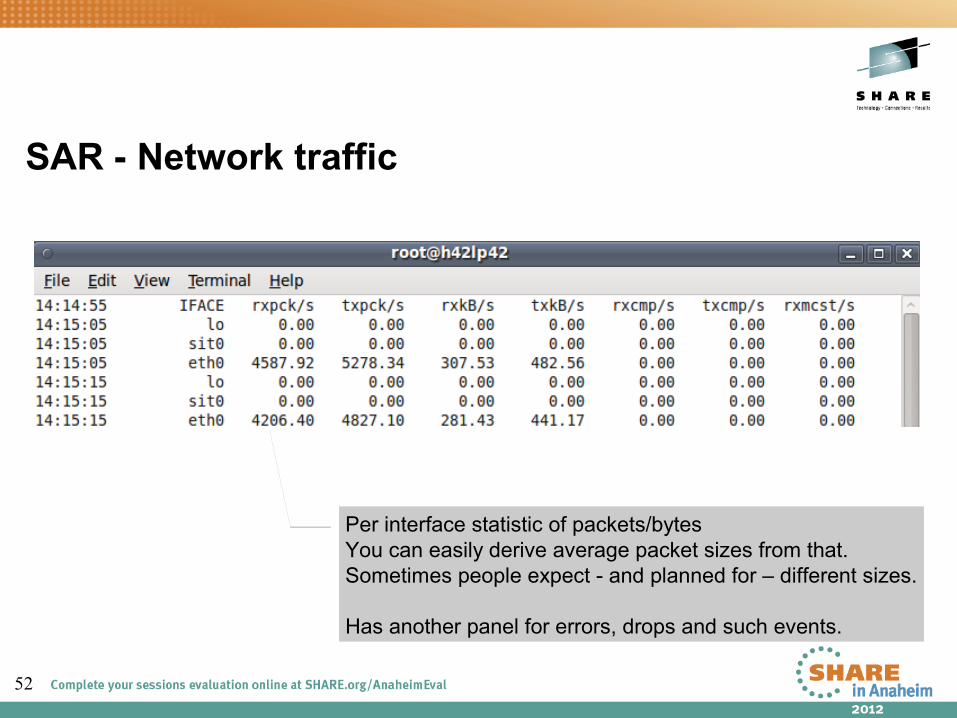
Per interface statistic of packets/bytesYou can easily derive average packet sizes from that.Sometimes people expect - and planned for – different sizes.
Has another panel for errors, drops and such events.
SAR - Network traffic

53
SAR – Disk I/O I – overall
Overview of- operations per second- transferred amount
54
SAR – Disk I/O II – per device
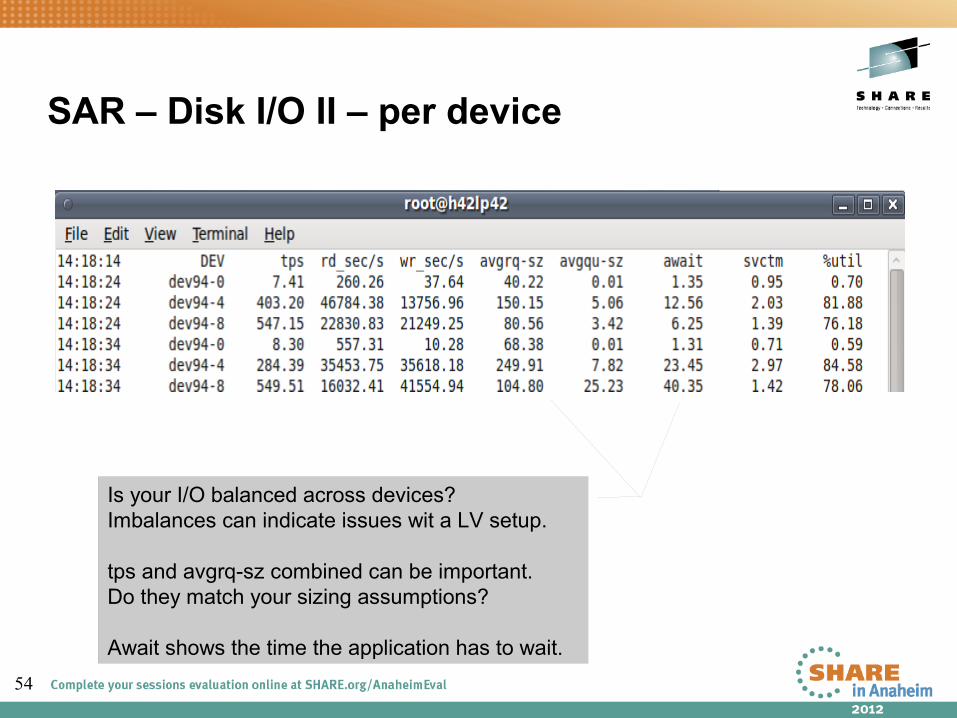
Is your I/O balanced across devices?Imbalances can indicate issues wit a LV setup.
tps and avgrq-sz combined can be important.Do they match your sizing assumptions?
Await shows the time the application has to wait.

55
SAR - Memory statistics - the false friend
Be aware that high %memused and low kbmemfreeis no indication of a memory shortage (common mistake).
Same for swap – to use swap is actually good,but to access it (swapin/-out) all the time is bad.
56
SAR - Memory pressure - Swap
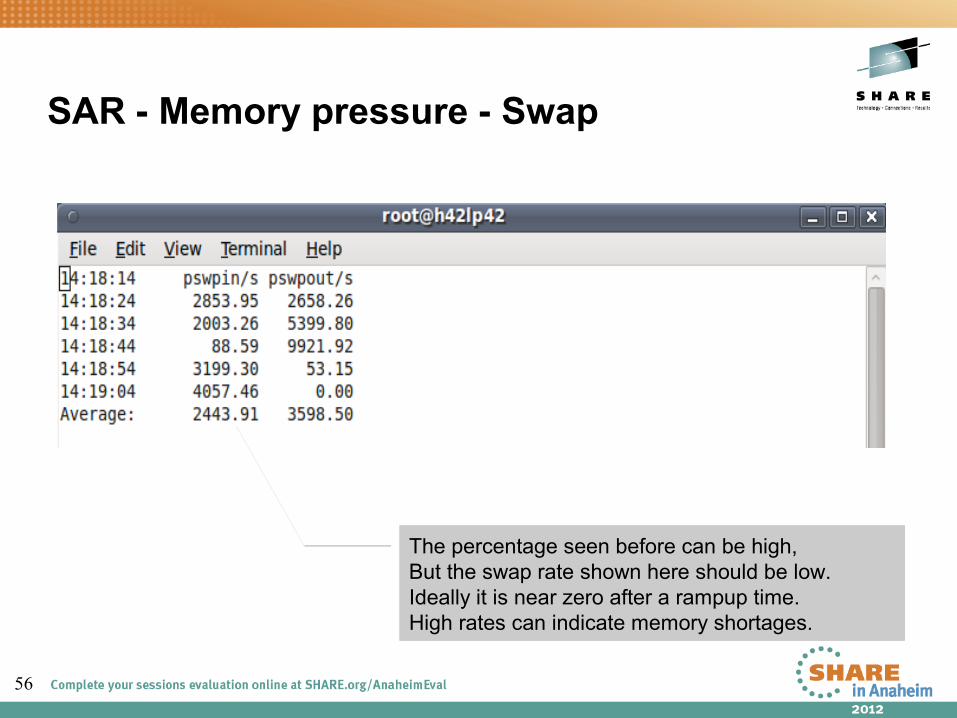
The percentage seen before can be high,But the swap rate shown here should be low.Ideally it is near zero after a rampup time.High rates can indicate memory shortages.
57
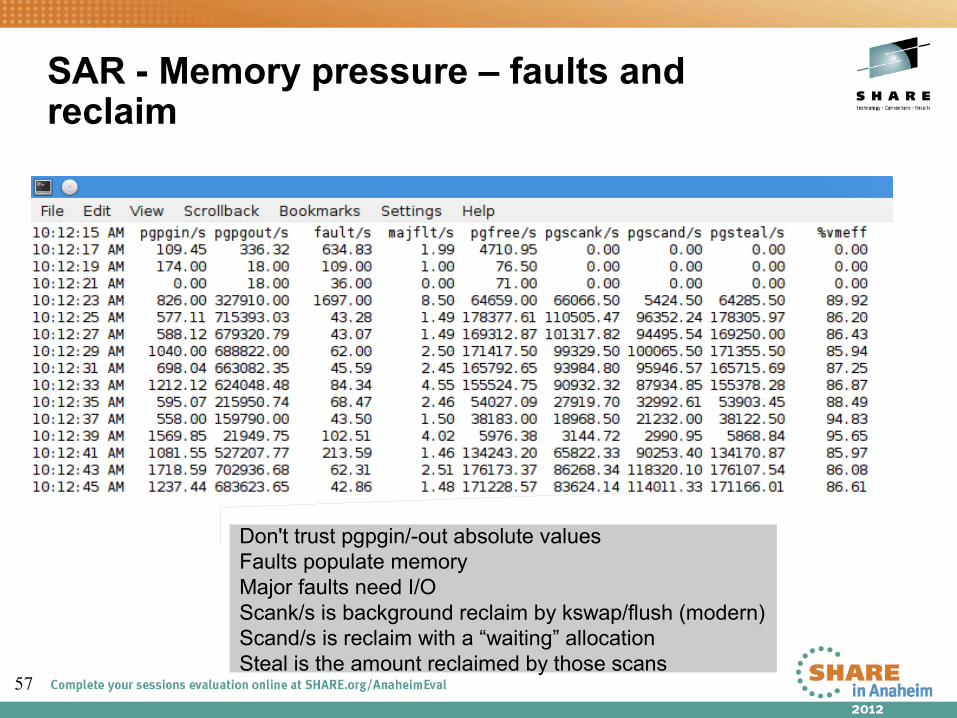
SAR - Memory pressure – faults and reclaim
Don't trust pgpgin/-out absolute valuesFaults populate memoryMajor faults need I/OScank/s is background reclaim by kswap/flush (modern)Scand/s is reclaim with a “waiting” allocationSteal is the amount reclaimed by those scans

58
SAR - System Load
Runqueue size are the currently runnable programs.It's not bad to have many, but if they exceed the amountof CPUs you could do more work in parallel.
Plist-sz is the overall number of programs, if that is alwaysgrowing you have likely a process starvation or connection issue.
Load average is a runqueue length average for 1/5/15 minutes.
59
iostat
• Characteristics: Easy to use, information on disk device level• Objective: Detailed input/output disk statistics• Usage: iostat -xtdk [interval in sec]
• Shows• Throughput• Request merging• Device queue information• Service times
• Hints• Most critical parameter often is await
• average time (in milliseconds) for I/O requests issued to the device to be served. • includes the time spent by the requests in queue and the time spent servicing them.
• Also suitable for network file systems

60
iostat
• Output sample:
Time: 10:56:35 AM
Device: rrqm/s wrqm/s r/s w/s rkB/s wkB/s avgrq-sz avgqu-sz await svctm %util
dasda 0.19 1.45 1.23 0.74 64.43 9.29 74.88 0.01 2.65 0.80 0.16
dasdb 0.02 232.93 0.03 9.83 0.18 975.17 197.84 0.98 99.80 1.34 1.33
Time: 10:56:36 AM
Device: rrqm/s wrqm/s r/s w/s rkB/s wkB/s avgrq-sz avgqu-sz await svctm %util
dasda 0.00 0.00 0.00 0.00 0.00 0.00 0.00 0.00 0.00 0.00 0.00
dasdb 0.00 1981.55 0.00 339.81 0.00 9495.15 55.89 0.91 2.69 1.14 38.83
Time: 10:56:37 AM
Device: rrqm/s wrqm/s r/s w/s rkB/s wkB/s avgrq-sz avgqu-sz await svctm %util
dasda 0.00 0.00 0.00 0.00 0.00 0.00 0.00 0.00 0.00 0.00 0.00
dasdb 0.00 2055.00 0.00 344.00 0.00 9628.00 55.98 1.01 2.88 1.19 41.00
61
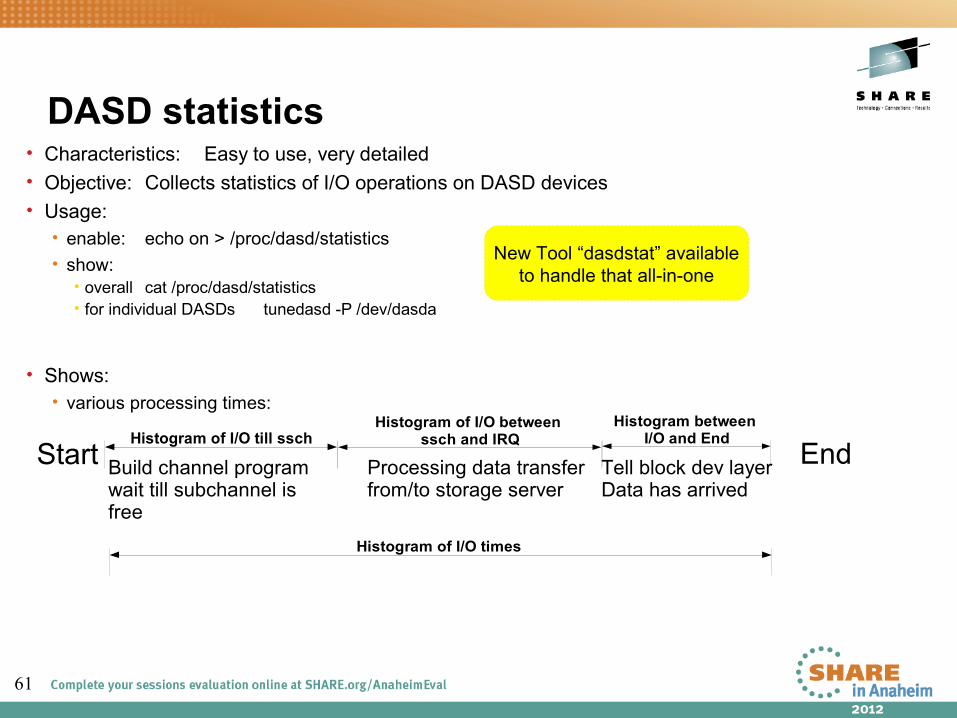
DASD statistics• Characteristics: Easy to use, very detailed• Objective: Collects statistics of I/O operations on DASD devices• Usage:
• enable: echo on > /proc/dasd/statistics• show:
• overall cat /proc/dasd/statistics• for individual DASDs tunedasd -P /dev/dasda
• Shows:• various processing times:
Histogram of I/O till sschHistogram of I/O between
ssch and IRQHistogram between
I/O and EndStart End
Histogram of I/O times
Build channel programwait till subchannel is free
Processing data transferfrom/to storage server
Tell block dev layerData has arrived
New Tool “dasdstat” availableto handle that all-in-one

62
DASD statistics - report• Sample: 4KB <= request size < 8 KB 1ms <= response time < 2 ms
29432 dasd I/O requestswith 6227424 sectors(512B each) __<4 ___8 __16 __32 __64 _128 _256 _512 __1k __2k __4k __8k _16k _32k _64k 128k _256 _512 __1M __2M __4M __8M _16M _32M _64M 128M 256M 512M __1G __2G __4G _>4G
Histogram of sizes (512B secs) 0 0 9925 3605 1866 4050 4102 933 2700 2251 0 0 0 0 0 0 0 0 0 0 0 0 0 0 0 0 0 0 0 0 0 0
Histogram of I/O times (microseconds) 0 0 0 0 0 0 0 1283 1249 6351 7496 3658 8583 805 7 0 0 0 0 0 0 0 0 0 0 0 0 0 0 0 0 0
Histogram of I/O time till ssch 2314 283 98 34 13 5 16 275 497 8917 5567 4232 7117 60 4 0 0 0 0 0 0 0 0 0 0 0 0 0 0 0 0 0Histogram of I/O time between ssch and irq 0 0 0 0 0 0 0 14018 7189 2402 1031 4758 27 4 3 0 0 0 0 0 0 0 0 0 0 0 0 0 0 0 0 0
Histogram of I/O time between irq and end 2733 6 5702 9376 5781 940 1113 3781 0 0 0 0 0 0 0 0 0 0 0 0 0 0 0 0 0 0 0 0 0 0 0 0
# of req in chanq at enqueuing (1..32) 0 2740 628 1711 1328 23024 0 0 0 0 0 0 0 0 0 0 0 0 0 0 0 0 0 0 0 0 0 0 0 0 0 0
• Hints• Also shows data per sector
63
FCP statistics
• Characteristics: Detailed latency information (SLES9 and SLES10)• Objective: Collects statistics of I/O operations on FCP devices on
request base, separate for read/write
• Usage: • enable
• CONFIG_STATISTICS=y must be set in the kernel config file• debugfs is mounted at /sys/kernel/debug/• For a certain LUN in directory /sys/kernel/debug/statistics/zfcp-<device-bus-id>-<WWPN>-<LUN>issue echo on=1 > definition (turn off with on=0, reset with data=reset)
• view• cat /sys/kernel/debug/statistics/zfcp-<device-bus-id>-<WWPN>-<LUN>/data
• Hint• FCP and DASD statistics are not directly comparable, because in the FCP case many
I/O requests can be sent to the same LUN before the first response is given. There is a queue at FCP driver entry and in the storage server
64
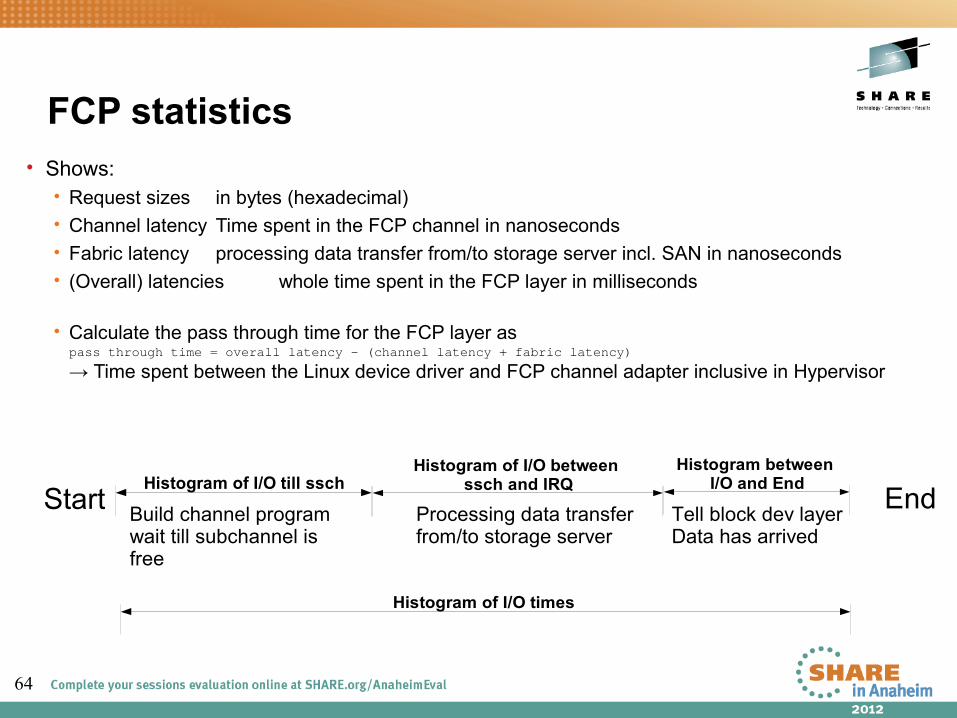
FCP statistics• Shows:
• Request sizes in bytes (hexadecimal)• Channel latency Time spent in the FCP channel in nanoseconds• Fabric latency processing data transfer from/to storage server incl. SAN in nanoseconds• (Overall) latencies whole time spent in the FCP layer in milliseconds
• Calculate the pass through time for the FCP layer as pass through time = overall latency – (channel latency + fabric latency)
→ Time spent between the Linux device driver and FCP channel adapter inclusive in Hypervisor
Histogram of I/O till sschHistogram of I/O between
ssch and IRQHistogram between
I/O and EndStart End
Histogram of I/O times
Build channel programwait till subchannel is free
Processing data transferfrom/to storage server
Tell block dev layerData has arrived
65
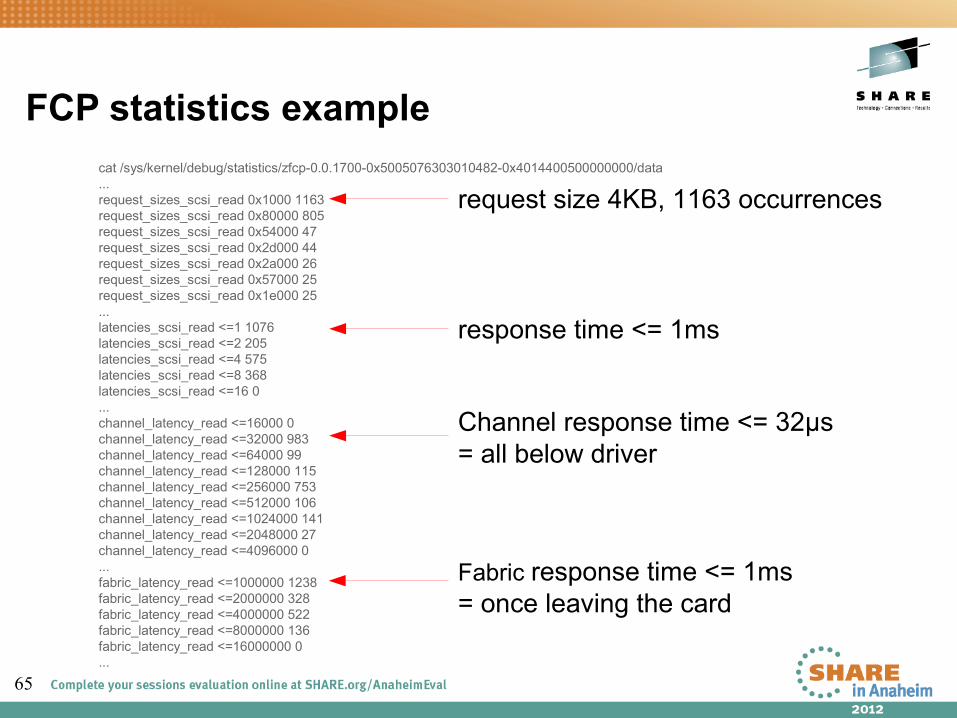
FCP statistics examplecat /sys/kernel/debug/statistics/zfcp-0.0.1700-0x5005076303010482-0x4014400500000000/data...request_sizes_scsi_read 0x1000 1163request_sizes_scsi_read 0x80000 805request_sizes_scsi_read 0x54000 47request_sizes_scsi_read 0x2d000 44request_sizes_scsi_read 0x2a000 26request_sizes_scsi_read 0x57000 25request_sizes_scsi_read 0x1e000 25...latencies_scsi_read <=1 1076latencies_scsi_read <=2 205latencies_scsi_read <=4 575latencies_scsi_read <=8 368latencies_scsi_read <=16 0...channel_latency_read <=16000 0channel_latency_read <=32000 983channel_latency_read <=64000 99channel_latency_read <=128000 115channel_latency_read <=256000 753channel_latency_read <=512000 106channel_latency_read <=1024000 141channel_latency_read <=2048000 27channel_latency_read <=4096000 0...fabric_latency_read <=1000000 1238fabric_latency_read <=2000000 328fabric_latency_read <=4000000 522fabric_latency_read <=8000000 136fabric_latency_read <=16000000 0...
request size 4KB, 1163 occurrences
response time <= 1ms
Channel response time <= 32μs= all below driver
Fabric response time <= 1ms= once leaving the card

66
FCP statistics explained
• Shows:• The channel latency roughly corresponds to the time a request spent in the
channel. (μsec)• The fabric latency is the time a request spent outside the system z machine.
This includes latencies caused by the SAN and the SCSI device (storage server). (μsec)
• The passthrough latency is the delay caused by QDIO (the FCP transport between Linux device driver and FCP channel adapter) and, if applicable, a hypervisor which makes FCP subchannels available to a hosted Linux system.
• The passthrough latency can be estimated aspassthrough latency = overall latency – (channel latency + fabric latency)
Start EndChannel Latency
Fabric Latency
Overall Latency

67
netstat• Characteristics: Easy to use, connection information• Objective: Lists connections• Usage: netstat -eeapn
• Shows• Information about each connection• Various connection states
• Hints• Inodes and program names are useful to reverse-map ports to
applications
68
netstat -s• Characteristics: Easy to use, very detailed information• Objective: Display summary statistics for each protocol• Usage: netstat -s
• Shows• Information to each protocol• Amount of incoming and outgoing packages• Various error states, for example TCP segments retransmitted!
• Hints• Shows accumulated values since system start, therefore mostly the differences
between two snapshots are needed• There is always a low amount of packets in error or resets• Retransmits occurring only when the system is sending data
When the system is not able to receive, then the sender shows retransmits• Use sadc/sar to identify the device
69
netstat -s
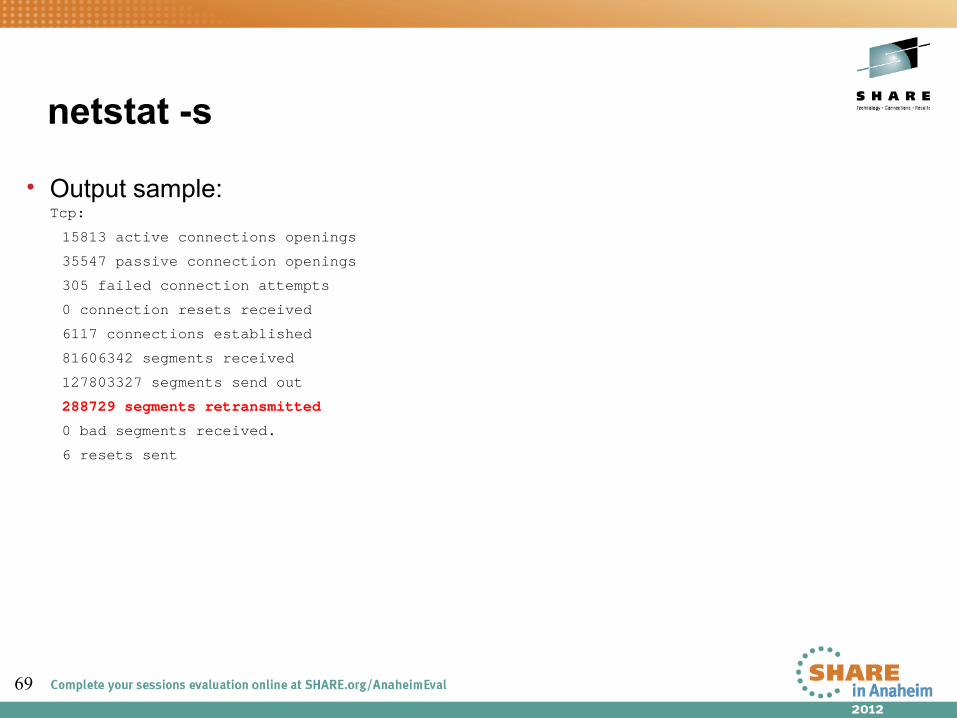
• Output sample:Tcp:
15813 active connections openings
35547 passive connection openings
305 failed connection attempts
0 connection resets received
6117 connections established
81606342 segments received
127803327 segments send out
288729 segments retransmitted
0 bad segments received.
6 resets sent
70
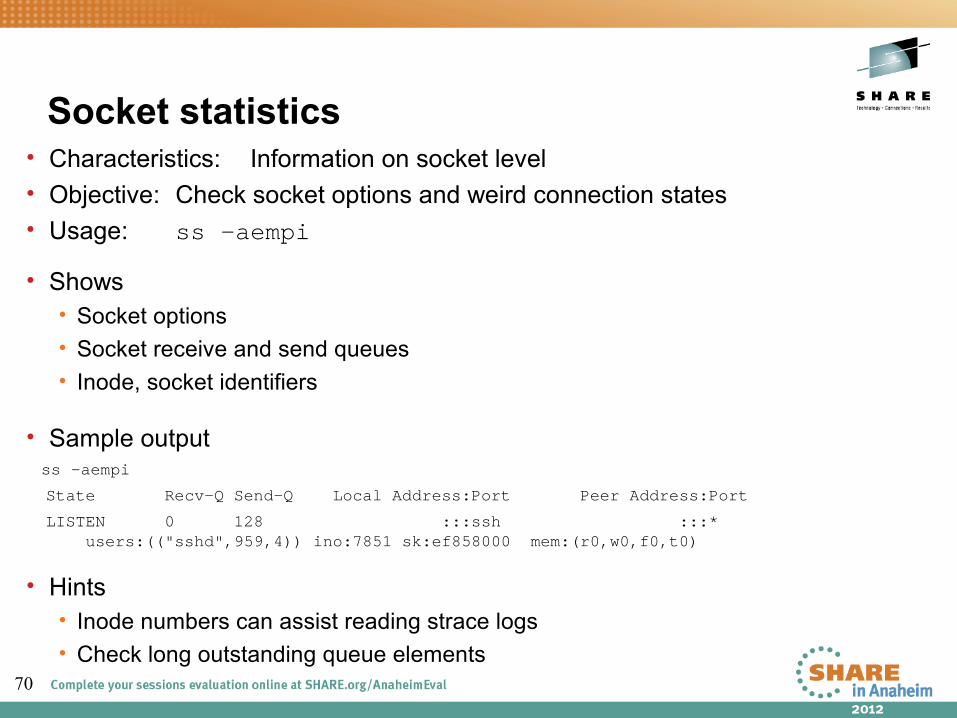
Socket statistics• Characteristics: Information on socket level• Objective: Check socket options and weird connection states• Usage: ss -aempi
• Shows• Socket options• Socket receive and send queues• Inode, socket identifiers
• Sample output ss -aempi
State Recv-Q Send-Q Local Address:Port Peer Address:Port
LISTEN 0 128 :::ssh :::* users:(("sshd",959,4)) ino:7851 sk:ef858000 mem:(r0,w0,f0,t0)
• Hints• Inode numbers can assist reading strace logs• Check long outstanding queue elements

71
• Characteristics: Easy to use • Objective: Shows resource usage on process level• Usage: top -b -d [interval in sec] > [outfile]
• Shows• CPU utilization• Detailed memory usage
• Hints• Parameter -b enables to write the output for each interval into a file• Use -p [pid1, pid2,...] to reduce the output to the processes of interest• Configure displayed columns using 'f' key on the running top program• Use the 'W' key to write current configuration to ~/.toprc
→ becomes the default
Top
72
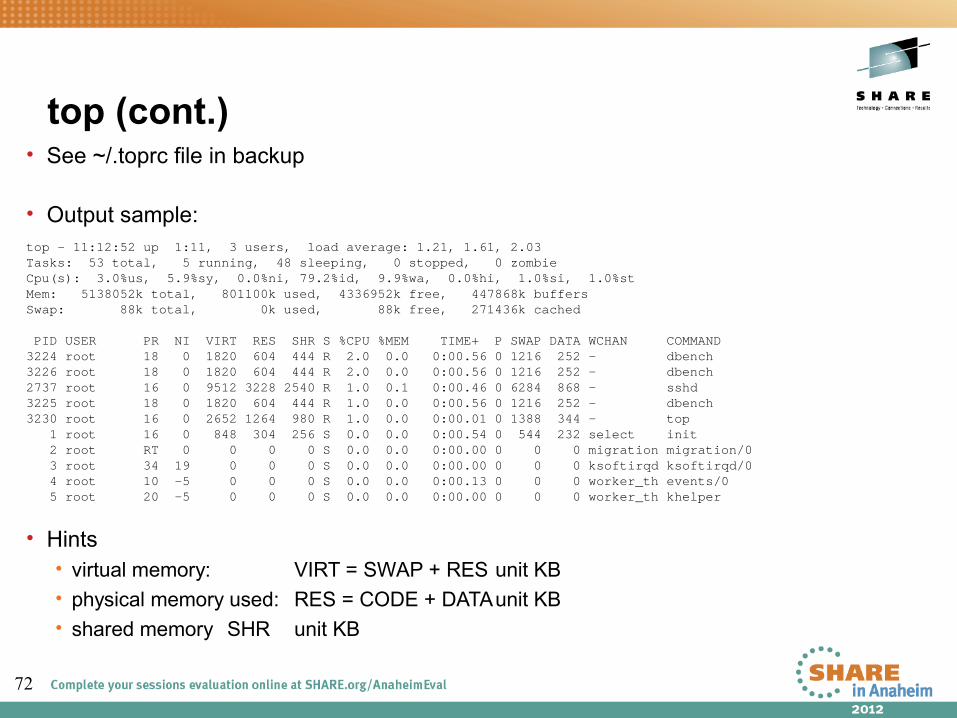
top (cont.)• See ~/.toprc file in backup
• Output sample:top - 11:12:52 up 1:11, 3 users, load average: 1.21, 1.61, 2.03Tasks: 53 total, 5 running, 48 sleeping, 0 stopped, 0 zombieCpu(s): 3.0%us, 5.9%sy, 0.0%ni, 79.2%id, 9.9%wa, 0.0%hi, 1.0%si, 1.0%stMem: 5138052k total, 801100k used, 4336952k free, 447868k buffersSwap: 88k total, 0k used, 88k free, 271436k cached
PID USER PR NI VIRT RES SHR S %CPU %MEM TIME+ P SWAP DATA WCHAN COMMAND3224 root 18 0 1820 604 444 R 2.0 0.0 0:00.56 0 1216 252 - dbench3226 root 18 0 1820 604 444 R 2.0 0.0 0:00.56 0 1216 252 - dbench2737 root 16 0 9512 3228 2540 R 1.0 0.1 0:00.46 0 6284 868 - sshd3225 root 18 0 1820 604 444 R 1.0 0.0 0:00.56 0 1216 252 - dbench3230 root 16 0 2652 1264 980 R 1.0 0.0 0:00.01 0 1388 344 - top 1 root 16 0 848 304 256 S 0.0 0.0 0:00.54 0 544 232 select init 2 root RT 0 0 0 0 S 0.0 0.0 0:00.00 0 0 0 migration migration/0 3 root 34 19 0 0 0 S 0.0 0.0 0:00.00 0 0 0 ksoftirqd ksoftirqd/0 4 root 10 -5 0 0 0 S 0.0 0.0 0:00.13 0 0 0 worker_th events/0 5 root 20 -5 0 0 0 S 0.0 0.0 0:00.00 0 0 0 worker_th khelper
• Hints• virtual memory: VIRT = SWAP + RES unit KB• physical memory used: RES = CODE + DATAunit KB• shared memory SHR unit KB
73
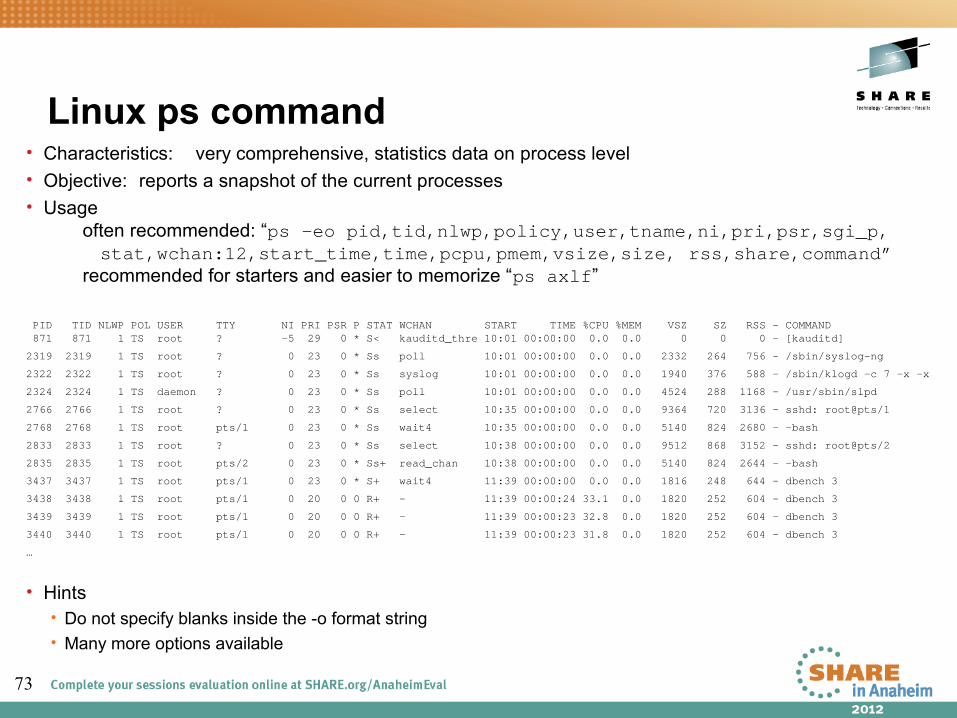
Linux ps command • Characteristics: very comprehensive, statistics data on process level• Objective: reports a snapshot of the current processes• Usage
often recommended: “ps -eo pid,tid,nlwp,policy,user,tname,ni,pri,psr,sgi_p, stat,wchan:12,start_time,time,pcpu,pmem,vsize,size, rss,share,command”
recommended for starters and easier to memorize “ps axlf”
PID TID NLWP POL USER TTY NI PRI PSR P STAT WCHAN START TIME %CPU %MEM VSZ SZ RSS - COMMAND 871 871 1 TS root ? -5 29 0 * S< kauditd_thre 10:01 00:00:00 0.0 0.0 0 0 0 - [kauditd]
2319 2319 1 TS root ? 0 23 0 * Ss poll 10:01 00:00:00 0.0 0.0 2332 264 756 - /sbin/syslog-ng
2322 2322 1 TS root ? 0 23 0 * Ss syslog 10:01 00:00:00 0.0 0.0 1940 376 588 - /sbin/klogd -c 7 -x -x
2324 2324 1 TS daemon ? 0 23 0 * Ss poll 10:01 00:00:00 0.0 0.0 4524 288 1168 - /usr/sbin/slpd
2766 2766 1 TS root ? 0 23 0 * Ss select 10:35 00:00:00 0.0 0.0 9364 720 3136 - sshd: root@pts/1
2768 2768 1 TS root pts/1 0 23 0 * Ss wait4 10:35 00:00:00 0.0 0.0 5140 824 2680 - -bash
2833 2833 1 TS root ? 0 23 0 * Ss select 10:38 00:00:00 0.0 0.0 9512 868 3152 - sshd: root@pts/2
2835 2835 1 TS root pts/2 0 23 0 * Ss+ read_chan 10:38 00:00:00 0.0 0.0 5140 824 2644 - -bash
3437 3437 1 TS root pts/1 0 23 0 * S+ wait4 11:39 00:00:00 0.0 0.0 1816 248 644 - dbench 3
3438 3438 1 TS root pts/1 0 20 0 0 R+ - 11:39 00:00:24 33.1 0.0 1820 252 604 - dbench 3
3439 3439 1 TS root pts/1 0 20 0 0 R+ - 11:39 00:00:23 32.8 0.0 1820 252 604 - dbench 3
3440 3440 1 TS root pts/1 0 20 0 0 R+ - 11:39 00:00:23 31.8 0.0 1820 252 604 - dbench 3
…
• Hints• Do not specify blanks inside the -o format string• Many more options available

Questions
• Further information is available at• Linux on System z – Tuning hints and tips
http://www.ibm.com/developerworks/linux/linux390/perf/index.html
• Live Virtual Classes for z/VM and Linuxhttp://www.vm.ibm.com/education/lvc/
Research & DevelopmentSchönaicher Strasse 22071032 Böblingen, Germany
Christian EhrhardtLinux on System zPerformance Evaluation


![strace: new features · Systemcallspecificationimprovements [3/6] %fstatsyscallclass fstat,fstat64 fstatat64,newfstatat oldfstat strace-y-e%fstatfind/var/empty-mindepth1](https://img.pdfslide.us/doc/110x75/5ad995eb7f8b9a6d7e8b8f13/strace-new-features-cationimprovements-36-fstatsyscallclass-fstatfstat64.jpg)