Embed Size (px)
Citation preview

How to Read an Environmental
Laboratory Report
What is really included in that appendix?

Objectives
• Introduce the typical environmental industry data handling/management practices
• Improve ability to interpret an environmental laboratory report/quality assurance data
• Identify potential reasons to aid in your decisions on when to look deeper into the laboratory report

Environmental Data Management Overview
At lab: • Samples received • Samples processed and
analyzed • Data validated and
reported
Outside of the lab: • Data
reviewed/revalidated • Data summarized
(tabularized) • Lab report put in an
appendix or as an attachment

Environmental Data Management Overview:
Quality Assurance Samples
• Main tools for diagnosing data problems
• Include checks on sampling and analysis procedures
• Some are produced during sampling, some in the laboratory
• Laboratory QA sample results are compared to criteria for evaluation

Environmental Data Management Overview:
Qualifiers
• Qualifiers – Indicators of limitations (or biases) in the data
Qualifier
a Estimated value, calculated using some or all values that are estimates.
b Potential false positive value based on blank data validation procedures.
c Coeluting compound.
e Estimated value, exceeded the instrument calibration range.
f Sample was collected at a flowrate exceeding the recommended rate of 200 mL/minute.
h EPA recommended sample preservation, extraction or analysis holding time was exceeded.
i Indeterminate value based on failure of blind duplicate data to meet quality assurance criteria.
j Reported value is less than the stated laboratory quantitation limit and is considered an estimated value.
p Relative percent difference is >40% (25% CLP pesticides) between primary and confirmation GC columns.
pp Small peak in chromatogram below method detection limit.
rThe presence of the compound is suspect based on the ID criteria of the retention time and relative retention time obtained from the
examination of the chromatograms.
s Potential false positive value based on statistical analysis of blank sample data.
t Sample positive for total coliforms but negative for E. coli.
v Sample was collected under a vacuum of greater than XX inches of mercury.
* Estimated value, QA/QC criteria not met.
** Unusable value, QA/QC criteria not met.
AT Sample chromatogram is noted to be atypical of a petroleum product.
EMPC Estimated maximum possible concentration.
• Introduced by the laboratory and/or by outside data reviewers (consultants, agencies, etc.)

Typical Data Summaries: What do we get?
Sample Name MW-1 MW-12 MW-13
Sample Date 7/27/2013 7/27/2013 12/21/2013
Chemical Name
Total or
Dissolved
Analysis
Location
MN Intervention
Limits
MN GW Values
Table
Effective Date 6/6/2001 01/13/2011
Exceedance Key No Exceed Underline
General Parameters
Dissolved oxygen NA Field 3.16 mg/l 6.8 mg/l 7.32 mg/l
pH, standard units NA Field 7.24 pH units 6.81 pH units 7.27 pH units
Redox (oxidation potential) NA Field -84 mV 48.4 mV 65 mV
Specific Conductance umhos@ 25oC NA Field 620 umhos/cm 654 umhos/cm 626 umhos/cm
Temperature, degrees C NA Field 11.33 deg C 11.39 deg C 11.37 deg C
Turbidity NA Field 4.52 NTU 1.35 NTU 1.47 NTU
Metals
Boron Dissolved Lab [250 ug/l] 1000 RAA ug/l < 100 ug/l 150 ug/l 370 ug/l*
Boron Total Lab [250 ug/l] 1000 RAA ug/l 4ug/l 200 ug/l* 400 ug/l*
Chromium Dissolved Lab 30 ug/l 100 CR ug/l < 10 ug/l < 10 ug/l < 10 ug/l
Lead Dissolved Lab 5 ug/l < 3.0 ug/l < 3.0 ug/l < 3.0 ug/l
Nickel Dissolved Lab 30 ug/l 100 HRL93 ug/l < 5.0 ug/l 5.7 ug/l < 5.0 ug/l
* Estimated amount QA/QC not met
Table 1
Any Site
2013 Water Quality Data

Typical Data Summaries: What do we need?
• What do the qualifiers really mean?
• Are there other limitations of the data?
• What else happened during the analytical process?

Environmental Laboratory Report: Where all
the answers are
• Typical Elements:
• Case narrative
• Analytical results
• Quality control data
• Additional information
• Chain of custody
• Sample receipt form
• Chromatograms (if applicable)

Case Narrative: A Must Read
• Purpose – To give an overall assessment of the laboratory data and to summarize any issues that occurred during analysis
• Not to be confused with a laboratory cover letter

Case Narrative: Example Cover Letter
“No problems were encountered during the analysis. Additionally, all results for the associated quality control samples were within EPA and/or (laboratory) established limits.”

Case Narrative:Example

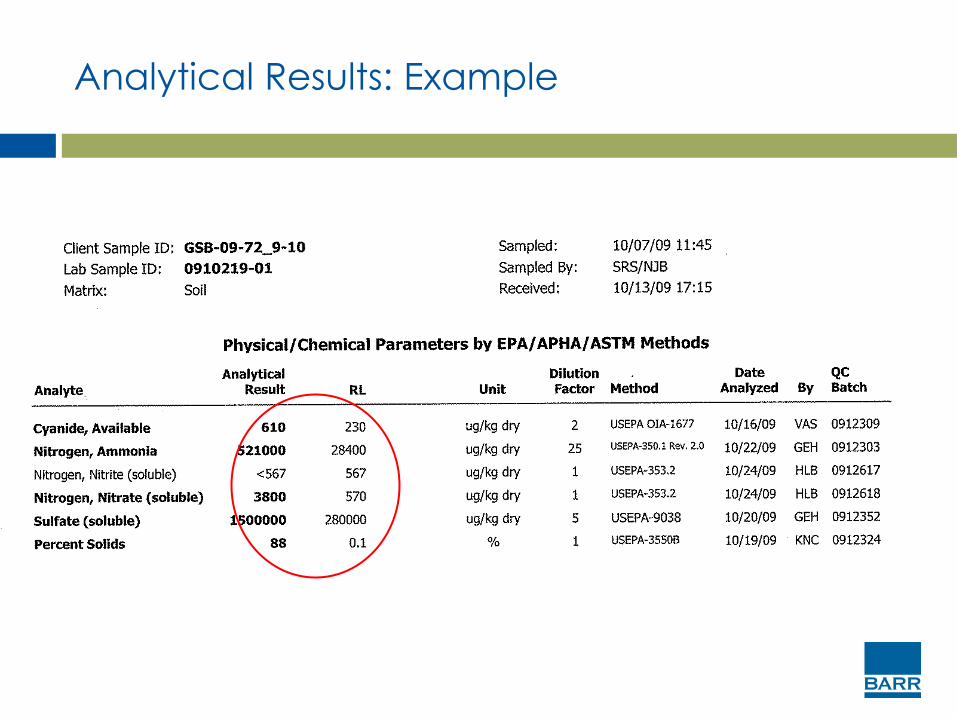
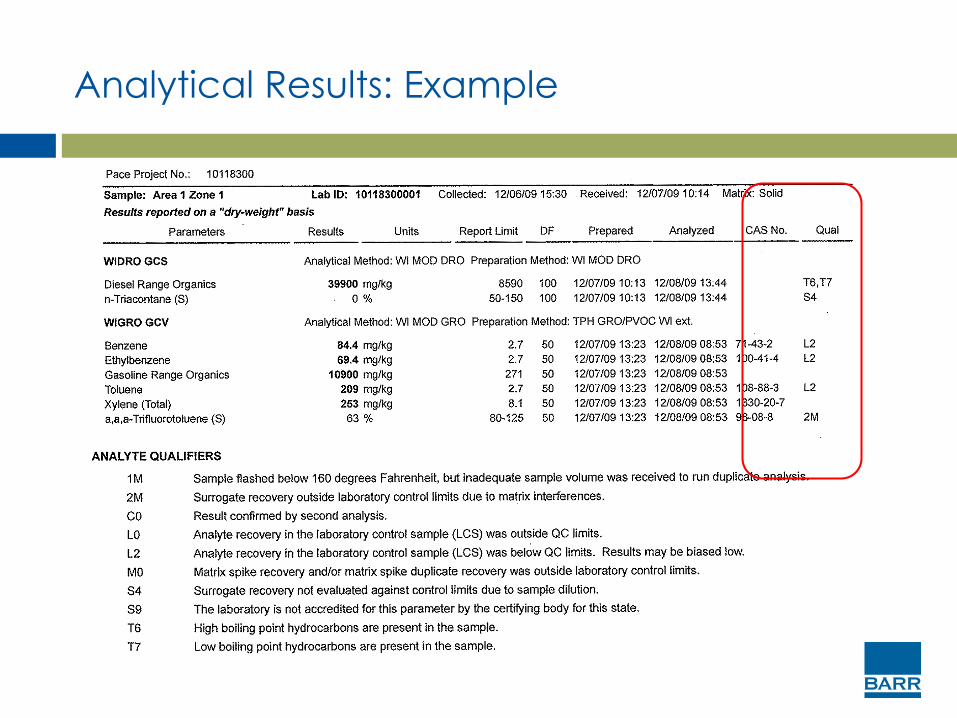
Analytical Results: Lots of Information
• Methodology
• Dates of analysis
• Reporting/detection limits
• Data limitation explanations

Analytical Results: Example

Analytical Results: Example
Analytical Results: Example

Analytical Results: Example

Analytical Results: Example

Analytical Results: Example
Analytical Results: Example

QA/QC Samples: What are they and how do
they apply?

QA/QC Samples
• Laboratory Control Sample
• Matrix Spike
• Method Blank
• Trip Blank
• Field Blank
• Others

QA/QC Samples: Criteria
• Blanks – Any detection above reporting limit is criteria exceedance
• Accuracy Samples – Percent recoveries are used for evaluation
• Precision Samples – Relative percent difference (RPD) used for evaluation

QA/QC Samples: Laboratory Control Sample
• A clean material (matrix dependent) spiked with the parameters of interest in the laboratory
• This sample follows the same process as a standard environmental sample
• What does it tell you?
• Gives indication of laboratory system performance

QA/QC Samples: Laboratory Control Sample

QA/QC Samples: Matrix Spike
• A project sample spiked with the parameters of interest in the laboratory
• This sample follows the same process as a standard environmental sample
• What does it tell you?
• Gives indication of laboratory system performance as well as any affects the sample matrix will have on analysis

QA/QC Samples: Matrix Spike

QA/QC Samples: Method Blank
• A clean sample prepared in the laboratory
• This sample follows the same process as a standard environmental sample
• What does it tell you?
• Gives indication of any contamination present in the laboratory

QA/QC Samples: Method Blank

QA/QC: Other Samples
• Trip blank
• Field blank
• Surrogate standards
• Internal standards
• Initial calibration verification standard
• Continuing calibration verification standard

Other Information: Chain of Custody
Regulatory Program:
Sample
Date
Sample
Time
Sample
Type(C= Comp,
G= Grab) Matrix# of
Cont.
TestAmerica Cedar Falls704 Enterprise Drive
Cedar Falls, IA 50613
phone 319.277.2401 fax 319.277.2425
Project Manager:
Address
Tel/Fax:
Analysis Turnaround Time
Client Contact
Your Company Name here
Date:
Chain of Custody Record
Site Contact:
Filte
red
Sam
ple
( Y
/ N
)
Perf
orm
MS
/ M
SD
(
Y / N
)
Carrier:Lab Contact:
(xxx) xxx-xxxx FAX
Project Name:
TAT if different from Below __________(xxx) xxx-xxxx Phone
City/State/Zip
Sample Identification
Site:
P O #
DW NPDES RCRA Other:
2 weeks
1 week
2 days
1 day
CALENDAR DAYS WORKING DAYS
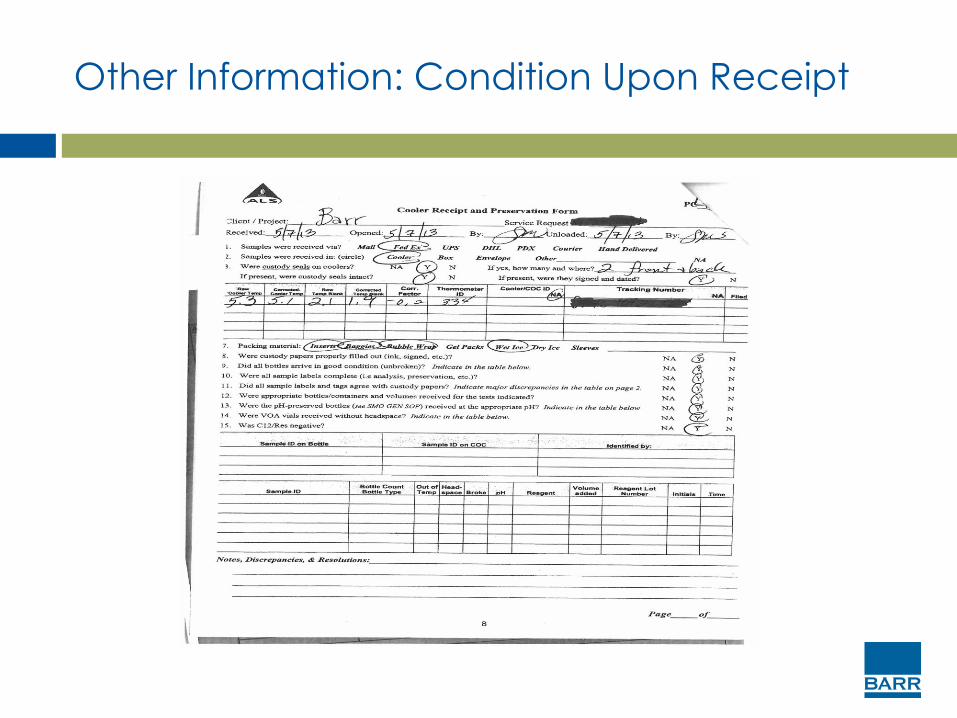
Other Information: Condition Upon Receipt

Other Information: Chromatograms

Summary
• Environmental laboratory reports contain a lot of valuable information
• The case narrative is a valuable summary to read to get the laboratory perspective
• Qualifiers (and other issues)may merit a deeper dive into the analytical data and quality assurance sections
Questions?