Embed Size (px)
Citation preview

Smart Pharma Consulting May 2016 1 How to optimize Mature Brand Performance? - Methodology
Smart Pharma
Consulting
A Rigorous Methodology based on
Smart Pharma Consulting Experience
May 2016
Position Paper
How to optimize
Mature Brand
Performance?
1, rue Houdart de Lamotte – 75015 Paris – France
Tel.: +33 6 11 96 33 78 – Fax: +33 1 45 57 46 59
E-mail: [email protected] – Website: www.smart-pharma.com

Smart Pharma Consulting
Mature Brand Management
May 2016
Table of contents
1. Introduction p. 3
2. Portfolio segmentation and screening p. 4
3. Portfolio strategy p. 9
4. Product leveragability evaluation p. 16
5. Performance monitoring p. 21
6. Conclusions p. 22
How to optimize Mature Brand Performance? - Methodology 2

Smart Pharma Consulting
Sources: Smart Pharma Consulting
1. Introduction
May 2016
Smart Pharma Consulting has developed methodology based on desk research,
benchmarking studies and own experience to optimize mature brands management
Objective & Approach
How to optimize Mature Brand Performance? - Methodology 3
Mature brands play an ambiguous role within the portfolio of pharma companies:
– They show in general low or negative growths while…
– … providing high profit contribution
Performance optimization of mature brands requires to answer the two following
questions:
– What is the sensitivity of the brands to promotional investments?
– If sensitive, what are the optimal investment level and mix?
To help pharma companies, optimize the performance of their mature brands,
Smart Pharma Consulting has formalized a methodology based on:
1. Review of expert reports, articles, position papers on mature brands management
2. Benchmarking studies
3. Its own consulting expertise and experience

Smart Pharma Consulting
Sources: Smart Pharma Consulting Analyses
2. Portfolio segmentation and screening
May 2016
Most companies currently limit strategic thinking on mature products to brands with
limited local potential, with a special focus on corporate non-core brands
Portfolio strategic matrix
How to optimize Mature Brand Performance? - Methodology 4
NO
N-C
OR
E
Glo
ba
l situ
atio
n
Local situation
CO
RE
GLOBAL STARS
LOCAL STARS
QUESTION MARKS
NON-PRIORITY
BRANDS
NON-STRATEGIC STRATEGIC
GLOBAL STARS
Newly launched global brands
Established global brands
with high global and local potential for development
Examples from UCB portfolio:
LOCAL STARS
Established local/global brands
Newly launched local brands
with high potential for development at local level and low/no potential for development at global level
QUESTION MARKS
Newly launched global brands
Established global brands
with high potential for development at global level and low/no potential for development at local level
NON-PRIORITY BRANDS
Established global/local brands
with low global and local potential for development
Mature products scope

Smart Pharma Consulting
Sources: Smart Pharma Consulting Analyses
2. Portfolio segmentation and screening
May 2016
Before selecting “activable” products within mature products portfolio, the screening
scope needs to be clearly defined through portfolio segmentation
Portfolio analysis & mature brands optimization process
How to optimize Mature Brand Performance? - Methodology 5
Sales trends Market trendsProfit trends Regulatory
robustness
Product
competitiveness
Screen 1
Screen 3
Screen 2
Screen 4
Screen 5
Screen 6
Strategic fit with
core products
Maturebrands
~5-10
"activable"
brands
UnfavorableUnfavorable Low Low Low
Favorable Favorable Moderate
to high
Moderate
to high
Moderate
to high
Prune?
Milk?
Activate?
Unfavorable
Favorable
~10-15
pre-
selected
brands
Selection of
“activable” products
Mature products screening, in order to select products eligible for
support, to be further analyzed
2
NO
N-C
OR
EN
ON
NO
N--C
OR
EC
OR
E
Glo
ba
l situ
atio
n
Local situation
CO
RE
CO
RE
CO
RE
GLOBAL STARS
LOCAL STARS
QUESTION MARKS
NON-PRIORITY
BRANDS
NON-PRIORITY
BRANDS
NONNON--STRATEGICSTRATEGIC STRATEGICSTRATEGIC
Mature products scope
Portfolio strategic
segmentation
Marketed products classification and identification of mature
portfolio current and future scope
1
“Activable” products
assessment
in-depth analyses to determine most efficient levers to be activated for the
short-listed mature products
3
Activation
levers1
Target mix2
Media mix3
In-depth analyses
• Client base
• Preferred targets
• Targets sensitivity to promotion
• Preferred medias
• Response to new medias testing
• Seasonality
• Product assets
• Price management
• Distribution
• Promotion

Smart Pharma Consulting
Sources: Smart Pharma Consulting Analyses
2. Portfolio segmentation and screening
May 2016
The selection of "activable" mature products within marketed MAs and “sleeping”
MAs of interest can be made through a 2-step screening process
Selection of "activable" mature products
How to optimize Mature Brand Performance? - Methodology 6
Sales trends Market trends Profit trends Regulatory
risk
Competitive
risk
Screen 1
Screen 3
Screen 2
Screen 4
Screen 5
Screen 6
Strategic fit with
core products
Mature
products
~5-10
"activable"
products
Unfavorable Unfavorable Low Low Low
Favorable Favorable Moderate
to high
Moderate
to high
Moderate
to high
Divest?
Milk?
Promote?
Step 1: Quantitative screening Step 2: Qualitative screening
• Level
• Growth
Contribution to portfolio trends
• Level
• Growth Contribution to
portfolio trends
• Price variations
• Size
• Growth
• % generics
Unfavorable
• Patent
• SmPC
• Guidelines
• Reimbursement
• Market position
• Differentiation
• New comers
• Entry ticket
• Door opening
• Scientific legitimacy
• Prescribers overlap
• Company image and responsibility
Parameter examples
MA = Marketing authorizationSmPC = Summary of product characteristics
Favorable
~10-15
pre-selected
products

Smart Pharma Consulting
Sources: Smart Pharma Consulting Analyses
2. Portfolio segmentation and screening
May 2016
An in-depth analysis of "activable" mature products is then required to determine
most efficient levers to activate selected products
“Activable” products assessment
How to optimize Mature Brand Performance? - Methodology 7
¹ Products with low/no potential at global level and high potential at local level
~10
“activable”
products
Activation
levers 1
Target mix 2
Media mix 3
In-depth analyses
• Client base
• Preferred targets
• Targets sensitivity to promotion
• Preferred medias
• Response to new medias testing
• Seasonality
• Product assets
• Price management
• Distribution
• Promotion
+0
+10 +10
-3 -3
+1
-4
+0
+4
+8
+12
Case 1 Case 2 Case 3
Var. Vs baseline (M€)
Estimated impact of an activation
on sales and profits
3 12 8 Investment Level (M€)
Promote Milk Milk 12 to 24 months projections
assuming activation
Sales
Profits*
* Assumption: gross profit = 90% of sales. Thus, +€ 10M for an investment of € 8M will lead to a profit variation of: (€ 10M x90%) – € 8M = +€ 1M)
Illustrative

Smart Pharma Consulting
Sources: Smart Pharma Consulting Analyses
2. Portfolio segmentation and screening
May 2016
Opportunities usually considered to enhance sales trends at mature products level
merely consist in maximizing the prescriptions per prescriber ratio
Product growth levers
How to optimize Mature Brand Performance? - Methodology 8
¹ Inclusive of the dosage, forms, persistency and waste issues
100200
+20+30+50
Performance 2013 (sales, market share, profit)
Number of prescribers Patients per prescriber Units per patient¹
Price and reimbursement
Product attributes
Distribution
Targeting
Promotional investment
1
2
3
4
5
How could product leverage indications, clinical outcome and positioning to enhance performance?
Can price be optimized and/or reimbursement conditions and listing be improved across portfolio?
Does the company properly leverage all relevant distribution channels?
What are the right prescribers to focus on to optimize portfolio sales trends?
What should be required promotional mix (channels) to facilitate portfolio promotion to selected targets?
Performance 2017 (sales, market share, profit)
Product performance drivers
MATURE PRODUCTS SCOPE OF OPPORTUNITIES

Smart Pharma Consulting
Sources: Smart Pharma Consulting Analyses
3. Portfolio strategy
May 2016
The primary goal of mature products management is to maximize profits, also sales
optimization may come as an immediate second-line objective
Portfolio management objectives
How to optimize Mature Brand Performance? - Methodology 9
¹ Maximizing profit does not necessarily mean maximizing profitability
Sales
Profit
Sales
Profit
Growing products Mature products
Milking may be the obvious response
However,
some products sales may slump dramatically in the absence of promotional support,
thus inducing a rapid drop in profits
Maximizing investment may be the obvious response
However,
some products sales may not soar with an excessive promotional support,
thus inducing a rapid drop in profits
Investment should be regarded first in the light of profit erosion magnitude
Investment should be regarded first in the light of sales enhancement magnitude
Maximize profits¹ Maximize sales
Optimize sales Develop profits
1
2
1
2
Objectives Objectives

Smart Pharma Consulting
Sources: Smart Pharma Consulting Analyses
3. Portfolio strategy
May 2016
Preferred product strategies currently range from limiting generics penetration to
developing product prescriptions
Mature portfolio strategies
Challenges
1. Immediately align prices if a reference price is enforced
2. Convince pharmacists not to increase product substitution1
3. Foster prescriptions transfer to non-genericized forms
How to optimize Mature Brand Performance? - Methodology 10
Genericized
products
De-
reimbursed
products
Other
products
Eligible actions
Limit generics penetration
Minimize sales eligible for
substitution
1. Control and/or enlarge prescriber basis
2. Control and/or develop prescriptions per prescriber
3. Maximize spill-over effect
Limit sales erosion
Develop sales of positive-
trend forms
1. Foster prescriptions transfer to non-genericized forms
2. Maintain prescriptions of de-reimbursed forms with valid MA
3. Prevent delivery switch to high-margin non-listed products
Preserve product
prescriptions
Ensure product is properly
delivered in pharmacies
1 In certain countries such a practice may be considered as illegal
Smart Pharma Consulting
Sources: Smart Pharma Consulting Analyses
3. Portfolio strategy
May 2016
Promotional decisions on selected "activable" mature products should be made in
compliance with precise objectives and management guidelines
Mature products' management – Investment decisions
How to optimize Mature Brand Performance? - Methodology 11
¹ e.g. PR, press, mailing, etc. – ² e.g. franchise strategy – 3 e.g. risk sharing
Option 3
Divest
• Depending on their sales potential over time and their impact on the Affiliate's overall performance, it may be better to renounce retaining some mature brands in the Affiliate's portfolio
• There may be three ways of abandoning a brand:
• Licensing-out activities can be a source of short-term profit, to be weighed with the loss in sales and contribution over time
• Before abandoning brands, the affiliate should also consider potential impact on Franchise image and activity
Market withdrawal
Licensing-out to 3rd party company
1
2
Selling 3
Option 2
Milk
• Before considering any stop in promotion, Affiliates should carefully analyze the risk of creating major discontinuations in brands' trends over time
• Corporate ambition with the brand may also be a major constraint to milking it
• Prior to make any decision, the Affiliate needs thus to carefully analyze brands' potential and sensitivity to promotional investment
Option 1
Promote
• Objectives and guidelines should be set to frame promotional decisions on "activable" mature products:
Continuous support over time
Short-term/iterative support 1
Sales force investment
No sales force investment¹ 2
Internal management
External management3
4
Stand-alone management
Management with core products² 3

Smart Pharma Consulting
Sources: Smart Pharma Consulting Analyses
3. Portfolio strategy
May 2016
The Portfolio Strategy Card has been designed to summarize investment decisions
for the different mature product segments, in one page
“Portfolio Strategy Card”
How to optimize Mature Brand Performance? - Methodology 12
€m (+%)
Portfolio ambition
€m (+%)Sales Profit
Products activated with promotion
•
•
Non-activated products
Key tactics Key tactics
€m (+%)
€m (+%)
Sales
Contrib.
Products activated without promotion
Key tactics
€m (+%)
€m (+%)
Sales
Contrib.
€m (+%)
€m (+%)
Sales
Contrib.
•
•
•
•
• Products can be classified into three categories:
− Products activated with promotion
− Products activated without promotion
− Non-activated products
• Sales and profit objectives are set for the entire portfolio and for each category
• Decisions re. activation levers are summarized per product or product group (incl. packs, if any)
• Targeting and multi-channel approaches are considered transversally (sales force support can also be split between external and internal, if relevant)
• Non-activated products are split into three subgroups:
− Milked products
− Products not launched but which MA is maintained
− Pruned products (licensing-out, cession)
Comments Format

Smart Pharma Consulting
Sources: Smart Pharma Consulting Analyses
3. Portfolio strategy
May 2016
Three different organizations are usually considered to manage mature products at
country level
Organizational models to manage mature products
How to optimize Mature Brand Performance? - Methodology 13
¹ Medical, Regulatory, Human Resources, Administrative and Financial support – ² Contract sales organization
Doted line boxes = shared functions within internal organization
Internal
External
Model 1 Model 2 Model 3
Internal Management External Management Hybrid Management
Director or coordinator
Med Reps
CSO² or 3rd party company
Proper sales force or shared with in-line products
Support functions¹
Director
Product manager(s)
Sales manager
Med Reps
Support functions¹
Director
Product manager(s)
Sales coordinator
Support functions¹
Sales manager
Director
Product manager(s)
Sales manager
Med Reps
Support functions¹
CSO² or 3rd party company
"Nursing"
Smart Pharma Consulting
Sources: Smart Pharma Consulting Analyses
3. Portfolio strategy
May 2016
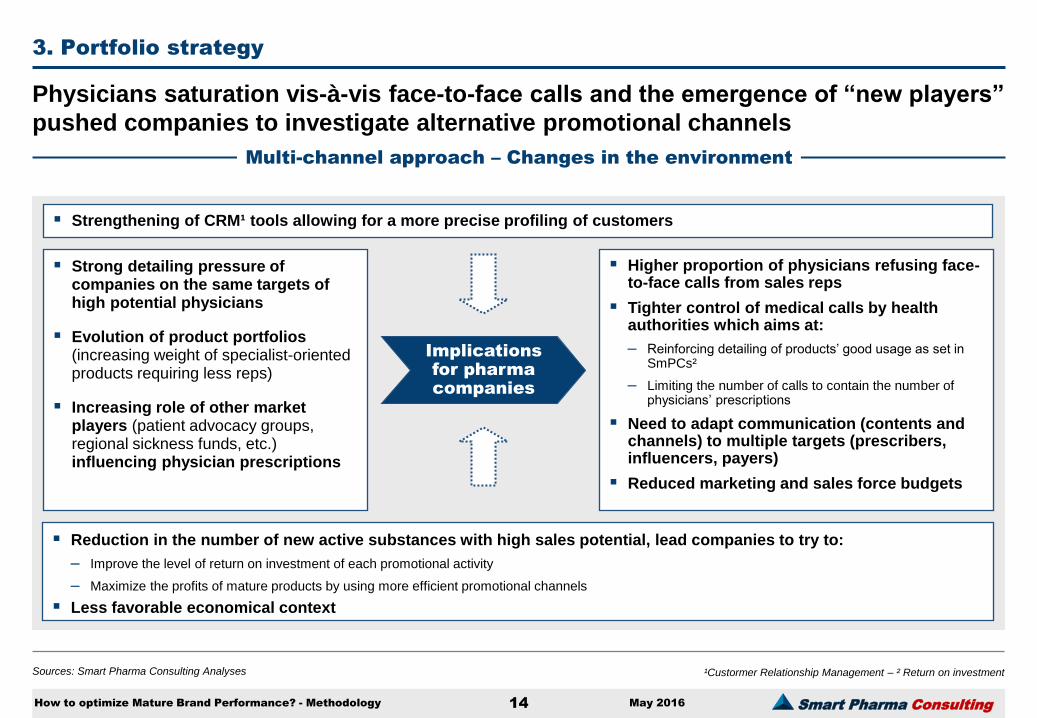
Physicians saturation vis-à-vis face-to-face calls and the emergence of “new players”
pushed companies to investigate alternative promotional channels
Multi-channel approach – Changes in the environment
How to optimize Mature Brand Performance? - Methodology 14
¹Custormer Relationship Management – ² Return on investment
Reduction in the number of new active substances with high sales potential, lead companies to try to:
– Improve the level of return on investment of each promotional activity
– Maximize the profits of mature products by using more efficient promotional channels
Less favorable economical context
Strong detailing pressure of companies on the same targets of high potential physicians
Evolution of product portfolios (increasing weight of specialist-oriented products requiring less reps)
Increasing role of other market players (patient advocacy groups, regional sickness funds, etc.) influencing physician prescriptions
Higher proportion of physicians refusing face-to-face calls from sales reps
Tighter control of medical calls by health authorities which aims at:
– Reinforcing detailing of products’ good usage as set in SmPCs²
– Limiting the number of calls to contain the number of physicians’ prescriptions
Need to adapt communication (contents and channels) to multiple targets (prescribers, influencers, payers)
Reduced marketing and sales force budgets
Implications
for pharma
companies
Strengthening of CRM¹ tools allowing for a more precise profiling of customers

Smart Pharma Consulting
Sources: Smart Pharma Consulting Analyses
3. Portfolio strategy
May 2016
If the impact of an action may be high on an individual basis, the global result may be
limited as the number of clients exposed to the promotional initiative may be too low
Multi-channel approach – Evaluation mix
How to optimize Mature Brand Performance? - Methodology 15
¹ Interactive digital television – ² Continuous medical education – 3 Short message service – 4 Multimedia message service – 5 Including websites and blogs
High Medium Relative cost per effective contact: Low
High Low
Low
High
Face-to-face detailing
Mailings
E-mailings
Scripted e-detailing
Portal-based e-detailing
Press ads
SMS3 – MMS4
Meetings (congresses, symposia)
E-conferences
E-CME²
Relative impact on Brand performance
% o
f to
tal
ph
ys
icia
ns e
xp
ose
d
to
th
e c
ha
nn
el
Medium
Medium
Face-to-face e-detailing (digital tablet)
Remote e-detailing
Phoning
Clinical trials
Web / Web 2.05
Computer ads
TV – IDTV¹
Handovers
Sponsorship / grants
Meetings (round tables,
staff meetings, CMEs2)
Digital channels
Social media Smartphone apps

Smart Pharma Consulting
Sources: Smart Pharma Consulting Analyses
4. Product leveragability evaluation
May 2016
Two different approaches can be considered to measure out the benefit/risk of an
investment variation on “activable” products…
Assessment of product sensitivity to promotion
How to optimize Mature Brand Performance? - Methodology 16
Anticipate expected impact in view of:
Past experience
Propose best guess evaluation (e.g. expected sales and/or market
share variations) +/- pilot test / monitoring method
Benchmarking
Ambitions
Approach n°1
Evaluation of required impact to:
Cover investment
Determine minimal impact (e.g. required sales and/or market
share variations) to break even
Maintain sales levels
Maintain profit levels / ratio
Approach n°2

Smart Pharma Consulting
Sources: Smart Pharma Consulting Analyses
4. Product leveragability evaluation
May 2016
… and up to 4 different methods can be used to quantify the impact of promotional
investment decisions on products sales and profit trends
Methods to evaluate the impact of promotional investment decisions
How to optimize Mature Brand Performance? - Methodology 17
Analogical models
Method 2
Sales Sales
Competitors w/ the action
Product w/o the action
Gap
Historical data analyses
Method 1
Sales
Gap
Action (Year 2)
Year 1
Year 2
Time Testing
Method 4
Sales
Group 1 w/ the action
Group 2 w/o the action
Gap
Deductive reasoning
Method 3
Nbr. of physicians addressed
Etc.
Nature of physicians addressed
Impact measurement grids
Geographies
Nbr. of patients per physician

Smart Pharma Consulting
Sources: Smart Pharma Consulting Analyses
4. Product leveragability evaluation
May 2016
Statistical methods should be considered in view of data availability and the capacity
to isolate a specific action from the overall investment
Statistical methods to measure investment impact
How to optimize Mature Brand Performance? - Methodology 18
Vs. control group (geography) Vs. baseline (time) Vs. benchmark (experience)
Measuring the impact of a congress on invitees prescription behaviors
Examples Measuring product sensitivity to sales
force variations Comparing the performance of products
two different promotional mixes
Applications
• Analyses usually enable to identify an impact (either neutral or positive)…
• … though without allowing any direct mathematical transposition to product overall sales
• Analyses enable to identify an impact (either neutral or positive), on a marginal or general basis (entire investment considered)
• Direct mathematical transposition to product overall sales usually possible
• Analyses enable to say that the performance could have been equal or better with the action
• The direct mathematical transposition to product overall sales may be possible, though with much caution
Methods
• Ad hoc surveys monitoring Rx changes in pre-determined sub-populations
• Panel-based/P&L analyses comparing areas with and without selected action with standard parameters (e.g. sales, sales growth, market share, etc.)
• Ad-hoc surveys monitoring Rx before and after the action
• Panel-based/P&L analyses measuring variations Vs. baseline trends with standard parameters (e.g. sales, sales growth, market share, etc.)
• Ad hoc surveys monitoring Rx changes of both products
• Panel-based analyses measuring performance trends of both products with standard parameters (e.g. sales, sales growth, market share, etc.)
Description
• Analyses comparing product performance in a group / area with the action and a group / area without the action
• Product usually compares to itself in both groups / areas, simultaneously
• Analyses comparing product overall performance with and without the action (no control group), in a sequential way (Y Vs. Y-1, Q Vs. Q-1)
• Product usually compares to itself (intrinsic approach) or to competitors (extrinsic approach)
• Analyses comparing a product performance with a specific action to another product performance in the absence of this action (investment levels and marketing mixes need to be quite homogeneous, exclusive of this specific action)
Methods 1 & 2 Historical data analyses
Analogical models

Smart Pharma Consulting
Sources: Smart Pharma Consulting Analyses
4. Product leveragability evaluation
May 2016
Logical grids objective is to anticipate the likelihood of a breakeven / significant
positive impact of an action, through a step by step approach
Impact evaluation grids
How to optimize Mature Brand Performance? - Methodology 19
Method 3 Deductive reasoning
Comments
• Impact evaluation grids aim at measuring the impact of an action, while going through logical steps, e.g.:
% of physicians to be accessed with the action
% of physicians accepting to participate into the action
% of physicians convinced by the action
Physicians weight in total product sales before action
Performance trends change among physicians changing their behavior (gain either in terms of market share or sales growth)
Related sales gain after action at local / national level
Action cost
Net result
• Most parameters would need to be populated via ad hoc surveys, however, the beforehand evaluation of expected impact without those ad hoc surveys can also be an excellent means to properly calibrate an action
• Impact evaluation grids should be used for major actions only
Volume modeling grid - 1
Assumptions
Investment decision
Starting year 2008
Starting month February 1
500
3 500
2 000 000
800
457
% customers
changing
behaviour
Peak volume
gain / loss per
customer
Time to peak
impact (number
of months)
Expected
impact80% 50 18
Results
MonthsLinear
projection
Logarithmic
projection
Adjusted
projection
1 2 5
2 4 10
3 7 15
4 9 19
5 11 22
6 13 25
7 16 27
8 18 29
9 20 30
10 22 32
11 24 33
12 27 34
13 29 35
14 31 37
15 33 37
16 36 38
17 38 39
18 40 40
19 42 41
20 44 41
21 47 42
22 49 43
23 51 43
24 53 44
25 56 45
26 58 45
27 60 46
28 62 46
29 64 47
30 67 47
31 69 48
32 71 48
33 73 48
34 76 49
35 78 49
36 80 50
Linear
projection
Logarithmic
projection
Adjusted
projection
Linear
projection
Logarithmic
projection
Adjusted
projection
Year trend 400 000 400 000 400 000 Year trend 2 000 000 2 000 000 2 000 000
Full Year 1 486 667 540 700 400 000 Full Year 1 2 086 667 2 140 700 2 000 000
Full Year 2 646 667 640 782 400 000 Full Year 2 2 246 667 2 240 782 2 000 000
Full Year 3 806 667 683 251 400 000 Full Year 3 2 406 667 2 283 251 2 000 000
2008 473 333 523 506 400 000 2008 2 073 333 2 123 506 2 000 000
2009 633 333 635 986 400 000 2009 2 233 333 2 235 986 2 000 000
2010 793 333 680 445 400 000 2010 2 393 333 2 280 445 2 000 000
2008 10,00
2009 10,00
2010 10,00
2008 20 733 333 21 235 058 20 000 000
2009 22 333 333 22 359 860 20 000 000
2010 23 933 333 22 804 449 20 000 000
Increase investment by +20%
Selected customers
Other customers
Selected customers
Product events
considered
beyond
promotion
Market events
considered
beyond
promotion
Rationale to
investment
decision
impact on
sales
Price in euros
Sales in euros
Total customers
Average volume per customer
and per year
Total volume in selected customers Total volume in all customers
Total annual volume before action (year trend)
0
10
20
30
40
50
60
70
80
90
1 3 5 7 9
11
13
15
17
19
21
23
25
27
29
31
33
35

Smart Pharma Consulting
Sources: Smart Pharma Consulting Analyses
4. Product leveragability evaluation
May 2016
Logical reasoning should ideally be complemented with testing, when a priori
evaluation seems to be favorable, to verify action efficiency
Testing of the impact of invitations to congresses in selected territories
How to optimize Mature Brand Performance? - Methodology 20
Method 4
-12%
-10%
-8%
-6%
-4%
-2%
+0%
+2%
-8 -6 -4 -2 +0 +2 +4 +6 +8
Sales evolution (vs. same period of Year n-1)
Investment variation in K€
= Territory size (in K€)
Territories where
action started
Comments
• Sales evolution should be measured for a specific period of time
• Period calibration is the most difficult part of the exercise, and should take into account:
− Action pre-launch (e.g. formal invitation by Reps for a congress)
− Action own time (e.g. congress date)
− Action monitoring (e.g. Reps visit to get physicians feedback)
• Action impact is usually measured either instantly or up to 3 months after action initiation, for mature products
• There is no need to measure out systematically the impact of stopping the action; however, if territories are vacant or action did stop for any reason, it might also be interesting to consider them into the analysis
Territories where
action was never done
Territories where action stopped
Testing
Smart Pharma Consulting
Sources: Smart Pharma Consulting Analyses
5. Performance monitoring
May 2016
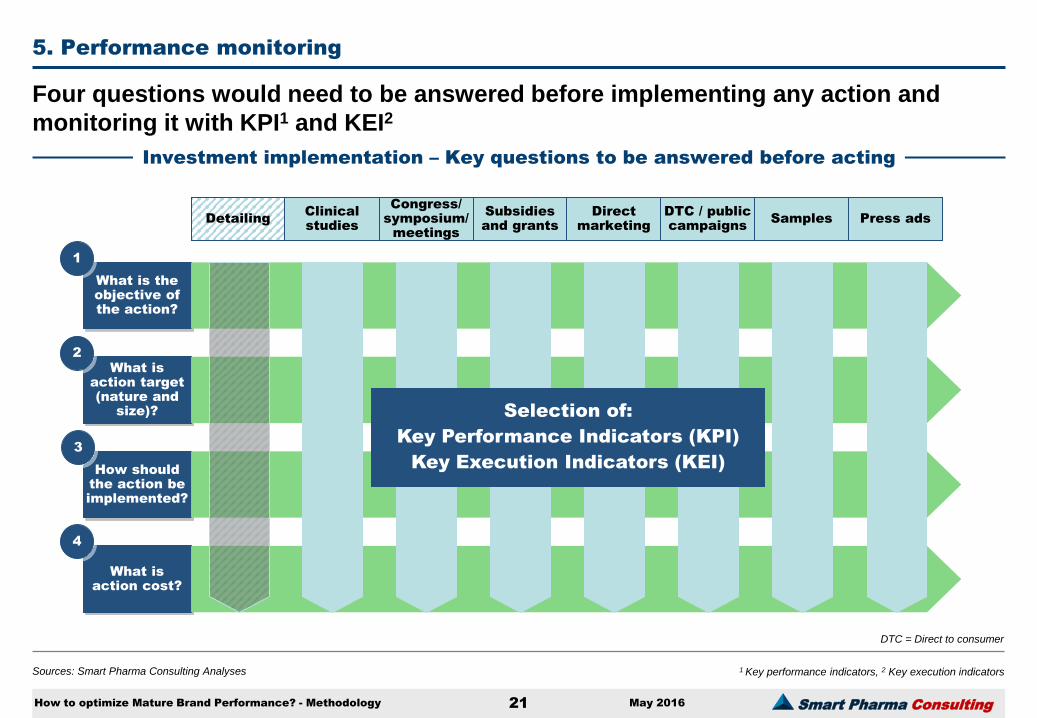
Four questions would need to be answered before implementing any action and
monitoring it with KPI1 and KEI2
Investment implementation – Key questions to be answered before acting
How to optimize Mature Brand Performance? - Methodology 21
1 Key performance indicators, 2 Key execution indicators
What is the
objective of
the action?
What is
action target
(nature and
size)?
How should
the action be
implemented?
What is
action cost?
1
2
3
4
Detailing Clinical
studies
Congress/
symposium/
meetings
Subsidies
and grants
Direct
marketing
DTC / public
campaigns Samples
Selection of:
Key Performance Indicators (KPI)
Key Execution Indicators (KEI)
Press ads
DTC = Direct to consumer

Smart Pharma Consulting
Sources: Smart Pharma Consulting Analyses
6. Conclusions
May 2016 How to optimize Mature Brand Performance? - Methodology 22
General recommendations
Mature brands representing as much as 30% to 50% of certain big pharma total sales and
60% to 70% of their profit contribution, performance optimization should become for them a
strategic priority
The opportunity of optimization should be assessed brand by brand and country by country (e.g. Branded generics competition like in Eastern European countries have a totally different impact on
original brands compared the one observed with unbranded generics like in Western European countries)
Decision to invest in promotion should be supported by cost-efficient market studies and
analyses, rather than intuitive considerations, as it is too often the case
When mature brands have shown to be sensitive to promotion, the level of effort should
demonstrate an impact on performance, at national level
Targeted physicians should include only moderate and high prescribers of the mature brand (the primary objective been to remind them about the brand and not to convince them. After 15 to 20 years in
the market it, is too late to convince non and low prescribers)
If HCPs are increasingly embracing digital technology, it is far to be a panacea
Pharma companies, such as Pfizer or Novartis are structured to tackle their mature portfolio
strategy head-on, via cross-functional lifecycle management teams or dedicated business units

Smart Pharma Consulting
Sources: Smart Pharma Consulting Analyses
6. Conclusions
May 2016 How to optimize Mature Brand Performance? - Methodology 23
Four Key Success Factors
1. Mature products should be recognized by the corporate management committee as a key
strategic lever
2. Mature products franchises or BUs should be set-up at national level (to better address
local specificities), while remaining lean and agile, capitalizing as much as possible on
shared support functions (i.e. finance, manufacturing, supply, regulatory, legal, BD, medical,
commercial, etc.)
3. Collaborators in charge of managing mature products should: be experienced, have no
preconceived idea, have an entrepreneurial mindset and be able to mobilize support
functions throughout the company
4. Decision-making processes should be fact-based with a permanent double valuation at
global and local levels so that trade-off analysis can be carried-out

Smart Pharma Consulting
1, rue Houdart de Lamotte – 75015 Paris – France • Tel.: +33 6 11 96 33 78 • Fax: +33 1 45 57 46 59 • E-mail: [email protected] • Website: www.smart-pharma.com
Consulting company dedicated to the pharmaceutical sector operating in the complementary domains of strategy, management and organization
Smart Pharma Consulting
Core capabilities
Strategy 1
Assessing the attractiveness of markets (Hospital / retail innovative products - Vaccines - OTC - Generics)
Growth strategy
Optimization of marketing / sales investments
Development of a company in the hospital market Business
Valuation for acquisition
Portfolio / franchise assessment
Extension of product life cycle performance
Improvement mature products performance
Adaptation of price strategy
Defense strategies vs. new entrants
Competitive strategies in the hospital market
Strategic partnerships companies / pharmacies
Rethink of operational units organization
Improvement of sales force effectiveness
Improvement of the distribution channels covering the hospital and retail markets
Development of a strategic planning process
Organization 3
Organization
Facilitation and structuring of strategic thinking for multidisciplinary product teams
Key challenges identification
Strategic options formalization
Resource allocation optimization program
Training of marketing and market research teams to sales forecast techniques (modeling and scenarios development)
Development and implementation of a "coaching program" for area managers
Sales reps coaching
Regional action plans roll-out
Development and implementation of a "sales techniques program" for sales forces (STAR1)
Management 2
1 Sales Techniques Application for Results (training courser