Embed Size (px)
Citation preview
How to Lie with Statistics
March 3, 2020 Data Science CSCI 1951A
Brown University Instructor: Ellie Pavlick
HTAs: Josh Levin, Diane Mutako, Sol Zitter

Announcements

Today
• Linear Regression Recap/Follow up
• P-Hacking, Researcher Degrees of Freedom

Today
• Linear Regression Recap/Follow up
• P-Hacking, Researcher Degrees of Freedom

Dummy Variables
20 31 0 1 1 20 5 0 1 1 20 40 0 1 1 25 18 1 0 1
X =
cholesterol meds
eucalyptus
yes breakfast
no breakfast
constant
why do we have to do this? what
about pseudo-inverse?

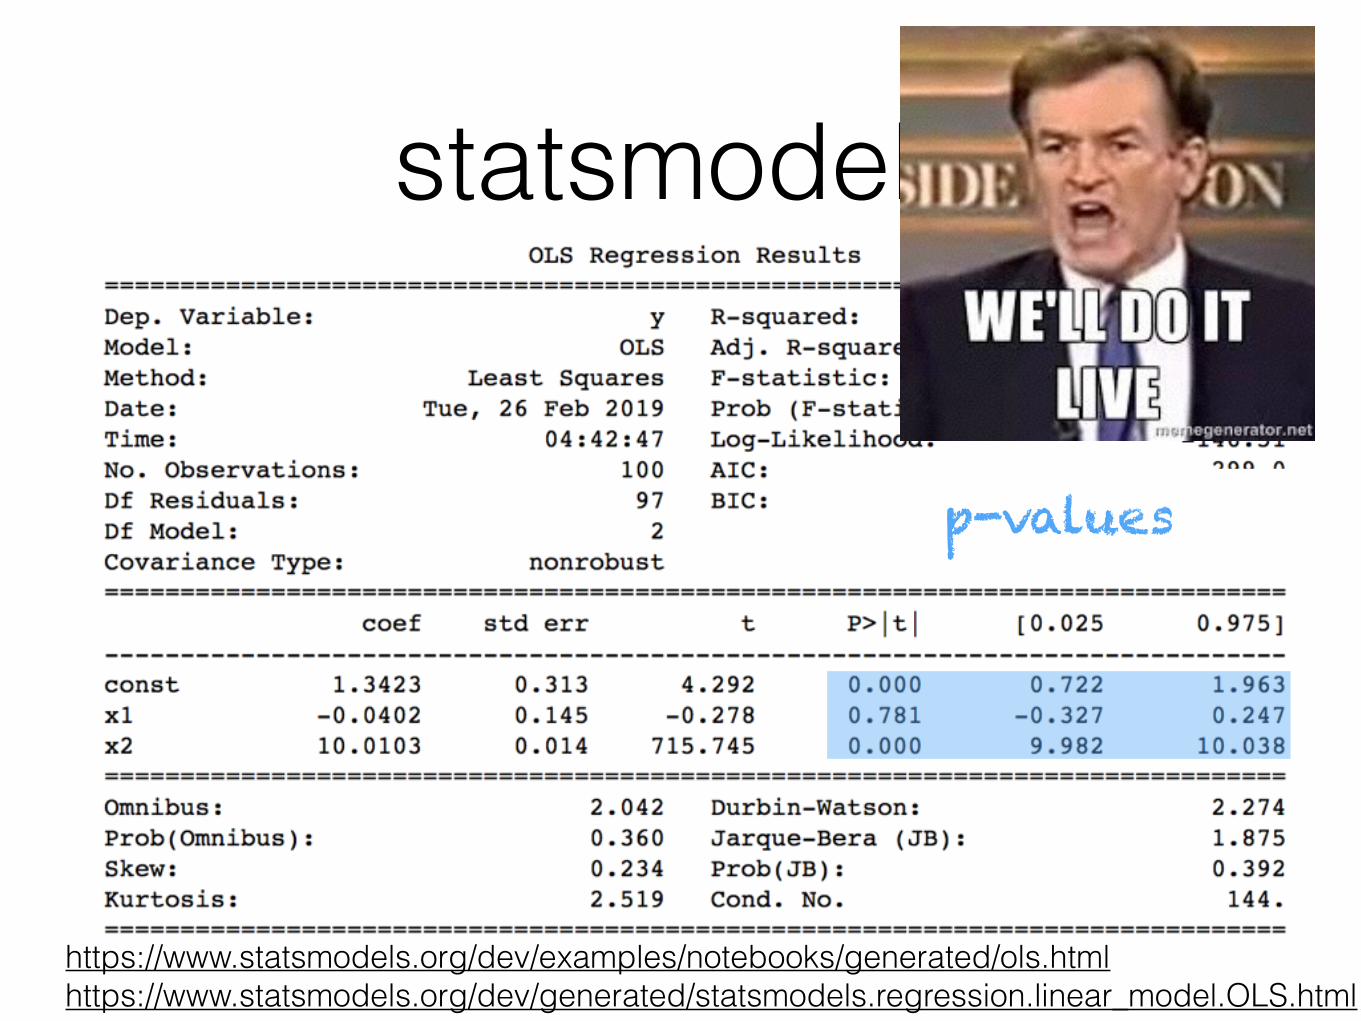
statsmodels
https://www.statsmodels.org/dev/examples/notebooks/generated/ols.html https://www.statsmodels.org/dev/generated/statsmodels.regression.linear_model.OLS.html
import statsmodels.api as sm
y, X = read_data() X = sm.add_constant(X) model = sm.OLS(y, X) results = model.fit() print(results.summary())
statsmodels
https://www.statsmodels.org/dev/examples/notebooks/generated/ols.html https://www.statsmodels.org/dev/generated/statsmodels.regression.linear_model.OLS.html
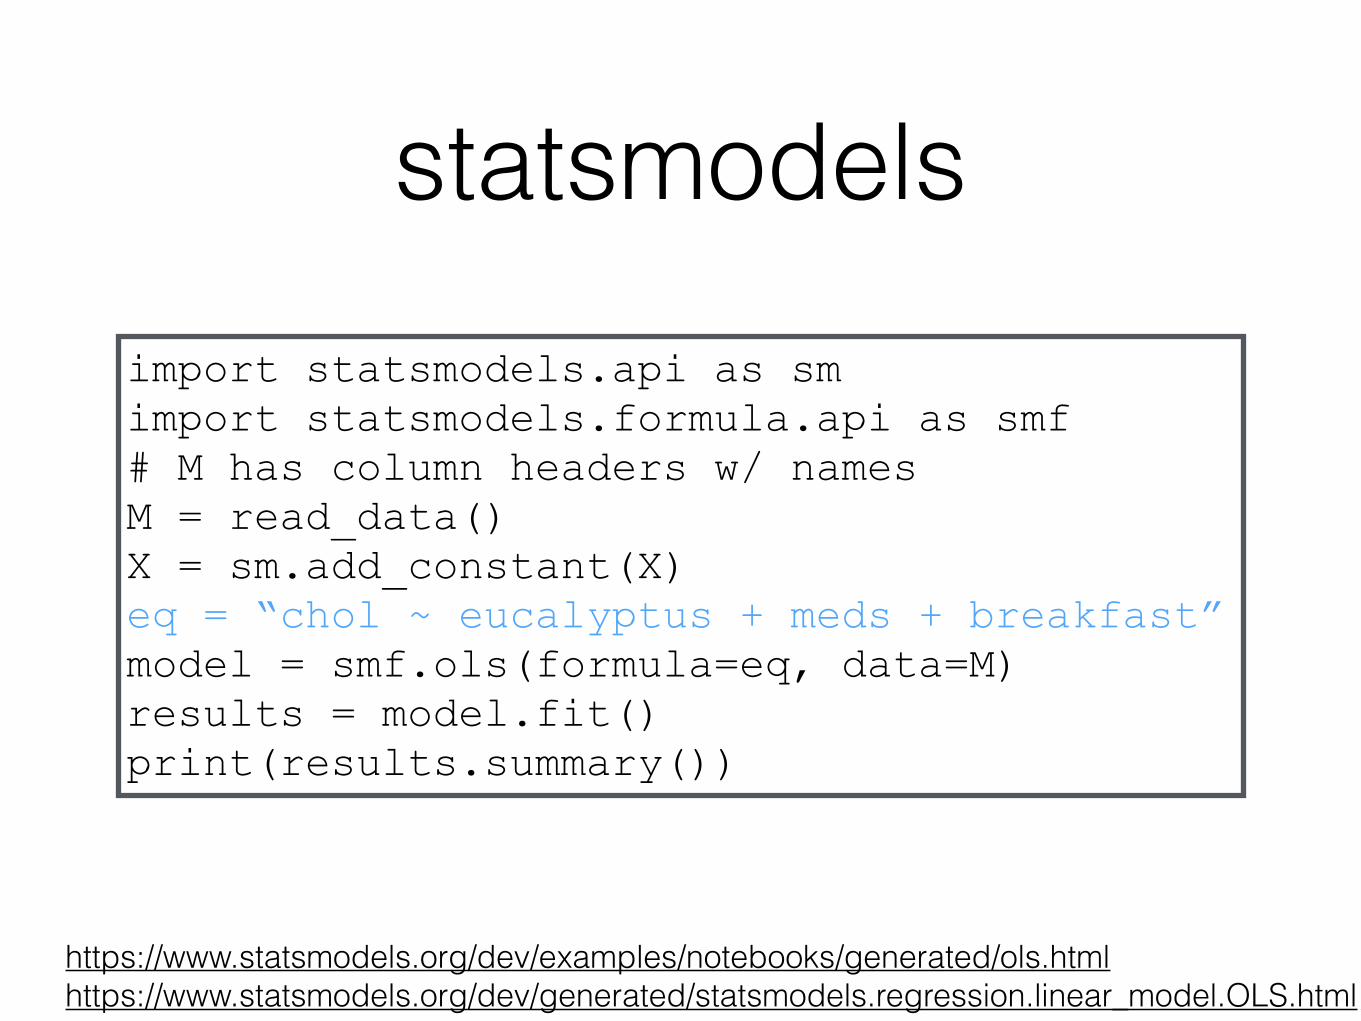
import statsmodels.api as sm import statsmodels.formula.api as smf # M has column headers w/ names M = read_data() X = sm.add_constant(X) eq = “chol ~ eucalyptus + meds + breakfast” model = smf.ols(formula=eq, data=M) results = model.fit() print(results.summary())
statsmodels
https://www.statsmodels.org/dev/examples/notebooks/generated/ols.html https://www.statsmodels.org/dev/generated/statsmodels.regression.linear_model.OLS.html
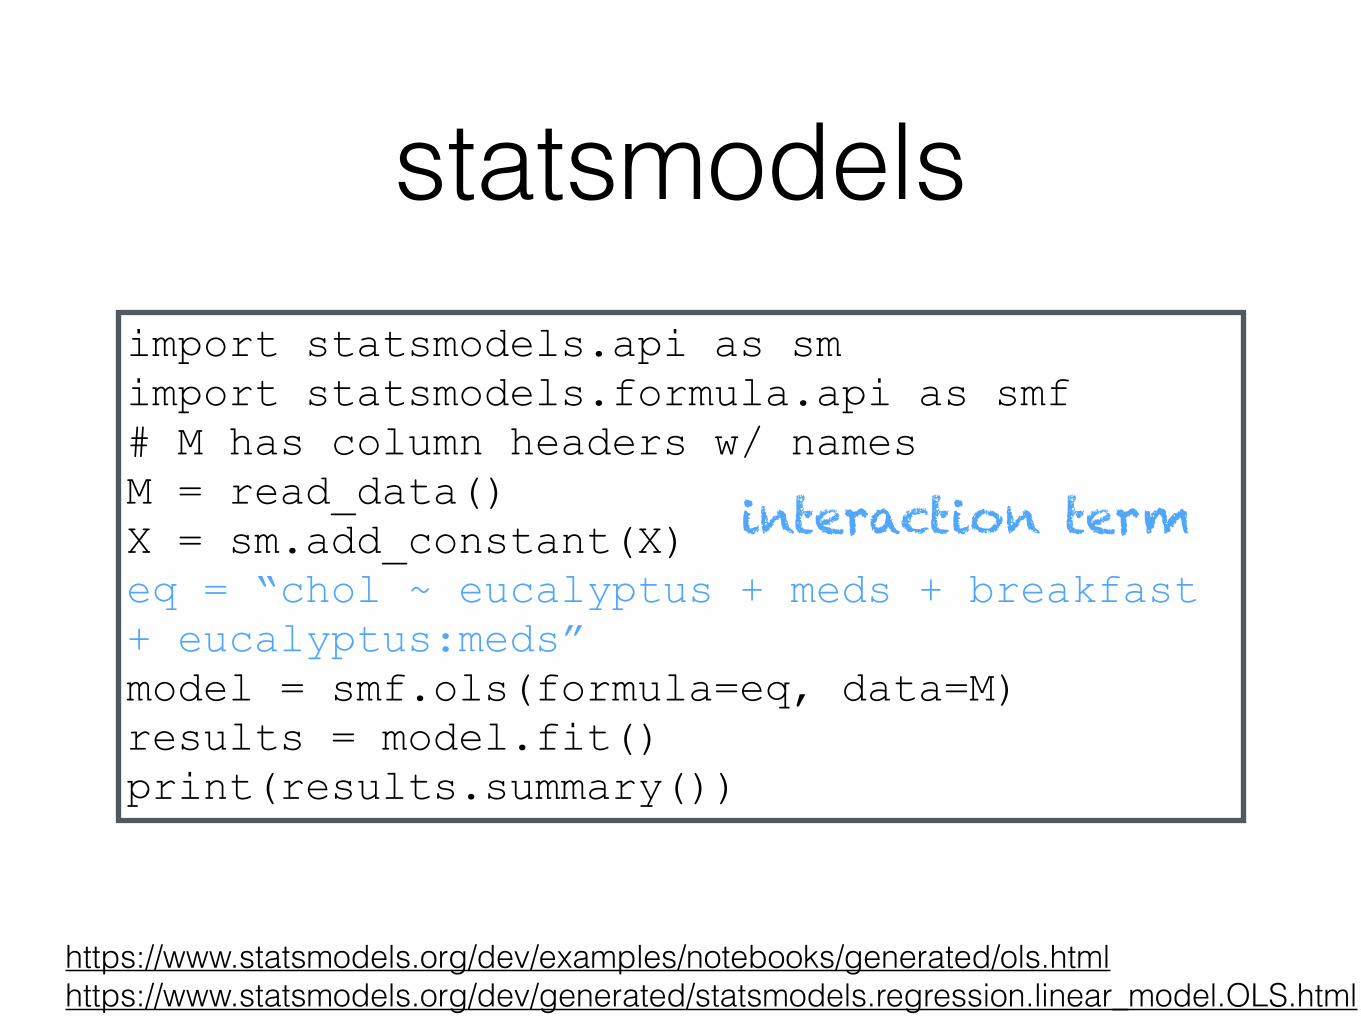
import statsmodels.api as sm import statsmodels.formula.api as smf # M has column headers w/ names M = read_data() X = sm.add_constant(X) eq = “chol ~ eucalyptus + meds + breakfast + eucalyptus:meds” model = smf.ols(formula=eq, data=M) results = model.fit() print(results.summary())
interaction term
statsmodels
https://www.statsmodels.org/dev/examples/notebooks/generated/ols.html https://www.statsmodels.org/dev/generated/statsmodels.regression.linear_model.OLS.html
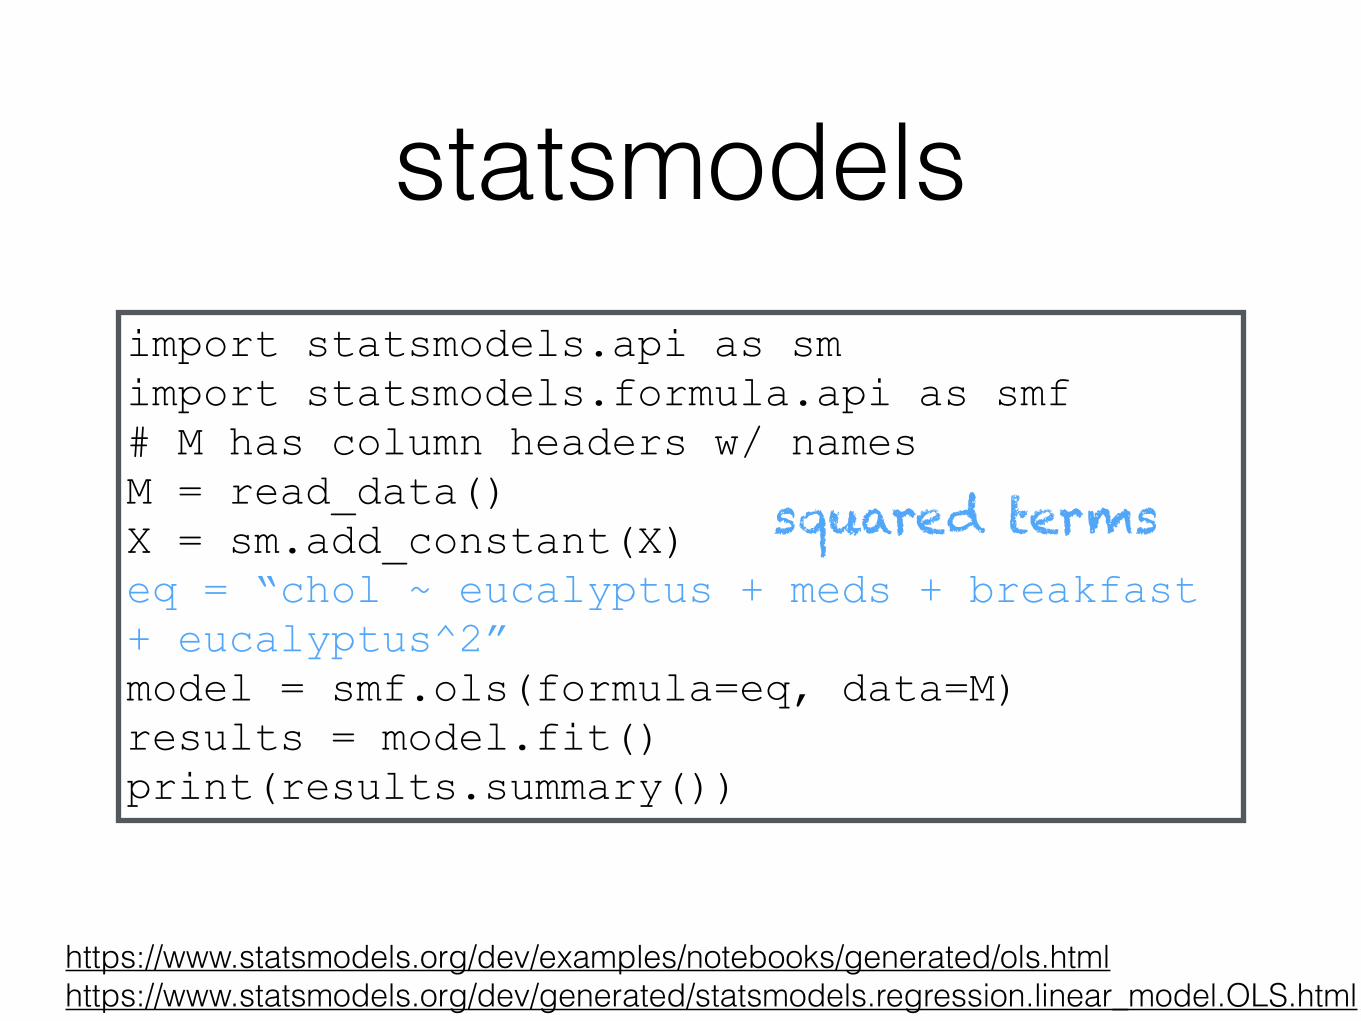
import statsmodels.api as sm import statsmodels.formula.api as smf # M has column headers w/ names M = read_data() X = sm.add_constant(X) eq = “chol ~ eucalyptus + meds + breakfast + eucalyptus^2” model = smf.ols(formula=eq, data=M) results = model.fit() print(results.summary())
squared terms

statsmodels
https://www.statsmodels.org/dev/examples/notebooks/generated/ols.html https://www.statsmodels.org/dev/generated/statsmodels.regression.linear_model.OLS.html

statsmodels
https://www.statsmodels.org/dev/examples/notebooks/generated/ols.html https://www.statsmodels.org/dev/generated/statsmodels.regression.linear_model.OLS.html
overall fit of model (SSE)

statsmodels
https://www.statsmodels.org/dev/examples/notebooks/generated/ols.html https://www.statsmodels.org/dev/generated/statsmodels.regression.linear_model.OLS.html
coefficients (i.e. effect sizes)

statsmodels
https://www.statsmodels.org/dev/examples/notebooks/generated/ols.html https://www.statsmodels.org/dev/generated/statsmodels.regression.linear_model.OLS.html
p-values
statsmodels
https://www.statsmodels.org/dev/examples/notebooks/generated/ols.html https://www.statsmodels.org/dev/generated/statsmodels.regression.linear_model.OLS.html
p-values

Clicker Question!

Today
• Linear Regression Recap/Follow up
• P-Hacking, Researcher Degrees of Freedom
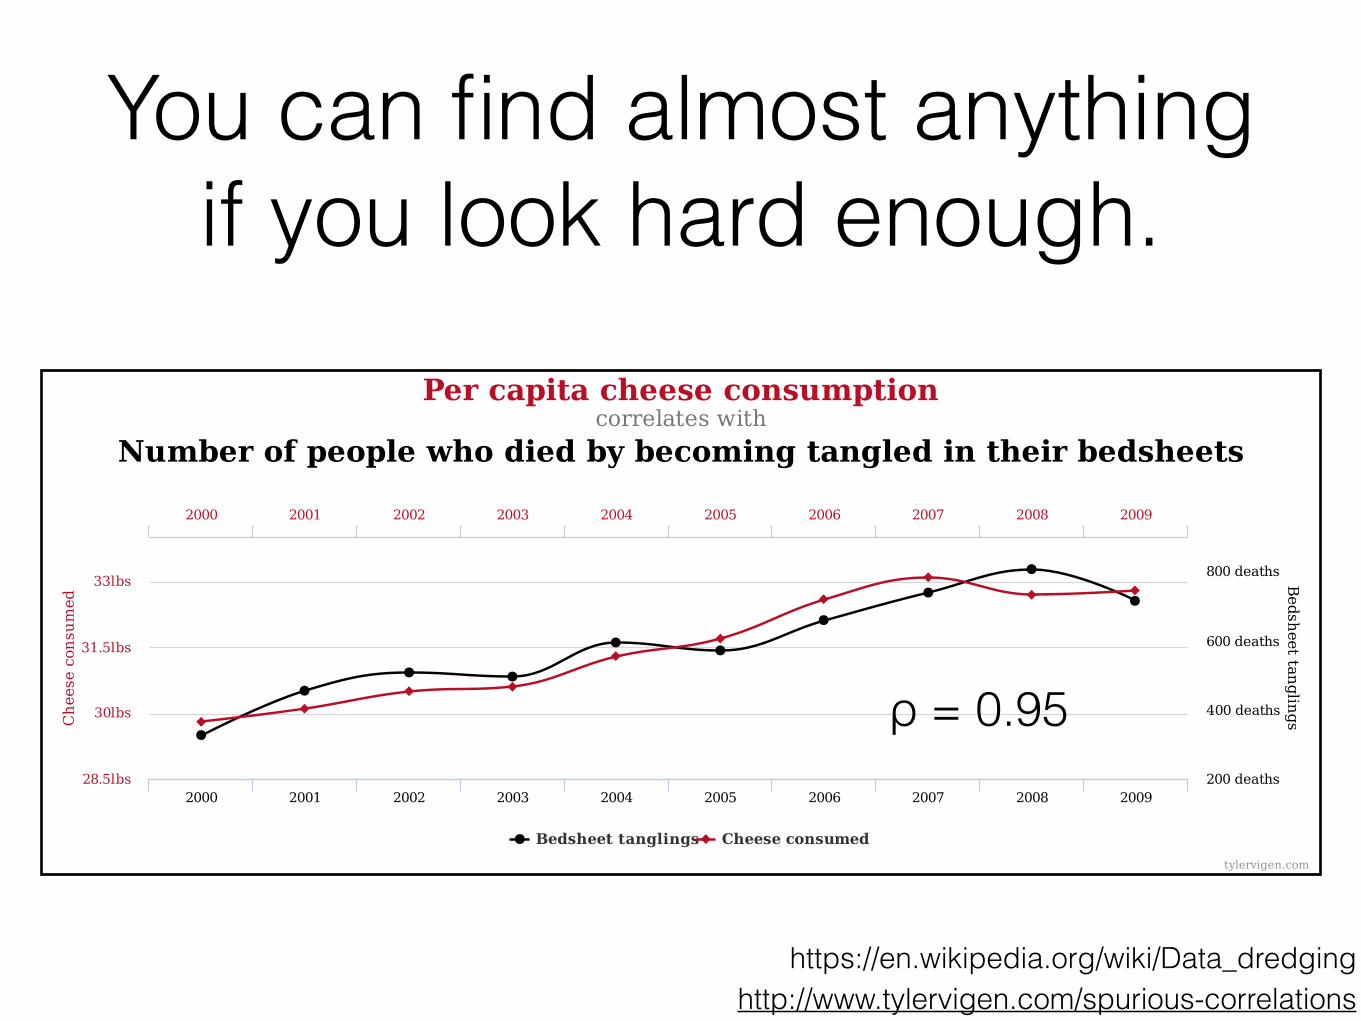
You can find almost anything if you look hard enough.
Bedsheetta
nglin
gsC
heeseconsumed
Percapitacheeseconsumptioncorrelateswith
Numberofpeoplewhodiedbybecomingtangledintheirbedsheets
Bedsheettanglings Cheeseconsumed
2000 2001 2002 2003 2004 2005 2006 2007 2008 2009
2000 2001 2002 2003 2004 2005 2006 2007 2008 2009
200deaths
400deaths
600deaths
800deaths
28.5lbs
30lbs
31.5lbs
33lbs
tylervigen.com
ρ = 0.95
https://en.wikipedia.org/wiki/Data_dredging http://www.tylervigen.com/spurious-correlations
Neural correlates of interspecies perspective taking in the post-mortem Atlantic Salmon:
An argument for multiple comparisons correction
Craig M. Bennett1, Abigail A. Baird2, Michael B. Miller1, and George L. Wolford3
1 Psychology Department, University of California Santa Barbara, Santa Barbara, CA; 2 Department of Psychology, Vassar College, Poughkeepsie, NY;
3 Department of Psychological & Brain Sciences, Dartmouth College, Hanover, NH
INTRODUCTION
With the extreme dimensionality of functional neuroimaging data comes
extreme risk for false positives. Across the 130,000 voxels in a typical fMRI
volume the probability of a false positive is almost certain. Correction for
multiple comparisons should be completed with these datasets, but is often
ignored by investigators. To illustrate the magnitude of the problem we
carried out a real experiment that demonstrates the danger of not correcting
for chance properly.
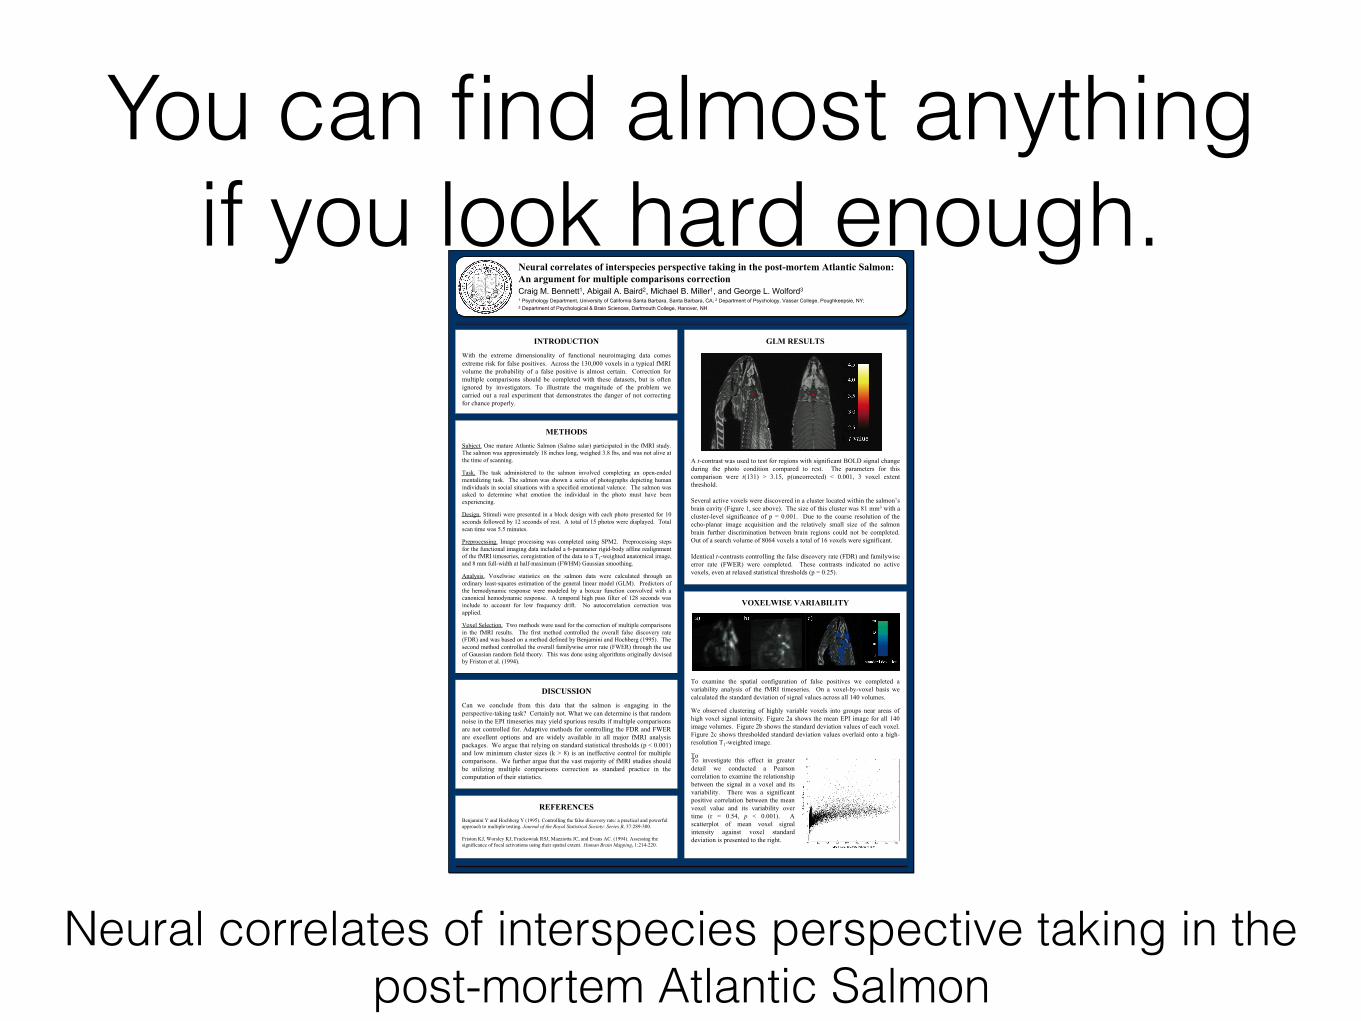
GLM RESULTS
A t-contrast was used to test for regions with significant BOLD signal change
during the photo condition compared to rest. The parameters for this
comparison were t(131) > 3.15, p(uncorrected) < 0.001, 3 voxel extent
threshold.
Several active voxels were discovered in a cluster located within the salmon’s
brain cavity (Figure 1, see above). The size of this cluster was 81 mm3 with a
cluster-level significance of p = 0.001. Due to the coarse resolution of the
echo-planar image acquisition and the relatively small size of the salmon
brain further discrimination between brain regions could not be completed.
Out of a search volume of 8064 voxels a total of 16 voxels were significant.
Identical t-contrasts controlling the false discovery rate (FDR) and familywise
error rate (FWER) were completed. These contrasts indicated no active
voxels, even at relaxed statistical thresholds (p = 0.25).
METHODS
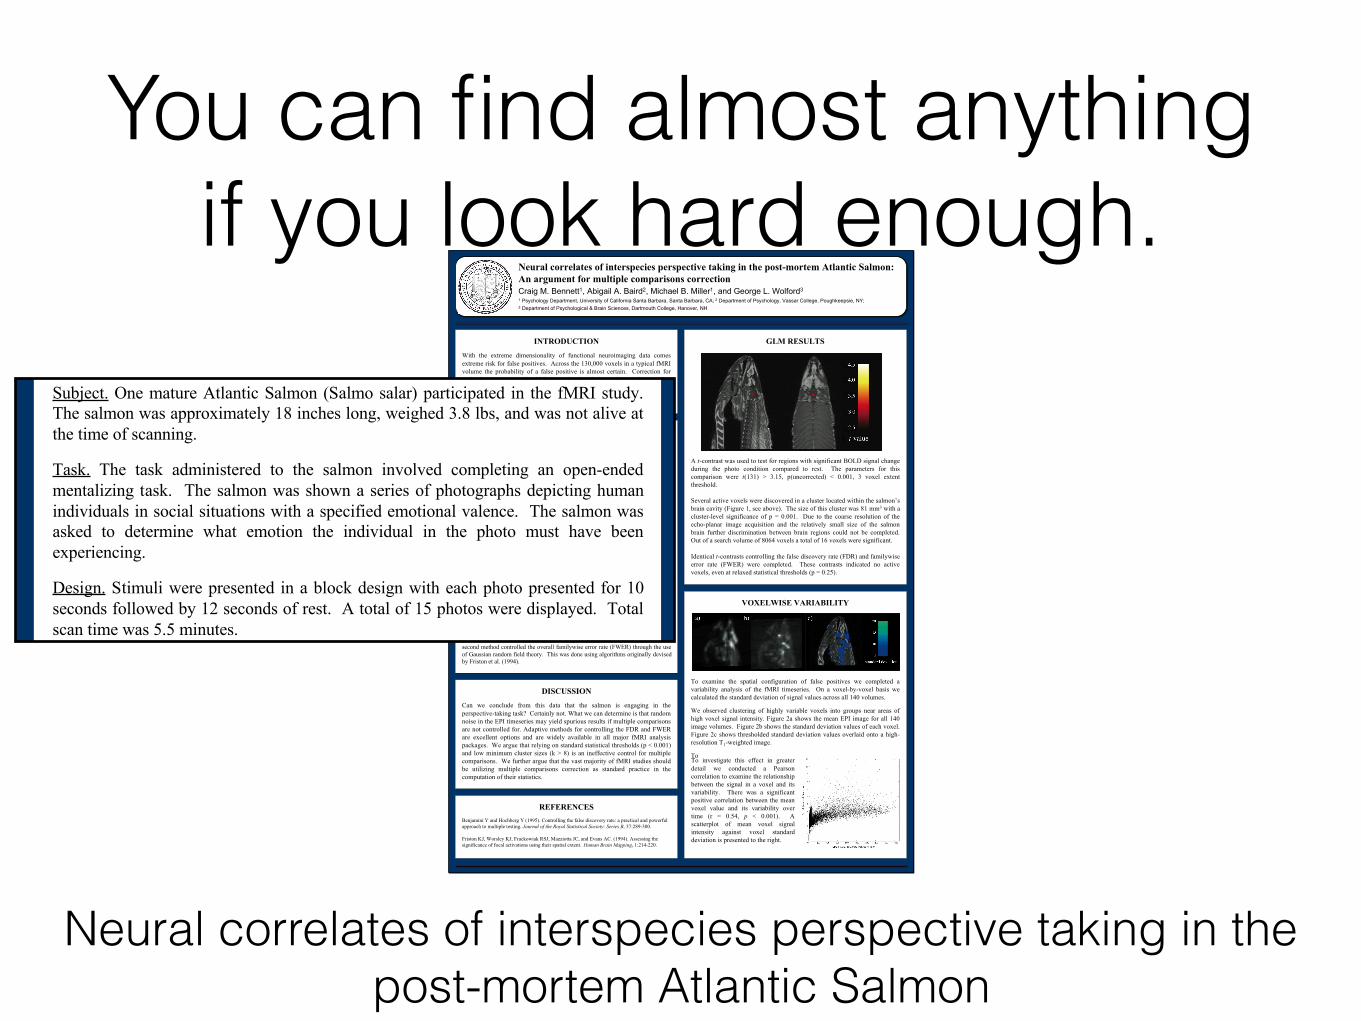
Subject. One mature Atlantic Salmon (Salmo salar) participated in the fMRI study.
The salmon was approximately 18 inches long, weighed 3.8 lbs, and was not alive at
the time of scanning.
Task. The task administered to the salmon involved completing an open-ended
mentalizing task. The salmon was shown a series of photographs depicting human
individuals in social situations with a specified emotional valence. The salmon was
asked to determine what emotion the individual in the photo must have been
experiencing.
Design. Stimuli were presented in a block design with each photo presented for 10
seconds followed by 12 seconds of rest. A total of 15 photos were displayed. Total
scan time was 5.5 minutes.
Preprocessing. Image processing was completed using SPM2. Preprocessing steps
for the functional imaging data included a 6-parameter rigid-body affine realignment
of the fMRI timeseries, coregistration of the data to a T1-weighted anatomical image,
and 8 mm full-width at half-maximum (FWHM) Gaussian smoothing.
Analysis. Voxelwise statistics on the salmon data were calculated through an
ordinary least-squares estimation of the general linear model (GLM). Predictors of
the hemodynamic response were modeled by a boxcar function convolved with a
canonical hemodynamic response. A temporal high pass filter of 128 seconds was
include to account for low frequency drift. No autocorrelation correction was
applied.
Voxel Selection. Two methods were used for the correction of multiple comparisons
in the fMRI results. The first method controlled the overall false discovery rate
(FDR) and was based on a method defined by Benjamini and Hochberg (1995). The
second method controlled the overall familywise error rate (FWER) through the use
of Gaussian random field theory. This was done using algorithms originally devised
by Friston et al. (1994).
DISCUSSION
Can we conclude from this data that the salmon is engaging in the
perspective-taking task? Certainly not. What we can determine is that random
noise in the EPI timeseries may yield spurious results if multiple comparisons
are not controlled for. Adaptive methods for controlling the FDR and FWER
are excellent options and are widely available in all major fMRI analysis
packages. We argue that relying on standard statistical thresholds (p < 0.001)
and low minimum cluster sizes (k > 8) is an ineffective control for multiple
comparisons. We further argue that the vast majority of fMRI studies should
be utilizing multiple comparisons correction as standard practice in the
computation of their statistics.
VOXELWISE VARIABILITY
To examine the spatial configuration of false positives we completed a
variability analysis of the fMRI timeseries. On a voxel-by-voxel basis we
calculated the standard deviation of signal values across all 140 volumes.
We observed clustering of highly variable voxels into groups near areas of
high voxel signal intensity. Figure 2a shows the mean EPI image for all 140
image volumes. Figure 2b shows the standard deviation values of each voxel.
Figure 2c shows thresholded standard deviation values overlaid onto a high-
resolution T1-weighted image.
ToTo investigate this effect in greater
detail we conducted a Pearson
correlation to examine the relationship
between the signal in a voxel and its
variability. There was a significant
positive correlation between the mean
voxel value and its variability over
time (r = 0.54, p < 0.001). A
scatterplot of mean voxel signal
intensity against voxel standard
deviation is presented to the right.
REFERENCES
Benjamini Y and Hochberg Y (1995). Controlling the false discovery rate: a practical and powerful
approach to multiple testing. Journal of the Royal Statistical Society: Series B, 57:289-300.
Friston KJ, Worsley KJ, Frackowiak RSJ, Mazziotta JC, and Evans AC. (1994). Assessing the
significance of focal activations using their spatial extent. Human Brain Mapping, 1:214-220.
Neural correlates of interspecies perspective taking in the post-mortem Atlantic Salmon
You can find almost anything if you look hard enough.
Neural correlates of interspecies perspective taking in the post-mortem Atlantic Salmon:
An argument for multiple comparisons correction
Craig M. Bennett1, Abigail A. Baird2, Michael B. Miller1, and George L. Wolford3
1 Psychology Department, University of California Santa Barbara, Santa Barbara, CA; 2 Department of Psychology, Vassar College, Poughkeepsie, NY;
3 Department of Psychological & Brain Sciences, Dartmouth College, Hanover, NH
INTRODUCTION
With the extreme dimensionality of functional neuroimaging data comes
extreme risk for false positives. Across the 130,000 voxels in a typical fMRI
volume the probability of a false positive is almost certain. Correction for
multiple comparisons should be completed with these datasets, but is often
ignored by investigators. To illustrate the magnitude of the problem we
carried out a real experiment that demonstrates the danger of not correcting
for chance properly.
GLM RESULTS
A t-contrast was used to test for regions with significant BOLD signal change
during the photo condition compared to rest. The parameters for this
comparison were t(131) > 3.15, p(uncorrected) < 0.001, 3 voxel extent
threshold.
Several active voxels were discovered in a cluster located within the salmon’s
brain cavity (Figure 1, see above). The size of this cluster was 81 mm3 with a
cluster-level significance of p = 0.001. Due to the coarse resolution of the
echo-planar image acquisition and the relatively small size of the salmon
brain further discrimination between brain regions could not be completed.
Out of a search volume of 8064 voxels a total of 16 voxels were significant.
Identical t-contrasts controlling the false discovery rate (FDR) and familywise
error rate (FWER) were completed. These contrasts indicated no active
voxels, even at relaxed statistical thresholds (p = 0.25).
METHODS
Subject. One mature Atlantic Salmon (Salmo salar) participated in the fMRI study.
The salmon was approximately 18 inches long, weighed 3.8 lbs, and was not alive at
the time of scanning.
Task. The task administered to the salmon involved completing an open-ended
mentalizing task. The salmon was shown a series of photographs depicting human
individuals in social situations with a specified emotional valence. The salmon was
asked to determine what emotion the individual in the photo must have been
experiencing.
Design. Stimuli were presented in a block design with each photo presented for 10
seconds followed by 12 seconds of rest. A total of 15 photos were displayed. Total
scan time was 5.5 minutes.
Preprocessing. Image processing was completed using SPM2. Preprocessing steps
for the functional imaging data included a 6-parameter rigid-body affine realignment
of the fMRI timeseries, coregistration of the data to a T1-weighted anatomical image,
and 8 mm full-width at half-maximum (FWHM) Gaussian smoothing.
Analysis. Voxelwise statistics on the salmon data were calculated through an
ordinary least-squares estimation of the general linear model (GLM). Predictors of
the hemodynamic response were modeled by a boxcar function convolved with a
canonical hemodynamic response. A temporal high pass filter of 128 seconds was
include to account for low frequency drift. No autocorrelation correction was
applied.
Voxel Selection. Two methods were used for the correction of multiple comparisons
in the fMRI results. The first method controlled the overall false discovery rate
(FDR) and was based on a method defined by Benjamini and Hochberg (1995). The
second method controlled the overall familywise error rate (FWER) through the use
of Gaussian random field theory. This was done using algorithms originally devised
by Friston et al. (1994).
DISCUSSION
Can we conclude from this data that the salmon is engaging in the
perspective-taking task? Certainly not. What we can determine is that random
noise in the EPI timeseries may yield spurious results if multiple comparisons
are not controlled for. Adaptive methods for controlling the FDR and FWER
are excellent options and are widely available in all major fMRI analysis
packages. We argue that relying on standard statistical thresholds (p < 0.001)
and low minimum cluster sizes (k > 8) is an ineffective control for multiple
comparisons. We further argue that the vast majority of fMRI studies should
be utilizing multiple comparisons correction as standard practice in the
computation of their statistics.
VOXELWISE VARIABILITY
To examine the spatial configuration of false positives we completed a
variability analysis of the fMRI timeseries. On a voxel-by-voxel basis we
calculated the standard deviation of signal values across all 140 volumes.
We observed clustering of highly variable voxels into groups near areas of
high voxel signal intensity. Figure 2a shows the mean EPI image for all 140
image volumes. Figure 2b shows the standard deviation values of each voxel.
Figure 2c shows thresholded standard deviation values overlaid onto a high-
resolution T1-weighted image.
ToTo investigate this effect in greater
detail we conducted a Pearson
correlation to examine the relationship
between the signal in a voxel and its
variability. There was a significant
positive correlation between the mean
voxel value and its variability over
time (r = 0.54, p < 0.001). A
scatterplot of mean voxel signal
intensity against voxel standard
deviation is presented to the right.
REFERENCES
Benjamini Y and Hochberg Y (1995). Controlling the false discovery rate: a practical and powerful
approach to multiple testing. Journal of the Royal Statistical Society: Series B, 57:289-300.
Friston KJ, Worsley KJ, Frackowiak RSJ, Mazziotta JC, and Evans AC. (1994). Assessing the
significance of focal activations using their spatial extent. Human Brain Mapping, 1:214-220.
Neural correlates of interspecies perspective taking in the post-mortem Atlantic Salmon
Neural correlates of interspecies perspective taking in the post-mortem Atlantic Salmon:
An argument for multiple comparisons correction
Craig M. Bennett1, Abigail A. Baird2, Michael B. Miller1, and George L. Wolford3
1 Psychology Department, University of California Santa Barbara, Santa Barbara, CA; 2 Department of Psychology, Vassar College, Poughkeepsie, NY;
3 Department of Psychological & Brain Sciences, Dartmouth College, Hanover, NH
INTRODUCTION
With the extreme dimensionality of functional neuroimaging data comes
extreme risk for false positives. Across the 130,000 voxels in a typical fMRI
volume the probability of a false positive is almost certain. Correction for
multiple comparisons should be completed with these datasets, but is often
ignored by investigators. To illustrate the magnitude of the problem we
carried out a real experiment that demonstrates the danger of not correcting
for chance properly.
GLM RESULTS
A t-contrast was used to test for regions with significant BOLD signal change
during the photo condition compared to rest. The parameters for this
comparison were t(131) > 3.15, p(uncorrected) < 0.001, 3 voxel extent
threshold.
Several active voxels were discovered in a cluster located within the salmon’s
brain cavity (Figure 1, see above). The size of this cluster was 81 mm3 with a
cluster-level significance of p = 0.001. Due to the coarse resolution of the
echo-planar image acquisition and the relatively small size of the salmon
brain further discrimination between brain regions could not be completed.
Out of a search volume of 8064 voxels a total of 16 voxels were significant.
Identical t-contrasts controlling the false discovery rate (FDR) and familywise
error rate (FWER) were completed. These contrasts indicated no active
voxels, even at relaxed statistical thresholds (p = 0.25).
METHODS
Subject. One mature Atlantic Salmon (Salmo salar) participated in the fMRI study.
The salmon was approximately 18 inches long, weighed 3.8 lbs, and was not alive at
the time of scanning.
Task. The task administered to the salmon involved completing an open-ended
mentalizing task. The salmon was shown a series of photographs depicting human
individuals in social situations with a specified emotional valence. The salmon was
asked to determine what emotion the individual in the photo must have been
experiencing.
Design. Stimuli were presented in a block design with each photo presented for 10
seconds followed by 12 seconds of rest. A total of 15 photos were displayed. Total
scan time was 5.5 minutes.
Preprocessing. Image processing was completed using SPM2. Preprocessing steps
for the functional imaging data included a 6-parameter rigid-body affine realignment
of the fMRI timeseries, coregistration of the data to a T1-weighted anatomical image,
and 8 mm full-width at half-maximum (FWHM) Gaussian smoothing.
Analysis. Voxelwise statistics on the salmon data were calculated through an
ordinary least-squares estimation of the general linear model (GLM). Predictors of
the hemodynamic response were modeled by a boxcar function convolved with a
canonical hemodynamic response. A temporal high pass filter of 128 seconds was
include to account for low frequency drift. No autocorrelation correction was
applied.
Voxel Selection. Two methods were used for the correction of multiple comparisons
in the fMRI results. The first method controlled the overall false discovery rate
(FDR) and was based on a method defined by Benjamini and Hochberg (1995). The
second method controlled the overall familywise error rate (FWER) through the use
of Gaussian random field theory. This was done using algorithms originally devised
by Friston et al. (1994).
DISCUSSION
Can we conclude from this data that the salmon is engaging in the
perspective-taking task? Certainly not. What we can determine is that random
noise in the EPI timeseries may yield spurious results if multiple comparisons
are not controlled for. Adaptive methods for controlling the FDR and FWER
are excellent options and are widely available in all major fMRI analysis
packages. We argue that relying on standard statistical thresholds (p < 0.001)
and low minimum cluster sizes (k > 8) is an ineffective control for multiple
comparisons. We further argue that the vast majority of fMRI studies should
be utilizing multiple comparisons correction as standard practice in the
computation of their statistics.
VOXELWISE VARIABILITY
To examine the spatial configuration of false positives we completed a
variability analysis of the fMRI timeseries. On a voxel-by-voxel basis we
calculated the standard deviation of signal values across all 140 volumes.
We observed clustering of highly variable voxels into groups near areas of
high voxel signal intensity. Figure 2a shows the mean EPI image for all 140
image volumes. Figure 2b shows the standard deviation values of each voxel.
Figure 2c shows thresholded standard deviation values overlaid onto a high-
resolution T1-weighted image.
ToTo investigate this effect in greater
detail we conducted a Pearson
correlation to examine the relationship
between the signal in a voxel and its
variability. There was a significant
positive correlation between the mean
voxel value and its variability over
time (r = 0.54, p < 0.001). A
scatterplot of mean voxel signal
intensity against voxel standard
deviation is presented to the right.
REFERENCES
Benjamini Y and Hochberg Y (1995). Controlling the false discovery rate: a practical and powerful
approach to multiple testing. Journal of the Royal Statistical Society: Series B, 57:289-300.
Friston KJ, Worsley KJ, Frackowiak RSJ, Mazziotta JC, and Evans AC. (1994). Assessing the
significance of focal activations using their spatial extent. Human Brain Mapping, 1:214-220.
You can find almost anything if you look hard enough.

Neural correlates of interspecies perspective taking in the post-mortem Atlantic Salmon:
An argument for multiple comparisons correction
Craig M. Bennett1, Abigail A. Baird2, Michael B. Miller1, and George L. Wolford3
1 Psychology Department, University of California Santa Barbara, Santa Barbara, CA; 2 Department of Psychology, Vassar College, Poughkeepsie, NY;
3 Department of Psychological & Brain Sciences, Dartmouth College, Hanover, NH
INTRODUCTION
With the extreme dimensionality of functional neuroimaging data comes
extreme risk for false positives. Across the 130,000 voxels in a typical fMRI
volume the probability of a false positive is almost certain. Correction for
multiple comparisons should be completed with these datasets, but is often
ignored by investigators. To illustrate the magnitude of the problem we
carried out a real experiment that demonstrates the danger of not correcting
for chance properly.
GLM RESULTS
A t-contrast was used to test for regions with significant BOLD signal change
during the photo condition compared to rest. The parameters for this
comparison were t(131) > 3.15, p(uncorrected) < 0.001, 3 voxel extent
threshold.
Several active voxels were discovered in a cluster located within the salmon’s
brain cavity (Figure 1, see above). The size of this cluster was 81 mm3 with a
cluster-level significance of p = 0.001. Due to the coarse resolution of the
echo-planar image acquisition and the relatively small size of the salmon
brain further discrimination between brain regions could not be completed.
Out of a search volume of 8064 voxels a total of 16 voxels were significant.
Identical t-contrasts controlling the false discovery rate (FDR) and familywise
error rate (FWER) were completed. These contrasts indicated no active
voxels, even at relaxed statistical thresholds (p = 0.25).
METHODS
Subject. One mature Atlantic Salmon (Salmo salar) participated in the fMRI study.
The salmon was approximately 18 inches long, weighed 3.8 lbs, and was not alive at
the time of scanning.
Task. The task administered to the salmon involved completing an open-ended
mentalizing task. The salmon was shown a series of photographs depicting human
individuals in social situations with a specified emotional valence. The salmon was
asked to determine what emotion the individual in the photo must have been
experiencing.
Design. Stimuli were presented in a block design with each photo presented for 10
seconds followed by 12 seconds of rest. A total of 15 photos were displayed. Total
scan time was 5.5 minutes.
Preprocessing. Image processing was completed using SPM2. Preprocessing steps
for the functional imaging data included a 6-parameter rigid-body affine realignment
of the fMRI timeseries, coregistration of the data to a T1-weighted anatomical image,
and 8 mm full-width at half-maximum (FWHM) Gaussian smoothing.
Analysis. Voxelwise statistics on the salmon data were calculated through an
ordinary least-squares estimation of the general linear model (GLM). Predictors of
the hemodynamic response were modeled by a boxcar function convolved with a
canonical hemodynamic response. A temporal high pass filter of 128 seconds was
include to account for low frequency drift. No autocorrelation correction was
applied.
Voxel Selection. Two methods were used for the correction of multiple comparisons
in the fMRI results. The first method controlled the overall false discovery rate
(FDR) and was based on a method defined by Benjamini and Hochberg (1995). The
second method controlled the overall familywise error rate (FWER) through the use
of Gaussian random field theory. This was done using algorithms originally devised
by Friston et al. (1994).
DISCUSSION
Can we conclude from this data that the salmon is engaging in the
perspective-taking task? Certainly not. What we can determine is that random
noise in the EPI timeseries may yield spurious results if multiple comparisons
are not controlled for. Adaptive methods for controlling the FDR and FWER
are excellent options and are widely available in all major fMRI analysis
packages. We argue that relying on standard statistical thresholds (p < 0.001)
and low minimum cluster sizes (k > 8) is an ineffective control for multiple
comparisons. We further argue that the vast majority of fMRI studies should
be utilizing multiple comparisons correction as standard practice in the
computation of their statistics.
VOXELWISE VARIABILITY
To examine the spatial configuration of false positives we completed a
variability analysis of the fMRI timeseries. On a voxel-by-voxel basis we
calculated the standard deviation of signal values across all 140 volumes.
We observed clustering of highly variable voxels into groups near areas of
high voxel signal intensity. Figure 2a shows the mean EPI image for all 140
image volumes. Figure 2b shows the standard deviation values of each voxel.
Figure 2c shows thresholded standard deviation values overlaid onto a high-
resolution T1-weighted image.
ToTo investigate this effect in greater
detail we conducted a Pearson
correlation to examine the relationship
between the signal in a voxel and its
variability. There was a significant
positive correlation between the mean
voxel value and its variability over
time (r = 0.54, p < 0.001). A
scatterplot of mean voxel signal
intensity against voxel standard
deviation is presented to the right.
REFERENCES
Benjamini Y and Hochberg Y (1995). Controlling the false discovery rate: a practical and powerful
approach to multiple testing. Journal of the Royal Statistical Society: Series B, 57:289-300.
Friston KJ, Worsley KJ, Frackowiak RSJ, Mazziotta JC, and Evans AC. (1994). Assessing the
significance of focal activations using their spatial extent. Human Brain Mapping, 1:214-220.
Neural correlates of interspecies perspective taking in the post-mortem Atlantic Salmon
Neural correlates of interspecies perspective taking in the post-mortem Atlantic Salmon:
An argument for multiple comparisons correction
Craig M. Bennett1, Abigail A. Baird2, Michael B. Miller1, and George L. Wolford3
1 Psychology Department, University of California Santa Barbara, Santa Barbara, CA; 2 Department of Psychology, Vassar College, Poughkeepsie, NY;
3 Department of Psychological & Brain Sciences, Dartmouth College, Hanover, NH
INTRODUCTION
With the extreme dimensionality of functional neuroimaging data comes
extreme risk for false positives. Across the 130,000 voxels in a typical fMRI
volume the probability of a false positive is almost certain. Correction for
multiple comparisons should be completed with these datasets, but is often
ignored by investigators. To illustrate the magnitude of the problem we
carried out a real experiment that demonstrates the danger of not correcting
for chance properly.
GLM RESULTS
A t-contrast was used to test for regions with significant BOLD signal change
during the photo condition compared to rest. The parameters for this
comparison were t(131) > 3.15, p(uncorrected) < 0.001, 3 voxel extent
threshold.
Several active voxels were discovered in a cluster located within the salmon’s
brain cavity (Figure 1, see above). The size of this cluster was 81 mm3 with a
cluster-level significance of p = 0.001. Due to the coarse resolution of the
echo-planar image acquisition and the relatively small size of the salmon
brain further discrimination between brain regions could not be completed.
Out of a search volume of 8064 voxels a total of 16 voxels were significant.
Identical t-contrasts controlling the false discovery rate (FDR) and familywise
error rate (FWER) were completed. These contrasts indicated no active
voxels, even at relaxed statistical thresholds (p = 0.25).
METHODS
Subject. One mature Atlantic Salmon (Salmo salar) participated in the fMRI study.
The salmon was approximately 18 inches long, weighed 3.8 lbs, and was not alive at
the time of scanning.
Task. The task administered to the salmon involved completing an open-ended
mentalizing task. The salmon was shown a series of photographs depicting human
individuals in social situations with a specified emotional valence. The salmon was
asked to determine what emotion the individual in the photo must have been
experiencing.
Design. Stimuli were presented in a block design with each photo presented for 10
seconds followed by 12 seconds of rest. A total of 15 photos were displayed. Total
scan time was 5.5 minutes.
Preprocessing. Image processing was completed using SPM2. Preprocessing steps
for the functional imaging data included a 6-parameter rigid-body affine realignment
of the fMRI timeseries, coregistration of the data to a T1-weighted anatomical image,
and 8 mm full-width at half-maximum (FWHM) Gaussian smoothing.
Analysis. Voxelwise statistics on the salmon data were calculated through an
ordinary least-squares estimation of the general linear model (GLM). Predictors of
the hemodynamic response were modeled by a boxcar function convolved with a
canonical hemodynamic response. A temporal high pass filter of 128 seconds was
include to account for low frequency drift. No autocorrelation correction was
applied.
Voxel Selection. Two methods were used for the correction of multiple comparisons
in the fMRI results. The first method controlled the overall false discovery rate
(FDR) and was based on a method defined by Benjamini and Hochberg (1995). The
second method controlled the overall familywise error rate (FWER) through the use
of Gaussian random field theory. This was done using algorithms originally devised
by Friston et al. (1994).
DISCUSSION
Can we conclude from this data that the salmon is engaging in the
perspective-taking task? Certainly not. What we can determine is that random
noise in the EPI timeseries may yield spurious results if multiple comparisons
are not controlled for. Adaptive methods for controlling the FDR and FWER
are excellent options and are widely available in all major fMRI analysis
packages. We argue that relying on standard statistical thresholds (p < 0.001)
and low minimum cluster sizes (k > 8) is an ineffective control for multiple
comparisons. We further argue that the vast majority of fMRI studies should
be utilizing multiple comparisons correction as standard practice in the
computation of their statistics.
VOXELWISE VARIABILITY
To examine the spatial configuration of false positives we completed a
variability analysis of the fMRI timeseries. On a voxel-by-voxel basis we
calculated the standard deviation of signal values across all 140 volumes.
We observed clustering of highly variable voxels into groups near areas of
high voxel signal intensity. Figure 2a shows the mean EPI image for all 140
image volumes. Figure 2b shows the standard deviation values of each voxel.
Figure 2c shows thresholded standard deviation values overlaid onto a high-
resolution T1-weighted image.
ToTo investigate this effect in greater
detail we conducted a Pearson
correlation to examine the relationship
between the signal in a voxel and its
variability. There was a significant
positive correlation between the mean
voxel value and its variability over
time (r = 0.54, p < 0.001). A
scatterplot of mean voxel signal
intensity against voxel standard
deviation is presented to the right.
REFERENCES
Benjamini Y and Hochberg Y (1995). Controlling the false discovery rate: a practical and powerful
approach to multiple testing. Journal of the Royal Statistical Society: Series B, 57:289-300.
Friston KJ, Worsley KJ, Frackowiak RSJ, Mazziotta JC, and Evans AC. (1994). Assessing the
significance of focal activations using their spatial extent. Human Brain Mapping, 1:214-220.
You can find almost anything if you look hard enough.

0
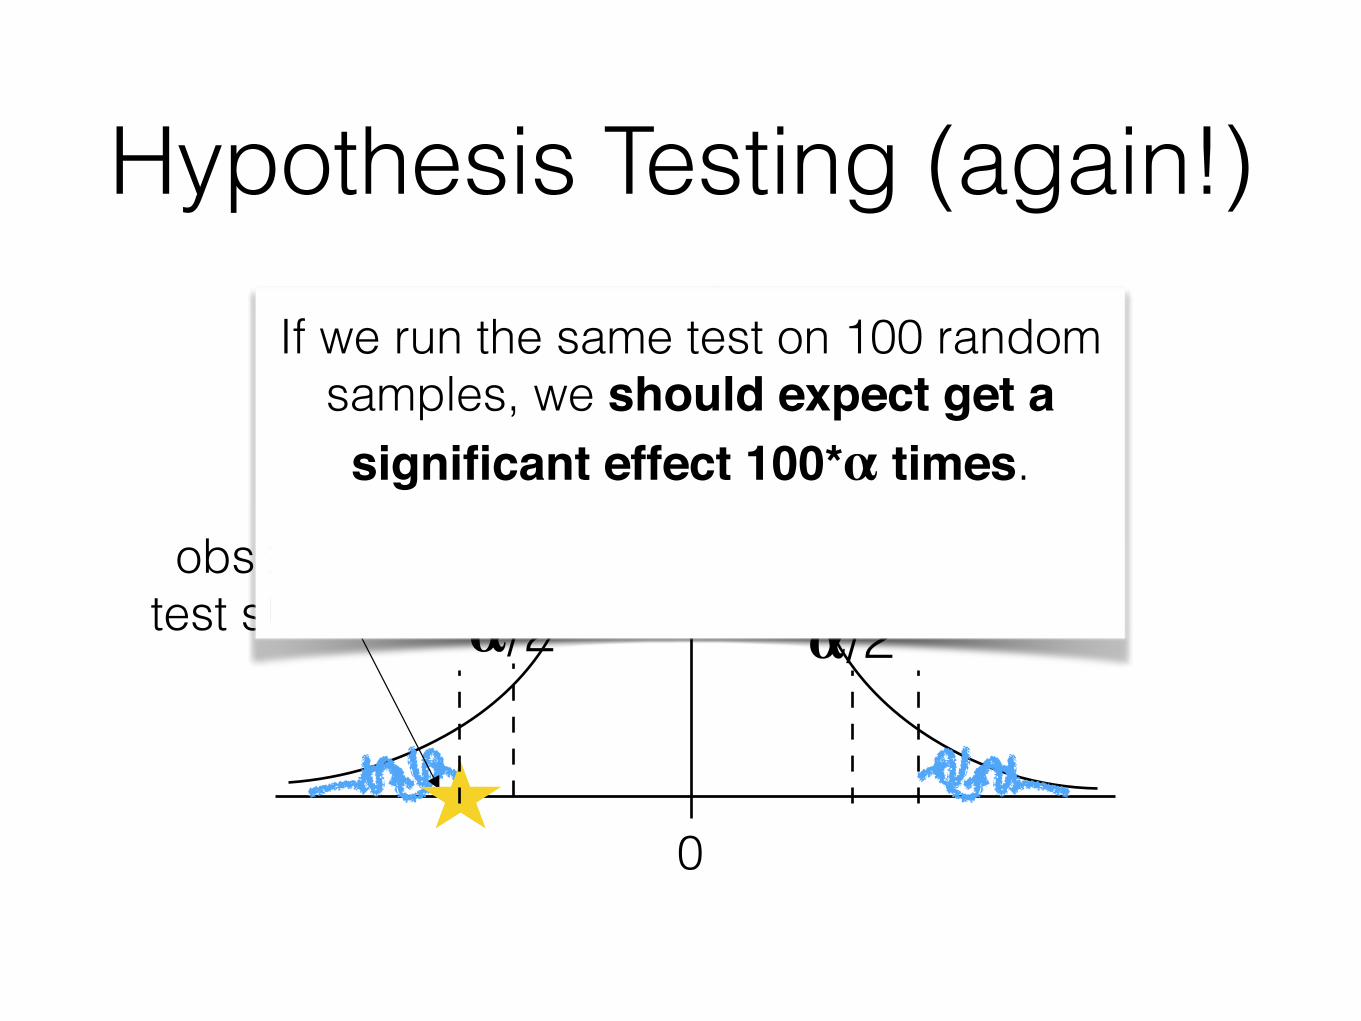
p-value = cumulative density of values more extreme than observed statistic
𝛂/2 𝛂/2
Hypothesis Testing (again!)
observed test statistic
0
𝛂/2 𝛂/2
Hypothesis Testing (again!)
observed test statistic
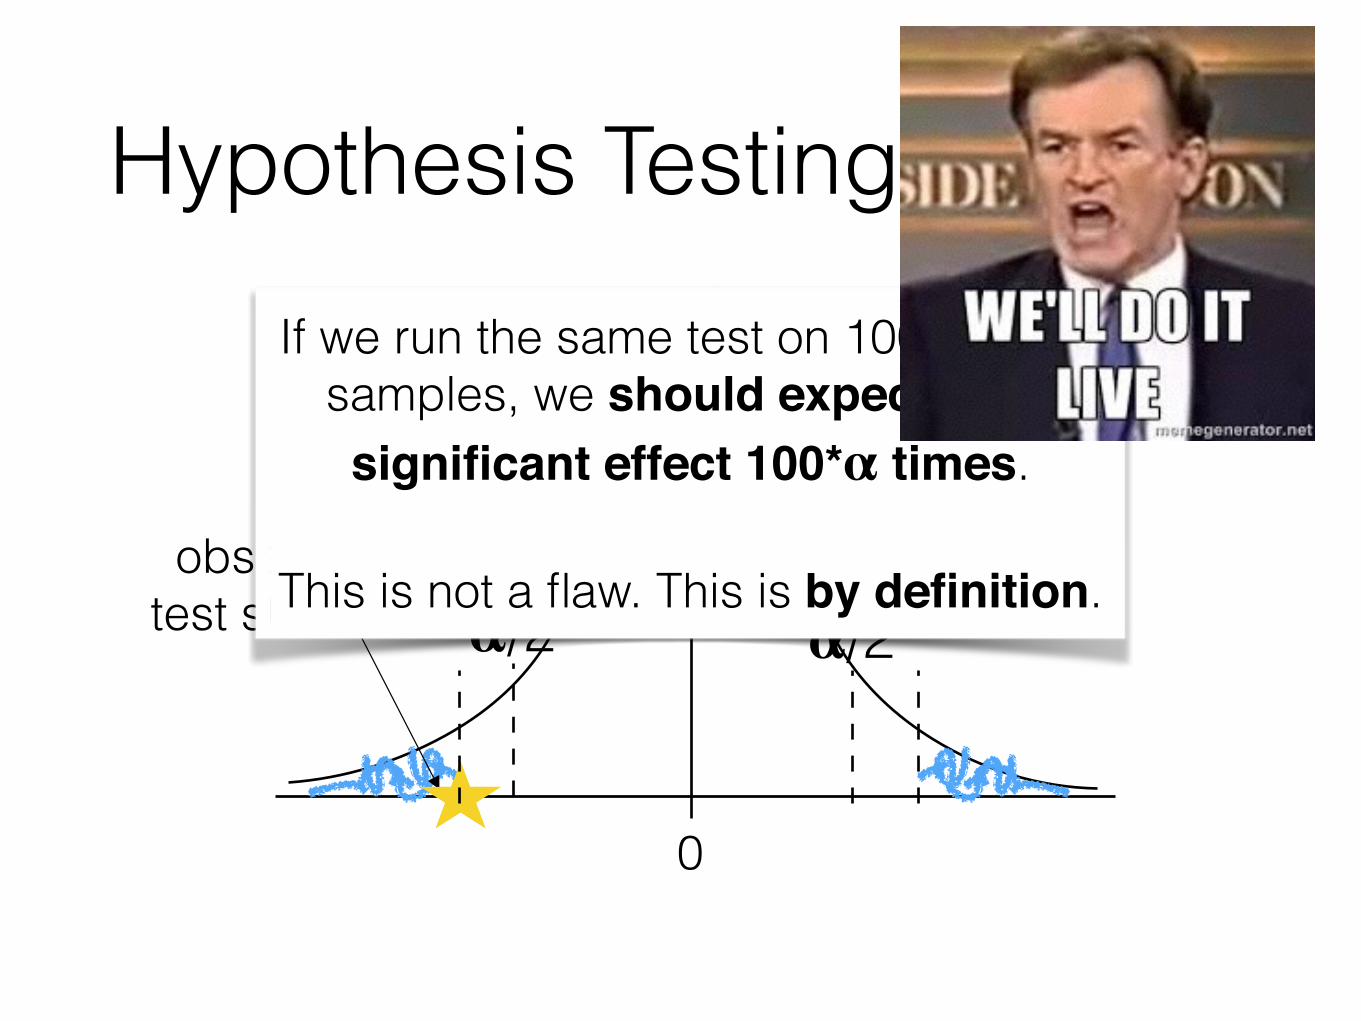
If we run the same test on 100 random samples, we should expect get a significant effect 100*𝛂 times.
This is not a flaw. This is by definition.

0
𝛂/2 𝛂/2
Hypothesis Testing (again!)
observed test statistic
If we run the same test on 100 random samples, we should expect get a significant effect 100*𝛂 times.
This is not a flaw. This is by definition.
0
𝛂/2 𝛂/2
Hypothesis Testing (again!)
observed test statistic
If we run the same test on 100 random samples, we should expect get a significant effect 100*𝛂 times.
This is not a flaw. This is by definition.

Multiple Comparisons

Multiple Comparisons
Multiple Comparisons
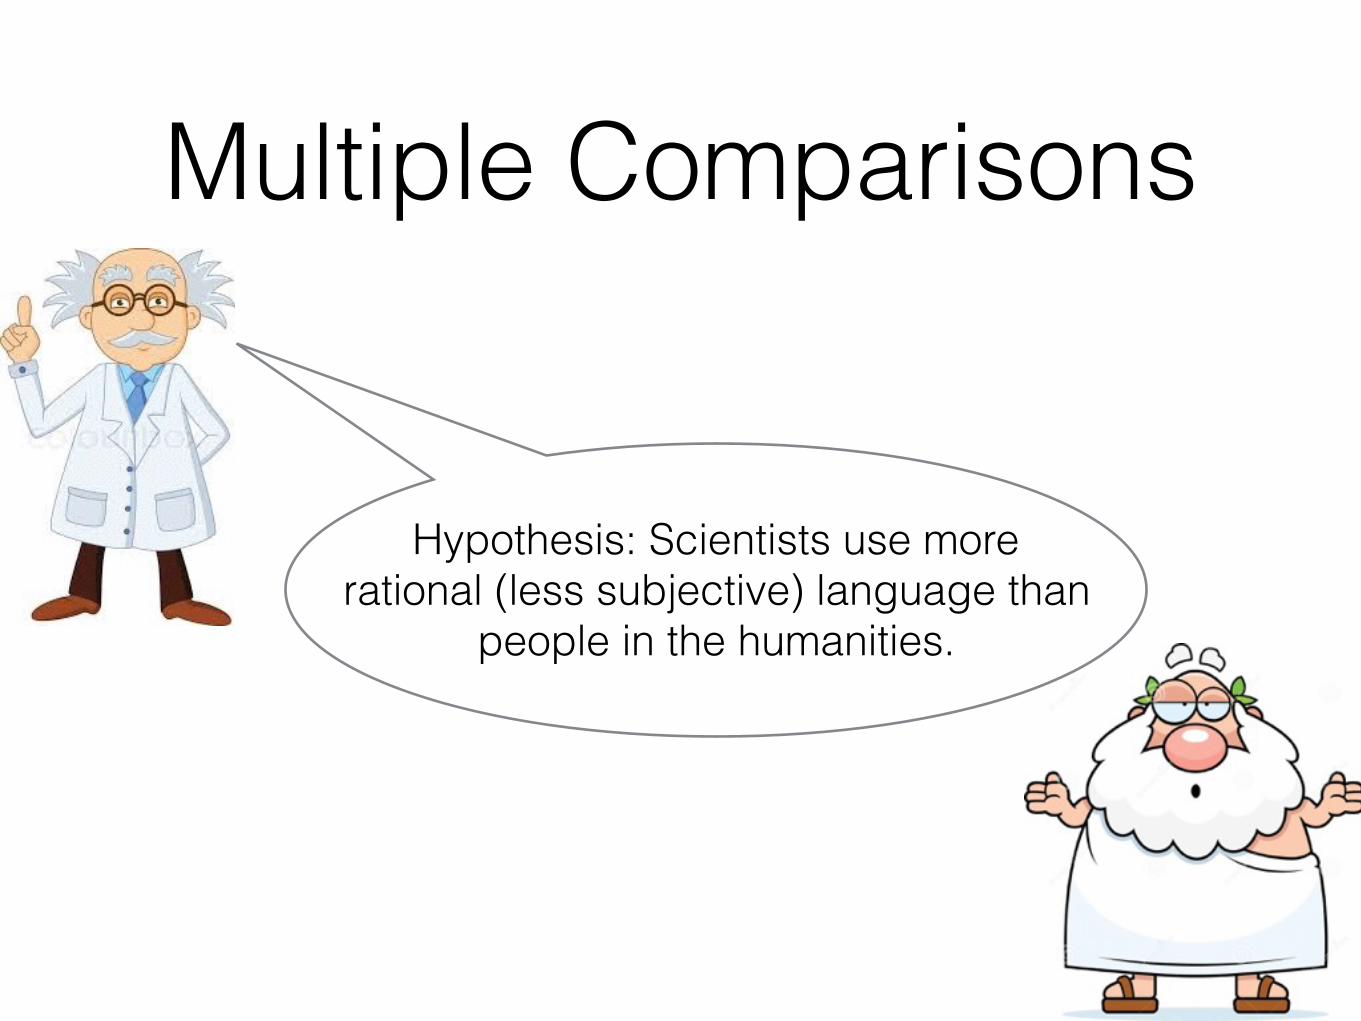
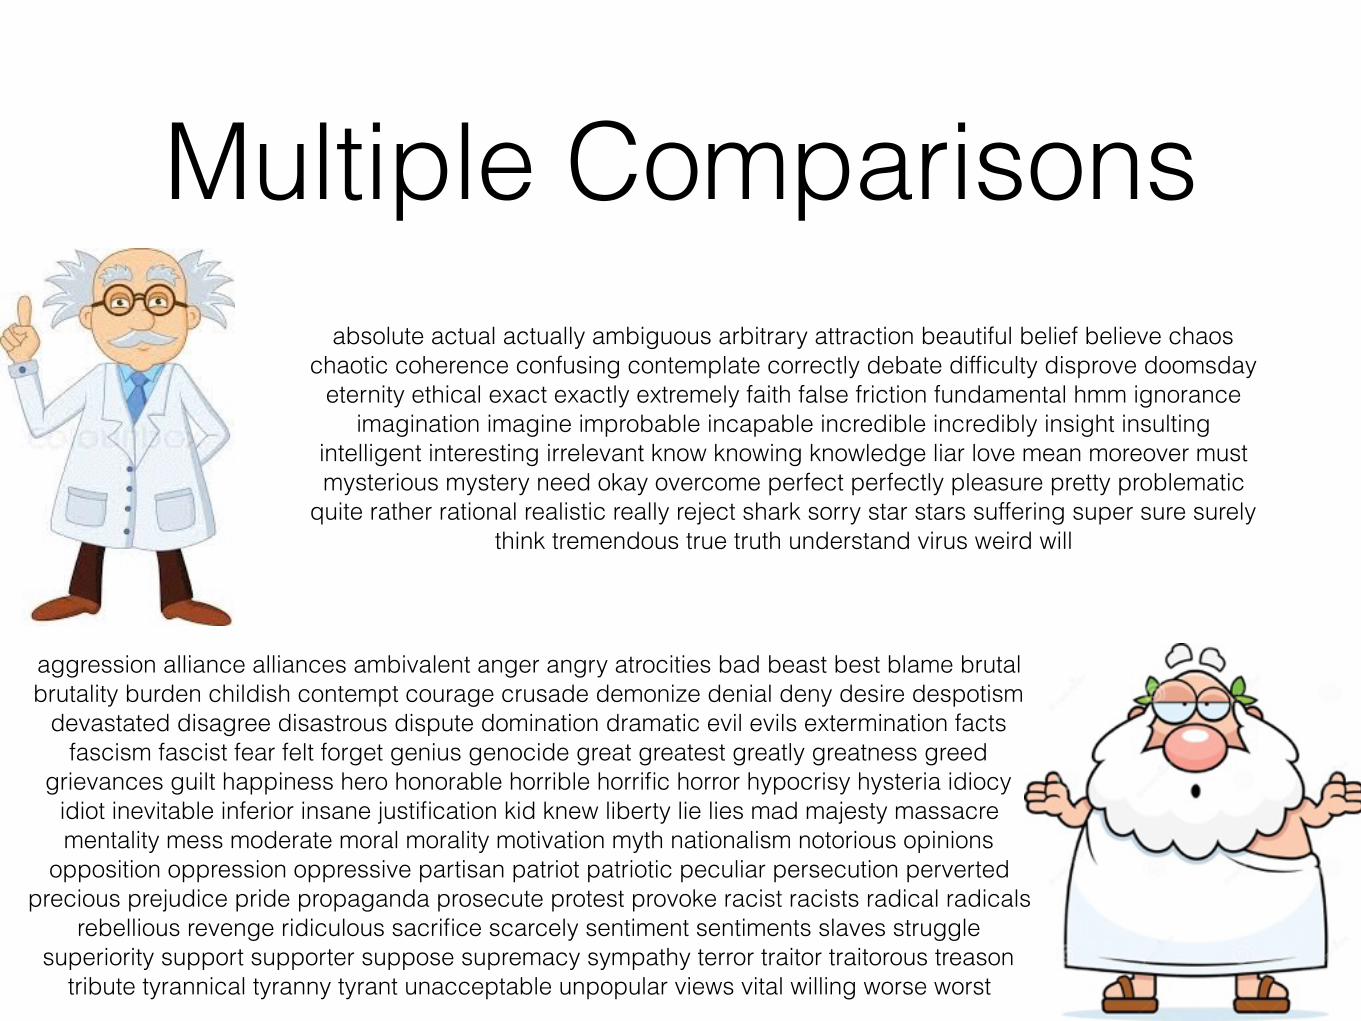
Hypothesis: Scientists use more rational (less subjective) language than
people in the humanities.
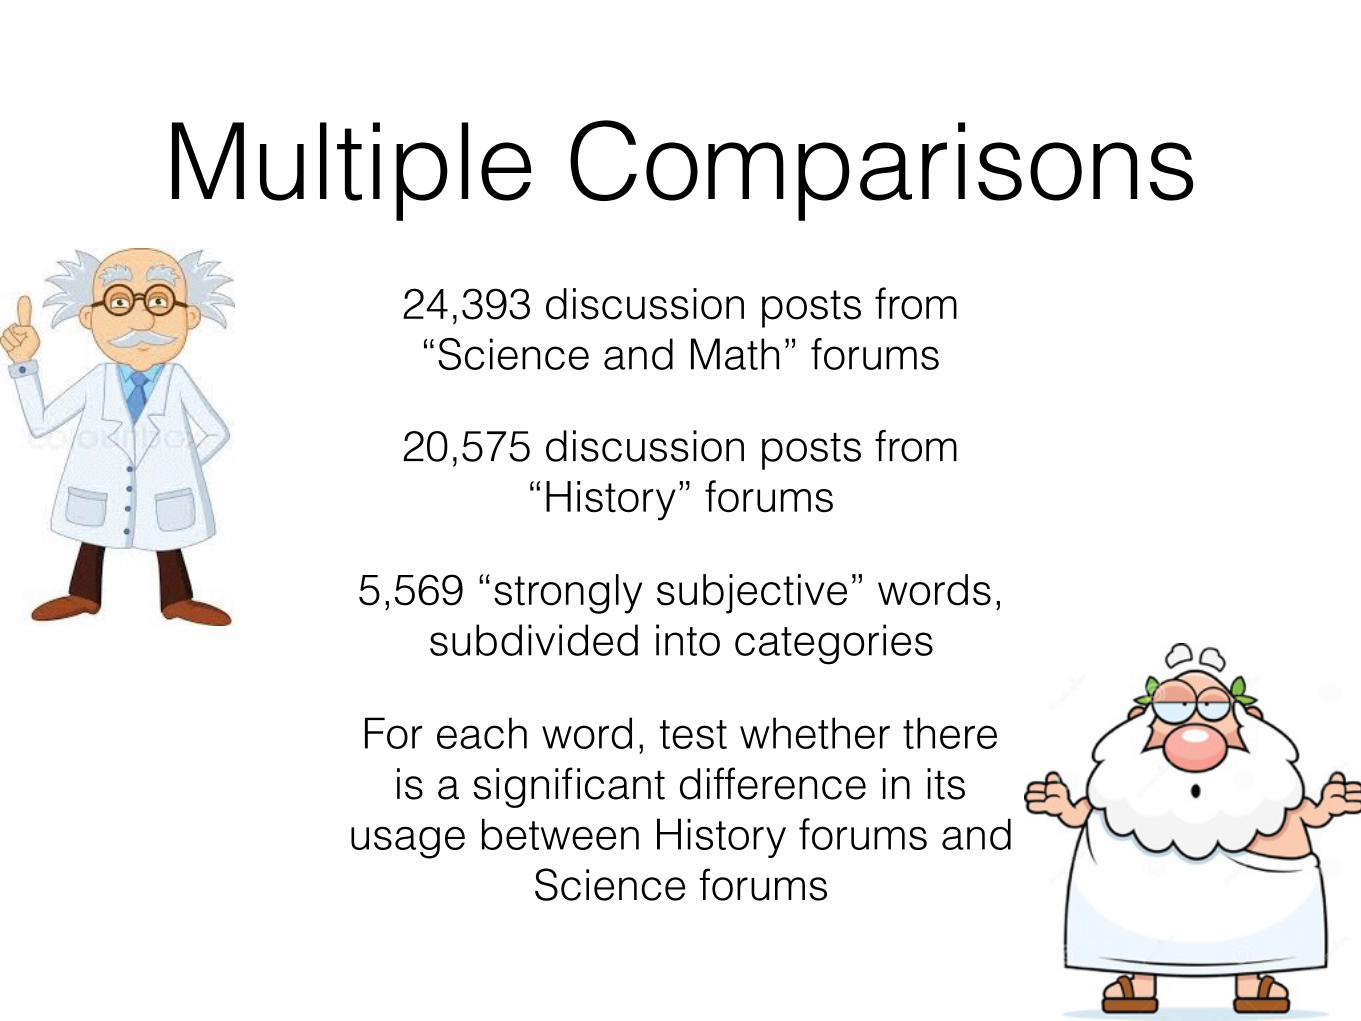
Multiple Comparisons24,393 discussion posts from “Science and Math” forums
5,569 “strongly subjective” words, subdivided into categories
For each word, test whether there is a significant difference in its
usage between History forums and Science forums
20,575 discussion posts from “History” forums

Multiple Comparisons
Screaming just means you 're emotional about your opinion . And the sovereign authority of the state -- i.e. its People , which is the supreme sovereign
authority of that state -- may construe that , or any other law , as it pleases regarding its domestic policy . The SC can explicitly state that the world is
flat ; but that does n't make it so , since it has no such power over heaven and earth ; and it likewise has no power to grant or deny the international
sovereignty of states . It may rule on cases that come before it , and pass them into subordinate case-law ; however this can not affect the actual sovereignty of the states in question , any more than it can make the Earth flat , or make
England and France into the 51st and 52nd states..
Crim , You are failing to see the difference between small-scale , verifiable negatives , like the empty box example , and large-scale unverifiable negatives , like the non-
existence of god , or extraterrestrial life somewhere in the universe . David Hume is the philosopher who first articulated the idea that you ca n't prove a large-scale
unverifiable negative . Given our knowledge of the universe and our lack of the ability to gather information about life-forms in other systems , this is precisely the
sort of logical fallacy Hume described . Hume saw a problem with making generalizations based on a limited number of observations . This is called Hume 's
problem , and is the basis for the claim that you can not prove or disprove an unverifiable negative .
Multiple Comparisons
aggression alliance alliances ambivalent anger angry atrocities bad beast best blame brutal brutality burden childish contempt courage crusade demonize denial deny desire despotism
devastated disagree disastrous dispute domination dramatic evil evils extermination facts fascism fascist fear felt forget genius genocide great greatest greatly greatness greed
grievances guilt happiness hero honorable horrible horrific horror hypocrisy hysteria idiocy idiot inevitable inferior insane justification kid knew liberty lie lies mad majesty massacre mentality mess moderate moral morality motivation myth nationalism notorious opinions
opposition oppression oppressive partisan patriot patriotic peculiar persecution perverted precious prejudice pride propaganda prosecute protest provoke racist racists radical radicals
rebellious revenge ridiculous sacrifice scarcely sentiment sentiments slaves struggle superiority support supporter suppose supremacy sympathy terror traitor traitorous treason
tribute tyrannical tyranny tyrant unacceptable unpopular views vital willing worse worst
absolute actual actually ambiguous arbitrary attraction beautiful belief believe chaos chaotic coherence confusing contemplate correctly debate difficulty disprove doomsday
eternity ethical exact exactly extremely faith false friction fundamental hmm ignorance imagination imagine improbable incapable incredible incredibly insight insulting
intelligent interesting irrelevant know knowing knowledge liar love mean moreover must mysterious mystery need okay overcome perfect perfectly pleasure pretty problematic
quite rather rational realistic really reject shark sorry star stars suffering super sure surely think tremendous true truth understand virus weird will
81
129

Clicker Question!

Multiple Comparisons24,393 discussion posts from “Science and Math” forums
5,569 “strongly subjective” words, subdivided into categories
For each word, test whether there is a significant difference in its
usage between History forums and Science forums
20,575 discussion posts from “History” forums

Multiple Comparisons24,393 discussion posts from “Science and Math” forums
5,569 “strongly subjective” words, subdivided into categories
For each word, test whether there is a significant difference in its
usage between History forums and Science forums
20,575 discussion posts from “History” forums

Multiple Comparisons24,393 discussion posts from “Science and Math” forums
5,569 “strongly subjective” words, subdivided into categories
For each word, test whether there is a significant difference in its
usage between History forums and Science forums
20,575 discussion posts from “History” forums
Multiple Comparisons
𝛂 = 0.05 (set in advance like good
scientists)

Multiple Comparisons𝛂 = 0.05
5,569 “strongly subjective” words
We expect 278 of those to show a difference by random chance alone.
210 words showed significant differences in usage between Science
and History
p = 0.05 / 5,567 = 0.0000089
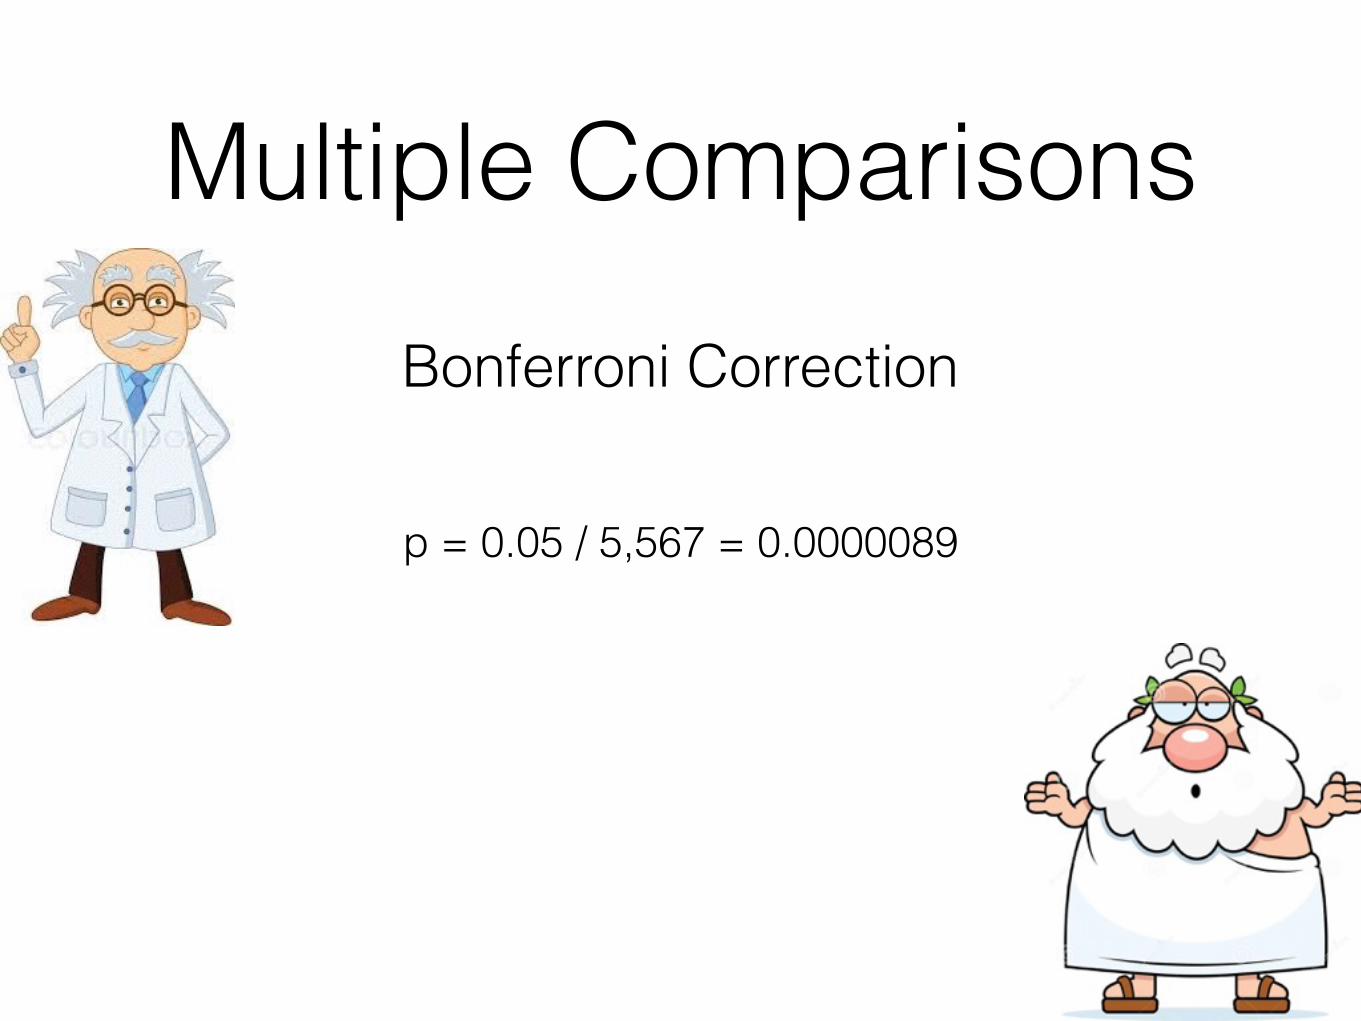
Multiple ComparisonsBonferroni Correction

p = 0.05 / 5,567 = 0.0000089
Multiple ComparisonsBonferroni Correction
Stricter p-value to maintain a 5% “false positive” rate

Multiple Comparisons
aggression alliance alliances ambivalent anger angry atrocities bad beast best blame brutal brutality burden childish contempt courage crusade demonize denial deny desire despotism
devastated disagree disastrous dispute domination dramatic evil evils extermination facts fascism fascist fear felt forget genius genocide great greatest greatly greatness greed
grievances guilt happiness hero honorable horrible horrific horror hypocrisy hysteria idiocy idiot inevitable inferior insane justification kid knew liberty lie lies mad majesty massacre mentality mess moderate moral morality motivation myth nationalism notorious opinions
opposition oppression oppressive partisan patriot patriotic peculiar persecution perverted precious prejudice pride propaganda prosecute protest provoke racist racists radical radicals
rebellious revenge ridiculous sacrifice scarcely sentiment sentiments slaves struggle superiority support supporter suppose supremacy sympathy terror traitor traitorous treason
tribute tyrannical tyranny tyrant unacceptable unpopular views vital willing worse worst
absolute actual actually ambiguous arbitrary attraction beautiful belief believe chaos chaotic coherence confusing contemplate correctly debate difficulty disprove doomsday
eternity ethical exact exactly extremely faith false friction fundamental hmm ignorance imagination imagine improbable incapable incredible incredibly insight insulting
intelligent interesting irrelevant know knowing knowledge liar love mean moreover must mysterious mystery need okay overcome perfect perfectly pleasure pretty problematic
quite rather rational realistic really reject shark sorry star stars suffering super sure surely think tremendous true truth understand virus weird will
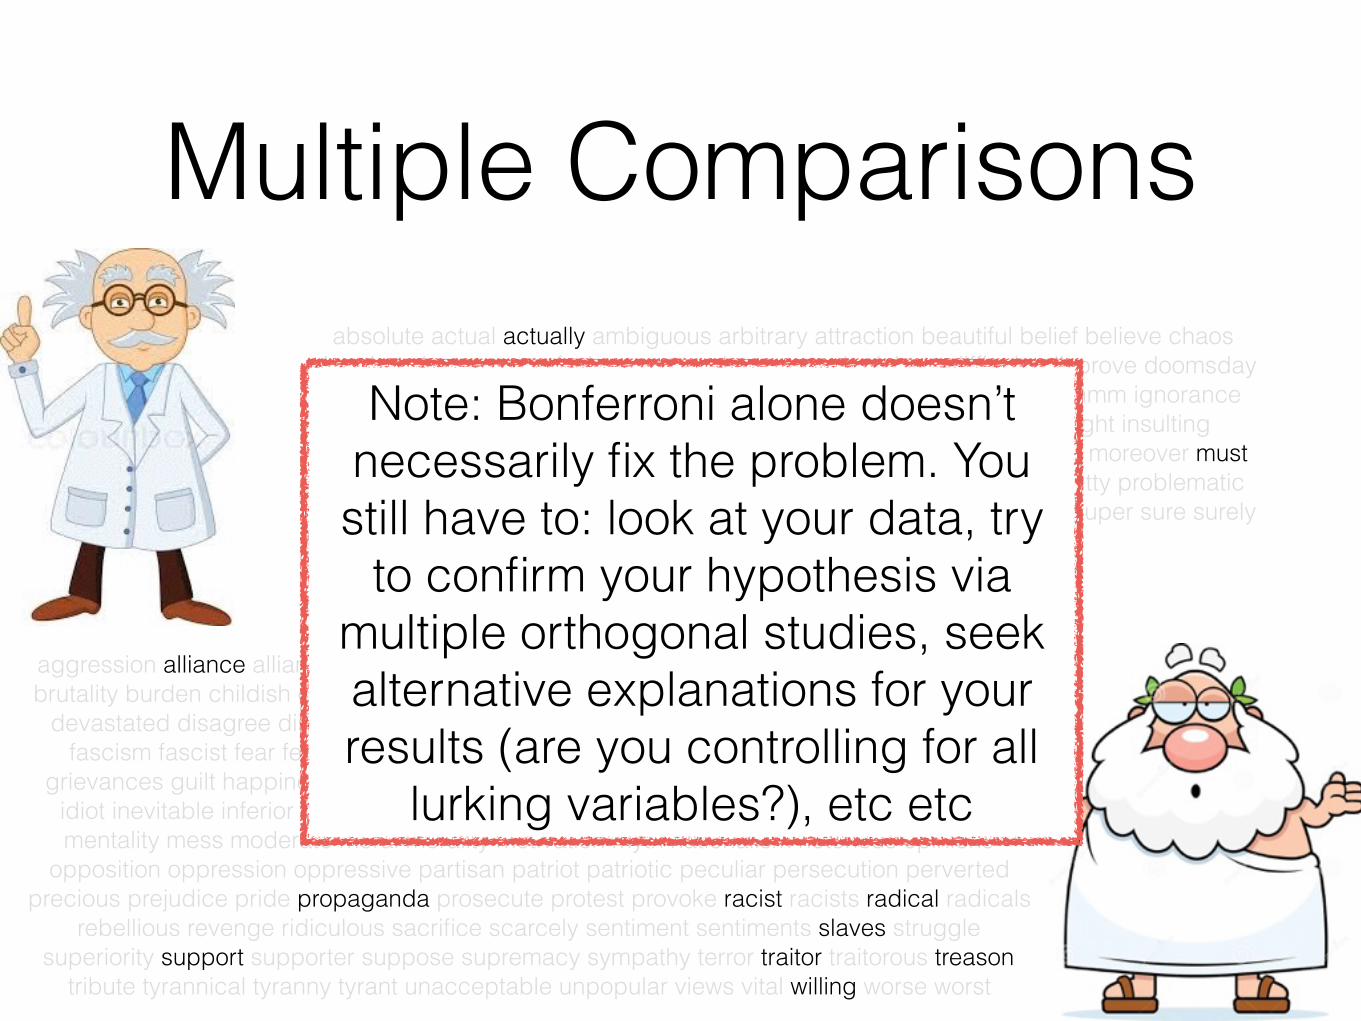
Note: Bonferroni alone doesn’t necessarily fix the problem. You still have to: look at your data, try
to confirm your hypothesis via multiple orthogonal studies, seek alternative explanations for your results (are you controlling for all
lurking variables?), etc etc
• You are literally running the same test multiple times (“tuning the random seed”)
• You are running a large number of experiments and then looking for the ones that are significant after-the-fact
When am I at risk of “multiple comparisons” errors?

• You are literally running the same test multiple times (“tuning the random seed”)
• You are running a large number of experiments and then looking for the ones that are significant after-the-fact
When am I at risk of “multiple comparisons” errors?

• You are literally running the same test multiple times (“tuning the random seed”)
• You are running a large number of experiments and then looking for the ones that are significant after-the-fact
When am I at risk of “multiple comparisons” errors?

• Pre-Register your hypothesis/methods
• Try to perform one test — e.g. count total number of subjective words in each population and do a single test for population proportion
• What problems could still exist?
How could I have done this better?

• Pre-Register your hypothesis/methods
• Try to perform one test — e.g. count total number of subjective words in each population and do a single test for population proportion
• What problems could still exist?
How could I have done this better?
• Pre-Register your hypothesis/methods
• Try to perform one test — e.g. count total number of subjective words in each population and do a single test for population proportion
• What problems could still exist?
How could I have done this better?

• Pre-Register your hypothesis/methods
• Try to perform one test — e.g. count total number of subjective words in each population and do a single test for population proportion
• What problems could still exist?
How could I have done this better?

Researcher Degrees of Freedom
Researcher Degrees of Freedom
“Researcher degrees of freedom can lead to a multiple comparisons problem, even in settings where researchers perform only a single analysis on their data. The problem is there can be a large number of potential comparisons when
the details of data analysis are highly contingent on data, without the researcher having to perform any conscious
procedure of fishing or examining multiple p-values.”
— Andrew Gelman and Eric Loken
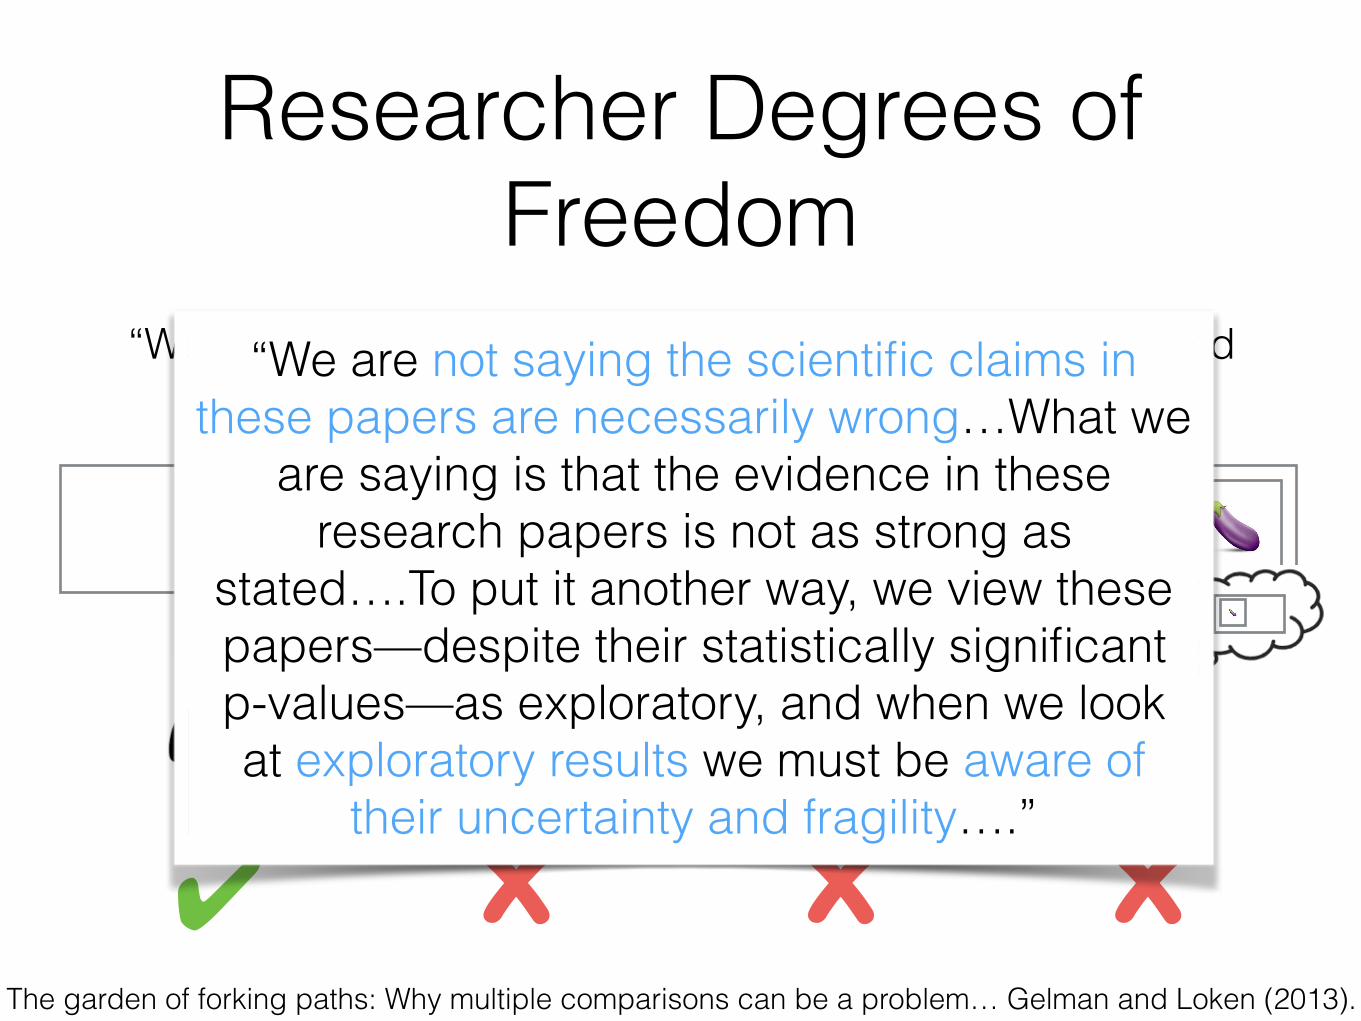
The garden of forking paths: Why multiple comparisons can be a problem… Gelman and Loken (2013).

Researcher Degrees of Freedom
“Researcher degrees of freedom can lead to a multiple comparisons problem, even in settings where researchers perform only a single analysis on their data. The problem is there can be a large number of potential comparisons when
the details of data analysis are highly contingent on data, without the researcher having to perform any conscious
procedure of fishing or examining multiple p-values.”
— Andrew Gelman and Eric Loken
The garden of forking paths: Why multiple comparisons can be a problem… Gelman and Loken (2013).

Researcher Degrees of Freedom
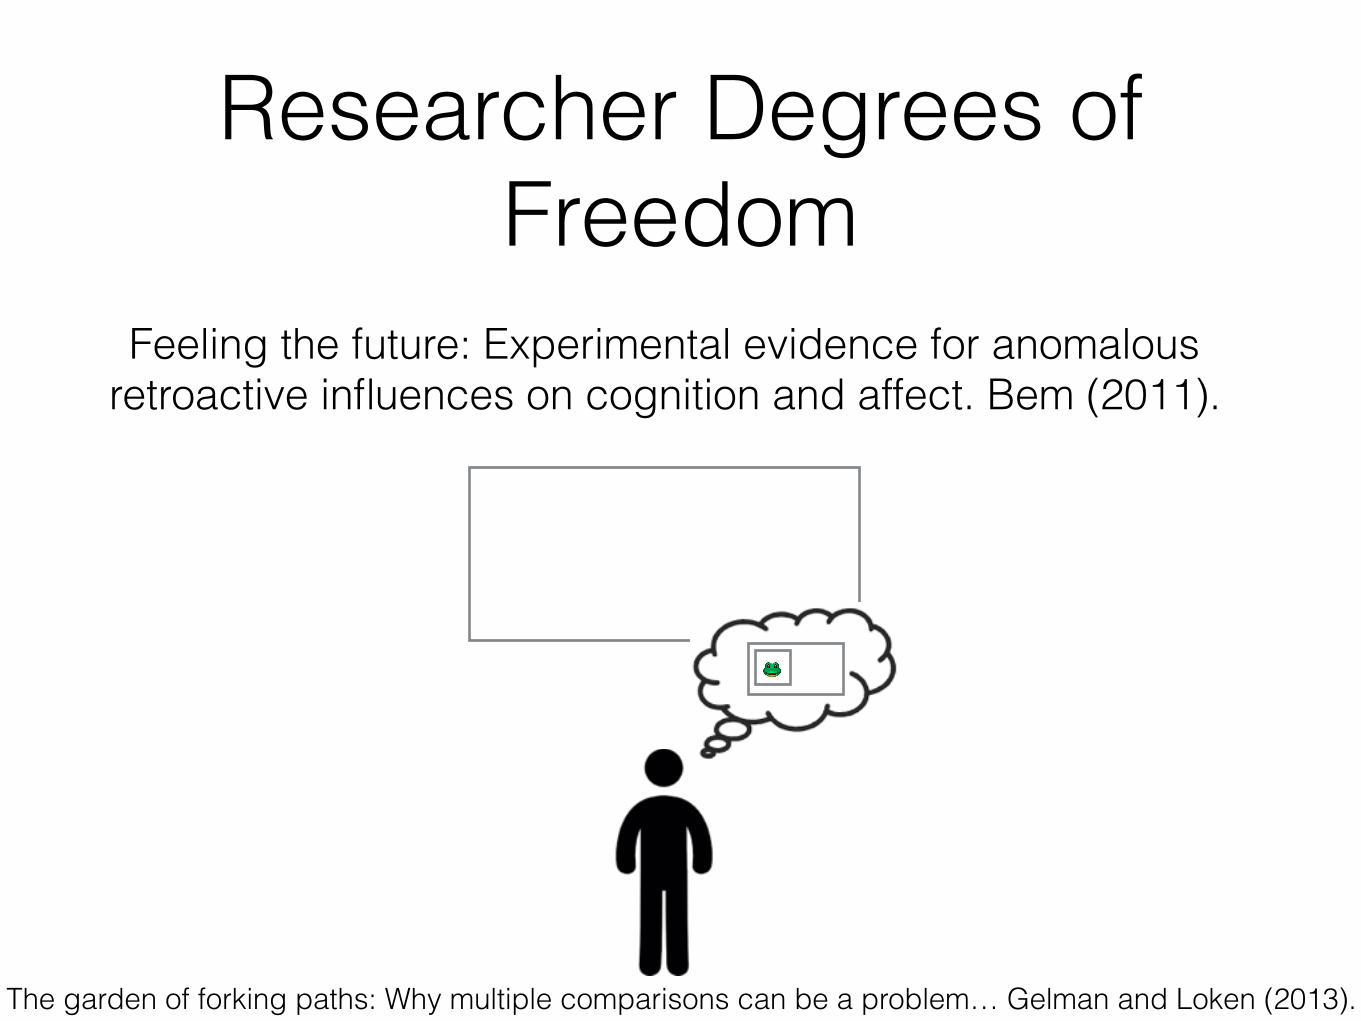
Feeling the future: Experimental evidence for anomalous retroactive influences on cognition and affect. Bem (2011).
The garden of forking paths: Why multiple comparisons can be a problem… Gelman and Loken (2013).
Researcher Degrees of Freedom
Feeling the future: Experimental evidence for anomalous retroactive influences on cognition and affect. Bem (2011).
🐸
The garden of forking paths: Why multiple comparisons can be a problem… Gelman and Loken (2013).
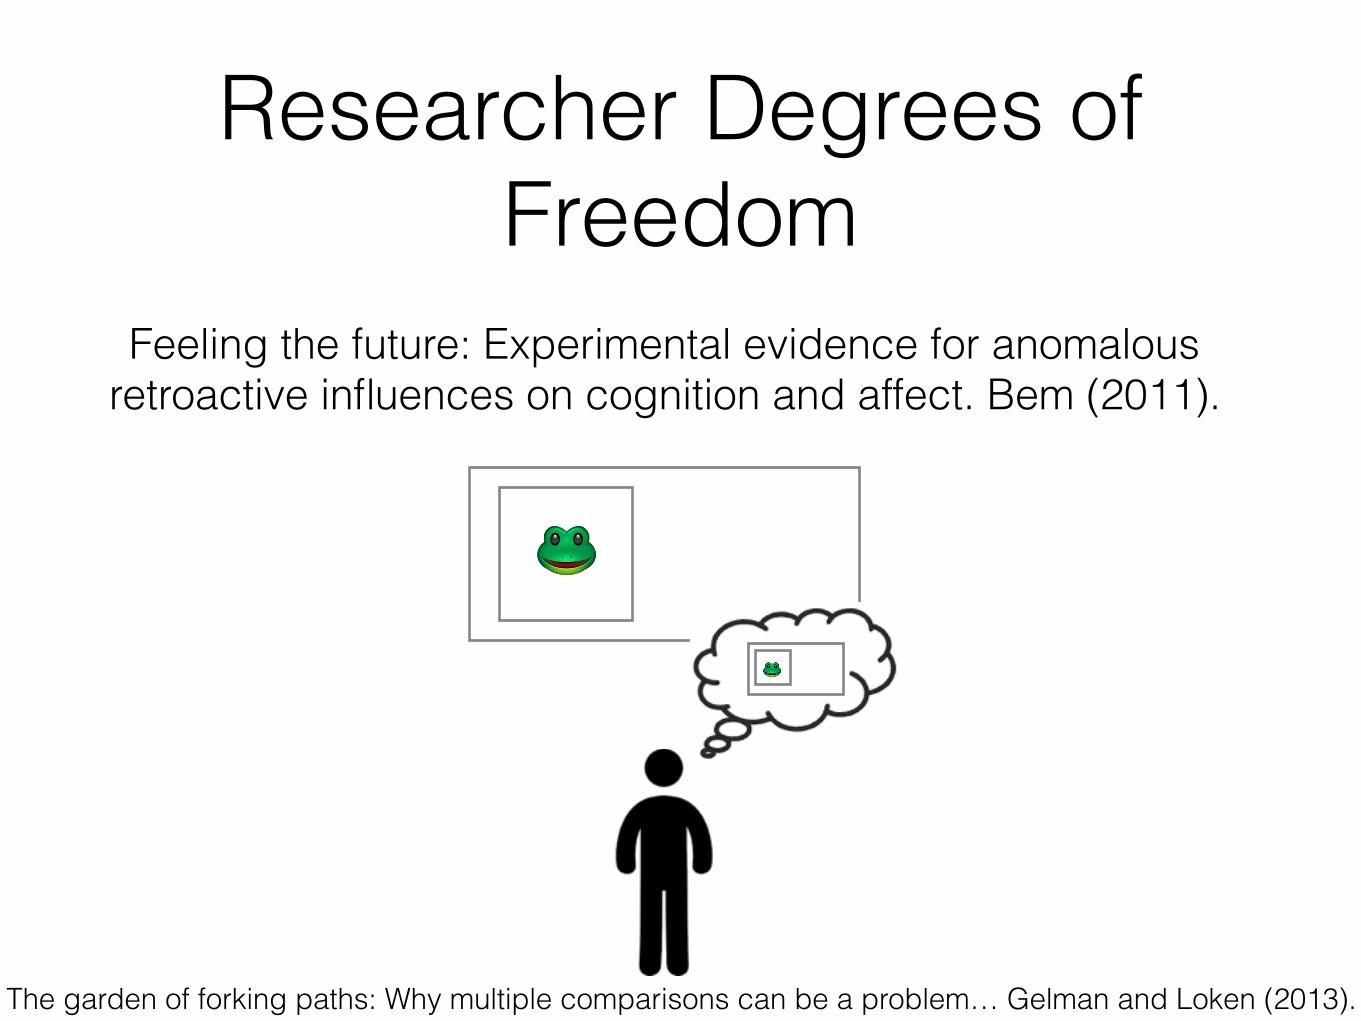
Researcher Degrees of Freedom
Feeling the future: Experimental evidence for anomalous retroactive influences on cognition and affect. Bem (2011).
🐸
🐸
The garden of forking paths: Why multiple comparisons can be a problem… Gelman and Loken (2013).

Researcher Degrees of Freedom
Feeling the future: Experimental evidence for anomalous retroactive influences on cognition and affect. Bem (2011).
🐸
🐸🍑
🍑🎨
🎨🍆
🍆
The garden of forking paths: Why multiple comparisons can be a problem… Gelman and Loken (2013).
🎨
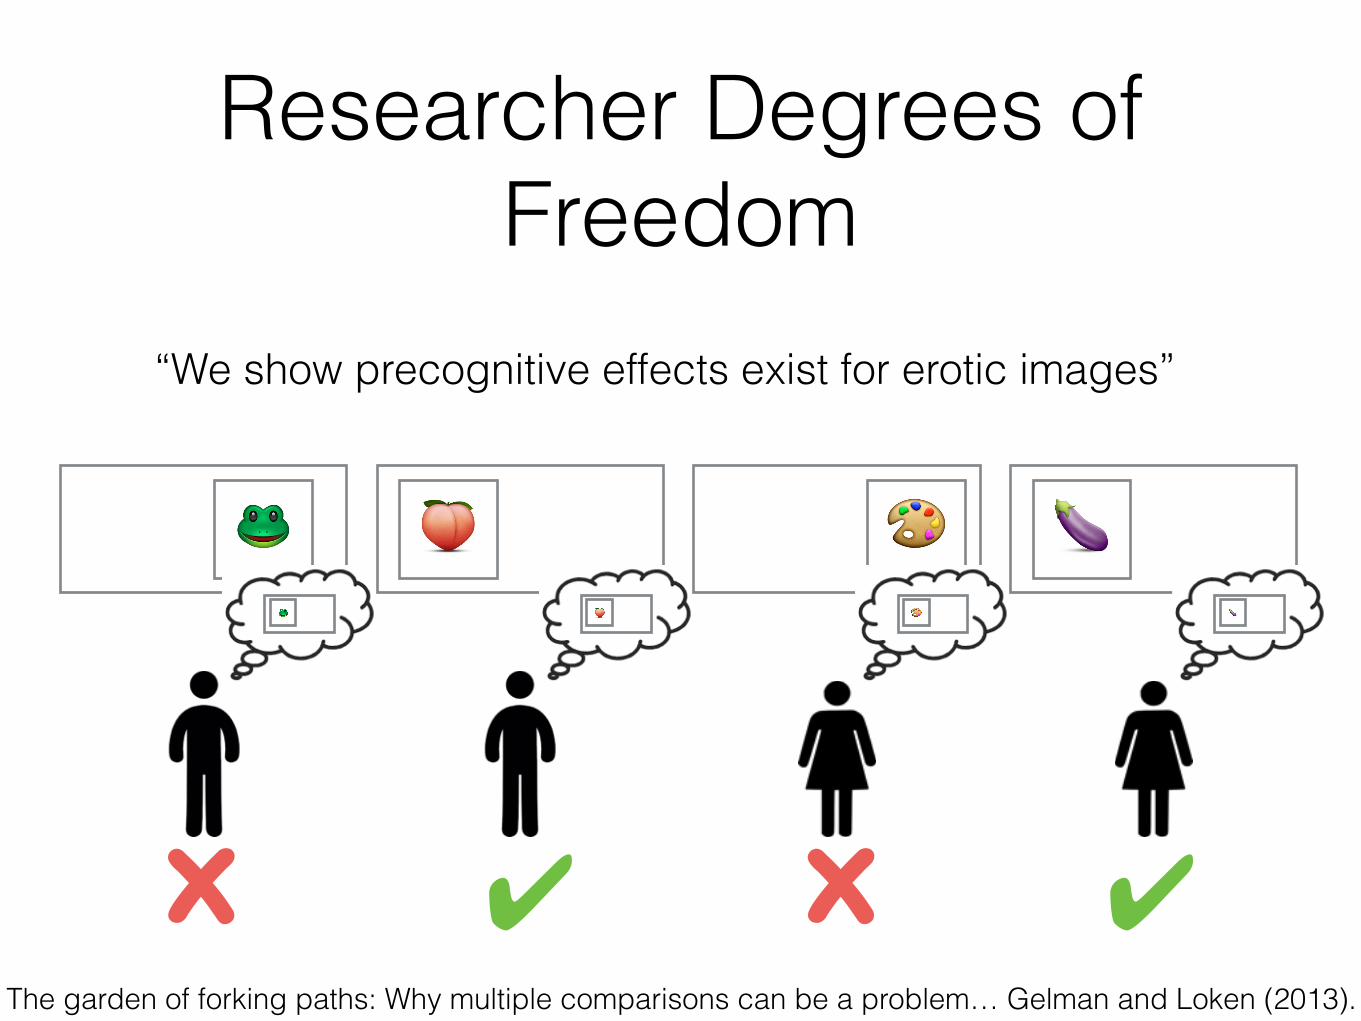
Researcher Degrees of Freedom
🐸🐸 🍑
🍑🎨 🍆
🍆
✔ x ✔x
“We show precognitive effects exist for erotic images”
The garden of forking paths: Why multiple comparisons can be a problem… Gelman and Loken (2013).
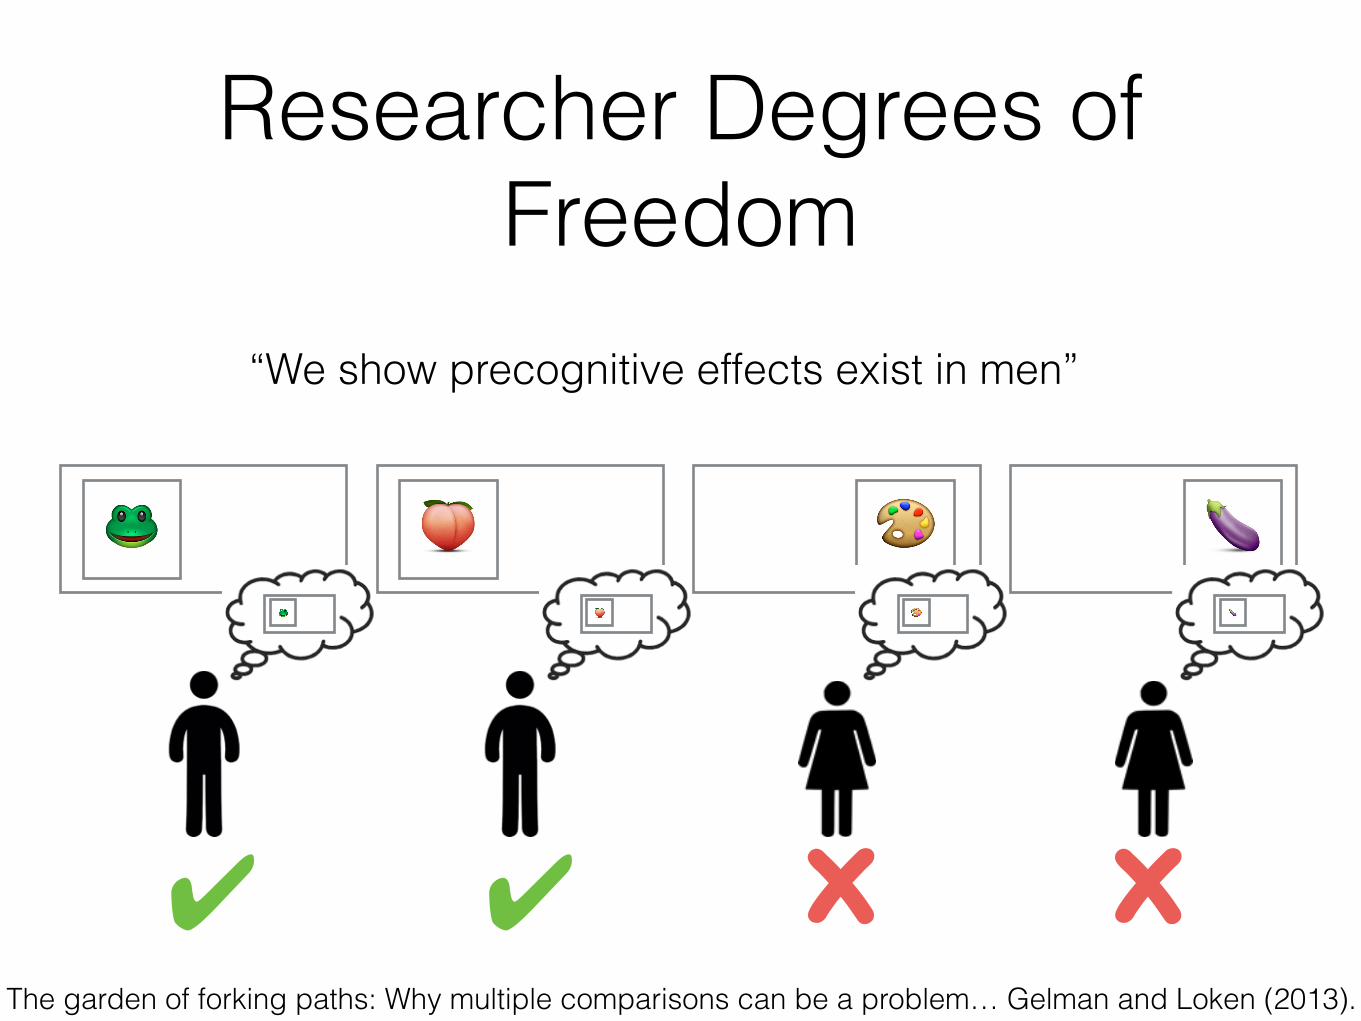
Researcher Degrees of Freedom
“We show precognitive effects exist in men”
🐸
🐸🍑
🍑 🎨🎨
🍆🍆
✔ x✔ xThe garden of forking paths: Why multiple comparisons can be a problem… Gelman and Loken (2013).

Researcher Degrees of Freedom
🐸🐸 🍑
🍑
✔ xx
“We show precognitive effects exist in men for frog-related images.”
🍆🍆
🎨🎨
xThe garden of forking paths: Why multiple comparisons can be a problem… Gelman and Loken (2013).
Researcher Degrees of Freedom
🐸🐸 🍑
🍑
✔ xx
“We show precognitive effects exist in men for frog-related images.”
🍆🍆
🎨🎨
xThe garden of forking paths: Why multiple comparisons can be a problem… Gelman and Loken (2013).
“We are not saying the scientific claims in these papers are necessarily wrong…What we
are saying is that the evidence in these research papers is not as strong as
stated….To put it another way, we view these papers—despite their statistically significant p-values—as exploratory, and when we look at exploratory results we must be aware of
their uncertainty and fragility….”

Researcher Degrees of Freedom

Researcher Degrees of Freedom
Science doesn’t happen linearly.
Exploratory analysis is fine (essential,
actually!) just know that it is exploratory.

• Always. You always are. That is why scientific results require consensus from many similar studies. No one study “proves” anything.
• But in particular—if you are refining your experimental design during the experiment, esp. in response to observed results (this is often unavoidable, but just acknowledge it)
When am I at risk of “researcher DoF” errors?
• What if I preprocess the data differently? E.g.
• Different inclusion/exclusion criteria (e.g. nulls/missing data?)
• Different thresholds (when discretizing)
• What if I aggregate differently? E.g.
• Looking for effects between subgroups when no primary effects exist
• What if I use different tests? E.g.
• Switching to t-test when chi-squared showed no effect
“Refining your experimental design during the experiment”
You will do these things, that’s fine, but know that you did them. A “real”
result should be robust to these kinds of decisions, if your result is
not robust, acknowledge that.

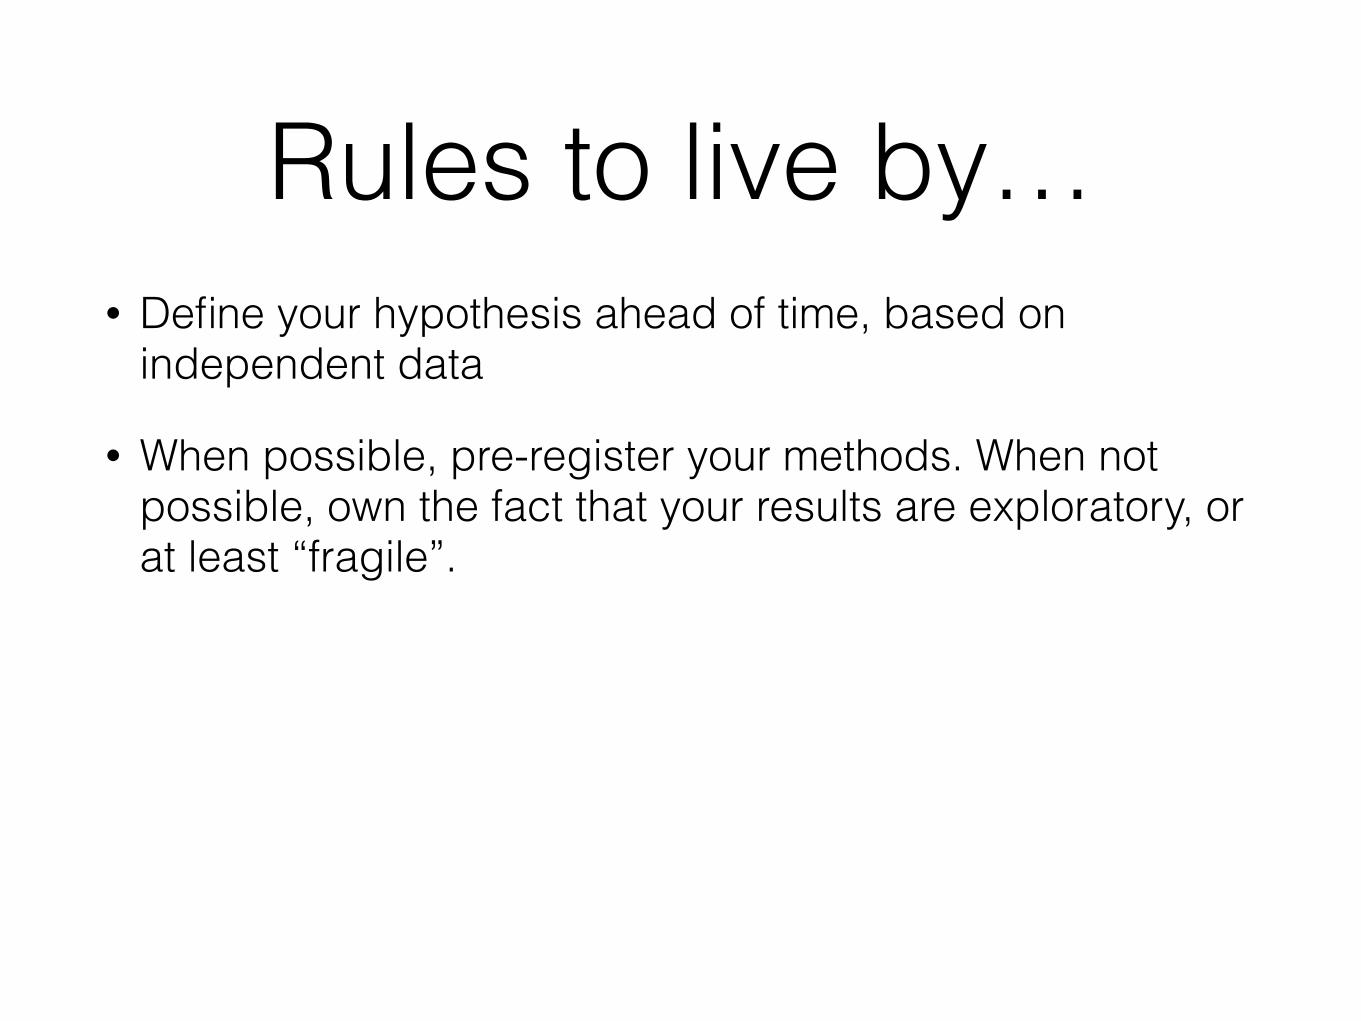
• Define your hypothesis ahead of time, based on independent data
• When possible, pre-register your methods
• The point of significance testing is to indicate levels of uncertainty, not to certify of “truth”
• Stay Curious! “Recognize the actual open-ended aspect of your projects…and analyze your data with this generality in mind” (Gelman and Loken)
Rules to live by…
• Define your hypothesis ahead of time, based on independent data
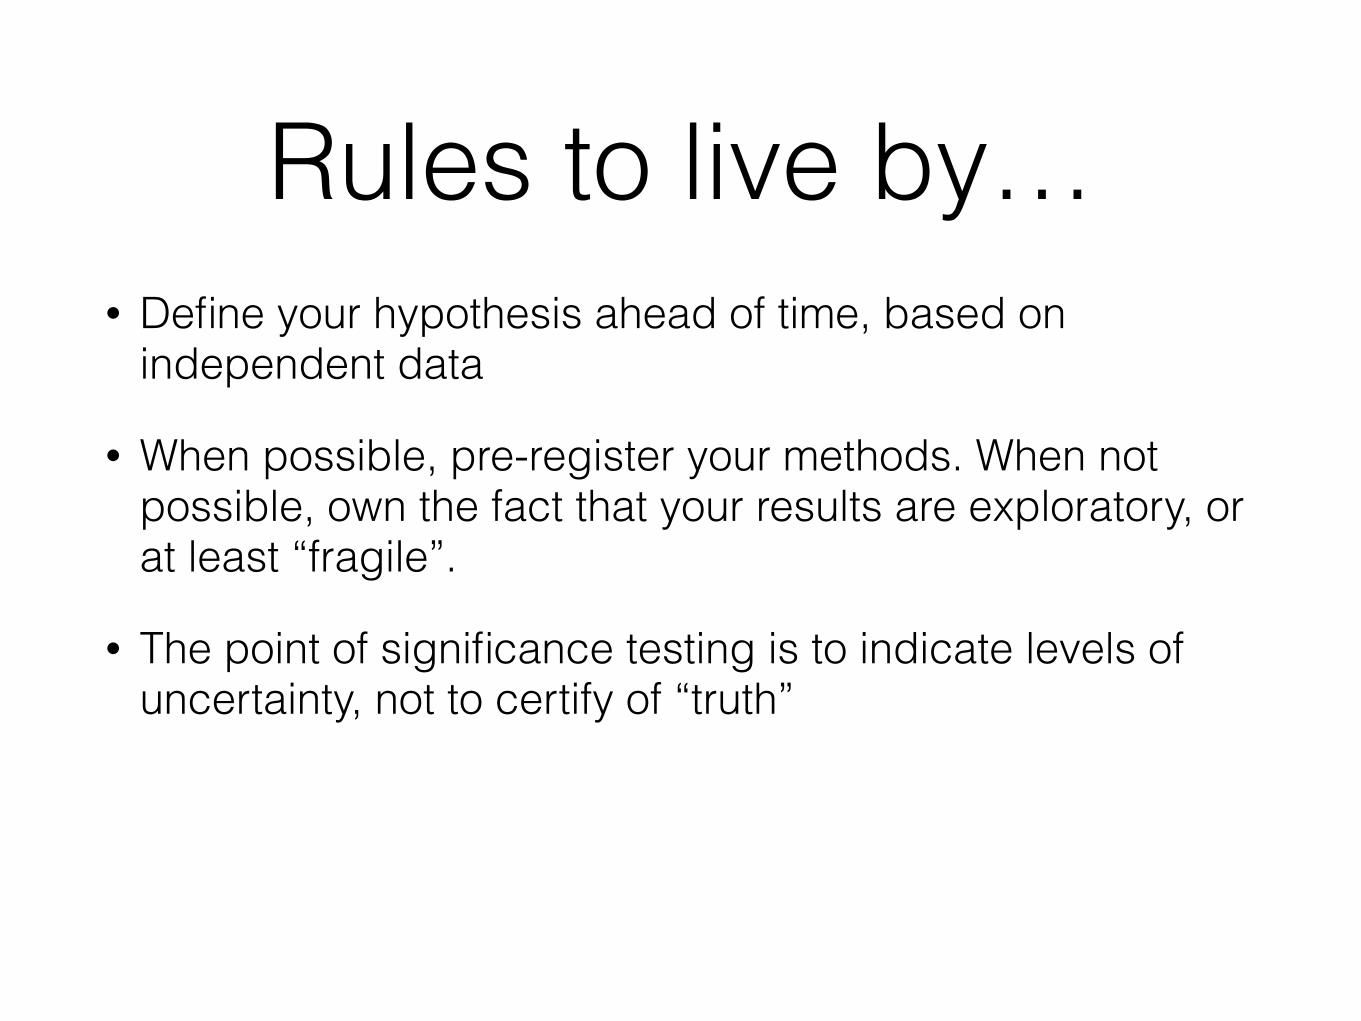
• When possible, pre-register your methods. When not possible, own the fact that your results are exploratory, or at least “fragile”.
• The point of significance testing is to indicate levels of uncertainty, not to certify of “truth”
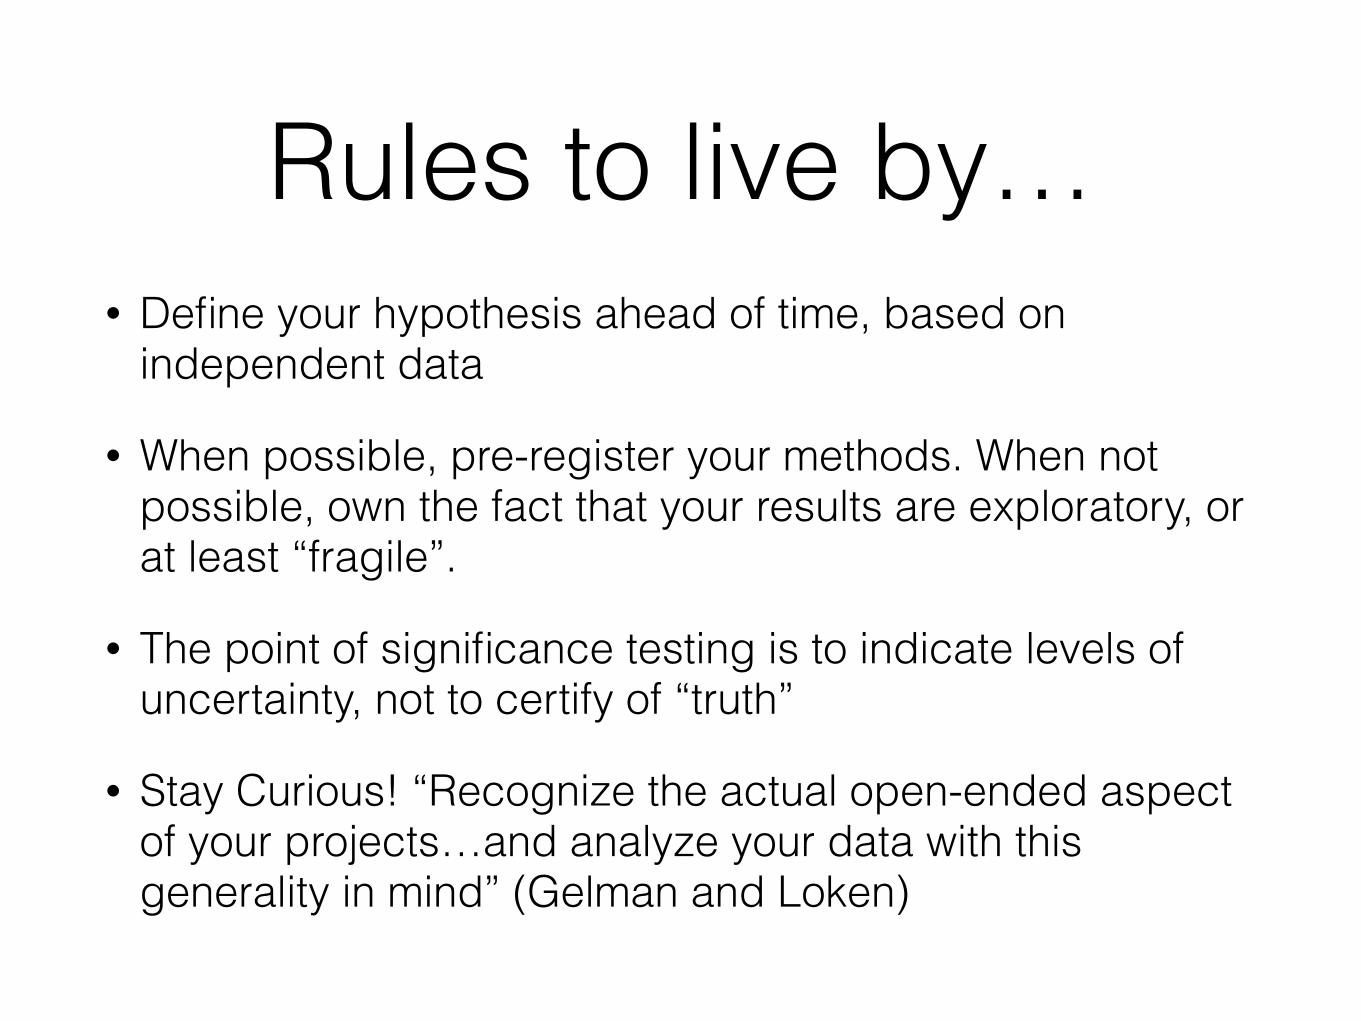
• Stay Curious! “Recognize the actual open-ended aspect of your projects…and analyze your data with this generality in mind” (Gelman and Loken)
Rules to live by…
• Define your hypothesis ahead of time, based on independent data
• When possible, pre-register your methods. When not possible, own the fact that your results are exploratory, or at least “fragile”.
• The point of significance testing is to indicate levels of uncertainty, not to certify of “truth”
• Stay Curious! “Recognize the actual open-ended aspect of your projects…and analyze your data with this generality in mind” (Gelman and Loken)
Rules to live by…