Embed Size (px)
Citation preview

2013
Gary Radloff and Shashi Dhungel
How to Keep Wisconsin and the U.S. Competitive in a Changing Energy World

1
Acknowledgements The authors would like to thank Celia Luterbacher and Margaret Broeren for their patient assistance and wise suggestions in editing the drafts of the report. The authors acknowledge the support of the University of Wisconsin-‐Extension for the project vision and guidance, especially Rick Klemme, John Shutske, Thomas Blewett and Tim Baye. The authors are solely responsible for any errors, emissions or opinions contained in the report. Recommendations presented in the report are solely of the authors and do not reflect the perception of their affiliated organizations. For any questions or information about the report please contact the authors.

2
About the Authors Gary Radloff is a researcher at the University of Wisconsin-‐Madison and the Director of Midwest Energy Policy Analysis for the Wisconsin Energy Institute (WEI). He is an Honorary Associate/Fellow with the Nelson Institute, Center for Sustainability and the Global Environment (SAGE). Radloff has also served as the Interim Director with the Wisconsin Bioenergy Initiative at the University of Wisconsin. He is the lead author or co-‐author of the Wisconsin Strategic Bioenergy Feedstock Assessment (2012), The Biogas Opportunity in Wisconsin (2011), and the Guidelines for Sustainable Planting and Harvest of Nonforest Biomass in Wisconsin (2012). Radloff is the former Director of Policy and Strategic Communications at the Wisconsin Department of Agriculture, Trade and Consumer Protection (DATCP). Past activities include helping to coordinate policy initiatives such as the Governor’s Consortium on the Biobased Industry and the Working Lands Initiative. Contact Gary at [email protected] Shashi Dhungel is a graduate research assistant at Biological Systems Engineering at the University of Wisconsin-‐Madison. His current research focuses on life cycle assessment of renewable energy systems. In the past he has applied life cycle approaches in assessing environmental impacts of producing cellulosic feedstock, worked in designing sustainable supply chain models and evaluation of community based natural resource management programs. Prior to coming to the University of Wisconsin-‐Madison Mr. Dhungel was a research assistant at the Research Group of Industrial Ecology and Systems Sustainability at the University of Maine – Orono. Contact Shashi at [email protected]

3
List of Acronyms ATC American Transmission Company CEC California Energy Commission CEIFA Clean Energy, Investment and Finance Authority Cf Cubic feet CHP Combined Heat and Power CRES Center for Renewable Energy Systems CUB Citizen Utility Board DE Distributed energy DOD Department of Defense DR Demand Response EIA Energy Information Administration EPA Environmental Protection Agency FERC Federal Energy Regulatory Committee FERC Federal Energy Reuglatory Commission FiT Feed in Tariffs GAO Government Accountability Office GE General Electric GHG Greenhouse Gas GLBRC Great Lakes Bioenergy Research Center IOU Investor Owned Utilities IRP Integrated Resource Planning ISO Independent System Operators ITIF Information Technology and Innovation Foundation kWh Kilowatt hour LBNL Lawrence Berkeley National Laboratory LCFS Low Carbon Fuel Standard MISO Midwest Independent System Operator mmBTU million British Thermal Units NASEO National Association of State Energy Officials NREL National Renewable Energy Laboratory NYISO New York Independent System Operator PIER Public Interest Energy Research PSC Public Service Commission PTC Production Tax Credit PURPA Public Utility Regulatory Policies Act R&D Research and Development RAM Reverse Auction Mechanism RESA Retail Energy Supply Coalition RETF Renewable Energy Trust Fund RPS Renewable Portfolio Standard RTO Regional Transmission Organization UCS The Union of Concerned Scientists USGS United States Geological Survey WEI Wisconsin Energy Institute WERC Wisconsin Energy Resource Consortium
4
Table of Contents Acknowledgements ..................................................................................................................................... 1 About the Authors ....................................................................................................................................... 2 List of Acronyms .......................................................................................................................................... 3 List of Figures............................................................................................................................................... 5 Abstract ....................................................................................................................................................... 6 Policy Problem Statement ........................................................................................................................... 6 Goals of This Policy Paper............................................................................................................................ 7 1.0 The Energy World Can Change Quickly.............................................................................................. 8
1.2 The Energy System in Wisconsin ................................................................................................. 14 1.3 Living in a Global Energy Economy .............................................................................................. 15 1.4 Changing the Rules of the Game ................................................................................................. 15 1.5 The Big Energy Challenge: How to Create a Sustainable Future.................................................. 17 1.6 Future Impacts of Wisconsin Legacy Energy Trends.................................................................... 18 1.7 Other Important Factors for Wisconsin Energy Policy................................................................. 20 1.8 The True Cost of Electricity.......................................................................................................... 21 1.9 Understanding Risk in the Electric Utility Sector ......................................................................... 23 Potential Reach of U.S. Coal Plant Closures....................................................................................... 26
2.0 Causes of Coal Plant Retirements .................................................................................................... 27 2.1 U.S. Government Support of New Energy Technology................................................................ 28 2.2 The Shale Gas Boom: Duration and Consumer Cost.................................................................... 29 2.3 Transition to Greater Use of Renewable Energy in the U.S. and Wisconsin................................ 32 2.4 Combined Heat and Power.......................................................................................................... 33 2.5 The Fall of Wind and Solar Energy Generation Prices ................................................................. 34 2.6 A New Paradigm for Profit and Regulation in a Distributed Energy World ................................. 36 2.7 Microgrids: A Technology Game Changer?.................................................................................. 37
3.0 An Energy Innovation Agenda for Wisconsin................................................................................... 40 3.1 Innovation Technology System Perspective ................................................................................ 41 3.2 Is the U.S. Falling Behind in Clean Energy Technology?............................................................... 44 3.3 Toward Transparency, Longevity, and Certainty in U.S. Energy Policy........................................ 45 3.4 Conventional Energy Generation Gets Cost-‐Recovery ................................................................ 46 3.5 Renewable Portfolio Standards ................................................................................................... 49 3.6 Production Tax Credit and Investment Tax Credit ....................................................................... 51 3.7 Net Metering Laws: Opening the Door to Clean Energy Technology Competition? ................... 52 3.8 Other Issues to Consider.............................................................................................................. 54 3.9 Wisconsin Coal Lock-‐In Means High Utility Bill Rates .................................................................. 56
4.0 Integrated Resource Planning.......................................................................................................... 57 4.1 Policy Consistency is Key ............................................................................................................. 58 4.2 Goals, Metrics and Measures for an Energy Technology Innovation System.............................. 58 4.3 Smarter, Better and Affordable Public Private Partnerships for a Sustainable Energy Future.... 60 4.4 U.S. and Wisconsin Progress in the Clean Energy Competition................................................... 63 4.5 Creating an Environment for Technology Innovation in an Uncertain Future............................. 64 4.6 Policy Development for Wisconsin in the Emerging Bioeconomy............................................... 66
Appendix 1................................................................................................................................................. 68 Appendix 2................................................................................................................................................. 70 Appendix 3................................................................................................................................................. 72 Appendix 4................................................................................................................................................. 74

5
References ................................................................................................................................................. 78 List of Figures Figure 1: U.S. Electricity Generation by Fuel Type ...................................................................................... 9 Figure 2: Carbon Lock-‐In ........................................................................................................................... 10 Figure 3: Residential price of electricity in Wisconsin and neighboring states.......................................... 15 Figure 4: Levelized Cost of Electricity ........................................................................................................ 22 Figure 5: Energy Risk Aware Regulation .................................................................................................... 25 Figure 6: Age and capacity of electric generators by fuel type.................................................................. 27 Figure 7: Potential Natural Gas Resources in the U.S. ............................................................................... 32 Figure 8: Declining Costs of Solar Energy................................................................................................... 35 Figure 9: European Union Wind Capacity Installed and Policy Support Tool ............................................ 48 Figure 10: WI 2011 Renewable Sales by Resource .................................................................................. 49 Figure 11: Historic Impact of Production Tax Credit on Installed Wind Capacity ...................................... 52 Figure 12: Net Metering Compared to Feed-‐in Tariff ............................................................................... 54 Figure 13: Wisconsin Electricity Rates Higher Than Other Midwest States.............................................. 55 Figure 14: Crossing the Commercialization Valley of Death...................................................................... 60 Figure 15: U.S. Energy Information Administration's leading states for increased annual renewable energy for 2012 ......................................................................................................................................... 64

6
Abstract Innovation is a key economic driver and energy is a critical component of our state and national economy. Therefore, energy technology innovation is essential as Wisconsin and the U.S. transition from our legacy high-‐carbon energy economy to an energy economy emphasizing clean technology solutions. Energy technology innovation system approaches are a good way to determine what policy promotes energy innovation and what does not work as well. Research on policies in Europe and around the globe have been successful in measuring policy effectiveness for technology innovation, but have not been applied to U.S. energy policy as frequently. Using the energy technology innovation system approach, this paper considers a wide array of energy policies and potential lessons for Wisconsin and the nation as a whole. This report will outline how the U.S. can focus on energy technology innovation through supportive public policy. Policy Problem Statement Existing national and state energy policies are inadequate or inconsistent in sending market signals to more rapidly advance investment and deployment of clean energy technologies and distributed energy (DE) systems. Under the current energy structure, significant barriers to clean tech energy sources and distributed energy systems remain. As a result, Wisconsin and the U.S. are falling behind in the economic benefits in worldwide growth in clean energy technology innovation solutions. The current energy production and consumption systems control what some call ‘the rules of the game,’ meaning regulations and tax structures favor the status quo and block competition from full participation in the energy marketplace. Similarly, long-‐term investments in existing high-‐carbon energy technologies and the infrastructure to support them, such as large base load plants and electrical grids, create so called carbon lock-‐in or coal lock-‐in. Wisconsin now has coal energy price lock-‐in resulting from high capital costs and long assets life spans from these energy investments. The cost of coal as a commodity used to generate electricity in base load electricity plants could increase annually by 6 percent during the next decade. 1 Wisconsin energy prices have gone up almost every year since 2000 — a trend that will not be reversed long-‐term without greater energy portfolio diversification. Fuel switching to natural gas may help short-‐term. But, as new domestic shale oil discovery and residual natural gas become traded as global commodities the price will rise to meet international demand and Wisconsin could repeat the lock-‐in cycle. Wisconsin must set clearer policy goals including a stronger emphasis on energy portfolio diversification, distributed energy, and new energy technology innovation. For the short-‐term, policy should promote more clean energy technology deployment in Wisconsin and the entire U.S. to achieve energy portfolio diversification. A larger investment in research and development (R&D) and policy to advance energy technology innovation is needed for the long-‐term. In order to address these problems, some individual states and countries around the globe have innovative policies that merit consideration.

7
Goals of This Policy Paper The focus of this report is on Wisconsin and its energy innovation opportunities, but many of the findings and recommendations apply to other states. With the support of a literature review on energy policy and energy sector trends, this report will:
• Demonstrate that achieving a new energy economy built around low-‐carbon clean energy technology will require steady steps of innovation
• Define the energy technology innovation system
• Utilize the energy technology innovation system perspective to evaluate, compare, and contrast policy success in Europe and elsewhere to determine potential policy pathways for Wisconsin and the U.S. to consider
• Evaluate potential ratepayer and investor risk from high carbon legacy energy systems • Describe opportunities for Wisconsin and the U.S. to stimulate new investment and growth in
clean energy technologies for long-‐term energy security.

8
1.0 The Energy World Can Change Quickly The dialogue around U.S. energy policy needs to change because the energy world has already changed and it will continue to do so. Far too often the energy discussion seems stuck between a desire to return to 1950s energy policy where coal was king, and something called the ‘all of the above’ energy policy. Saying our U.S. energy policy is the ‘all of the above’ strategy may be politically expedient in the Washington D.C. ‘beltway’ where status-‐quo energy lobbies dominate the discussion, but this may not be a long-‐term energy strategy. Looking at a few energy trends might be a starting point to find a more positive and focused path forward:
• The percentage of our electricity coming from the greenest sources—non-‐hydroelectric
renewables such as solar, wind, geothermal and biomass—has doubled in just four years to nearly 6 percent. In 2011, renewable generation including hydro made up 13 percent of total
generation.3
• The costs of solar panels have dropped 65 percent in just 18 months.4
• The solar business is currently growing at 30
percent per year.5
• Renewable technologies generally have had higher capital costs than fossil-‐fueled power plants, but their fuel cost is virtually zero, their energy price is locked in for decades, and their capital costs are falling.
• Portugal transformed its electric grid from 17 percent renewable energy sources to 45 percent renewable energy sources in just five years (as of 2010). Germany is now getting 25 percent of its electricity from renewable energy sources – with a remarkable DE system of solar, wind and biogas – there are more than 7,000 anaerobic digesters in
Germany in rural areas.6
• One example of how technology innovation can change the dynamics of the new energy world is the General Electric (GE) product line called FlexEfficiency that allows energy system operators to adjust quickly as energy comes on and off the grid, including a 750-‐megawat combined-‐cycle plant that can vary its output by 100 megawatts in one minute while maintaining an average end-‐to-‐end efficiency of 60 percent. The company says it has $1.2 billion advance orders. This technology can change the so-‐called renewable intermittency issue.7
• U.S. oil import dependency has gone down in recent years—after peaking in 2006 at over 66 percent, overall U.S. oil dependency declined to about 60 percent in 2011. The trend is expected to continue for at least the short-‐term due to aggressive shale gas drilling in the U.S., but globally traded commodities such as oil are subject to the whims of a global market.
Renewable electricity generation doubles from 2006 to 2011, construction is under way on the nation’s first new nuclear plants in decades, and American manufacturers have regained market share in advanced batteries and vehicles. Prices for solar, wind, and other clean energy technologies fell, while employment in clean tech sectors expanded by almost 12 percent from 2007 to 2010, adding more than 70,000 jobs even during the height of the recession.
-‐ Breakthrough Institute, Brooking Institute, and World Resources Institute in the report Beyond Boom and Bust: Putting Clean Tech on a Path2

9
• Natural gas prices in the U.S. went from a high in 2008 of $13 per million British Thermal Units
(mmBTU) and went to record lows around $2 per mmBTU in 2012. While prices are expected to go higher in the long-‐term, they could stay low for the short-‐term with new hydraulic fracturing technology and discoveries. Some debate is now emerging on the long-‐term availability of the newly discovered shale gas, and there is little question that it has changed energy pricing dramatically, with more utilities switching out fuels of coal for natural gas. As more U.S. supplies shift to a global market the natural gas price will likely rise. In addition, new drilling seems focused more on finding shale gas, sometimes even with flaring off the natural gas. The price and available volumes of natural gas going forward is still a very dynamic energy trend without a clear definitive conclusion.
Figure 1: U.S. Electricity Generation by Fuel Type
Long-‐term Energy Goals are Critical An energy technology innovation agenda can move Wisconsin ahead of the pack by placing a higher priority on long-‐term energy goals, measuring progress toward achieving those goals, rewarding adaptability, transparency and clarity policy and rules. A strong emphasis on taking an energy systems approach searching for new technology in energy generation, storage, and distribution can lead to economic growth for Wisconsin. Using the short-‐term opportunity for some fuel shifting to the current lower cost natural gas and a planned steady increase in clean energy technology from renewable sources will help diversify the Wisconsin energy portfolio and allow for investing in greater energy technology innovation. According to a report issued by Google, “Energy Innovation is a powerful tool capable of simultaneously addressing society’s goals of economic growth, enhanced energy security, environmental health, and de-‐carbonization.”8 Policy can do four important things to impact the speed of change to a new energy economy:
1. Create goals 2. Remove barriers 3. Make it cheaper 4. Take an energy systems approach

10
The federal government was the key driver in R&D in hydraulic fracturing aka fracking and advanced drilling technologies for over 30 years.9 The amazing results have been seen in just over the last two years with more and more large scale drilling to get shale oil and gas. Why not have a similar U.S. investment in clean technology that can ‘level the playing field’ for a true energy technology innovation system to advance forward? Wisconsin and the rest of the U.S. are candidates to lead this energy technology innovation agenda. One expert, MIT Professor Richard Lester, sees innovation coming from the states, “Innovation works better with decentralization…innovation happens faster when there is competition between technologies and business models, and ample opportunity for new entrants to compete against incumbent firms. (This is especially important in electricity, where not only startups but also big companies like Apple and Google should be allowed to challenge incumbent utilities with innovative new energy systems and services).”10 Investment Risk A new awareness of long-‐term investment risk with legacy energy systems, particularly coal generation, may need to become a greater part of policymakers and electric generation regulators decision-‐making process. During this historic period of energy system change other policy changes will be necessary to manage adaptation. This paper reviews a wide range of literature and recent studies to evaluate what appears to be working globally and domestically in the policy arena. This paper will suggest that policymakers look more at energy technology innovation opportunities and integrated resource planning in a regulatory setting.
Figure 2: Carbon Lock-‐In (ORNL)
Coal Lock-‐In and Rising Coal Prices Market forces are driving energy system change as some electric utilities and regulators are already re-‐thinking their emphasis on large-‐scale, base-‐load coal system. This re-‐evaluation is driven primarily by coal price economics, high coal shipping costs, environmental and investor risk, and new and coming regulatory changes for high carbon energy systems. Wisconsin remains very dependent on coal, especially with new generation sites opening, making it particularly vulnerable to what some call coal ‘lock-‐in’ resulting from high capital costs and long asset lifespans from these energy investments. Wisconsin ratepayers have already seen more than a decade of rising energy costs, driven primarily by
11
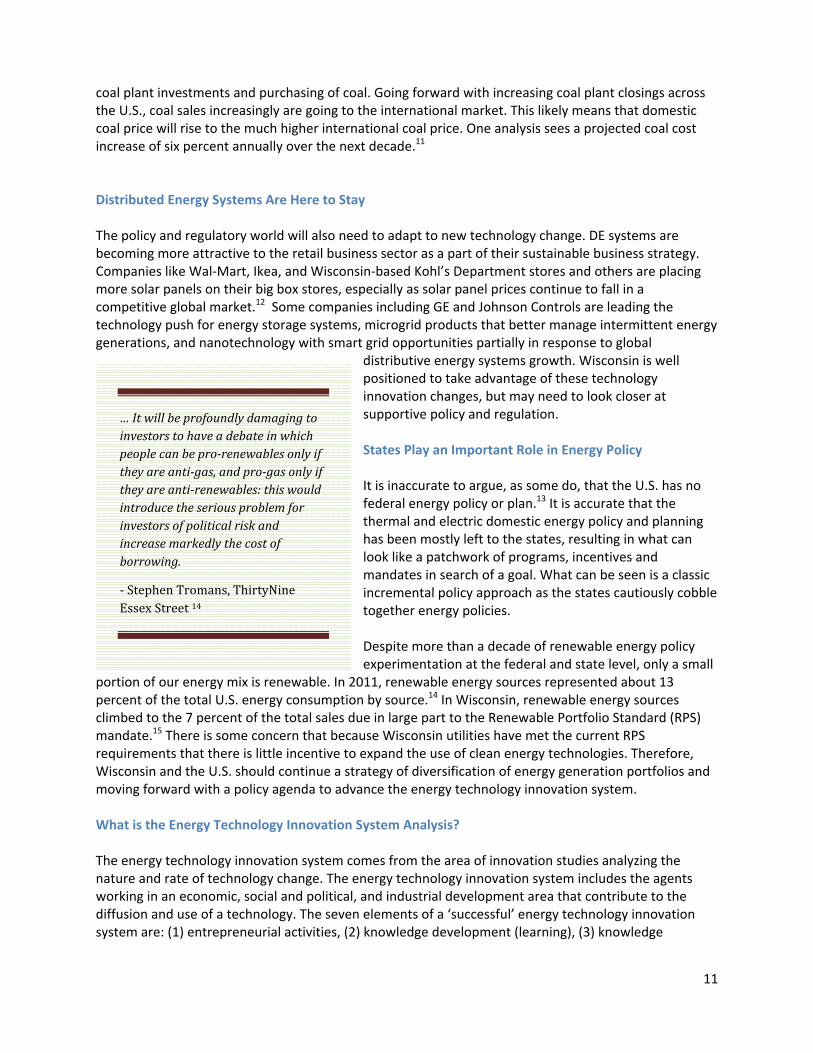
coal plant investments and purchasing of coal. Going forward with increasing coal plant closings across the U.S., coal sales increasingly are going to the international market. This likely means that domestic coal price will rise to the much higher international coal price. One analysis sees a projected coal cost increase of six percent annually over the next decade.11 Distributed Energy Systems Are Here to Stay The policy and regulatory world will also need to adapt to new technology change. DE systems are becoming more attractive to the retail business sector as a part of their sustainable business strategy. Companies like Wal-‐Mart, Ikea, and Wisconsin-‐based Kohl’s Department stores and others are placing more solar panels on their big box stores, especially as solar panel prices continue to fall in a competitive global market.12 Some companies including GE and Johnson Controls are leading the technology push for energy storage systems, microgrid products that better manage intermittent energy generations, and nanotechnology with smart grid opportunities partially in response to global
distributive energy systems growth. Wisconsin is well positioned to take advantage of these technology innovation changes, but may need to look closer at supportive policy and regulation. States Play an Important Role in Energy Policy It is inaccurate to argue, as some do, that the U.S. has no federal energy policy or plan.13 It is accurate that the thermal and electric domestic energy policy and planning has been mostly left to the states, resulting in what can look like a patchwork of programs, incentives and mandates in search of a goal. What can be seen is a classic incremental policy approach as the states cautiously cobble together energy policies. Despite more than a decade of renewable energy policy experimentation at the federal and state level, only a small
portion of our energy mix is renewable. In 2011, renewable energy sources represented about 13 percent of the total U.S. energy consumption by source.14 In Wisconsin, renewable energy sources climbed to the 7 percent of the total sales due in large part to the Renewable Portfolio Standard (RPS) mandate.15 There is some concern that because Wisconsin utilities have met the current RPS requirements that there is little incentive to expand the use of clean energy technologies. Therefore, Wisconsin and the U.S. should continue a strategy of diversification of energy generation portfolios and moving forward with a policy agenda to advance the energy technology innovation system.
What is the Energy Technology Innovation System Analysis? The energy technology innovation system comes from the area of innovation studies analyzing the nature and rate of technology change. The energy technology innovation system includes the agents working in an economic, social and political, and industrial development area that contribute to the diffusion and use of a technology. The seven elements of a ‘successful’ energy technology innovation system are: (1) entrepreneurial activities, (2) knowledge development (learning), (3) knowledge
… It will be profoundly damaging to investors to have a debate in which people can be pro-renewables only if they are anti-gas, and pro-gas only if they are anti-renewables: this would introduce the serious problem for investors of political risk and increase markedly the cost of borrowing.
-‐ Stephen Tromans, ThirtyNine Essex Street 14

12
diffusion through networks, (4) guidance of the search (sometimes including policy goals and targets), (5) market formation, (6) resource mobilization, and (7) creation of legitimacy (counteraction to change). This energy technology innovation system is used for analysis of energy policy that may help or hinder technology advancement or rate of energy technology change in society. A Technology Innovation Strategy Paradigm for the Energy Futures Discussion As the Stephan Troman’s quote shows, policy uncertainty and robust policy debate are occurring around the globe. In this case, the essay was about the debate in Germany around emission standards and the decision to close nuclear plants. This is a fundamental problem in the U.S. energy policy debate as investors don’t know where to put their money as policy zigs and zags and policy uncertainty are ubiquitous. Reframing our public dialogue is a starting point for economic success in a changing energy system. Wisconsin and the U.S. will remain stuck in lower gear if the debate over propping up and subsidizing high-‐cost, high-‐carbon, high-‐risk legacy coal and oil continues, and also similarly if we keep subsidizing renewable energy technology. The challenge is rewarding innovation and diversifying the energy portfolio for the future. Clean technology energy will compete with legacy high-‐carbon energy sources if we had a truly level playing field. Legacy energy companies also have a lot of money to invest. So why not find better ways to get their investment in R&D and more clean technology energy options? It may take new rules or re-‐regulation in the marketplace to make this change. If investments move in the direction of energy technology innovation, there will be a lot of opportunity for businesses to make money and for state economies to grow. Innovation requires R&D and yet energy utilities barely invest in it; some estimates say only about one percent of U.S. energy business revenues go toward R&D.17 By combining a systems approach with a portfolio of technology investments that connect to create a total economic impact puts Wisconsin in a position of advantage for creating a new ball game in energy. Many barriers exist in getting existing energy firms to invest more in R&D and promote innovation. According to the authors of the report, “Beyond Boom & Bust. Putting Clean Tech on a Path to Subsidy Independence,” these existing barriers include: Knowledge spillover risks from private investments in research; the commodity nature of most energy markets, which prevent nascent, higher cost energy technologies from charging a premium; inherent technology and policy risks in energy markets; the financial scale and long time horizon of many clean energy projects; and a lack of wide-‐spread enabling clean energy infrastructure.18 The challenge is breaking down barriers in order to get more focused investments in the private and public sector on energy innovation. Public policy can and must be a part of the strategy for adapting and meeting the challenge of a new energy economy. Promoting and rewarding smart private sector investment and adapting energy systems can be a part of the policy and strategy too. A national trend toward fuel switching from coal to natural gas is occurring now and can open the door to a greater diversification of state energy portfolios. Now is the time to start the dialogue necessary for setting clear energy goals and targets to increase investor confidence and allow utilities and regulators to adapt to change. Allowing high carbon energy lock-‐in to continue will impose a heavy restructuring cost in the future.
13
New energy public policy should position Wisconsin-‐based businesses to get a piece of that $2 trillion market with an 8 percent annual growth. Failure to advance clean energy technology solutions and promote energy technology innovation means Wisconsin business leaders will be left standing at the shores of Superior and Milwaukee wondering why their economic growth ship has not sailed out with products to Europe and Asia. Wisconsin can be a leader or permanently fall behind the energy technology innovation growth curve. Recommendations for an Energy Technology Innovation Agenda Key components of an energy technology innovation agenda include setting clear long-‐term energy goals, measuring progress and rewarding adaptable policy, as demonstrated by the following recommendations:
• Promote greater investment in energy technology R&D, possibly including an energy innovation R&D tax credit.
• Remove regulatory barriers to greater energy efficiency and consider policy steps to advance business and individual behavioral steps toward greater energy efficiency. Wisconsin should consider a specific policy change to allow greater investment, including regulated utilities, in Combined Heat and Power (CHP) systems (see Section 2.4).
• Encourage adaptable energy policies such as Feed-‐
in Tariffs (FiTs) that can include steps such as rate digression as technology efficiencies and cost reduction occur, along with the ability to regularly review rates for adaptation as markets mature (see Section 3.3, 3.4).
• Consider policies that can avoid energy technology lock-‐in such as performance standards
including models such as a low carbon fuel standard (LCFS).
• Encourage short-‐term adaptable policies that help incentivize private sector investment in clean energy technologies. These policies can be described as either demand (market)-‐pull, or technology-‐push. Some technology-‐push policies that can reduce costs for producing clean technologies include government sponsored R&D, tax credits for companies to invest in R&D, enhancing the capacity for knowledge exchange, support for education and training, and funding demonstration projects.20 Some demand-‐pull government policies that increase potential payoffs for successful energy innovations include intellectual property, tax credits and rebates for consumers of new technologies, government procurement, technology mandates, regulatory standards and taxes on competing technologies.21 (see Section 3.3 to 3.7 and Appendix 4 & 5)
The advent of the emerging clean energy economy is driven by economic, environmental and security imperatives. Almost $2 trillion is projected to be invested worldwide in new clean energy resources from 2012 to 2018, and companies and countries are elbowing for market share in an industry with a projected compound annual growth rate of 8 percent.
-‐ The Pew Foundation in the report – Innovate, Manufacture, Compete: A Clean Energy Action Plan. 16

14
• Promote and incentivize new public and private partnerships for both clean technology projects and investments. (see Section 4.3)
• Promote more regional and municipal energy generation incentives.
• Encourage policies and deregulation that allow investor owned electrical utilities (IOUs) to be
business partners in DE clean technologies and mitigating loss of market share (see Section 2.6).
• Create “re-‐regulation” which means removing regulation that stifles technology innovation and re-‐engineer selected rules of the road to create an adaptive ecosystem and adaptive socially responsible marketplace.
• Encourage integrated resource planning of regulated utilities (see Section 4.0).
• Gather data on policy effectiveness for a
continuous evaluation process while maintaining policy consistency by setting clear short-‐term and long-‐term energy goals such as targets for a specific amount of distributive energy generation or overall carbon reduction over a period of time (see Section 4.2).
• Create linkages to energy regulation and reforms and clean technology energy financing and investment authorities (see Section 4.3).
1.2 The Energy System in Wisconsin Wisconsin is a regulated electrical service state via the Public Service Commission (PSC), and limited biofuels policy falls under several state agencies:
• Wisconsin has little regulation of transportation fuels/energy or thermal energy for facility heating and process heat.
• Relevant policies date to the era of Rural Electrification and the broad acceptance of fossil fuels for transportation. The Wisconsin energy policies and rules need updating and adaptability.
• Around the U.S. and globally, innovations are happening in business models and policies on
energy and fuel production. These innovations have gained momentum and acceptance since early 2000.
• Policy uncertainty and effectiveness are impeding investment, job creation and innovation.
• Federal concerns regarding the security of energy prices, energy supplies, energy storage and distribution have increased in importance since 2001. The Department of Defense (DoD) and Federal Homeland Security are playing a large role in addressing change in the energy world.
The Oil and coal have built our civilization, created wealth, enriched the lives of billions. Yet, their rising costs to our security, economy, health, and environment now outweigh their benefits. Moreover, that long-awaited tipping point—where alternatives work better than oil and coal and compete purely on cost—is no longer decades in the future. It is here and now. And it is the fulcrum of economic transformation.
-‐ Amory B Lovins in the book Reinventing Fire 17
15
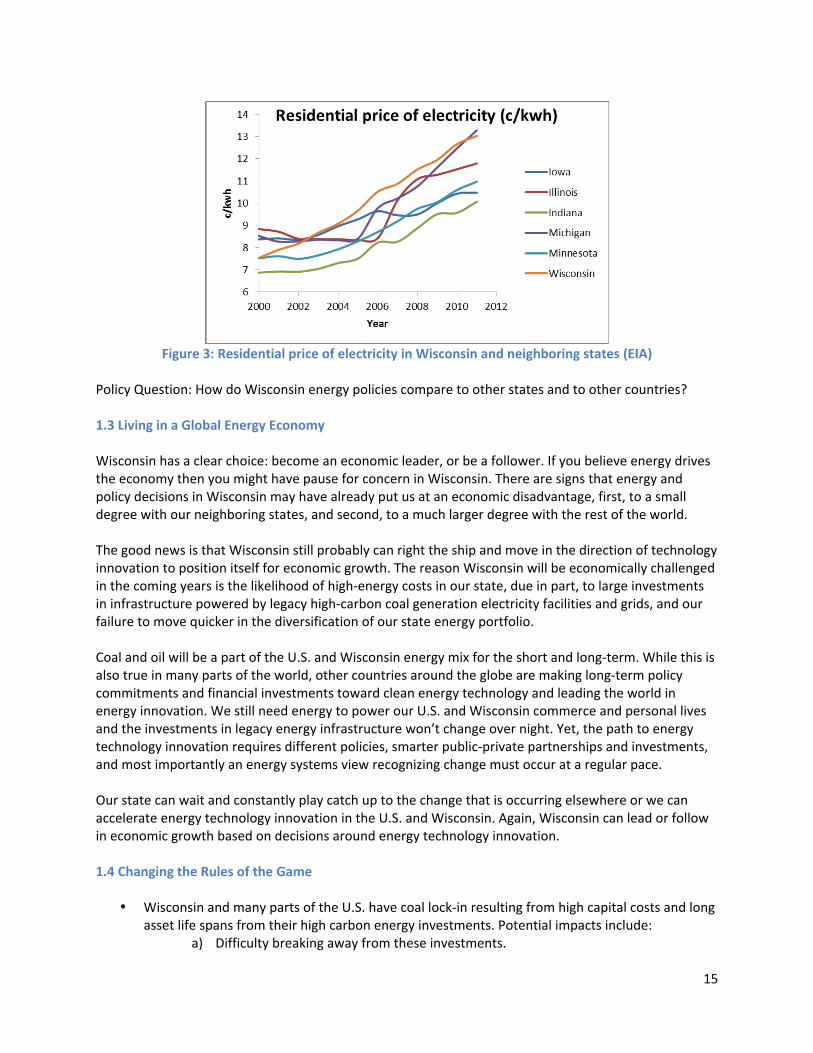
Figure 3: Residential price of electricity in Wisconsin and neighboring states (EIA)
Policy Question: How do Wisconsin energy policies compare to other states and to other countries? 1.3 Living in a Global Energy Economy Wisconsin has a clear choice: become an economic leader, or be a follower. If you believe energy drives the economy then you might have pause for concern in Wisconsin. There are signs that energy and policy decisions in Wisconsin may have already put us at an economic disadvantage, first, to a small degree with our neighboring states, and second, to a much larger degree with the rest of the world. The good news is that Wisconsin still probably can right the ship and move in the direction of technology innovation to position itself for economic growth. The reason Wisconsin will be economically challenged in the coming years is the likelihood of high-‐energy costs in our state, due in part, to large investments in infrastructure powered by legacy high-‐carbon coal generation electricity facilities and grids, and our failure to move quicker in the diversification of our state energy portfolio. Coal and oil will be a part of the U.S. and Wisconsin energy mix for the short and long-‐term. While this is also true in many parts of the world, other countries around the globe are making long-‐term policy commitments and financial investments toward clean energy technology and leading the world in energy innovation. We still need energy to power our U.S. and Wisconsin commerce and personal lives and the investments in legacy energy infrastructure won’t change over night. Yet, the path to energy technology innovation requires different policies, smarter public-‐private partnerships and investments, and most importantly an energy systems view recognizing change must occur at a regular pace. Our state can wait and constantly play catch up to the change that is occurring elsewhere or we can accelerate energy technology innovation in the U.S. and Wisconsin. Again, Wisconsin can lead or follow in economic growth based on decisions around energy technology innovation. 1.4 Changing the Rules of the Game
• Wisconsin and many parts of the U.S. have coal lock-‐in resulting from high capital costs and long
asset life spans from their high carbon energy investments. Potential impacts include: a) Difficulty breaking away from these investments.

16
b) Higher energy prices for a longer period of time. c) Stifled investment in new energy technology innovation.
• Coal as a commodity used to generate electricity in base load electricity plants may increase
annually by 6 percent per year (or two percent more than the rate of inflation, whichever is greater) over the next decade given trends with coal transportation costs, operations and infrastructure costs, and new environmental compliance of aging plants. Future impacts include:
a) Increasing ratepayer burden and added constraints on business growth. b) Limited capital for new clean energy technology investments.
• Wisconsin energy prices have gone up every year since 2000 and the trend will not be reversed
until energy portfolio diversification occurs.
• Citizens of Wisconsin and the U.S. subsidize significant public health and environmental damage costs of burning coal – paying somewhere between two to twenty times as much for these external costs of coal compared to other energy generating sources. Potential spillover effects include:
a) Ratepayers and some businesses paying too much for high carbon energy. b) Limited investment in clean energy technology when high carbon energy receives
massive subsidies for the high public costs of high carbon energy health and environmental damage.
• Wisconsin and most states in the U.S. do not adequately address risk in regulating the energy utility sector (see Section 3.4). Steps to address risk in the energy utility sector include:
a) Having regulators use expanded or enhanced integrated resource planning. b) Diversifying energy resource portfolios rather than ‘betting the farm’ on a narrow
set of options. c) Placing a greater emphasis on clean energy technology including wind, solar,
biomass, and biogas. d) Placing more emphasis on energy efficiency, which is the lowest cost and lowest risk
option.
• The federal government was the key driver of R&D in hydraulic fracturing and advanced drilling technologies for over 30 years and a similar investment in clean technology can ‘level the playing field’ for true energy technology innovation to advance. Lessons learned from technology investment in hydraulic drilling include:
a) Government investment and support for new energy technology can work and is critical to commercialization of innovation. Now is the time to have a similar government investment and support for clean energy technology innovation.
• Fuel switching to natural gas may help short-‐term, but as this new domestic shale oil discoveries and residual natural gas are traded globally the price will rise to the international price. Diverse energy portfolios will matter more in the future because:
a) We don’t know how much natural gas is available for the future and it could be less than currently projected.
17
b) Natural gas as an energy commodity has historically been volatile and price will definitely go up in the future, especially if shale oil and gas are traded on the international markets. The U.S. utilities are repeating history with coal lock-‐in by creating a natural gas lock-‐in scenario. The ratepayer and investor will be the loser in this scenario.
• Solar and wind energy – which have no cost for the generation source – have dramatically fallen in price as a technology. Wisconsin and other states can be leaders in waste-‐to-‐energy solutions such as anaerobic digesters creating biogas for energy solutions in electricity, heat, pipeline quality gas and compressed natural gas for vehicles. Wisconsin may not be a leader in wind and solar energy, but it could take advantage of the falling prices in this sector to diversify its energy portfolio. Likewise, Wisconsin could have a lot more solar energy generation given the lessons from Germany with its global leadership in solar power installations. Finally, Wisconsin can be a biogas energy leader, a combined heat and power leader and a microgrid unit and energy storage leader.
• Wisconsin and many parts of the U.S. need to recognize that there is a changing paradigm in the
customer relationship in the energy sector: a) Some of the strongest change in the electricity sector is coming from customers. For
example, Wal-‐Mart, IKEA, Kohl’s are leaders with sustainable business programs and solar panels on their store roofs.
b) Other customer driven changes such as demand response programs and energy efficiency programs will continue and grow.
c) The business model for distributed energy generations will grow. d) The advent of technology around microgrid systems, combine heat and power,
energy storage and others will drive change. 1.5 The Big Energy Challenge: How to Create a Sustainable Future Maintaining a sustainable future for Wisconsin and the U.S. requires facing many challenges, particularly with our energy system. To keep the next generation prosperous and able to enjoy the high quality of life available to many will require an energy system needing changes in how energy sources are extracted, processed, generated and used across a large supply chain. Many current energy uses are strongly tied to processing that requires large quantities of water, adversely impacts our air quality, and results in too high a volume of greenhouse gas emissions, to name just a few major issues. It is going to take innovation to create better energy systems and the technology of the future. All of these challenges in the energy system will require better efficiency and less polluting of our environment while staying relatively affordable. Energy technology innovation can meet these challenges, but will require supportive public policy, economic support during critical early stage market development. This paper will look at an energy technology innovation system as the paradigm for consideration of public policy. Using a systems perspective, i.e. trying to address the whole problem, and considering how innovation must consider all aspects of energy (supply and demand); all stages of the technology development cycle; and all innovation processes, feedbacks, actors, institutions and networks, points to many changes on the horizon. Wisconsin and the U.S. must act now and must be adaptable going forward versus building barriers and resisting change.
18
In recent years, many scientific studies have increased global concerns about the severity of the adverse environmental impacts of greenhouse gas emissions. There is a growing understanding that emissions of greenhouse gases (GHG) will need to be reduced in order to mitigate the impacts of climate change.23 The most prevalent source of GHG emissions in the U.S. is carbon dioxide from fossil fuel combustion, contributing over 94 percent of the U.S. emissions in 2009, according to the U.S. Environmental Protection Agency (EPA).24 The electric power sector is the leading source of carbon dioxide emissions – in 2009 emitting 2100 million metric tons (Mt) of carbon dioxide through the generation of electricity, accounting for 39 percent of overall carbon dioxide emissions and 42 percent of emissions from fossil fuel production, according to the U.S. EPA.25 Policymakers in Congress have failed to take any action to get the electric power sector to reduce these GHG emissions. Likewise, there are many more clean
energy low-‐GHG-‐emitting technology solutions for energy generation, but their adoption is limited be the current energy production and consumption systems controlling the rules of the game in the marketplace. A carbon tax would be the policy to help level the playing field in the energy sector, but it appears highly unlikely that the U.S. Congress will act on meaningful GHG reduction policy in the near future. In lieu of more direct policy action, the development of energy technology innovation becomes more critical to balance the environmental factors, economic factors, and security factors that shape up energy policy in Wisconsin and the U.S. as a whole. “There are at least three motivations for government intervention in GHG mitigation:
1) Inducing the private sector to reduce GHG emissions directly by setting a price on emissions.
2) Increasing the amount of innovative activity in GHG mitigation technology development.
3) Educating the public regarding GHG reducing investment opportunities, allowing consumers to make better private decisions.”26
1.6 Future Impacts of Wisconsin Legacy Energy Trends Wisconsin ratepayers and investors need to monitor how energy planning and utility decisions made in the past
decade create risk and technology lock-‐in. The cumulative pattern of Wisconsin energy decision-‐making both on the private sector utility side and the past public equation indicates some degree of concern:
1) To address concerns in the 1990s and early 2000 about energy reliability (enough energy for primarily large industry needs) the state went on a large coal generation building campaign. This included the We Energies Oak Creek Power Plant – the biggest construction project in state history that went 8 percent over budget. The extra $177.6 million for the power plant, tacked onto a $2.191 billion was recently a part of the rate case before the Wisconsin PSC. The
… Existing companies in energy-related industries—those that produce energy, those that manufacture the equipment that produces, converts, and uses energy, and those that distribute energy—can have substantial incentives to delay the introduction of new technologies. This can happen if their technologies are more profitable than the new ones that might be (or have been) invented, or if they are in explicitly (oil and gas) or implicitly (electric generation equipment producers and automakers) oligopolistic industries, or if they are imperfectly regulated (electric and gas utilities).”
–John Weyant in Accelerating the development and diffusion of new energy technologies: Beyond the valley of death 20

19
commission on Nov. 27, 2012 granted We Energies most of what they asked for in a rate increase reducing it by a small amount. Customers in the We Energies service area have seen rate increases since 2005 due primarily to the Oak Creek Power Plant construction.28
2) Just a few weeks earlier on October 22, 2012 Dominion Resources Inc. announced its plans to permanently close the 556-‐megawatt Kewaunee nuclear generation plant. The facility that currently generates about five percent of the electricity that originates in Wisconsin was primarily closed due to the company’s inability to secure long-‐term power purchase agreements. Among the factors in the marketplace today is that natural gas prices remain low and utilities seem confident that supplies will remain strong. But there is some strong risk in the calculation that natural gas will remain cheap and abundant.29
3) The Wisconsin Public Service Commission announced that Wisconsin electricity providers have
met the state Renewable Portfolio Standard (RPS) mandating a 10 percent renewable target by 2015.The law passed in 2006 was met primarily with utilities purchasing out of state wind power (43 percent), Wisconsin hydropower (19 percent), Wisconsin wind (16 percent), Wisconsin biomass (14 percent), and about a 9 percent total of non-‐Wisconsin hydro (5 percent), non-‐Wisconsin biomass (3 percent) and non-‐Wisconsin solar (<1 percent) and final Wisconsin solar was (<1 percent). With the state mandate met, and current state energy reserves projected to remain above 11.6 percent through 2018, the Wisconsin regulated utilities desire to acquire more renewable generation will be minimal to none.30
4) Wisconsin energy rates are the highest in the Midwest states and have climbed every year for over a decade. That energy rate increase trend will likely continue for Wisconsin because of the high cost of coal, over-‐building of coal plants that must now be paid for over the next 20-‐30 years, large investments in transmission lines that will be paid for over time, and other factors. For Powder River Coal coming to Wisconsin the transportation cost represents about 55 to 65 percent of the total delivered costs per ton, according to the Public Service Commission. These high transportation costs are due, in part, to what is called ‘captive rail,’ meaning U.S. rail monopolies have little competition especially for shorter runs such as Wyoming/Colorado to Wisconsin where much of our coal comes from. Likewise, diesel fuel costs are high and all transportation is subject to volatile fuel costs.31
The summer of 2012 was extremely hot for Wisconsin and the entire U.S. Much of the country saw these bouts of heat and drought place pressure on utilities (it takes a lot of water to make energy). There is uncertainty about how climate adaptation and energy planning dovetail, but at this point little is being done. Extreme weather results in power outages — witness the East Coast and Hurricane Sandy effects — and these outages have major impacts on the economy. The stress on water resources such as delivering and treating clean drinking water, combined with providing safe sewerage and waste water treatment systems, will also require high energy demand and may further test the energy production system.32
5) The silver bullet solution may not be natural gas despite Wisconsin utilities betting heavily on it. One certainly can hope natural gas stays low and all energy users benefit to some degree from the current low price. But some factors point to natural gas not always being a low cost option:
a) Historic commodity pricing, including natural gas, shows what goes down must come up and vice versa. In 2008 U.S. natural gas prices were extremely high and in 2012 there were record low prices.

20
b) The U.S. currently is over-‐producing natural gas and that has driven the price to historic lows. That won’t continue since drilling companies have been losing money all year and at some point investors want to recoup money. Higher natural gas prices are the only way to recover these investments or the companies go under.
c) If the U.S. shale gas is sold on the international market, then the price will go up to the much higher international price.
d) Drilling companies have shifted to drilling more for shale oil versus shale gas. That would reduce the gas supply and shale oil is traded on the global market.
e) Increasing regulation on hydro-‐fracking will potentially increase costs. f) It is possible that natural gas is not as abundant as some project. The U.S. Geological
Survey (USGS) did re-‐estimate the Energy Information Administration (EIA) amount of undiscovered technically recoverable natural gas in the Marcellus Shale formation by 80 percent. These large discrepancy estimates have prompted debate over strategic energy planning. One reason is the dramatic fall in shale gas well production as soon as one year after a well is drawing gas, falling between 50 and 60 percent. It is a dynamic market with many unresolved questions.33
1.7 Other Important Factors for Wisconsin Energy Policy Wisconsin may be locked in to higher energy prices because of our over dependence on coal energy generation and misguided energy planning in the past. The Wisconsin PSC issued its final Strategic Energy Assessment in November 2012. The report documents that Wisconsin has not only seen steady increases in electrical energy costs over the last decade, but that residential, commercial and industrial rates are higher than the seven surrounding Midwestern states. Three big energy costs drivers over the last decade are coal generation costs, building too many coal plants and transmission line upgrades. There are also lesser factors impacting costs including overall sales decline, primarily due to the economic downturn, and regulatory requirements.34 The Wisconsin RPS has had a negligible impact on rising prices, possibly one percent or less.35 Further, more than half the renewable energy sales were from other states in 2011, according to the PSC. Looking forward to potential energy costs for Wisconsin, the news is not good. One recent study says that greater financial risk must be built into coal plant operations and related energy generation costs. According to the Sierra Club, “Domestic coal costs will rise to international coal prices over the next 10 years and that international coat costs will increase at the rate of at least 6 percent per year (or two percent more than the rate of inflation, whichever is greater).”36 These probable price increases do not include the health and environmental costs associated with coal plants. Another study also places Wisconsin high (top seven nationwide) for the number of costly coal plants that should be considered for closing. Wisconsin may have 18 coal generators with a 2,450 MW capacity that are costly facilities that should be considered for closure. While this was the study’s high estimate, Wisconsin only went down to the eighth position in its low estimate for costly coal plants.37 Shipping of coal is a major cost factor and with overall high-‐energy prices these costs will not likely go down. Wisconsin utilities could roll the dice and hope they are not going to be subject to future regulation proposed by the Environmental Protection Agency (EPA) although that would not be prudent. Shifting to natural gas generation may help short-‐term to lower some of Wisconsin’s energy costs, but as a historically volatile commodity natural gas is not a long-‐term guaranteed savings. Global natural gas
21
prices remained high throughout the time period that the U.S. saw low prices. The over drilling investments are showing signs of losing money already. The pressure to sell internationally will grow and that alone could send up U.S. domestic natural gas prices. If natural gas prices remain low, then of course Wisconsin utilities should try to take advantage of that price point. One could also argue that is the perfect time to diversify the Wisconsin energy portfolio with a larger use of renewable energy sources. Another reason why a diverse energy portfolio makes sense for the U.S. and individual states is the concept of a hedge against fossil fuel price shocks going forward. A study done in the United Kingdom concludes that greater use of clean tech energy sources could reduce fossil fuel price shocks by 50 percent.38 The report, “Fossil fuel price shocks and a low carbon economy,” notes that when oil prices rose to nearly $150 barrel in mid-‐2008 it impacted the prices of all products and had a crippling economic effect –the impact of 50 percent increase in oil and gas prices reduced the overall gross domestic product by a full one percent by 2010. For their study the authors model both reductions in high carbon oil and coal, including a reduction in coal use by 50 percent. Various clean tech energy options such as wind, solar and biogas are basically
low to zero cost fuels and therefore result in a significant hedge on coal and oil price increases, and the conclusion that. “Hedging against fossil fuel price shocks is a compelling reason to ensure sustained investment in developing domestic renewable energy sources.”39
1.8 The True Cost of Electricity The true cost of electricity is a topic that will likely generate a fair amount of debate, yet it is not a topic that can be ignored. Although they are sometimes difficult to document, some electricity cost calculations include subsidies and some are hidden in obscure sections of the tax code or administrative rules. Similarly, many argue
that society pays the bill for external costs of electricity environmental damage and health care costs from well-‐documented high-‐carbon air pollution. There is little question that long-‐time infrastructure investments in coal plants, electrical grid connections and other structures always advantage incumbent technologies. Further, a regulated utility business model allows for large investments that can have ratepayers cover the costs over a significant time period and the utility can always ask regulators to cover cost over-‐runs. The bottom line is that all energy sources get some kind of subsidy; it can just vary by type of subsidy, longevity, and of course size of cost buy-‐down. Policymakers constantly weigh tradeoffs in policy decisions and the future of energy investments have their good and bad factors to consider. A recent report titled, “The True Cost of Electric Power” by the Center for Energy Economics and Policy reviews a large number of studies and attempted to document relevant factors impacting cost.41 Three categories of studies were reviewed: primary studies that were either local or regional on the benefits or liabilities of a power plant; benefit transfer studies that adapt engineering, health, environmental, or economic data from one energy site compared to another energy site; and meta-‐studies that look across on the literature and show directionality the likely result of any attempt to estimate the true costs.
Oil subsidies in the United States started in 1917. One hundred years is a long enough time. You don’t want to go with the idea that you’re going to be subsidizing any industry forever.
–Steven Chu, former US Secretary of Energy 27

22
The authors note that market prices (what many use to compare costs between traditional energy generation and renewable generation) don’t take into account external costs to society. Because these are real costs to society and energy generation costs are passed onto to society in terms of utility rate payments, the authors determine that these are “true costs” of energy (either an abatement cost or damage function cost). The data from the numerous studies were then modeled to assist regulators in planning for new energy investments and understanding operational cost of existing utility facilities.42
Figure 4: Levelized Cost of Electricity (The Breakthrough Institute)
Some consistent findings in looking across all the cost of electricity studies did emerge, including a ranking order for fossil fuels. The coal fuel cycle is more damaging than the oil fuel cycle and the oil fuel cycle is more damaging than the natural gas fuel cycle. Coal was in one study 20 times higher in damages than oil on the upper end.43 Another study found what economists call a “shadow price” of $6.90—$27.80 per ton of carbon dioxide (CO2) if climate change is included in the calculations of damages. A little more consistently across the studies, the external cost of coal was twice that of natural gas, suggesting that coal external costs might translate as eight cents higher than private market costs for coal.44 Studies in Europe cite coal external costs as even higher amounts. Over a range of 63 external costs estimates in published reports the median values found hydropower, wind power and solar power had the lowest external costs of renewable non-‐carbon energy sources. Biomass power had the highest external costs of renewable sources places about equal to carbon-‐based natural gas energy sources. When the externalities are included in the analysis the cheapest energy sources in the world currently are wind power and solar power, at least according to one report, which states that, “One kilowatt hour(kWh) of electricity produced by wind power stations on the coast or in the countryside costs an average (of about $0.09) of 0.07 euro.”45
23
New solar plants in central and southern Europe produce electricity for an average (of about $0.12) of 0.14 euro per kWh. Solar parks in Germany are even cheaper at about 0.10 euro per kWh.46 Like any set of studies there are some limitations and areas needing further study. The location of an energy generation facility, such as a coal plant in a city, can significantly increase the health and environmental damage calculation versus a rural or more remote site. Variation also involves the damage pathways and ultimate endpoints, the pollutant burdens included in any specific study, and the degree to which estimates of damages to occupational and public health throughout the fuel cycle are calculated. The latter factor could be very significant for future studies using fracking to produce natural gas. This type of analysis should be used in energy regulations planning and permitting for new utility investments or upgrades for environmental compliance. New regulations often have reach back to address emissions at existing facilities as well as new facilities. These studies show why utility regulators must consider risk in cost analysis.47 1.9 Understanding Risk in the Electric Utility Sector According to a recent report, better calculations of risk are needed when electric utility regulators evaluate upgrades, expansions or new electrical facilities. In the report, “Practicing Risk-‐Aware Electricity Regulation: What Every State Regulator Needs to Know,” risk is defined as addressing the expected value of potential financial loss. Higher risk means an increasing likelihood of financial loss.48 Making sure tthe risk calculation is included in electric sector regulators evaluation of energy projects takes on a greater importance given the long-‐term payment of utility investments and the new for more infrastructure investments in the U.S.49 Many factors of change are occurring in the electric and gas delivery systems in the U.S. and one of the most significant is the shifting of higher costs in the fossil fuel price futures. Other factors that will influence change in the utility sector include smart grid and consumer technologies, the increasing demand for energy efficiency, and the growth of distributed energy renewable sources. Risk comes about when there is the probability that potential harm from an adverse event can occur and it includes both cost-‐related risk and time related risk. Cost-‐related risk includes:
• Construction costs higher than anticipated, • Availability and cost of capital underestimated, • Operation costs higher than anticipated, • Fuel costs exceed original estimates. • Investment so large that it threatens a firm, • Imprudent management practices occur, • Resource constraint (e.g. water), • Rate Shock: regulators won’t put costs into rates.
Time-‐related risk includes:
• Construction delays occur, • Competitive pressures; market changes, • Environmental rules change, • Load grows less that expected; excess capacity,

24
• Better supply options materialize, • Catastrophic loss of plant occurs, • Auxiliary resources (e.g. transmission) delayed, • Other government policy and fiscal changes.50
The report points out that utility investors are probably the most vulnerable to the financial impacts of not addressing risk because regulators are less likely to place all the burden on cost recover onto the rate-‐payers. Still, everyone is vulnerable to decision-‐making by regulators who ignore risk. As the authors of “Practicing Risk-‐Aware Electricity Regulation” state: Ignoring risk is not a viable strategy. Regulators (and utilities) cannot avoid risk by failing to make decisions or by relying on fate. Following a practice just because ‘it’s always been done that way,’ instead of making a fresh assessment of risk and attempting to limit that risk, is asking for trouble.51
Making matters more complicated for this necessary change to risk assessment in regulated energy utilities are long-‐term biases built into this system. Some of these biases include the bigger-‐is-‐better syndrome of past utility business models, which holds that building large base load generation facilities is how they make their best money. This blinds utility management, and sometimes regulators, to smaller scale resources, distributed resources or programmatic solutions to energy efficiency. Another bias cited in this report is the throughput incentive which means the utility business model and “rules of the game” regulation of utilities drive the motivation to sell more electricity and ignore efficiency.52 There are several more institutional biases summarized in the report to regulators. The authors of the study then look at energy resources for generation and evaluate them for risk exposure. The study took the lists from above on cost-‐risk and time related risk and compressed them into a smaller subset. A ranking was used, with zero being no risk and four being a very high risk, to compare the relative costs and risks of new generation sources. One big challenge coming for regulators is the question of approving pollution controls to keep a plant running in the face of future EPA regulations or to close the plant. Regulators are urged in the report to use the integrated resource planning (IRP) and require utilities to present multiple scenarios of cost and risk in closing a coal plant. Wisconsin regulators do use a variation of the IRP in their various analyses of regulated utilities. An improved IRP is recommended (see Section 4.0 of this paper).
25
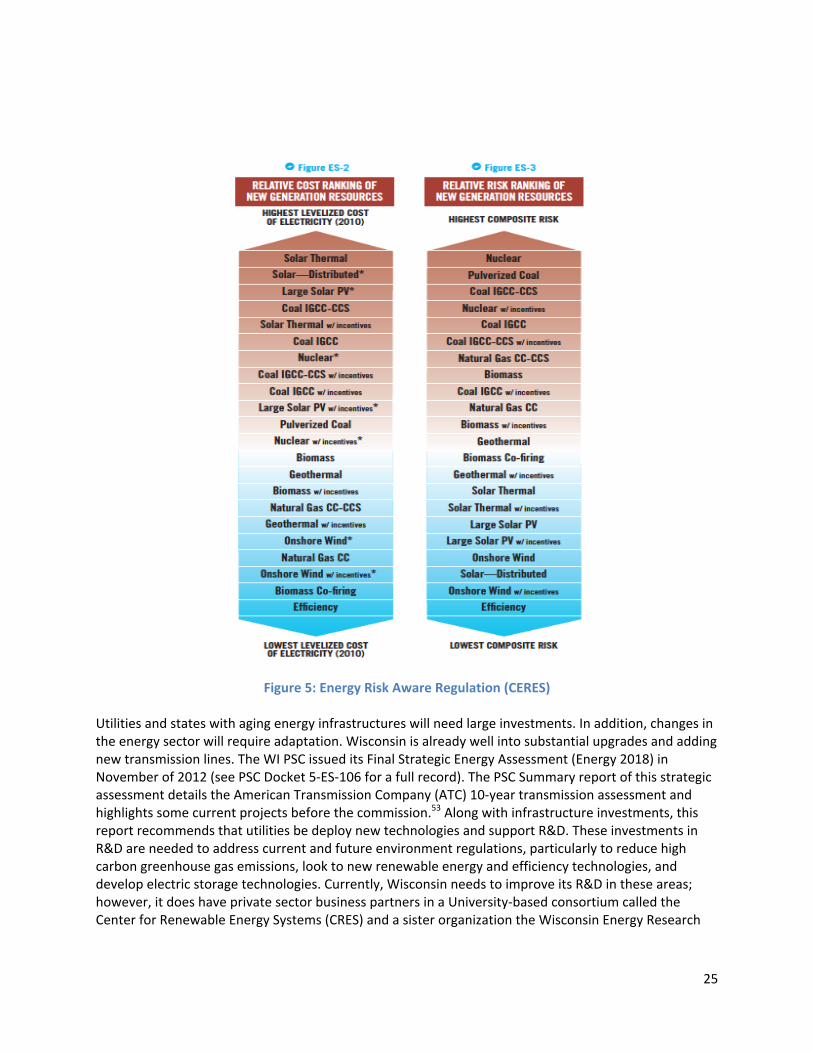
Figure 5: Energy Risk Aware Regulation (CERES)
Utilities and states with aging energy infrastructures will need large investments. In addition, changes in the energy sector will require adaptation. Wisconsin is already well into substantial upgrades and adding new transmission lines. The WI PSC issued its Final Strategic Energy Assessment (Energy 2018) in November of 2012 (see PSC Docket 5-‐ES-‐106 for a full record). The PSC Summary report of this strategic assessment details the American Transmission Company (ATC) 10-‐year transmission assessment and highlights some current projects before the commission.53 Along with infrastructure investments, this report recommends that utilities be deploy new technologies and support R&D. These investments in R&D are needed to address current and future environment regulations, particularly to reduce high carbon greenhouse gas emissions, look to new renewable energy and efficiency technologies, and develop electric storage technologies. Currently, Wisconsin needs to improve its R&D in these areas; however, it does have private sector business partners in a University-‐based consortium called the Center for Renewable Energy Systems (CRES) and a sister organization the Wisconsin Energy Research

26
Consortium (WERC). Two priority areas for these Wisconsin organizations are microgrid research and development and energy storage. Another risk driver is utility investment in the “natural gas outlook.” Wisconsin and many other utilities have been making a lot of investment decisions on moving toward natural gas due to the current low prices. Shifting large amounts of energy generation to natural gas may involve some risk as well. The authors of the report, “Practicing Risk Aware Regulation,” indicate some concern with the long-‐term trend of natural gas prices, noting: In January 2012, the U.S. Energy Information Administration (EIA) sharply revised downward its estimates of U.S. Shale gas reserves by more than 40 percent and its estimates of shale gas from the Marcellus region by two-‐thirds. Reduced long-‐term supplies and a significant commitment to natural gas for new electric generation could obviously lead to upward pressure on natural gas prices. 54
There are many valuable recommendations in this report for regulators. Some simple key takeaways concerning safe investment strategies include:
• Diversifying energy resource portfolios rather than ‘betting the farm’ on a narrow set of options (e.g., fossil fuel generation and technologies and nuclear),
• Emphasizing renewable energy resources such as onshore wind and distributed and utility-‐scale solar,
• Emphasizing energy efficiency, which the report
shows is utilities’ lowest-‐cost, lowest risk resource.55
Potential Reach of U.S. Coal Plant Closures Studies indicate that coal plant closures could make Wisconsin among the most vulnerable states to future
trends. Nearly a quarter of the nation’s coal power generation capacity could shut down by 2035, according to the U.S. Government Accountability Office (GAO).56 The GAO, which is the auditing and evaluation arm of the U.S. Congress, issued a report in October 2012 stating that the power industry could retire between 15 percent and 24 percent of its coal-‐fueled power generation capacity over the next 22 years. The report notes that the two big trends affecting power company decision-‐making are the changing environmental regulations and shifts in the market conditions such as the decrease in the price of natural gas. It also points out the EPA has documented that coal used to generate electricity is associated with health and environmental concerns such as emissions of sulfur dioxide, a pollutant linked to respiratory illnesses, and carbon dioxide, a greenhouse gas. Overall, coal’s share to electrical generation nationwide has dropped from 50 percent in 2002 to 42 percent in 2011.57 If producing energy from natural gas sources is compared to producing energy from coal, how do the economic scenarios play out for the future? The Union of Concern Scientists (UCS) recently completed a
Wisconsin’s recent price increases (2000-2009) were due to three main factors: higher fuel costs, the building of new electric generation, and transmission upgrades…With over 60% of the state’s electricity generated at coal-burning units, Wisconsin ratepayers are more impacted by rising coal prices than those in states where less coal is used. Recent volatility in coal purchasing and transporting cots has been a significant factor in rising prices here.
–Wisconsin Taxpayer Newsletter 32

27
study evaluating the future of coal plants when factoring in the price of natural gas and environmental regulations to protect public health.58 In their modeling, a low and a high scenario were used in the evaluation to determine coal plants that might be candidates for closing. The study found that in the high estimate 353 coal generators were candidates for closing and 153 coal generators were candidates for closing in the low estimate. This would represent a nationwide reduction in the high estimate of 59 GW for 6.3 percent of total U.S. electricity consumption or the low estimate of 16.4 GW or 1.7 percent of total U.S. electricity consumption. More than 70 percent of the goal generation facilities that feel into the studies ripe for closing category lacked at least three of the four major pollution technologies that reduce mercury, soot, sulfur dioxide, or nitrogen oxides.59 Midwestern states of Wisconsin, Indiana and Ohio all have uneconomical coal generation, while Michigan may be in the top five U.S. states for most-‐coal plant retirements. Wisconsin ranked seventh in the nation as most “ripe-‐for-‐retirement” coal generation states with 2,450 MW capacity, average on line year of 1962, and average capacity factors of 47 percent. 60 When this analysis was combined with Wisconsin’s eight coal generators and 377 megawatts already announced for closure, the state ranked 14th in the nation by total capacity as vulnerable to closure.61 The UCS report also had some words of caution about the shift from coal to natural gas. The authors noted that between 2000 and 2008, nearly 260 gigawatts (GW) of new natural gas power plant construction had occurred in the U.S., representing a 28 percent increase in natural gas use. As the report concludes: This increase in natural gas use, which was larger than in any other sector, contributed to monthly wholesale natural gas prices of more than $11 per million Btu in 2005 and 2008. Uncertainties in the size of available supplies combined with potential increases in natural gas demand for electricity, heating, factories, vehicles, and exports could put significant upward pressure on natural gas prices in the future.62
Figure 6: Age and capacity of electric generators by fuel type (EIA)
2.0 Causes of Coal Plant Retirements The trend toward more coal plant closures is not new; closures began in the early 2000s and continue today. While the trend will likely escalate going forward, many factors combined to increase the number of coal plant retirements, especially in the past few years. Some in the industry point to regulations
28
issued by the EPA as the primary reason for plant closures, but a recent paper by Sue Tierney, “Why Coal Plants Retire,” documents that economic factors trump regulation: A closer examination of the facts reveals that the recent retirement announcements are part of a longer-‐term trend that has been affecting both existing coal plants and many proposals to build new ones. The sharp decline in natural gas prices, the rising cost of coal, and reduced demand for electricity are all contributing factors in the decisions to retire some of the country’s oldest coal-‐fired generating units. These trends started well before EPA issued its new air pollution rules.63 The author notes that the price difference between coal and natural gas is the biggest factor in the economic motivation for a utility to retire an aging coal plant. Natural gas prices briefly in the 2012 went below $2.00/mmBTU and the natural gas price in 2010 was $4.37/mmBTU and dropped in 2011 to $3.98/mmBTU.64 This contrasts with a steady 10-‐year increase in delivered coal prices to the electric power sector including a 5.8 percent hike from 2010 to 2011. Coal exports have been a factor in keeping the price high when demand declined, but some Wisconsin utilities may have seen periods where coal prices were lower than the overall national price averages.65 According to Sue Tierney, “The tighter price differentials between natural gas and coal in recent years have squeezed the financial performance of many coal plants, especially the older and less efficient ones.”66 Other factors including electricity demand decreases, related to a sluggish economy and mild winters in places such as the Midwestern states impacted the price market. The author of the report does acknowledge that new EPA regulations will put financial pressure on coal plant operators (although regulated utilities (IUPs) can seek rate increases due to regulation). Still, these economic factors relative to electricity demand, low natural gas prices compared to coal, and for Wisconsin transportation cost relating to shipping coal are paramount. The challenge for utilities and regulators will be evaluating necessary upgrades at plants relative to the changing economics. 2.1 U.S. Government Support of New Energy Technology Some critics of clean energy technology innovations, specifically renewable energy generation sources, focus on government policy support as picking favorites in the private market. The report, “Where the Shale Gas Revolution Came From: Government’s Role in the Development of Hydraulic Fracturing in Shale” documents that the U.S. government has in the past provided large and long-‐term subsidy to coal, oil, nuclear and other legacy energy systems.67 If the government has been picking winners, then the long-‐term energy winner pick was coal. The U.S. government has also recognized that given global and domestic energy demand, some energy sources are finite, and that if the economy runs strongest with low cost energy, then it should invest in energy portfolio diversification. Therefore, it should not be surprising that since 1970 the U.S. government, especially the Department of Energy, has been a heavy investor in technology to develop hydraulic fracturing in shale and promote efforts to get at shale gas reserves. Today, the U.S. is seeing record low natural gas prices because of recent aggressive private sector investment in drilling for shale gas. But this started with many public-‐private partnerships, including the Eastern Gas Shales Projects starting in the 1970s with a range of shale drilling demonstration projects. During this same period of time, U.S. government funding helped formed industry research consortia and provided R&D with oversight by the Federal Energy Regulatory Committee (FERC) – which also oversees electric utilities nationally. Shale gas obtained by these new drilling techniques is also called ‘unconventional gas.’ From 1980 to 2002, the

29
federal government subsidized work in this area even further by allowing unconventional gas to qualify for Section 29 production tax credits. Other federal support for advancing shale gas included support for three-‐dimensional microseismic imaging – which was initially developed for the coal mining industry – by the Sandia National Laboratories. These federal investments, coordinated in close concert with gas industry representatives, were predicated upon a single mission: the commercialization of shale gas extraction technology. As a result of these efforts carried out over the course of 30 years, shale gas went from inaccessible deposits locked in unfamiliar geologic formations to the fastest growing contributor to the nation’s energy portfolio.68 2.2 The Shale Gas Boom: Duration and Consumer Cost When the FERC Commissioner speaks, utilities usually sit up and listen. So when Commissioner John
Norris told state regulators in July of 2012 that the price of renewable energy technology would continue to go down and that the price of natural gas would go up, you would expect utilities to listen.70 But if actions speak louder than words, price might not be the only motivator for utilities fuel switch from coal to natural gas. Natural gas is still a carbon-‐based energy source and it fits into the large base load generation business model. Many of the current energy production businesses continue to block any potential competition from clean energy technologies and distributed energy by having complicated interconnection requirements, trying to weaken net metering laws and offering only low renewable generation buy back prices rates to new market entrants. In Wisconsin, the utilities even raised the price to customers buying green power in what can best be described as a further tax on ratepayers wanting to support renewable energy. FERC Commissioner Norris told regulators at the National Association of Regulatory Commissioners that utilities (and regulators) should not abandon state commitments
to renewable energy generation just because natural gas prices are low. “Some of you may think this is time to bail [on renewables],” Norris told the gathering. Norris praised state efforts with RPS and that federal tax laws such as the production tax credit (PTC) and these state efforts were bringing down renewable energy prices. Norris emphasized the value of renewable energy generation in diversification of the national fuel supply.71 The euphoria over shale gas took on a life of its own during the pre-‐November US election cycle and now reality may set have to set in. First, gas drillers did not make money in 2012. That is because with the so-‐called lowest-‐cost shale gas plays the producers need at price of at least $4 per thousand cubic feet (cf) to turn a profit and the higher-‐cost plays need a price more like $9 or $10 per cf. The price in 2012 stayed below $4 and the Energy Information Agency sees the spot gas price averaging $3.35 in 2013. Even though prices will go up in the future, there are plenty of other signs for concern.72
Just how much (natural) gas supply do we have? We can’t make policy on the basis of an assumed 100 years of supply. If you only have 30 years of resource left, that doesn’t take us through the midcentury mark. If it’s 130 (years), you have a lot more options, you can think about gas exports…We’re really operating in a state of ignorance.
–Richard Nehring, chairman of the Committee on Resource Evaluation for the America Association of Petroleum Geologists.40

30
Not surprisingly markets moved, producers shifted to ‘wet’ gas plays which have more profitable natural gas liquids (NGLs). Also, new drilling moved to drilling from ‘tight oil’ plays like those in the Bakken Formation in North Dakota. With increasing fracking for oil, the fracking for dry gas takes a back seat in the market. In 2012, shale gas production was actually flat, which again might not be surprising in a low price market. Still, the real numbers trump the rhetoric and speculation in this market caused a lot of drilling. This leads to the questions concerning how much shale gas exists and how much it will cost to obtain it. Likewise, if the global market wants NGLs that result in more exports of the product around the world for Asia and Europe and that will raise prices. On the global market, the prices go up from the current domestic prices. With a changing market the competition is with manufacturing of petrochemicals, fertilizers, and plastics, all with significant market power. Again, there is risk in relying entirely on natural gas resources for energy generation for the U.S. electric grid power market. Simply put, natural gas price volatility will return anytime a commodity hits the global market. Many in the energy market remain bullish on the supply question, but not everyone. The decline rates on shale gas wells are deep, and definitely can vary greatly from play to play. There is growing evidence that shale gas wells output commonly decline 50 to 60 percent after the first year. Much drilling has taken place in the last 12 to 24 months, as smart drillers likely found some of the best locations. Still, there is a treadmill effect for more drilling to keep output even flat. In the United States, the aggregate decline of natural gas production from both conventional and unconventional sources is now 32 percent per year, meaning that 22 billion cubic feet per day of new production must be added every year to keep overall production flat, according to experts.73 Since most consumers benefit from cheap energy, this natural gas skepticism is guarded. Cheap natural gas can replace coal. Cheap natural gas could open the door to greater energy diversification including renewable and clean energy options. But one could question how closely electric utilities and energy regulators are watching the investments and fuel switching to make sure we don’t go from one energy lock-‐in with coal to a new energy lock-‐in with natural gas at the exact time prices starting go up to the global market level. Further, utility decision-‐making on fuel switching from coal to natural gas is being done while government and private entities are making it clear that the overall natural gas supply is still relatively unknown. How Much Natural Gas Can the U.S. Produce? A team of around 100 geologists and engineers was formed to research the question of how much natural gas is buried in the U.S. shale rock formations. The Potential Gas Committee, a nonprofit founded in the early 1960s, has been assisting in the training of geologists and engineers for many years. Their work is in collaboration with the Colorado School of Mines and receives some support from the American Gas Association, the American Petroleum Institute and Independent Natural Gas Association of America. The Potential Gas Committee reports its assessment of potential gas sources in three categories of decreasing geological certainty:
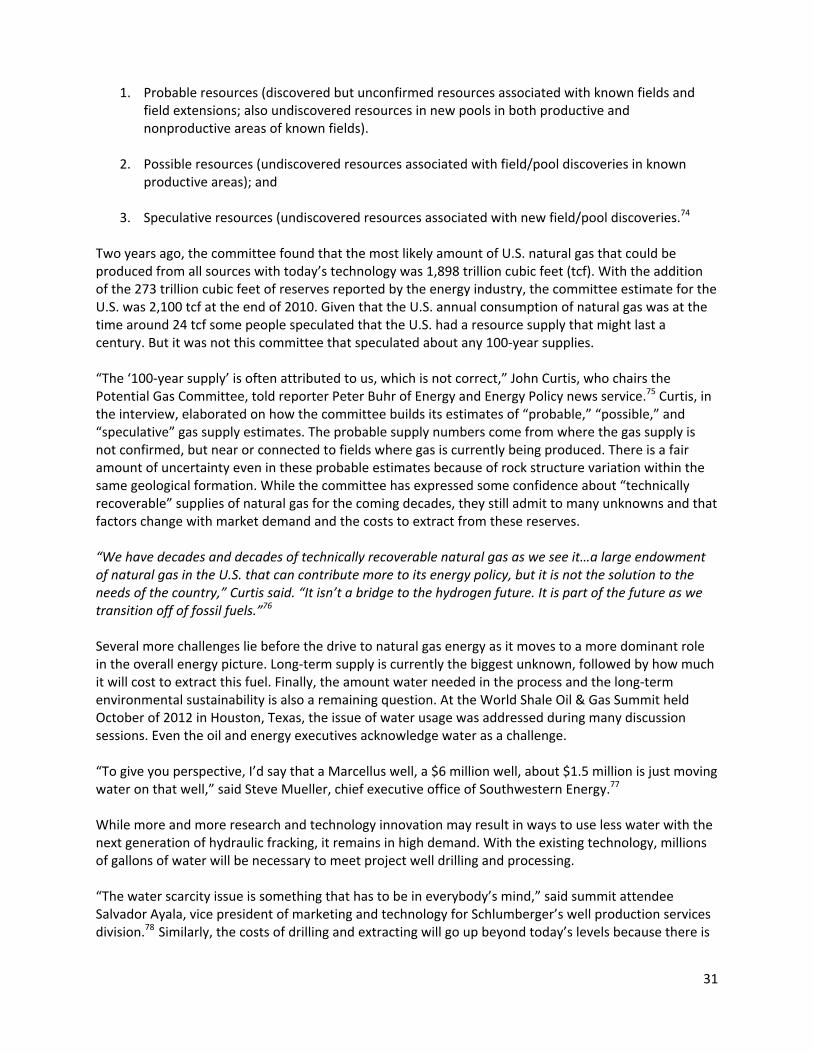
31
1. Probable resources (discovered but unconfirmed resources associated with known fields and field extensions; also undiscovered resources in new pools in both productive and nonproductive areas of known fields).
2. Possible resources (undiscovered resources associated with field/pool discoveries in known productive areas); and
3. Speculative resources (undiscovered resources associated with new field/pool discoveries.74
Two years ago, the committee found that the most likely amount of U.S. natural gas that could be produced from all sources with today’s technology was 1,898 trillion cubic feet (tcf). With the addition of the 273 trillion cubic feet of reserves reported by the energy industry, the committee estimate for the U.S. was 2,100 tcf at the end of 2010. Given that the U.S. annual consumption of natural gas was at the time around 24 tcf some people speculated that the U.S. had a resource supply that might last a century. But it was not this committee that speculated about any 100-‐year supplies. “The ‘100-‐year supply’ is often attributed to us, which is not correct,” John Curtis, who chairs the Potential Gas Committee, told reporter Peter Buhr of Energy and Energy Policy news service.75 Curtis, in the interview, elaborated on how the committee builds its estimates of “probable,” “possible,” and “speculative” gas supply estimates. The probable supply numbers come from where the gas supply is not confirmed, but near or connected to fields where gas is currently being produced. There is a fair amount of uncertainty even in these probable estimates because of rock structure variation within the same geological formation. While the committee has expressed some confidence about “technically recoverable” supplies of natural gas for the coming decades, they still admit to many unknowns and that factors change with market demand and the costs to extract from these reserves. “We have decades and decades of technically recoverable natural gas as we see it…a large endowment of natural gas in the U.S. that can contribute more to its energy policy, but it is not the solution to the needs of the country,” Curtis said. “It isn’t a bridge to the hydrogen future. It is part of the future as we transition off of fossil fuels.”76 Several more challenges lie before the drive to natural gas energy as it moves to a more dominant role in the overall energy picture. Long-‐term supply is currently the biggest unknown, followed by how much it will cost to extract this fuel. Finally, the amount water needed in the process and the long-‐term environmental sustainability is also a remaining question. At the World Shale Oil & Gas Summit held October of 2012 in Houston, Texas, the issue of water usage was addressed during many discussion sessions. Even the oil and energy executives acknowledge water as a challenge. “To give you perspective, I’d say that a Marcellus well, a $6 million well, about $1.5 million is just moving water on that well,” said Steve Mueller, chief executive office of Southwestern Energy.77 While more and more research and technology innovation may result in ways to use less water with the next generation of hydraulic fracking, it remains in high demand. With the existing technology, millions of gallons of water will be necessary to meet project well drilling and processing. “The water scarcity issue is something that has to be in everybody’s mind,” said summit attendee Salvador Ayala, vice president of marketing and technology for Schlumberger’s well production services division.78 Similarly, the costs of drilling and extracting will go up beyond today’s levels because there is

32
a feeling that the low-‐cost natural gas has been found. There are many energy market factors that come into play on price including rising costs from unproductive geology, the water demand, new government regulations, the interplay of oil prices, the changes in coal prices (up or down) and long-‐term even the prices of renewable energy generation options.
Figure 7: Potential Natural Gas Resources in the U.S. (Potential Gas Committee)
2.3 Transition to Greater Use of Renewable Energy in the U.S. and Wisconsin Does a transition to greater use of renewable energy in the U.S. and Wisconsin create or reduce risk in the utility sector? The authors of a report on risk regulation urged for greater portfolio diversity in energy generation sources and more emphasis on renewable energy generation.79 The least risky approach is to also increase energy efficiency measures, according to the authors of that report. The authors of a UCS study used natural gas for comparison in their analysis, and that could argue for using this as a transition fuel to greater renewable energy sources. Instead, the UCS study calls for a greater use of wind, solar, geothermal and biomass sources for energy generation calling it a “boon for public health.”80 The authors note that regional transmission organizations (RTOs) and independent system operations (ISOs) are required by the federal government (FERC order 1000) to consider all relevant state and federal energy policies and pollution standards in determining investments needed to meet customer demand and reliability. These organizations can delay coal plants closures if it impacts reliability. Likewise, in states that regulate utilities the regulators could conduct system wide planning to evaluate if greater use of energy efficiency and clean energy technologies can better help a state meet energy needs.81 Wisconsin’s Final Strategic Energy Assessment indicates the state has adequate energy generation for several years, but some combination of the Kewaunee Nuclear Plant closing in October 2012 and decisions on the retirement of older coal plants versus environmental emission control upgrades may

33
change that.82 Wisconsin’s situation is not dramatically different from that of the U.S. as a whole, where it is projected that excess capacity is above and beyond the 12.5 to 15 percent capacity reserve margins to maintain reliability.83 This does allow for coal plant retirements without needing significant capacity to replace it. 2.4 Combined Heat and Power Now is the time to be smarter and more efficient in energy generation systems, and combined heat and power (CHP) is an attractive option. The U.S. announced a major commitment to more CHP systems when President Barack Obama issued an executive order in September 2012 calling for a goal of 40 GW of newly installed CHP by 2020—up from just over 82 GW in operation at the end of 2012. Combining this national initiative with other changing dynamics in electricity generating systems including the retirement of more US coal fleet creates a great opportunity for CHP. If states with retiring coal fleets develop policy to reward the use of CHP they can make a very cost-‐effective investment in clean technology and value energy generation efficiency. The levelized cost of a new 20 MW natural gas powered CHP system is about 6.0 cents/kWh, while a new natural-‐gas-‐powered combined cycle gas turbine system ranges from 6.9 to 9.7 cents per kWh.84 The most obvious electric energy generation change is that coal as a commodity continues to increase in cost, while the primary alternative fuel of natural gas is currently at record low costs. Even if natural gas costs increase, it is expected to be the fuel switch of choice for many utility scale projects. Several different studies are projecting increased coal plant closures including a high scenario of 59 GW or around 6.3 percent of total U.S. consumption, or lower ranges including the Bipartisan Policy Center at 29-‐35 GW, and the EIA at 19-‐45 GW.85 The Midwest Independent System Operating Region that includes Wisconsin and the states of Minnesota, Iowa, Indiana, Michigan and much of Illinois is an area that may be hit particularly hard by coal plant closures. Going forward, Wisconsin and the entire U.S. should consider a much greater use of CHP systems, especially as more and more coal plants close. Where appropriate, CHP makes the most sense for the generation of electricity and thermal energy because it is much more efficient. A CHP system generating both electricity and thermal energy operates at total efficiencies of 64-‐80 percent while traditional electricity generation in the US is about 33 percent efficient.86 Wisconsin has the opportunity to use CHP in biomass and biogas systems with anaerobic digesters on dairy farms. Other strong opportunities including using anaerobic digesters to produce biogas in the abundant food-‐processing sector, and at waste facilities including landfills and wastewater treatment plants. A CHP system can be particularly attractive to hospitals, universities, factories, and other facilities including multifamily housing structures and commercial buildings. There are opportunities in Wisconsin and around the U.S. for innovative partnerships. Examples of these partnership might include a small municipal wastewater treatment plant and food processor, or a larger dairy and nearby dairy processor who might have a greater need for excess heat. A short distance pipeline could be cost-‐effective, especially if the energy production is co-‐located near an industrial park. Data centers might be a good candidate because of their high energy needs. At the present time, both regulation and utility business models do not benefit the growth of CHP systems. With the increase in CHP systems, utilities will feel threatened by the loss of market share with reduced concept of the base-‐load energy generated by the utility. But if state policies and regulations of

34
utilities were changed so that utilities could be rewarded for energy efficiency and encouraging CHP systems, the utility would be a good candidate to support investments. Utilities have experience making longer-‐term investments (a longer payback horizon). It would allow the utility to have a more clean technology portfolio and still address reliability with robust CHP to fill-‐in any coal plant closure generation. Some states, such as Massachusetts, have already recognized the value of energy efficiency and CHP by having supportive public policy in place. The Massachusetts Green Communities Act of 2008 recognizes CHP projects as energy efficient measures that are eligible for a rebate incentive. The programs in Massachusetts were tied to state restructuring effort that started in 1997. The state has decoupling in place for all its gas and electric utilities separating rates and energy efficiency. The utility companies can earn a shareholder incentive of approximately 5 percent of energy efficiency program costs for meeting their energy saving, benefit-‐cost, and efficiency goals. The state also provides front-‐end capital for feasibility studies, procurement and installation. Also, the state Renewable Portfolio Standard includes CHP as a category with the incentive programs. Further, the state net metering and interconnection laws are move favorable to renewable energy distributive generation sources.87 2.5 The Fall of Wind and Solar Energy Generation Prices The last decade has seen the U.S. start a shift to greater renewable energy generation. The biggest driver has been that 29 states have renewable portfolio standards that require utilities to meet a set percent of their sales using energy generated from renewable sources by a certain date. Likewise, some 27 states have energy efficiency policies or goals. But, the two sets of state policies provide only small incremental change overall because of the great variation from state to state. For Wisconsin the RPS is already met by utilities and no more renewable generation will occur without some new policy or major market shifts. In 2012, the U.S. energy market hit the 50 GW of wind generated power capacity – that is the equivalent of the generating power of 44 coal-‐fired plants (AWEA 2012).88 In the U.S., 13 states get more than 5 percent of their generation from wind, and the top four are the Midwestern states of South Dakota, Iowa, North Dakota and Minnesota.89 The average prices for operation and maintenance costs in the wind sector have dropped 38 percent from 2008 to 2012.90 In a similar fashion wind turbine prices have declined by nearly one-‐third since 2008, according to a study done by the Lawrence Berkeley National Laboratory (LBNL) in conjunction with the National Renewable Energy Laboratory (NREL). The wind-‐levelized cost of energy is now between $33 and $65 per MWh. Prices in the wind energy sector are declining and at the same time performance is continually improving. This is very indicative of the learning curve improvements found in the energy technology innovation systems analysis category. This means that adding wind power to the energy market may be driving down energy costs overall. A recent study of the Midwest Independent System Operation (MISO), for example, found that large amounts of wind could save consumers $200 per year in 2020.91 Wisconsin is a part of the MISO footprint and the reason wind power can save ratepayers money is because of “price suppression” – where power is sold through an auction. When the system is functioning properly the price is the marginal cost of operating a power plant. For a wind turbine the marginal cost is effectively zero because there is no cost for the fuel and minimal operating expense. This of course will require more wind power energy projects to be developed in the MISO footprint to achieve the savings forecast by 2020.
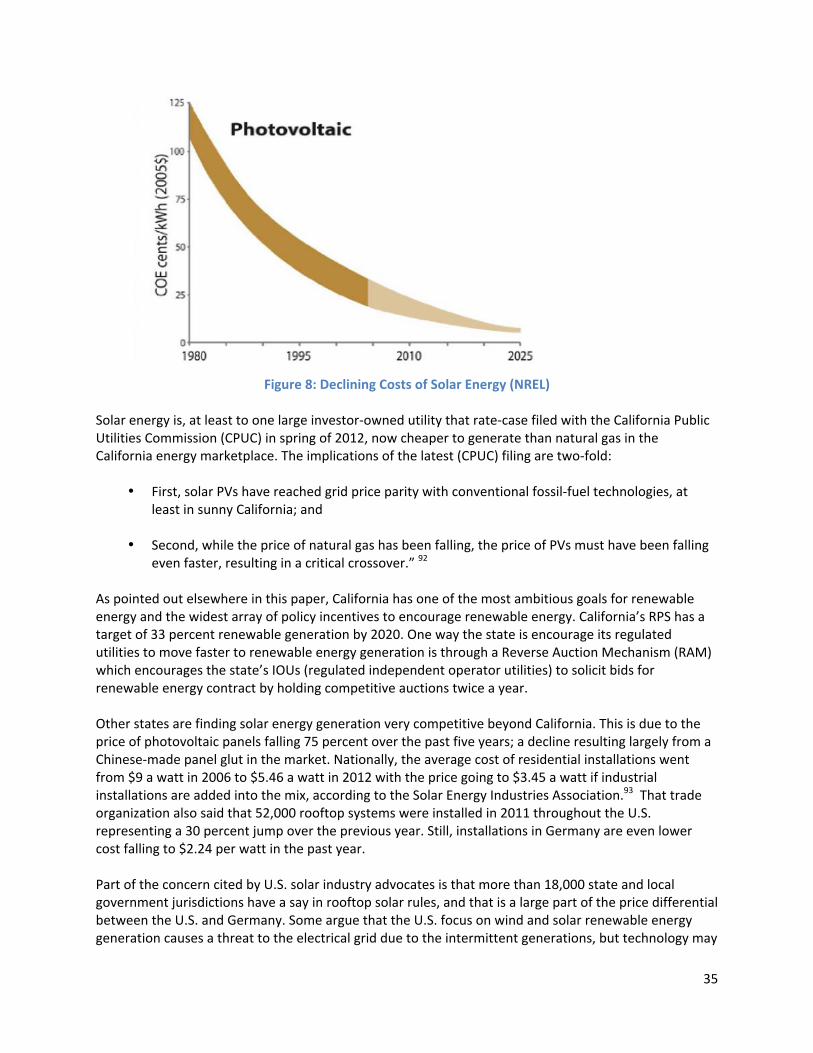
35
Figure 8: Declining Costs of Solar Energy (NREL)
Solar energy is, at least to one large investor-‐owned utility that rate-‐case filed with the California Public Utilities Commission (CPUC) in spring of 2012, now cheaper to generate than natural gas in the California energy marketplace. The implications of the latest (CPUC) filing are two-‐fold:
• First, solar PVs have reached grid price parity with conventional fossil-‐fuel technologies, at least in sunny California; and
• Second, while the price of natural gas has been falling, the price of PVs must have been falling
even faster, resulting in a critical crossover.” 92
As pointed out elsewhere in this paper, California has one of the most ambitious goals for renewable energy and the widest array of policy incentives to encourage renewable energy. California’s RPS has a target of 33 percent renewable generation by 2020. One way the state is encourage its regulated utilities to move faster to renewable energy generation is through a Reverse Auction Mechanism (RAM) which encourages the state’s IOUs (regulated independent operator utilities) to solicit bids for renewable energy contract by holding competitive auctions twice a year. Other states are finding solar energy generation very competitive beyond California. This is due to the price of photovoltaic panels falling 75 percent over the past five years; a decline resulting largely from a Chinese-‐made panel glut in the market. Nationally, the average cost of residential installations went from $9 a watt in 2006 to $5.46 a watt in 2012 with the price going to $3.45 a watt if industrial installations are added into the mix, according to the Solar Energy Industries Association.93 That trade organization also said that 52,000 rooftop systems were installed in 2011 throughout the U.S. representing a 30 percent jump over the previous year. Still, installations in Germany are even lower cost falling to $2.24 per watt in the past year. Part of the concern cited by U.S. solar industry advocates is that more than 18,000 state and local government jurisdictions have a say in rooftop solar rules, and that is a large part of the price differential between the U.S. and Germany. Some argue that the U.S. focus on wind and solar renewable energy generation causes a threat to the electrical grid due to the intermittent generations, but technology may

36
make that less of an issue. GE has a product line called FlexEfficiency that allows energy system operators to adjust quickly as energy comes on and off the grid, including a 750-‐megawatt combined cycle plants that can vary its output by 100 megawatts in one minute. GE said that in the fall of 2012 it had over $1.2 billion in advance orders for the FlexEfficiency product line.94 Again, these price reductions in wind power generation around the U.S. and solar energy generation are making it much easier for states to look toward energy generation portfolio diversity. “Solar energy is a natural hedge against rising costs – a hedge that regulators and utilities are turning to lower electricity costs for their customers. Solar PV is a mature and proven renewable energy technology,” said Rhone Resch, CEO of the Solar Energy Industries Association.95 2.6 A New Paradigm for Profit and Regulation in a Distributed Energy World Some of the strongest support for change in the electric utility sector is coming from customers. In some cases, large retail outlets such as Wal-‐Mart, Ikea, and Kohl’s Department stores are implementing corporate sustainability programs by placing solar panel arrays (solar photovoltaics or PV) on their roofs to power the facility with renewable energy. This is creating pressure for more third party energy generation and advances DG systems, which has met with resistance from some utilities. A more common step was the creation of demand response (DR) programs, where large and small commercial and residential energy users would install switches that could reduce or even shut off power of lights or air conditioners when the overall grid energy demand is high. This reduces the pressure on a utility during peak demand times and some utilities welcome this mechanism. Societal and policymaker pressure for greater energy efficiency (EE) can show up in changes in building codes as well as utility regulations. In most states, the current utility rate and regulatory structure does not favor utility encouraging EE, but that has been changing with a particularly success model in California.96 More and more businesses are recognizing that opportunities for DG using wind, solar, fuel cells, and CHP can greatly enhance meeting their energy business needs. Utilities, in some cases, view all these changes as a threat to market share, and in other cases have adapted to change. Policymakers and regulators like the electric utility business sector must also plan for these changes. The State of New York passed utility restructuring legislation in 1999 and over the more than a dozen years of implementation and regulation, change has been able to work through many of the issues in the electric utility market. With restructuring, utilities were required to divest most of their power plants and allow for customers to purchase power from third parties. The New York State Public Service Commission oversaw the change where utilities primary responsibility became ensuring the adequacy of the distribution system and working with New York Independent System Operator (NYISO) on the energy planning process. The NY utility, Con Edison, has been a leader in creating new programs for implementing energy efficiency measures and has now built distributed resources into its long-‐term planning mechanism. Of particular note is how Con Edison has been able to adapt customer use of combined heat and power into the portfolio.97 According to Con Edison staff in an essay published in a utility journal: Customer adoption of DG—both renewable and natural-‐gas-‐fired—has seen a dramatic increase in Con Edison’s territory over the last five years, and this trend is expected to continue. Some of this is due to technological developments and customer interest in green energy, but most can be attributed to market

37
and policy changes—particularly low, stable natural gas prices; state incentives, including property and other tax incentives; and the inherent efficiency of CHP.98 The State of New York Public Service Commission and private sector energy industry leader Con Edison experience with managing for these changes demonstrates success can be achieve in dealing with a world of increasing distributive energy and third party generation. In a similar fashion, public policy can be crafted to help with this success. New York has used public incentives to target DG installations to areas where the distribution system could benefit from increase generation capacity by creating Solar Empowerment Zones. New York State also legislated for high carbon fuel switches, phasing out #4 and #6 fuels oils, and replacing them with renewable sources and natural gas, especially with combined heat and power systems.99 Con Edison has also received a DOE-‐funded Smart Grid Demonstration Project that helps the utility in piloting distribution control room dispatch of demand response—including start, stop, and load control of customers’ emergency and baseload generators. The Con Edison staff, in their essay titled “Capturing Distributed Benefits,” acknowledges challenges remain for the utility in the proper design on incentives and rates, and with data and technology management in fully implementing widespread distributive energy systems. Most importantly, Con Edison utility staff members working with New York utility regulators have also shown the knowledge and insight to power through the transition to a distributive energy world.100 2.7 Microgrids: A Technology Game Changer? When millions of East Coast homes and businesses lost power, most for many days, because of Hurricane Sandy the questions arose again about the weakness and vulnerability of the U.S. electrical grid system. The elaborate transmission system called the grid is both a historical tribute to large-‐scale engineering infrastructure success connecting power to many across the land, and now an inadequate, inefficient, technology needing upgrades and refinements for the future. The headline of a Scientific American article shortly after Hurricane Sandy said it well: “If You Had a Microgrid, You Wouldn’t Be Waiting for the Power Company.”101 While the headline may not be accurate for all storm and disaster scenarios, the key point is accurate that a microgrid resilience and strength come from not being a part of the electric grid that goes down frequently in many types of storms. A critical feature of the microgrid is it has the ability to ‘island’ itself from the large power grid and keep the energy flowing at a local site. Some definitions of a microgrid say it is a miniature version of today’s sprawling transmission and distribution grid, except much smaller in scale. But the microgrid system is more than that. The University of Wisconsin-‐Madison and UW-‐Milwaukee are national leaders in microgrid research and development. The recently opened UW-‐Madison Wisconsin Energy Institute (WEI) building has a high-‐bay lab with a microgrid research facility. Microgrids can play a dual role of providing highly reliable power of commercial buildings and residential neighborhoods, but it has many flexible capabilities including the ability to export power to the grid as well as operating independently as an island when utility blackouts happen. Some utilities might perceive microgrids as a threat because they facilitate distributed energy sources versus the large base load centers popular with most energy companies. Other utilities have seen how microgrids can deliver unique benefits to certain customers, especially customers with large energy

38
needs and critical reliability needs. These customers may include data centers and hospitals and the military. To go back to Hurricane Sandy and the critical systems failures witnessed on the East Coast, among the disturbing events was hospitals losing power and patients being rushed in the worst possible conditions to other health facilities. The back-‐up energy generation at these sites may have been subject to failure by being in the basements or on the roof, but it does illustrate how critical structures can have greater energy security going forward with microgrids. The U.S. military, an organization that understands risk pretty well, is already deploying the microgrid technology at some of its sites. One example is the Marine Corps Air Station in San Diego that is powered by a methane power plant with a microgrid.102 The military is also looking at mobile microgrid applications as a critical safety function. The hospital design of the future, especially with a campus design, would greatly benefit from a microgrid to be used as a critical structure to maintain power when the big grid goes down as well as deliver safe, clean and reliable energy. The microgrid will greatly benefit DE and clean technologies such as solar, wind, biogas sources. The Sacramento (CA) Municipal Utility District (SMUD) is using a microgrid at its corporate headquarters powered primarily by solar photovoltaic panels, small combined heat and power units – which generate both electricity and heat from natural gas – and zinc flow batteries.103 Microgrids in early forms operated with manual controls and usually the historic back-‐up generation favorite of diesel engines. Now the systems are improving and the preferred energy source is clean technology of solar, wind and biogas. In addition to being a potential tool for more mobile energy generation the fact that microgrids are the most direct pathway to net zero energy goals attracts the military. With new technology platforms there is an easy microgrid connection to the movement toward DR – the system where individual homes and businesses have great latitude with energy use and then lower payment for energy. A recent Federal Energy Regulatory Commission (FERC) ruling requires that grid operators compensate DR energy providers at a rate equivalent to other generators. Like any technology, improvements can still be made with microgrids in strengthen the ability to manage variable, bidirectional resources. ZBB Energy out of Milwaukee is combining its zinc bromide flow battery technology with microgrids.104 The U.S. has now made a commitment to CHP development – which is the ideal anchor resource for microgrids. Markets for microgrids are already aligning and Wisconsin could take advantage of its technology leadership. First, Wisconsin utilities, state-‐based private companies and Wisconsin universities are well positioned to drive leadership in microgrids. A critical step is for utilities to embrace microgrids rather than see them as a threat to market share. A smart utility could actually find creative partnerships to market microgrids and support services to customers with high-‐energy demand and a critical need for reliability. Ideally, the utility would offer up renewable energy generation versus high carbon sources like coal, diesel or even a slightly better option of natural gas. Second, improved research and commercial development are needed with inverter technology that can convert solar panel output in DC current to AC current, and shoot down the PV system when necessary. The new generation of microgrid inverters will help keep the ‘island’ needing back-‐up energy powered while disconnecting it from the macrogrid. By having a utility company partner with commercial product developers and Wisconsin universities, utility sector confidence in microgrids’ interface with the macrogrid will grow and improve.

39
Finally, as the price for renewable energy generation, particularly solar and wind today, continues to go down, the opportunity for utilities to diversify their generation portfolio and still maintain market share can continue. For utilities to fight microgrid deployment and diversification of the energy source portfolio is tantamount to shooting oneself in the foot. Societal drivers for demand response, clean source generation technology, and the greater efficiency of using combined heat and power systems, make the growth of microgrid technology inevitable.

40
3.0 An Energy Innovation Agenda for Wisconsin To stay competitive in a changing economy – including a rapidly changing energy economy – requires a focused, coordinated, and adaptive innovation agenda for Wisconsin. An energy technology innovation agenda looks to new technology solutions and promotes entrepreneurial activity. It is well understood that energy drives an economy and, therefore, energy innovation is a critical link to economic vitality. There is little question the United States and Wisconsin are in transition to a new energy economy focusing more on renewable energy solutions, yet the legacy high carbon economy will remain a part of the mix. This becomes a question of balance and supportive public policy is critical during the transition period. Wisconsin will fall behind in global and domestic economic competitiveness unless it moves towards a balanced energy portfolio with less reliance on high cost coal and more reliance on clean energy technology solutions. That is not the case today in Wisconsin, and in fact, there are troubling signs Wisconsin has slipped behind other states in the path to long-‐term energy innovation and economic success. Research on innovation systems is robust and there are some key steps to success that Wisconsin can encourage policymakers to adopt to promote energy innovation today. Innovation systems are defined
as networks of institutions, public and private, the activities and interactions of which initiate, import, modify and diffuse new technologies.106 One of the characteristics of a system is that it has a function.107 Utilizing the energy innovation systems approach requires more proactive steps in taking away risk around renewable energy solutions and adapting quickly to innovations that combine new solutions and ultimately reduce costs. We have both a blessing and curse with new domestic shale oil discoveries that can lessen the U.S. and Wisconsin dependency on foreign oil and domestic coal, but also can stymie new clean energy technology solutions. Navigating this short-‐term may include an “all of the above” energy
policy, but that is not a long-‐term fix. As the authors of the paper, “On Picking Winners: The Need for Target Support of Renewable Energy,” state bluntly, “As every gambler knows, backing every horse only benefits the bookmaker.”108 For the United States and Wisconsin to foster energy innovation systems solutions requires some candor about limits in the power production business world. First, the status quo always looks attractive to regulated utilities because it is a business model they designed, built and solidified through controlling the ‘rules of the game’ by current laws and regulations enhancing their monopoly control. Some may argue for deregulation as a solution, but that is unlikely in Wisconsin, although some states such as Texas have seen success in a deregulated energy market. A more likely solution for Wisconsin is letting energy innovation occur by loosening the command and control authority over the energy market place. This will not be easy for several reasons:
1. The energy power market functions on long timescales.
2. There are multiple levels of political risk – large energy installations can attract opposition and the incentives of carbon pricing are slow to non-‐existent at the present time.
Energy is the foundation of every economic process and transaction that takes place in the world. Because of this, energy is, arguably, the most important sector of the economy
–Seth Crawford in Energy Policy.54

41
3. The power production world has very weak market drivers -‐-‐ there is a marginal price
differentiation for a homogenous product (electrons) which are sold into a primarily regulated market in which government entities (such as the PSC) regulate profits.109
This creates a tension where policy change is likely to be only incremental versus disruptive – which may be needed to change a high carbon energy system to a more clean energy system. As stated earlier in this report, the most important thing energy policy can do to impact the transition to a new energy economy are create goals, remove barriers, make it cheaper, and use an energy systems approach. While there is value in all of these policy outcomes, this may not be adequate to encourage energy innovation as change advances. The key is to view this as an energy system and innovation is part of an evolutionary process of change driven by policy and market activities. Carefully considering actions (and the actors involved) throughout the system facilitates an understanding of the dynamics impacting success or failure for new energy technologies. 3.1 Innovation Technology System Perspective Wisconsin policymakers should care about innovation because it is the principal source of economic growth110 and can be the link to new job opportunities in the state. Innovation systems are the process for developing new technologies creating these economic opportunities. Bengt-‐Ake Lundvall in “National Innovation Systems: Towards a Theory of Innovation and Interactive Learning” defines an innovation system as: “the elements and relationships which interact in the production, diffusion and use of new, and economically useful knowledge.”111 Steps in this process include basic laboratory research, market ideas from companies, learning and information exchange, and going through commercialization of the new technology. An innovation technology system involves a knowledge transfer or process of learning that includes learning by doing,112 learning by using,113 and learning-‐by-‐interacting.114 There are multiple actors and institutions that can be involved in this innovation technology system including small and large business, a product or service end users, government and regulators, universities, and non-‐government organizations. Study of the innovation technology system has resulted in a body of knowledge about what can lead to success or failure, and how public policy can be a critical part of the system process. Renewable energy is an area ripe with new technology, but knowledge transfer and supportive public policy is needed to advance this sector. Historically, the innovation technology system perspective has characterized supportive policy in a traditional linear model creating market push and pull – meaning a policy that creates a technology push into the market place or a policy that creates a demand pull on the market. Pull policies are incentives or regulations that are intended to attract private and/or public sector activity in developing ‘projects,’ and are often referred to as ‘market makers.’ Another dimension in this traditional innovation technology system view is that in cultivating R&D there are steps of basic research, applied research and product development and diffusion. Renewable energy solutions may differ from recent thinking about innovation technology systems when short-‐term government must appear to be ‘picking winners’ with current technology while maintaining an environment for adaptive innovation. That is why some policy solutions like advanced renewable tariffs are more attractive to create a catalyst for investment while trying to avoid technology solution

42
lock-‐in. Systems theory has been used much longer in the natural sciences than the social sciences, but a combination with technology innovation systems may strength this analytical approach.115 With today’s focus on job creation and revenue growth these innovation systems are important to advancing technology. Many believe that using this innovation system framework for analysis, especially in the context of sustainability transitions (such as is occurring in the energy technology system), allows for policy makers to identify system weakness.116 More specifically, using these analysis tools help to identify a policy intervention that could solve a problem in the technology innovation system or influence technology success. While this technology innovation analysis framework has a more limited application in environmental innovation, a smaller body of knowledge is emerging in this area. When looking at environmental innovation, and in this case a sustainable transition in the energy technology system, it is important to recognize the diversity of the technologies and how the challenges are different in each. As Simona Negro and Marko Hekkert put it, “It is thus important that policy is ‘joined up’ and supports innovation through the various stages, targeted if necessary to address specific barriers in the innovation cycle.” 117 Below are seven key functions involved in energy technology innovations, as summarized from a list found in Simona Negro and Marko Hekkert’s article in Technology Analysis & Strategic Management: 118
Function 1: Entrepreneurial activities It is the entrepreneur who plays the key role in the innovation system. Entrepreneurs, as the cornerstone of innovation systems, can be new businesses entering the marketplace or existing businesses wanting to diversify their portfolio to take advantage of new market opportunities. The role of the entrepreneur is action oriented taking new knowledge, technology, and dealing with uncertainty in the marketplace by moving forward the knowledge transfer toward a commercial viability. Function 2: Knowledge development New knowledge is fundamental to technology development. The new knowledge whether adapting existing technology or creating something new is shaped to address a problem in a modern economy that is not currently addressed. The knowledge base and learning aspects of an innovation system can come from basic R&D, search and experimentation, learning-‐by-‐doing, and hybrid models that combine older existing understanding or technology and adapting new innovation. Function 3: Knowledge diffusion through networks The exchange of information comes through networks. This is called the diffusion of information and makes new knowledge accessible to both market participants and a wider audience. Negro and Hekkert point out that, “when discussing the prospects of establishing renewable energy industries, one could argue the importance of a widespread know of renewable energy technologies as well as the awareness of recent energy and environmental concerns.”119 For example, as more individuals in society recognize the need for sustainable solutions through renewable energy versus legacy high carbon energy sources, then the R&D agenda starts to change.
43
Function 4: Guidance of the search Public policy can play a large role in this “Guidance of the Search” for example with RPS, Renewable Fuel Standards (RFS) or other forms of energy source generation targets or goals. These can be the activities within the innovation system that can positively affect the visibility and clarity of specific needs among technology users in this area.120 This is important for giving a government market signal that the technology and research has credibility or legitimacy in being a step toward achieve a goal. Sometimes the actors are more likely to search for new knowledge or technology within their current business paradigm.121 This would partially explain why fossil fuel based energy business is drawn to fracking for natural gas versus new technology of renewables. Function 5: Market formation As has been seen in the early stages of renewable energy technology development, it is often the case that new technologies often have difficulties competing with long-‐term entrenched technologies (fossil-‐fuel sourced energy). Therefore, the likelihood of technology success is improved if protected spaces are created for these new technologies. One possibility is the formation of temporary niche markets for specific applications of the technology.122 Another possibility is to create a temporary competitive advantage by favorable tax regimes or minimal consumption quotas.123 Adding to the complexity in markets is that societal costs, sometimes called externalities, are often not reflected in the economy. For example, burning coal and petroleum causes many public health issues that society pays for in health care costs. The energy prices of renewable generation sources can look higher than fossil fuel based sources such as coal and petroleum because the externalities costs are not reflected in the energy purchase price contracts. According to the European Commission, “the cost of producing electricity from coal or oil would be double…if the external cost such as damage to the environment and to health were taken into account.” 124
Function 6: Resource mobilization A broad array of resource mobilization is necessary for a successful innovation system including both finance and human capital. More specifically, resources also include services and network infrastructure, which are abundant in the existing energy system to the advantage of incumbent energy generation with coal. For a biomass technology the availability of biomass feedstock is also a resource mobilization criterion. Function 7: Advocacy coalition For a new technology to development well it is likely that it must become a part of the incumbent business model or change it significantly. The parties with a vested interested in the status quo business model will typically oppose the new technology if it threatens their profit structure. “In such a case, advocacy coalitions can function as a catalyst; they put a new technology on the agenda (F3), lobby for resources (F6), favorable tax regimes (F5) and by doing so create legitimacy for a new ‘technological trajectory.’” 125
It is important to consider the interdependence of the seven functions in the technology innovation system, and that factors change depending upon whether it is an early stage or later stage of technology development. There may be some unique factors in a specific country that differ, and there even may be

44
some unique factors in the technology that might alter one of the functions in the system. Also, when a technology is in the early stage or formative stage, there can be mechanisms to block its further development. For example, with many new technologies in the energy system, connection to the electrical grid is key. Policy around net metering and interconnection—the so-‐called ‘rules of the game’—can often block the growth of wind, solar, biomass and biogas energy systems from advancing to a more robust stage of development. The technology innovation system has a series of steps during which a technology advances to a more robust place in a market and it could be argued this is an evolutionary process. Sometimes a new technology can revolutionize a societal function such as computers and nanotechnology. Through the evaluation lens of using a technology innovation systems approach it can be seen that even rapid change evolved through that sector. When placing a role for public policy to shape this technology innovation system it must be recognized that policy itself can be a series of experiments. This has historically been defined as the ‘science of muddling through’ in public policy where the objectives continue to change, and new policy experimentation follows with a modified objective. It requires some thinking about what policy might
speed up this technology innovation system process, especially with the knowledge diffusion. Energy systems may need innovation technology systems more than ever as issues of environmental quality, water, land use, greenhouse gas reductions and dwindling energy resources interplay. Combined with rapid global population growth and emerging economic growth in new regions, the overall energy demand is rising and traditional high carbon fuel options decreasing. This complexity creates a nasty problem for the policy network, as energy is the driver for the local, domestic and global economy. 3.2 Is the U.S. Falling Behind in Clean Energy Technology?
The numbers on renewable energy growth in other parts of the world illustrate how all the states, including Wisconsin, may be falling behind in renewable energy generation and innovation. Relative to its population and energy demand and usage, the United States is well behind in the development of its solar, wind, biogas and geothermal energy compared to many other countries. While the U.S. has seen a steady, strong growth in wind energy power installations the last few year, as of the end of 2011 it ranked seventh globally behind Denmark, Spain, Portugal, Germany, Ireland and Canada when a comparison using populations is made to those countries. 127 Denmark has almost five times the wind capacity per capita than the U.S. and is a leader in local ownership of wind power. In a similar fashion, the U.S. overall ranks only 12th in solar photovoltaic renewable energy power per capital trailing Germany, Italy, Czech Republic, Spain, Greece, Australia, Japan, France, Denmark, Great Britain. Even more telling in this comparison is that individual states of New Jersey and California are per capita competitive with these global leaders (ranking the equivalent of fifth and tenth). This means that other states are deeply behind, and Germany has 20 times and Italy 14 times the install solar capacity per capita of the U.S. Most important to Wisconsin would be the opportunity for biogas energy given our large dairy and food-‐processing sector. Germany has a whopping 181 times the biogas energy capacity
Absent policy action, clean energy will continue to expand in the United States and around the world, but the competitive position of the U.S. industry is very likely diminished
–Pew Charitable Trusts report, “Innovate, Manufacture, Compete: A Clean Energy Action Plan.18

45
of the U.S. and even Austria has 63 times the biogas energy per capita of the states. If there is a pattern to the leadership in other parts of the globe for renewable energy, all signs point to their use of policy tools such as the FiT.128 The tension in creating supportive policy for renewable energy to get into the market and eventually scale-‐up in market share derives from the concept of ‘picking winners’ in contrast to creating status quo energy production lock-‐in or too narrow a range of new technologies. Again, the critical measure is with balance as the U.S. and Wisconsin transition to the new energy economy. A carefully targeted support of new energy technologies is vitally important in early markets. As the authors of the report, “On Picking Winners: The Need for Targeted Support of Renewable Energy” state: Looking forward, targeted support can create early markets for emerging technologies. This is because they have what innovation economists call dynamic effects: They foster innovation, yield increasing returns to adoption and help low carbon technologies move along their learning curve.129 In order to get renewable energy technologies established in the marketplace the demand-‐pull and supply-‐push policies are needed to allow costs to fall and performance improvements. The demand-‐pull policies demonstrating the most success are FiTs and renewable portfolio standards. There are differences and advantages to each policy separately or together. Evidence shows that the global policy choice for creating a catalyst in renewable energy generation is the FiT. 3.3 Toward Transparency, Longevity, and Certainty in U.S. Energy Policy The evidence is abundant that legacy high carbon coal and oil, and now to an increasing degree natural gas, have all the energy market advantages stacked in their favor. 130 Taxpayers and ratepayers have invested billions over decades into the high carbon energy infrastructure and the rules of the game regulating utilities have been written by the utility industry or worse often abdicated to industry. Clean technologies have many documented barriers to this legacy energy market system including unfavorable power pricing rules, limited transmission access and perceived risks to operating systems.131 Further, the capital investments needed for clean technology are constrained by recalcitrant U.S. energy leadership. When the true cost to society of high carbon coal is exposed, clean technology will win if a true level playing field is created in the market place. The shroud covering most legacy energy operations could be lifted and policy encouraging transparency, longevity and certainty (TLC) will allow clean technology better access to the energy market place. FiTs have proven, across the globe, to expedite the development of clean technologies and renewable energy generation. The issue of a predictable and transparent support framework to attract investors is the key factor highlighted in a study done by the Deutsche Bank Group, “Paying for Renewable Energy: TLC at the Right Price: Achieving Scale through Efficient Policy Design.” Transparency, longevity and certainty are identified as the critical factors that support investor confidence in renewable energy markets. This study gives extremely high markets to FiTs for meeting these criteria established for investor confidence.

46
Accomplishing these factors allows investors to better predict the returns of renewable energy projects. A more rapid development of renewable energy options is likely to occur under FiTs, according to the study authors, who state, “Using (FiTs) to support renewable energy accelerates the process of technology development. It enables these clean, low-‐carbon technologies to reach grid parity and provides a part of the solution to climate change mitigation.”132 According to NREL, globally, an estimated 75 percent of all solar PV and 45 percent of all wind energy electricity capacity installed before 2008 can be linked to this policy tool.133 This astonishing amount of global clean tech electricity capacity is due to the varieties of FiT policies. It is an extremely flexible policy tool that can be adapted to local energy generation sources and local energy production needs. Even with regional differences in policy designs some core elements of FiTs contracts are that they have transparency, longevity and certainty. Germany has realized the most success with this policy tool and has utilized it for the longest period of time. Between 2000 and 2008, Germany’s national share of renewable electricity generation more than doubled from 6.3 to 15.1 percent with the FiTs being a critical driver.134 The FiTs contracts offer a long-‐term, fixed payment to renewable energy generators. In comparison, the RPS seeks to create price competition between renewable generators to meet defined targets at least-‐cost, and typically defines maximum cost through a price cap instrument. How FiTs function? These tariffs allow a renewable energy generator to feed the power of their solar panel, wind turbine, methane digesters, biomass fueled boiler, or other renewable generation into the larger energy system ‘power grid’ and receive a government-‐prescribed price/unit generated (typically, $/kWh). This prescribed price is typically referred to as a buy-‐back, or off-‐take rate. Laws can differ, but essential principles include that the utility company must provide access to the grid to anyone or any group producing renewable energy. The buy-‐back rate is established for a set amount of time (say 15 – 20 years). This guaranteed long-‐term payment reduces the financial riskiness of the project. The stable buy-‐back rate is why banks and other financial lenders have more willingness to finance renewable energy projects. Prices can vary according to the type of technology, the size of the system and its location. Any potential increased costs to the utilities are paid for by adjustments to all customers’ bills. The utility gains increased energy generation capacity without having to invest in the cost of new generation under the FiTs. A system can be established to adjust policy or rates as needed. Some countries phase down the rate a little each year over time, under what is sometimes called ‘rate degression.’ 3.4 Conventional Energy Generation Gets Cost-‐Recovery It is important to remember that the U.S. utility sector currently gets cost-‐recovery plus a profit for its conventional generation (now primarily high carbon coal). The FiT policy is doing exactly the same thing saying distributive energy renewable clean technologies should get cost-‐recovery plus a profit just like regulated utility monopolies receive for conventional generation. In fact, Wisconsin utilities do have some experience with voluntary FiT, so it is not a ‘foreign policy’ that could not work in the U.S. But it is equally important to remember these voluntary FiTs were not cost based and the goal was not to create large amounts of distributed energy generation from renewable clean technology sources.

47
Some comparison and contrasting of policies such as FiTs and net metering are also valuable to consider. The goal of a FiT is to provide transparency, longevity and certainty to investors by making sure the project owner has adequate revenues to invest and advance clean energy technology. The net metering goal is to credit customers with the value of the power generated to a utility. The FiT represents critical cash flow over longer length of time, strengthening investor confidence; net metering provides a credit for excess generation, usually re-‐sets or zeros out at the end of each year. A strong net metering policy can be complementary to a feed in tariff policy, but is not a substitute in terms of promoting investments and larger scale up of a technology. The FiT can be a capital magnet which strengths a state or regional investment community by allowing for profits or return on investments in themarketplace.135 The technology innovation system analysis perspective looks closely at a range of functions or actions contributing to advancement of technology. The functions have been categorized and include important public policy actions. A thorough review of the literature on a variety of renewable energy policies by the authors Pablo del Rio and Mercedes Bleda using this technology innovation system analysis concludes that FiTs are far superior to any other policy action in advancing renewable energy technology innovation.136 The authors note that renewable energy technologies have different maturity levels and costs and so flexible, adaptable policies are more favorable for promoting innovation. They argue for energy source diversity because at the company level this creates a diversity of capital bases, experiments and innovation strategies.137 Early stage development of clean energy technologies is critical and the market formation consists of three stages; learning-‐by-‐doing; learning by using; and learning by interacting.138 This development process is, therefore, aided by “nursing markets” to allow for these learning stages to progress. Along the time period of this market development success occurs with a broad and aligned network for actors in the innovation system including a variety of businesses, technology users, policymakers, entrepreneurs advancing the technology.139 When successful the technology has a stronger chance of becoming institutionalized and more widely accepted.140 There is increasing evidence that feed-‐in tariffs can advance the energy technology innovation system. Further, feed-‐in tariff policy may lead to lower risks that other renewable electricity policy tools. The study by Pablo del Rio and Mercedes Bleda titled, “Comparing the innovation effects of support schemes for renewable energy technologies: A function of innovation approach,” extensively review other studies and academic papers to document feed-‐in tariff policy leadership in these categories. (See Appendix 2 for more details).
• FiTS lead to lower costs than other renewable electricity policy tools (14 studies). • FiTS are more effect in resulting in renewable energy deployment than other policies (19
studies). • FiTS lead to higher diversity of technologies (24 studies). • FiTS spur private R&D investment (7 studies). • FiTS positive impact on seven actions in a technology innovation system (15 studies)
The evidence is abundant that globally countries with the public policy tool of FiTs are world leaders in renewable energy deployment (see Figure 9 for wind in the European Union). Equally important as FiTs success in renewable energy generation deployment is the contribution this policy tool makes to advancing the energy technology innovation system.

48
Figure 9: European Union Wind Capacity Installed and Policy Support Tool (Prices for Renewable
Energies in Europe (2009) and German Renewable Energy Agencies (2012)
Differences Between FiTs and Renewable Portfolio Standards FiTs are often contrasted with the RPS. Wisconsin has an RPS that requires utilities to provide 10 percent of their energy from renewable sources by 2010. The RPS does not specify that 10 percent of renewable energy be from a homegrown renewable energy source. The RPS does not require buying renewable energy from distributed energy sources. The RPS leaves the requirement of procuring certain percentages of electricity in the sales mix of utilities at the utilities discretion. Some Wisconsin utilities in past offered higher renewable energy buy-‐back programs, but these programs were often limited to the utility’s voluntary green energy programs, and only in their service area and also were not uniform across the state. These programs often have limits on the type and eligible size of the generator and the total capacity of the program. The benefits typically go to the larger scale projects and often to out-‐of-‐state projects and investors (see Figure 8). Small-‐scale distributed energy generators are often disadvantaged under the current RPS.

49
Figure 10: WI 2011 Renewable Sales by Resource (PSC) 3.5 Renewable Portfolio Standards The Renewable Portfolio Standard (RPS), also known as the Renewable Electricity Standard (RES), is a popular policy instrument in the U.S. for advancing renewable energy generation. An RPS sets a percentage of electricity generation in an electric utility’s portfolio to come from renewable energy resources by a certain date. An RPS generally starts out small in the near-‐term and steadily increases the percentage of required renewable electricity into the portfolio over time. Energy sources that can be used to meet the RPS in Wisconsin include tidal and wave action, fuel cells using renewable fuels, solar thermal electric and PV, wind, geothermal, hydropower less than 60 megawatts, and biomass including landfill gas and biogas. Wisconsin’s current RPS has a statewide target of 10 percent by 2015, with statutory requirements varying by utility. Specific requirements are as follows:
• Each year from 2006-‐2009, a utility cannot decrease its renewable energy percentage below the average renewable energy percentage for 2001, 2002, and 2003.
• In 2010, each utility must increase its renewable energy percentage by at least two points above the average percentage for 2001, 2002, and 2003.
• Each year from 2011-‐2014, a utility cannot decrease its renewable energy percentage below the
average renewable energy percentage for 2010.
• In 2015, each utility must increase its renewable energy percentage by at least six points above the average percentage for 2001, 2002, and 2003.
• For each year after 2015, a utility cannot decrease its renewable energy percentage below the
percentage for 2015.141
50
The Wisconsin PSC must determine by June 1, 2016 if the state met the renewable energy goal of 10 percent by December 31, 2015. If the PSC determines that Wisconsin did not meet the state goal, it must determine how the goal can be achieved with additional actions. The PSC has determined that Wisconsin utilities are on track to achieve the state RPS, according a June 15, 2012 PSC staff report. Several national studies indicate that states having an RPS did make a contribution to new clean tech energy generation. But there are other studies that give the RPS policy a mixed record of success. Currently, there are 29 states with an RPS and the policy has driven the creation of one third of current U.S. non-‐hydro renewable electricity.142
The potential elimination of federal production and investment tax credits combined with states starting to meet their RPS likely means diminishing returns going forward. According to Mark Fulton and Reid Caplino of the Deutsche Bank Group: …Annual new renewable generating capacity needed to meet RPS mandates through 2030 amounts to 3.25 GW for 61.5 of new generating capacity total; this level of ‘RPS demand pull’ is slightly below its average level for 2008-‐2011 and is equal to roughly only 1/3 of total new U.S. renewable generating capacity in 2011 (9 GW) – which was supported on the supply side by federal incentives. Hence, going forward RPS programs will continue to make a valuable but limited contribution to deployment of new renewable generating capacity in the US.143
The authors of the Deutsche Bank study argue that the RPS alone is not adequate to develop a diverse portfolio of clean technology renewable energy solutions. Other research supports the thesis that in the U.S., the state RPS has been successful, but in some cases it appears the policy tool may work better for some renewable energy sources. An increasing number of empirical research studies and case studies on the state RPS are providing useful information on best practices in the design of these policies.144 The authors of a study looking at the Texas RPS found that one of the effect components of the state RPS was clarity in defining the utility capacity requirements for renewable energy generation.145 In this same study, the authors criticize voluntary renewable requirements as being ineffective and note that best practice designs for an RPS include: First, well-‐designed RPS should ideally apply equally and fairly to all load-‐serving entities in a state; second, it should require that it must be filled with generation from new investments in renewable sources; third, it should limit the amount of sale requirements fulfilled by sources external to the state; finally, it should have credible and significant penalties in case of non-‐compliance.146 Another study devised a method of comparing effective of state renewable policies and found a “significant correlation” of renewable portfolio standards with increase renewable energy generation.147 An earlier study looked at datasets for 39 of the United States between 1998-‐2002 and found that the RPS had a statistically significant effect on wind capacity generation, but could not find the same validation of state public benefit funds.148 One study looked at state level data for 1998-‐2006 and used what is called a “standard fixed-‐effects model” which allowed for comparing a wide range of factors in the state and other state policies.149 The first finding in the study was that RPS alone was not a significant factor in increasing the state renewable energy generation resources, although the longer a state had an RPS the greater impact it had on renewable energy generation.150 More significantly, other factors including political institutions, natural

51
resource endowments, deregulation, gross state product per capita, electricity use per person, electricity price, along with the presence of the state RPS contributed to renewable energy generation. Another recent study151 that validated that an RPS can “significantly impact” increase state renewable energy generation notes further that an important RPS policy design element is that if the state allows the “free trade” of RECs—it can significantly weaken the impact of the RPS in promoting in-‐state renewable energy generation. 152 Finally, the authors of another report153 looked across all existing RPS studies and also studied energy generation data of all 50 states over a longer period of time (1991-‐2007) to measure state RPS effectiveness as well as state clean energy funds or public benefits programs. The authors used a fixed effects and time-‐trend model over the period of time study and measured the increase in wind, solar, biomass and geothermal energy. Overall, the study found both policies of a state RPS and public benefits program were effective in increasing total state renewable energy generation, but found it more significant for solar and geothermal generation. This model also found other potential variables of state electricity price, natural gas price, share of coal generation, and per capita GDP to be generally insignificant, highlighting that the state policy of RPS and public benefits were more significant. The academic research on state renewable policies is still relatively new, although becoming more robust, and the impacts over time may become more critical especially in light of other federal and state policy sunsets or changes. 3.6 Production Tax Credit and Investment Tax Credit The federal policies called the production tax credit (PTC) and energy investment tax credit (ITC) have been critical to the growth of the wind energy generation sector and other renewable energy. The two tax credits were on track to expire, but were included in the American Taxpayer Relief Act of 2012 signed into law by President Obama on January 2, 2013. The PTC is production-‐based, meaning the more megawatts of energy produced the more credits it generates. U.S. wind projects with larger turbines, generating greater than 100 kilowatts (kW) are eligible to receive the PTC and accelerated depreciation. As written, the production credit would be for the first ten years of the project. The ITC is equal to a percentage of the projects qualified capital expenditure and is not linked to production. A project owner must be able to utilize the credit and some developers who not easily use the credits made arrangement with third-‐party providers to invest in projects to take the tax credit. The PTC dates back to 1993 and then starting in 2009, producers of wind and other renewable energy have been able to elect to take the ITC in lieu of the PTC. The ITC is a tax credit equal to 30 percent of capital expenditures for the construction of qualified projects. In addition to wind projects the credits could include closed-‐loop biomass, open-‐loop biomass, geothermal energy, landfill gas and qualified hydropower facilities. The wind industry has been the most visible advocate for these tax credits and the U.S. Congressional Service issued a report in October 10, 2012 to discuss the impacts to the wind sector.154 According to the Congressional Research Report: Proponents of extending the wind PTC point to the potential loss of manufacturing and construction jobs that will result if the tax incentive were to expire, the environmental benefits of U.S. wind development,

52
and the potential to re-‐establish the United States as a global leader in the emerging industry. Opponents of a wind PTC extension argue that all electricity generators should be subject to market-‐based competition, wind electricity generation has been incentivized for a long enough period of time, and wind projects should compete on their own economic and environmental merits without the support of federal incentives. 155
Figure 11: Historic Impact of Production Tax Credit on Installed Wind Capacity
Concern over the possible expiration of the federal tax credits, and other factors including lower costs, lead to 2012 being a record year for U.S. wind installations at 13.2 GW of new generating capacity. This was an increase over 2011 U.S. wind installation of more than 100 percent. The total U.S. wind energy generation is at 60 GW, comprising 6 percent of the U.S. capacity, according to Bloomberg New Energy Finance.156 The leading states to complete projects in 2012 according to this report were: 1. California (1,738 MW) 2. Kansas (1,589 MW) 3. Texas (1,532 MW) 4. Oklahoma (1,224 MW) 5. Oregon (845 MW) 6. Illinois (803 MW) 7. Iowa (790 MW) 8. Michigan (700 MW) 9. Pennsylvania (568 MW) 10. Colorado (496 MW) 157 3.7 Net Metering Laws: Opening the Door to Clean Energy Technology Competition? One challenge for any new energy project is connecting with the existing electrical grid system. Some states have tried to make it easier through a net metering law – a policy for consumers who generate smaller amounts of renewable energy through, for example, a home solar panel and receive a retail credit for a portion of the electricity. Other states have rules for interconnection or plugging-‐into the electrical grid that is more favorable to smaller-‐scale renewable generation. Net metering is a billing arrangement where a unit of energy, a kilowatt-‐hour (kWh) generated would have the same value a kWh consumed by the customer.

53
Both the rules and met metering are critical to enabling DE generation versus the base-‐load single source generation common to most large electrical utilities. The interconnection rules and net metering laws in our state come from federal law change (Energy Policy Act of 2005) modifying the Public Utility Regulatory Policies Act (PURPA). Net metering laws date back to the 1980s and while more than 43 states now have adopted these interconnection laws great variation does exist. Wisconsin Net Metering Policy The current net metering policy in Wisconsin allows several different types of renewable energy technologies to receive a net metering contract if the renewable energy system has a capacity of 20 kW or less. For example, We Energies customers have a 100 kW system capacity limit for wind projects.158
The Wisconsin net metering policy applies to investor-‐owned and municipal utilities. The Wisconsin interconnection rules apply only for systems up to 15 MW. Wisconsin’s net metering policy is on par with most other states in the Midwest, but Iowa has a 500 kW system capacity limit and Kansas has a 200 kW system capacity limit for non-‐residential customers. The Iowa and Kansas net metering policies only apply to investor-‐owned utilities. The Kansas policy also has an aggregate capacity limit of one percent of the utility’s peak demand during the previous year. Where does Wisconsin rank for net metering and interconnection policy compared to other states? A coalition of advocacy groups published a national ranking called, “Freeing the Grid. Best Practices in State Net Metering and Interconnection Procedures.”159 The study ranks Wisconsin with a D grade for its net metering law and a similar D grade for interconnection rules. The report suggests the Wisconsin law be changed to remove system size limitations to allow customers to meet all on-‐site energy needs and that it adopts safe harbor language to protect customer-‐generators from extra or unanticipated fees. For the Wisconsin interconnection laws the study suggests that Wisconsin drop its requirement for redundant disconnect switches and drop requirements for additional insurance for interconnect. Net Metering Outside of the Midwest States outside of the Midwest have used net metering policies to specifically drive adoption of biogas systems. The State of Vermont explicitly includes biogas from sewage-‐treatment plants and landfills, and anaerobic digestion of agricultural products, byproducts and wastes in the definition of renewable energy.160 Renewable energy systems up to 250 kW can qualify for a net metering contract. The policy does put in place an aggregate capacity limit of 2 percent of the electric utility’s 1996 peak demand or peak demand during the most recent calendar year (whichever is greater). The policy applies to all electric utilities in Vermont. In August of 2010 New York State made changes to their net metering law to drive adoption of biogas projects. The maximum system capacity for farm-‐based biogas systems was increased from 500 kW to 1 MW.161 Since the statutory change is fairly recent, implementation of the policy will require tariff revisions, which have yet to be determined. The New York net metering policy applies to investor-‐owned utilities and there is an aggregate capacity limit of 1 percent of the utility’s 2005 demand for solar, agricultural biogas, residential micro-‐CHP, and fuels cells. In August of 2012, Massachusetts strengthened its net meeting law. First, the new law doubled existing net metering capacity from 3 percent of a utilities peak load to six percent. The law change also allows half the increase to go to private projects and half to government entities. Equally important the new law directed regulators to develop and implement a standard interconnection timeline for distributed energy generation facilities.

54
Finally, the Massachusetts law change extended the mandate that utilities purchase long-‐term renewable energy generation (10-‐year and 20-‐year contracts) for an additional four percent of its historic peak load. Of the additional mandated renewable energy generation requirements, 10 percent must be reserved for “newly developed, small, emerging, or diverse renewable energy distributed generation facilities.162 Changes to Wisconsin’s Net Metering Policy Wisconsin could consider changes to the existing net metering statute by raising the capacity limit for all types of renewable energy, or implement specific language to drive biogas system development. An increase in the system capacity limit could be coupled with an aggregate capacity limit for an individual utility based on electric demand in a previous year. Increases in the net metering system capacity limit would be specific for biogas-‐to-‐electricity projects and would not address incentives for other utilizations of biogas. Increasing the system capacity limit of current net metering policies could drive development of additional biogas projects. Receiving retail rates for excess generation can help to improve the investment payback.
Figure 12: Net Metering Compared to Feed-‐in Tariff (ISLR) 3.8 Other Issues to Consider The Wisconsin Public Service Commission is very sensitive to its broad regulatory mission, particularly a growing public debate on energy rates, and now even the future of regulated utilities. A good indication comes through in the PSC “Final-‐Strategic Energy Assessment” issued in November of 2012. Included in the report is a brief history of the utility deregulation debate in Wisconsin. There are at least two groups again publicly calling for utility deregulation: the COMPETE Coalition and the Retail Energy Supply Coalition (RESA).163 These two groups are based out of Washington D.C. and see that the combination of high Wisconsin utility electricity rates, driven by coal prices and over building coal plants and the current low natural case prices, might revive a statewide utility deregulation debate. News coverage in the Milwaukee Journal Sentinel noted that the recent deregulation debate probably would not undo 100 years of utility regulation.164 The PSC notes in the SEA following the discussion on deregulation history that, “The Commission continues to be concerned about rates, and as one of the

55
ways to help address the issue, the Commission has, through rate proceedings, adopted innovative rate structures, including economic development rates.”165 Unfortunately for the PSC Commissioners, these so-‐called innovative rate structures, including economic development rates may have likewise got them in some hot water with the public. Two recent regulated utility rate hikes, We Energies and Madison, Gas & Electric, document that the PSC Commissioners, two appointed by Governor Scott Walker and one remaining appointee from former Governor Jim Doyle, are divided over policies to raise green power rates. These green power programs were set up by the regulated utilities to create a separate class of ratepayer who is ‘volunteering’ to purchase renewable energy, at a higher price, for their residential billing. The PSC granted We Energies a 4.2 percent overall electric rate increase for 2013 and 2.6 percent increase for 2014, which was less than the utility request of 5.5 and 3.6 percent for the two years, respectively. The rub for some was the big energy users, primarily industrial users, got a smaller rate increase and the average ratepayer a larger rate increase. 166 Further, the PSC allowed for a 74 percent increase in the rate charged green power users. The same pattern was true for the Madison Gas & Electric rate increase with a 60 percent increase for green power program. PSC Commissioner Eric Callisto, a former Governor Jim Doyle appointee, objected to the green power program increases suggesting they could have at least been phased-‐in over time. Another subtle change in the recent residential rate hikes approved by the PSC is that the fixed charge increases more. The fixed charge increased by 20 percent in the Madison Gas & Electric case. This means residential owners have less of an incentive to decrease energy use, because these fixed charges are not impacted by energy usage.167 In a similar pattern, the PSC rate hikes also punish other state energy efficiency and renewable energy efforts. The Wisconsin Legislature approved a law change in 2005 that capped how much the state’s largest energy users have to pay into the Focus on Energy program, which provides energy-‐efficiency incentives and funds for renewable energy projects. According to reports in the Milwaukee Journal Sentinel, these large industrial energy users will have paid at least $68 million less on their electricity bills since 2010 because of what was to have been a temporary cap on their payments into the Focus on Energy program. This shifts the burden to pay for these programs to small business and residential payers. A 2011 audit by the Legislative Audit Bureau found that some of these industrial companies received the benefits of Focus on Energy discounts paid nothing at all for the program.168
Figure 13: Wisconsin Electricity Rates Higher Than Other Midwest States (PSC)
56
3.9 Wisconsin Coal Lock-‐In Means High Utility Bill Rates Lost in the ever-‐increasing utility rate hikes for Wisconsin customers is the issue of increased risk from large coal plant building and coal usage. Wisconsin faces coal lock-‐in, resulting from high capital costs and long asset lifespans associated with coal fired plant investments. We Energies customers are on the hook to pay for the Oak Creek power plant that came in 8.7 percent over budget—adding $191 million to the price tag for coal plant. The utility plant is allowed to build into its rate increases the cost of the plant over a long period of payback time and to build a profit for the company into that same rate. Since Madison Gas & Electric customers also get power from the We Energies plant they will likely continue to see price hikes. The PSC can modify the utility increases, but current rate decision patterns show only small decreases for residential portion of the overall rate increase.169

57
4.0 Integrated Resource Planning Two Wisconsin stakeholder organizations that monitor utility rate issues and policy, Citizen Utility Board (CUB) and Clean Wisconsin, submitted comments into the PSC Strategic Energy Assessment process calling for more of an integrated resource planning (IRP) framework in the future. This is a small, but not at all insignificant policy change request from these organizations. Given the increasing factors of risk with the current energy portfolio mix in Wisconsin, strong dependence on fossil fuels of coal and natural gas, this process would require utilities to consider alternatives and regulators to monitor these energy factors. The PSC Wisconsin Strategic Energy Assessment 170 summarizes the integrated resource planning (IRP) framework thus:
• Madison Gas & Electric Company (MGE), Wisconsin Electric Power Company (WEPCO),
Wisconsin Power and Light Company (WPL) and Wisconsin Public Service Corporation (WPS) would each file individual integrated resource plans with the Commission every two years.
• The purpose of the process would be to identify a future portfolio of resources that offers
the best combination of cost and risk, taking into account factors such as environmental impacts, fuel supply availability, price volatility, resource diversity, and the ability of available resources to reliably meet demand.
• The process would be separate for each utility and would be on staggered schedules so that
commissioners, Commission staff, and intervenors could participate in each process at a reasonable pace. It would not be a contested case process and would be facilitated in the early stages by a series of monthly public meetings between stakeholders and the utility.
• At the monthly meetings, participants would offer input as to the content of the plan
(including whether any particularly pressing issues should be brought to the forefront) and would identify the range of modeling inputs to be used in the planning model. Following these meetings, the utility would perform the modeling and draft an IRP. Each utility’s written plan would show future long-‐term (20 years) resource needs, its analysis of the expected costs and associated risks of the alternatives to meet those needs, and its near-‐term four-‐year action plan to select the best portfolio of resources to meet those needs. The draft would then be distributed to parties informally for technical edits (e.g., typos, errors in reporting of figures) and would then be formally filed with the Commission for more substantive comments.
• Once the draft is filed at the Commission, technical workshops would be held at the
Commission to discuss substantive issues with the draft (e.g., if certain stakeholders believed the utility failed to properly take into account certain items).
• Written initial and reply comments would then be filed with the Commission on any
remaining issues.

58
• The Commission would then consider comments and recommendations on a utility’s plan at an open meeting before issuing an order “acknowledging” or “not acknowledging” each aspect of the utility’s proposed four-‐year action plan. An “acknowledgement” is an assessment that the action item is reasonable at the time, but it is not a final, binding determination and does not equate to pre-‐approval. The Commission would provide the utility an opportunity to revise the IRP before issuing an acknowledgment order. The Commission would also provide direction to a utility regarding any additional analyses or actions that should be undertaken in its next IRP.
• The utility would then issue the final IRP and submit an annual update that describes what
steps the utility has taken to implement the action plan, and that assesses what has changed since the acknowledgement order.171 The PSC did not officially take a position on the request for an integrated resource planning framework only indicated it was “noted” and it would “continue its dialogue with both the Executive and Legislative branches.”
4.1 Policy Consistency is Key Public policy can be a critical step in providing greater investor confidence in new technologies. The wind energy industry sees growth when the federal Production Tax Credit is in place and then when Congress lets it lapse the production, not surprisingly goes down (see Figure 11). The federal renewable energy tax subsidies, PTC and ITC and accelerated depreciation have been very effective at growing the wind energy sector in recent years. Interested parties can debate for how long new technologies need subsidies and support. In a similar fashion some may argue that energy subsidies are a fairness issue in which legacy energy has been historically subsidized for dozens and dozens of years compared to the length of time for new energy technologies. 4.2 Goals, Metrics and Measures for an Energy Technology Innovation System Wisconsin and the U.S. must set goals for increasing clean energy technology in a more diverse energy portfolio and then build policy around meeting the goals. Creating state and national clean energy technology goals, and then following with some additional measures and metrics, allows for a continuous evaluation of energy public policy effectiveness. The policymakers in the U.S. regularly debate both the amounts, and even whether to use public dollars for subsidies for an array of programs and technologies. Ideally, subsidies for a new technology should be time limited, allowing enough time to grow a new technology and surrounding business supply chain, but not have to keep a subsidy in perpetuity. Therefore, some strategic energy system thinking should be applied to the policy creation for advancing an energy technology innovation. When advancing energy technology innovation it is important to clarify it is necessary to have more than just a better R&D pipeline. As this paper points out, robust research has documented seven functions of completing a “successful” energy technology innovation system including entrepreneurial activities, knowledge development, knowledge diffusion through networks, guidance of the search (sometimes including policy goals and targets), market formation, resource mobilization, and creation of legitimacy. Simultaneously, there are many actors, networks and institutions active in the energy technology innovation systems that ultimately play a critical role in taking clean energy technologies to full market success.
59
There are other important areas in the energy innovation system, starting with basic science that includes fundamental research in fields like chemistry, biology and physics. The University of Wisconsin-‐Madison’s Great Lakes Bioenergy Research Center (GLBRC), funded by the DOE Office of Science, is an example. GLBRC is regional DOE research center focused on breaking bottlenecks in the development of cellulosic ethanol and advanced biofuels. At the Center, work involves basic science in microbial biology, agronomy, chemistry and many other areas in a portfolio of research to advance cellulosic ethanol opportunities. Similar steps in the area of R&D may involve either public or private entities, such as Virent Energy in Madison, Wisconsin that is a commercial spin-‐off of UW-‐Madison research. This company has a different pathway to an advanced biofuel, called BioForming, which is now in a demonstration project stage. Virent Energy has trademarked its platform that is based on a combination of aqueous phase reforming technology with modified conventional catalytic processing.172 The R&D pathways may take lab bench innovation and take it a step further to a proof of concept prototype. This is then a technology transfer from a university to private R&D to commercialization phase. During the technology demonstration phase it is not uncommon for government support, subsidies and grants be provided for commercial advancement. Virent Energy has received both state and federal funds for various stages of their work. This can be a very critical stage of work because the technology demonstration can be moving a business operation to position itself for a scaling up of production and preparing to cross the so-‐called ‘valley of death’ for new business starts and full commercial or industrial level of production. In this case, Virent Energy formed a business partnership with Shell to determine if this technology demonstration is ready for scaling up to commercial biorefinery stage. It may be at this stage that government procurement because an important step in nurturing a new technology forward. If the Department of Defense can purchase advanced biofuels it can create a pathway for the product to build a market. Finally, the technology innovation or product moves on to larger-‐scale manufacturing. At this stage, a favorable government tax incentive for manufacturing equipment or materials might be complementary. A government investment of infrastructure, such as railroad lines or roads for transportation at the manufacturing site, might be an example of supportive public policy. As one looks to advancing clean energy technology it is critical to follow the innovation entirely through the path to commercial success. Research on technology innovation has looked at metrics and measures such as total dollars invested in R&D, the total increase in the market of a specific energy technology, and the number of patents filed around a technology innovation to measure a policy effectiveness in advancing innovation. There remains some debate on which are the best set of measures, and others asking if better public accessible data is needed for private R&D investments, or even question whether new data is necessary for accurate determinations. When designing policy for an energy technology innovation system a great opportunity exists to measure policy success by improving and reaching some agreement metrics to gather. It is helpful to start with a publicly agreed upon policy goal.

60
Figure 14: Crossing the Commercialization Valley of Death (ORNL)
4.3 Smarter, Better and Affordable Public Private Partnerships for a Sustainable Energy Future Investing in a sustainable energy future is going to take new and creative ways to finance projects. There may not be one single best solution and it may take a variety of approaches. Policy can be helpful and public investments will be necessary, but some leverage of existing resources should be a first step. First, Wisconsin needs an energy policy goal such as a promoting a greater diversification of the state energy portfolio. The European Union has its 20-‐20-‐20 policy goal and the investment community can understand that goal for the longer-‐term investing strategies. The policy is designed to reduce the European Union greenhouse gas emissions by at least 20 percent below the 1990 levels; derive 20 percent of the European Union energy consumption from renewable energy sources, and create a 20 percent reduction in primary energy use compared with projected levels through improved energy efficiency. Second, there needs to be greater recognition that energy investments have longer time lines, probably at least 30 years and in some cases 50 years. When we live in times when energy policy changes with the two-‐year and four-‐year election cycles the investment community just freezes. Third, Wisconsin and the U.S. need to encourage smarter, better and affordable public private partnerships with a focus on securing financing for clean technology energy development. State government has done a pretty good job of creating a variety of clean energy technology programs with more than 20 state clean energy investment programs, according to study done by the Brookings-‐Rockefeller Project on State and Metropolitan Innovation. The report titled, “Leveraging State Clean Energy Funds for Economic Development,” suggests four steps to improve the existing programs (including in Wisconsin):
1. Reorient a significant portion of their funding toward clean energy-‐related economic development.
2. Develop detailed state-‐specific clean energy market data.

61
3. Link clean energy funds with economic development entities and other stakeholders in the emerging industry.
4. Collaborate with other state, regional, and federal efforts to be leverage public and private
dollars and learn more from each other’s experiences.173 Wisconsin has a wide array of programs for investment in economic development, but not such a strong focus on clean energy technology and innovation. One option might be to combine segments of the private entity, the Wisconsin Economic Development Corporation, the existing privately contracted out Focus on Energy program (especially targeting the dollars available) and better matching with programming and policy by merging portions of existing State Energy office, a subunit in the Department of Administration, and the energy research expertise in the existing regulatory agency of the Public Service Commission. While the regulators may need to maintain their independent status, a lot of energy knowledge at the PSC staff level could help as critical background and analysis for energy investment. The purpose is not to just shuffle the chairs at state agencies, but the current very disparate energy expertise in state agencies and programs needs to be a more coordinated effort. Getting this organized would not be easy, but it might merit further discussion. Beyond combining energy analysis and expertise, targeting the existing funding could also occur. Again, some recommendations came from the Brookings-‐Rockefeller study, including the following: A broader economic development strategy by state Clean Energy Funds would encompass the following, in addition to project finance and development:
• Innovation – Support R&D of new clean energy technologies.
• Investment – Use state loans and equity to provide initial investment in clean energy
companies and projects.
• Industry development – Employ a range of marketing support, business incubators, manufacturing and export promotion, supply chain analysis and enhancement, and workforce training programs to facilitate clean energy market transformation.174
Wisconsin could, for example, immediately remove the cap placed on its largest energy users for what they should pay into the Focus on Energy program. According to reports in the Milwaukee Journal Sentinel, these large industrial energy users will have paid at least $68 million less on their electricity bills since 2010 because of what was to have been a temporary cap on their payments into the Focus on Energy program. This shifts the burden to pay for these programs to small business and residential payers. The discount that goes to the companies, the equivalent of more than $18 million this year alone, could be used for an enhanced, targeted clean energy technology fund.175 These dollars could likely create more economic growth and new jobs than the existing companies receiving the break and would not require a new infusion of taxpayer general funds.

62
Wisconsin could look to success funds including the California Public Interest Energy Research (PIER) program—administered by the California Energy Commission (CEC); the Massachusetts Renewable Energy Trust Fund (RETF) and the Alternative and Clean Energy Investment Trust—both programs administered by the Massachusetts Clean Energy Center (MassCEC); or the Clean Energy Business Incubator Program—administered by The New York Energy Research and Development Agency, as the best models for investment in energy innovation.176 Finally, some other key suggestions for improving state efforts found in the Brookings-‐Rockefeller study include that state should:
• Improve ongoing data collection and monitoring on clean energy industry strengths and weaknesses in the state.
• Work with universities and research institutions to focus their intellectual attention on clean energy development research.
• Identify clean energy industry clusters, value chains, jobs, and finance, their gaps and needs within the state.
• Establish program metrics to measure program support, identify the best programs to advance, and which to modify or improve.177
Another model from other states is the Connecticut Clean Energy, Investment and Finance Authority (CEIFA), which uses public funds to attract private investors, especially for start-‐up small renewable energy projects. Wisconsin is likely to have more small projects especially given its unique opportunities in biogas and biomass energy generation. Pension funds – which are frequently looking for new investments-‐ have not participated in non-‐traditional energy investments because they have not packaged into tradable securities. More steps need to be taken to reduce risk on these projects, usually government programs or funds, and allow for greater leveraging with private company or pension fund investment. It is interesting that state and local governments have a long history of securing investment for infrastructure such as roads, bridges, and buildings, but can get the same success with energy infrastructure investments. This too may call for more creative public-‐private partnerships to allow businesses to partner, say with a municipality, on the energy project financing and allow for the sale of energy where there demand is located. Wisconsin likewise has strong constraints on third party investment in energy generation. There are more than 20 states that expressly allow third-‐party ownership of renewable energy systems on a customer’s business site. The limits in third-‐party ownership make no sense because the new renewable generation does not cost the taxpayer or ratepayer any money for the investment. The small business, retail store, or smaller industry decides to make the investment on its own in renewable energy generation for the onsite facility. This is a classic example of where the regulated utilities set the rules of the game by restricting third-‐party ownership of energy generation. This restriction clearly strains state economic growth and takes away the chance for a cleaner environment in the state.
63
4.4 U.S. and Wisconsin Progress in the Clean Energy Competition There is no clear consensus yet on best measures of success in clean energy technology advancement. Progress is being made on a set of measures globally and some conclusions can be reached now. Sometimes interpreting the measures for the U.S. depends upon whether you are a glass is half empty or half full person. A positive clean energy advocate could point to the fact that electricity from renewable energy sources doubled from 3 percent to 6 percent in four years. Another positive person might cite a U.S. record $48.1 billion worth of private clean energy investments in 2011.178 Yet, others who are trying to develop measures of clean energy technology advancement would cite some signs that the U.S. is lagging behind the rest of the world. The Pew Charitable Foundation in partnership with the Bloomberg New Energy Finance firm has recently been putting out an annual study titled, “Who’s Winning the Clean Energy Race?” The report focuses on the G-‐20 member nations with an emphasis on investment dollars, but also measures clean energy annual installations and other data. For example, on clean energy installations the U.S. ranks 10th in the world in its installed clean energy capacity growth since 2006. On another measure, the U.S. was 8th among the G-‐20 nations in what is term investment intensity, which compares clean energy investments with national economic output. Despite some good individual years, the U.S. over the past five years was not in the top 10 countries in clean energy technology investment growth rate.179 Another organization, The Information Technology and Innovation Foundation (ITIF), has developed an online tool called, the Energy Innovation Tracker. This tool allows for looking a database of federal investment in energy innovation. The ITIF put out a press release with the more recent update of their database on March 7, 2013, stating, “American energy innovation ecosystem is underfunded and heavily focuses on deployment incentives over research and development, demonstration, and manufacturing.”180 The ITIF news release also criticized the U.S. for lacking a comprehensive energy policy and overall lack of support for energy innovation funds. What may be even more troubling for the U.S. is the recent battle in Congress and with President Barack Obama that triggered federal budget sequestration means even fewer dollars will be available for energy technology innovation research and development activities. State level data on clean energy technology investments seems to be even leaner than comparison among nations. The National Association of State Energy Officials (NASEO) issued a report titled, “State and Industry Partnerships: Advancing U.S. Industrial Competitiveness through Energy Efficiency and Advanced Energy Technology Investments” issued in January 2012. The report was not a state-‐by-‐state comparison although it listed in aggregate energy efficiency investments by state for the industrial sector and multiple sectors. Wisconsin listed its Clean Energy Business Loan Program as having over $53 million available in the NASEO study.181 A few years earlier NASEO issued a report titled. “Models of Energy Innovation: Best Practices Study for State Energy Officials,” which provided case studies for the states of North Carolina, New York, and Colorado. This NASEO study also expanded on State Research and Development Initiatives in California, New York, Ohio and Pennsylvania.182 A private consulting firm, Clean Edge, issues several proprietary studies for clients including State and Metro Clean Tech Index studies. The Clean Edge executive summary reports are available for review at their Web site: www.cleanedge.com under the research tab menu. Their tool uses some 27 indicators under technology, 30 indicators under policy, and 24 indicators under capital for their state-‐by-‐state
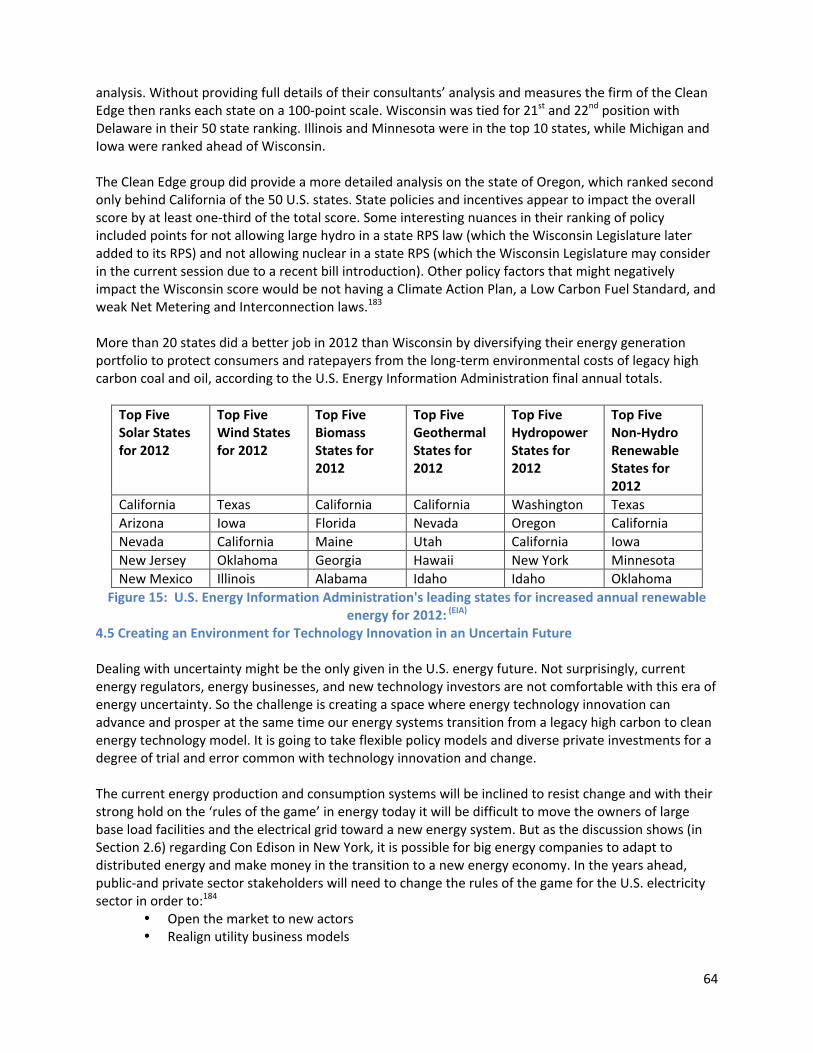
64
analysis. Without providing full details of their consultants’ analysis and measures the firm of the Clean Edge then ranks each state on a 100-‐point scale. Wisconsin was tied for 21st and 22nd position with Delaware in their 50 state ranking. Illinois and Minnesota were in the top 10 states, while Michigan and Iowa were ranked ahead of Wisconsin. The Clean Edge group did provide a more detailed analysis on the state of Oregon, which ranked second only behind California of the 50 U.S. states. State policies and incentives appear to impact the overall score by at least one-‐third of the total score. Some interesting nuances in their ranking of policy included points for not allowing large hydro in a state RPS law (which the Wisconsin Legislature later added to its RPS) and not allowing nuclear in a state RPS (which the Wisconsin Legislature may consider in the current session due to a recent bill introduction). Other policy factors that might negatively impact the Wisconsin score would be not having a Climate Action Plan, a Low Carbon Fuel Standard, and weak Net Metering and Interconnection laws.183 More than 20 states did a better job in 2012 than Wisconsin by diversifying their energy generation portfolio to protect consumers and ratepayers from the long-‐term environmental costs of legacy high carbon coal and oil, according to the U.S. Energy Information Administration final annual totals.
Top Five Solar States for 2012
Top Five Wind States for 2012
Top Five Biomass States for 2012
Top Five Geothermal States for 2012
Top Five Hydropower States for 2012
Top Five Non-‐Hydro Renewable States for 2012
California Texas California California Washington Texas Arizona Iowa Florida Nevada Oregon California Nevada California Maine Utah California Iowa New Jersey Oklahoma Georgia Hawaii New York Minnesota New Mexico Illinois Alabama Idaho Idaho Oklahoma
Figure 15: U.S. Energy Information Administration's leading states for increased annual renewable energy for 2012: (EIA)
4.5 Creating an Environment for Technology Innovation in an Uncertain Future Dealing with uncertainty might be the only given in the U.S. energy future. Not surprisingly, current energy regulators, energy businesses, and new technology investors are not comfortable with this era of energy uncertainty. So the challenge is creating a space where energy technology innovation can advance and prosper at the same time our energy systems transition from a legacy high carbon to clean energy technology model. It is going to take flexible policy models and diverse private investments for a degree of trial and error common with technology innovation and change. The current energy production and consumption systems will be inclined to resist change and with their strong hold on the ‘rules of the game’ in energy today it will be difficult to move the owners of large base load facilities and the electrical grid toward a new energy system. But as the discussion shows (in Section 2.6) regarding Con Edison in New York, it is possible for big energy companies to adapt to distributed energy and make money in the transition to a new energy economy. In the years ahead, public-‐and private sector stakeholders will need to change the rules of the game for the U.S. electricity sector in order to:184
• Open the market to new actors • Realign utility business models
65
• Coordinate power markets and systems operations Large private sector investments are likely necessary to develop long-‐term solutions in the new energy economy. The existing energy production and consumption systems will likely need new “re-‐regulation” and more positive market signals to invest in new technology. It is debatable whether the existing state-‐by-‐state electricity regulation model can work for the long-‐term, but for the short-‐term it is the model and it must be made to adapt. The new re-‐regulation or policies and rules must give existing energy companies incentives to invest in new technology, and permission to be business partners in innovative new system models involving combined heat and power and microgrids. They must make energy efficiency solutions part of the profit model. In exchange, the new re-‐regulation or policies and rules must open the market to new energy business or ‘players in the game’ because new dollars are needed along with new ideas. It is critical that the electricity sector be allowed to evolve and a part of this must be a bottom up approach to empower “prosumers” and third parties in conjunction with a broader and accelerated program of competition and innovation. Local units of government could also be an important part of the energy delivery mix and non-‐regulated energy cooperatives might also be encouraged to evolve and change to meet the needs of modern customers. Some energy analysts say the existing energy model cannot remain the same for the longer term. If the U.S. energy policy today is the so-‐called “all of the above” approach, then that only works for the short-‐term or a transition period of time. Energy expert Amory Lovins and the other Rocky Mountain Institute authors of the book Reinventing Fire, say that new technology solutions from renewable energy and steps of energy efficiency can replace the legacy system, and that over the long-‐term, “all of the above” approaches are a recipe for failure: First, central thermal plants are too inflexible to play well with variable renewables, and their market prices and profits drop as renewables gain market share. Second, if resources can compete fairly at all scales, some, and perhaps much, of the transmission built for a centralized vision of the future grid could become superfluous. Third, big, slow, lumpy, costly investments can erode utilities’ and other providers’ financial stability, while small, fast, granular investments can enhance it. Competition between those two kinds of investments can turn people trying to recover the former investments into foes of the latter—and threaten big-‐plant owners’ financial stability. Fourth, renewable, and especially distributed renewable, futures require very different regulatory structures and business models. Finally, supply costs are independent of scale of deployment, so PV systems installed in Germany in 2010 cost about 56% to 67% less than comparable U.S. Systems, despite access to the same modules and other technologies at the same global prices. 185
Other energy analysts say adapting the current system is the pathway to change. The author Peter Fox-‐Penner, in his book Smart Power suggests a couple of new business models of evolution as the “energy services utility” and/or the “smart integrator.”186 It might take some measured steps of transition for large vertically integrated energy systems to go to the “smart integrator” which Fox-‐Penner defines as “a utility that operates the power grid and its information and control systems but does not actually own or sell the power delivered by the grid.” 187

66
This model still has regulator approving market transactions but the smart integrator still guarantees reliability whether the power comes from upstream energy plants or the individual homeowner. The other model of energy service utility would be the focal point for energy expertise on diverse matters for customers including end-‐use equipment, computer software, design of heating and lighting systems, energy financing mechanism, in addition to still selling power. It might be too early to tell if these models or other models or new combinations of companies and services might emerge. Clearly, new training and education is needed for regulators under this evolving and changing regime. In the short term, the trend toward democratization of the electricity systems should not be stifled by protectionist regulation and maintaining the status quo. Small businesses, homeowners, and even larger businesses that want to invest in their own energy generation should be allowed to make personal investments in energy and not have heavy handed interconnection rules or arbitrary barriers in net metering stop this growing trend. Investment capital for energy must be allowed from all. Similarly, third-‐party energy players should be allowed to compete in an open and fair market. To what degree this requires some level of de-‐regulation, re-‐regulation or just fewer rules is going to need some sorting out. But there are already models in the energy system and regulatory structure that can be a starting point for building changes into the energy system from today and into the future. 4.6 Policy Development for Wisconsin in the Emerging Bioeconomy While overall progress has been made in the United States over the last decade in substituting renewable energy for legacy high carbon energy sources, success will not continue without a favorable policy environment. In fact, much of the progress to date is likely due to even modest policy measures in place today. Wisconsin, like many states, has taken a cautious approach to renewable energy policy and therefore remains a high carbon coal and petroleum state. This creates tremendous vulnerability in Wisconsin as coal and petroleum prices continue to rise in the future and the regulatory steps to limit greenhouse gases are likely to continue. The market in renewable energy has tremendous room for growth and it remains to be seen who will lead and who will follow in capturing this new economic opportunity. If Wisconsin wants to be a winner in the bioeconomy, then creating policy certainty for renewable energy is required. The Wisconsin competitive advantage in the bioeconomy is with biomass and biogas versus wind and solar energy generation. Our state has rich forests and woodlands in the North while agriculture remains a strong sector in the South and East non-‐urbanized sections of Wisconsin. The state’s leadership tradition in the food and fiber sector and paper and pulp sector bodes well for generating adequate biomass as well for the bioeconomy. The three leading biomass feedstocks of wood residues, corn stover and manure total more than 10.1 million dry tons available per year.188 With encouraging policy steps enough biomass could be annually collected to create the energy equivalent of a coal plant in Wisconsin. In addition, Wisconsin’s leadership in biofuels research, energy storage technology and microgrids create new business models and opportunities for the new energy economy. One strategic step for Wisconsin might be to encourage smaller scale distributive energy projects with biomass and biogas to create a bioeconomy supply chain that could adapt as larger scale opportunities such as integrated biorefineries mature sometime in the future into the energy market. The existing woody and agriculture supply chains would allow for some adaptation as smaller-‐scale distributive energy projects grow. Wisconsin already leads the nation in on-‐farm anaerobic digester to biogas energy generation with 31 systems. Although barriers exist today in the electric generation market, over
67
capacity and poor utility energy buy-‐back rates, anaerobic digesters create thermal energy opportunities and the conversions to pipeline quality gas and compressed natural gas (CNG) for vehicle fuels. Wisconsin already has a manufacturing and distribution anaerobic digester sector that could serve this market further with continued growth opportunities. In a similar, fashion Wisconsin has growth opportunities in the small-‐scale thermal energy market for home and small business heating needs. Wisconsin and the rest of the U.S. can move more swiftly in adopting new energy policy in this changing world. The energy technology innovation system approaches do show that nurturing new technology during a time of change is critical. Wisconsin remains in a position to be a leader in anaerobic digesters and biogas energy, compressed natural gas, combined heat and power, energy storage systems and microgrids. Our research potential is world class with the Wisconsin Energy Institute including the Great Lakes Bioenergy Research Center, Wisconsin Bioenergy Initiative, along with partners including the Wisconsin Energy Research Consortium and Center for Renewable Energy Systems, Wisconsin Electric Machines and Power Electronics Consortium, the UW System, UW Extension, and our technical colleges. To create a catalyst for energy innovation favorable public policy is critical. A starting point is policy that will diversify the Wisconsin energy generation portfolio and bring more businesses into a competitive energy environment.

68
Appendix 1 Factors Influencing Clean Energy Technology Development are (NREL):189 Resource availability One of the most obvious influencing factors affecting renewable energy development is resource availability. If a physical resource is not available, development cannot progress. In the case of renewable resources, however, a more relevant question is that of the economic feasibility of tapping the resource. States that import electricity or the fuels to produce electricity, as well as states that have high electricity costs, may have more incentive to develop the local renewable resources. This factor is inexorably linked to the issues of technology availability and cost. Technology cost Even in areas of excellent resource, technology price can be the limiting factor in development. As resource availability decreases, the cost of developing incremental units of a technology becomes more expensive, even if technology cost remains constant. This is the link between resource availability and technology cost. Policies can bring down costs through incentives or by encouraging research and development. Cost of renewable technologies, as well as those they compete with in also linked to the broader economic context. Economic context The broader economic context may influence the development of renewable energy in several ways. High costs of traditional generation may make the economics of renewable energy more favorable. States with higher gross state products may choose to direct more funds to clean energy development, even when issues such as the high cost of importing fossil fuels or electricity is not a driving factor. The ability to pay for clean energy is tied to the willingness to pay, which is an issue of social acceptance of the technologies. Social acceptance/opposition The level of public support can greatly influence renewable energy development. It has been demonstrated that organized opposition efforts with strong leadership can seriously hinder renewable energy development. Opposition may focus around issues such as aesthetics, effects on wildlife, or land and water use. Early involvement of relevant stakeholders and attention to a democratic decision making process can ease public concerns around renewable energy projects. The leadership of an influential champion who identifies mutually beneficial opportunities and rallies public support is also valuable. Ownership structure The ownership structure of proposed projects can affect whether owners are able to obtain necessary financing and take advantage of incentives. The ownership structure may even affect the acceptability of the project in the public view; locally owned and community-‐owned projects may be more favorably received. Financing

69
The design and availability of financing mechanisms can great affect renewable energy project development. There are several common barriers to obtaining financing for renewable energy projects. Financing institutions may view new or rapidly developing technologies as overly risky; project developers may be new in the market and, thus, have little credit worthiness; and financing fees and administrative procedures may be prohibitive to small developers. Policy measures can address these barriers and make financing available to a broader spectrum of projects representing a variety of ownership structures.

70
Appendix 2 Authors Del Rio and Bleda discuss six ways that feed-‐in tariffs are the best policy for advancing energy technology innovation steps discussed below:190
• Knowledge development and diffusion: FITS have proven more effective in encouraging deployment of immature renewable energy technologies, triggering learning effects to a greater extent. In addition, private R&D may have been encouraged better with FITS than with tradable green certificates, given the higher profit margins and the existence of a market immature renewable energy technologies under FITS.
• Influence on the direction of the search: Expectations of a large future market for immature RETs positively affect the direction of search and FITS have proven superior in this regard. The ineffectiveness of tradable green certificates and bidding in the past suggests that large markets may not be created. Furthermore, in countries with successful FITS (Germany and Spain for on-‐shore wind), long-‐term contracts, the stability of revenue and policy stability have proven critical to reduce risks for investors. In contrast, tradable green certificates price volatility generates substantial risks and greater risk premiums. Substantial bidding policy occur before the procedure is resolved. Large firms and incumbents have been promoted under tradable green certificates and bidding, whereas small actors have encouraged under FITS (except in Spain). FITS have favored new entrants and diversity of actors to a greater extent than tradable green certificates (TGCs). The direction of the search is likely to be different renewable energy innovations: FITS direct innovation efforts towards an improvement in the production efficiency of the technologies (higher revenues), whereas tradable green certificates and bidding encourage lower technology costs. Public R&D policies and other factors have a crucial role to play.
• Entrepreneurial experimentation: Again, FITS have proven superior in encouraging new entrants, diversity of actors and niche markets for immature renewable energy technologies. A significant degree of entrepreneurial dynamism can be observed under FITS. There is no evidence on the number of experimentation activities with the new technology. Important role of public R&D funding encouraging diversity.
• Market formation (creation of niche markets): FITS have promoted market formation better since they have been more effective to encourage all renewable energy technologies (mature and immature). They have triggered greater diversity of technologies through niche creation.
• Legitimation: Given their greater effectiveness and their greater profit margins for immature renewable energy technologies, which can be reinvested domestically, FITS have generated greater local benefits. In contrast to TGCs, FITS have not led to concentration of projects in places with the best renewable resources. Thus, they have generated lower negative externalities and local rejection. FITS have been less costly in terms of energy per kilowatt hour (EC 2008), the total costs of the scheme have significantly increased in some countries (Spain and Germany for solar PV), reducing its social acceptability. Advocacy coalitions and the difficulty in predicting the costs reductions of more expensive renewable energy technologies have led to too generous support compared to technology costs. Other factors (education and information about renewable energy technologies) may affect legitimacy.

71
• Resource Mobilization: FITS have proven less risky (lower risk premium than TGC and bidding) and investors prefer FITS. This has facilitated the mobilization of financial capital, as shown by the larger deployment in the countries with FITS. The impact of renewable energy innovations on this function is modest, however since there are other factors and policies in play (education and general innovation level).
72
Appendix 3 Recommendations for net metering guiding principles and best practices (Freeing the Grid):191
• Right to self-‐generate and connect to the grid: Every retail electricity customer has the right to
install solar generation equipment at the customer’s site, and interconnect to the utility grid without discrimination.
• Right to reduce electricity use: Any reduction in a customer’s energy use due to onsite solar generation should not be imputed as a stranded cost to the utility.
• Properly valuing solar electricity, and adequately compensating solar customers: Customer-‐sited
solar generation offers many benefits to the electric grid system and by extension to non-‐solar customers, including but not limited to: reduction in utility energy and capacity generation requirements, reduction in system losses; avoidance or deferral of distribution and transmission investments; localized grid support including increased reliability benefits; fuel-‐price certainty; and reductions in air emissions and water use. The aforementioned benefits should be quantified, and solar customers should be adequately compensated for the value their solar energy is delivering to the grid.
• Non-‐discriminatory practices within cost of service recovery: Any utility charges created
specifically for the purpose of recovering embedded fixed costs from net-‐metering customers should only recover net fixed costs, after accounting for all utility benefits and offsetting cost reductions due to the distributed solar. Similarly, any utility credits created for the purpose of assuring that economic benefits resulting from the deployment of net-‐metered solar systems are properly assigned back to the net-‐metering customer(s) should only reflect net benefits, after accounting for all utility costs.
• Statewide application: Net metering rules, regulations, and practices should be standardized
statewide.
• Transparency, access to data: Customers, or solar companies on customers’ behalves, should have access to load data (including hourly profiles) to ensure that customers can understand the economic implications of adopting onsite renewable energy technologies. Customers should have access to data regarding their own electricity consumption, with transparency into the tariffs available to them. Billing statements from utilities should clearly show the net energy consumed from the utility, and any energy or dollar credits carried forward as a result of solar generation in previous billing periods.
• Specific net metering best practices:
o Total program/state capacity limits: There should be no aggregate or statewide capacity limit for net metering.
o Individual System Capacity: Any individual system size limitation should be based only on the host customer’s load or consumption (e.g. AZ & CO).
o REC ownership: The owner of a net-‐metered system should retain ownership of renewable-‐energy credits (RECs) produced by their owned system, unless transferred to the utility or another party in exchange for acceptable compensation.
o Restrictions on “rollover”: Indefinite rollover, effectively or actually credited at retail

73
rate, should be an option for net-‐metered customers. The only exception is allowing for payments for annual net excess generation at a price no lower than the average daytime wholesale price for the prior year.
• Metering equipment: Retail electric customers utilizing net metering must not be required to purchase new metering equipment. Smart metering and other digital technology for energy management should be made available by the utility to solar and other customers on a non-‐discriminatory and open-‐access basis. Integrating smart meters or other advanced metering technologies would promote more accurate data on solar energy customers. More detailed and reliable meter data would result in more efficient planning and energy use.
• Customer classes: All customers should be able to participate in net metering.
• Aggregation: Virtual net metering and meter aggregation options should be available. Recommendations for Interconnection Best Practices
1. All utilities (including municipal utilities and electric cooperatives) should be subject to the state policy.
2. All customer classes should be eligible.
3. There should be three or four separate levels of review to accommodate systems based on system capacity, complexity and level of certification.
4. There should be no individual system capacity limit. The state standard should apply to all state-‐jurisdictional interconnections.
5. Application costs should be kept to a minimum, especially for smaller systems.
6. Reasonable, punctual procedural timelines should be adopted and enforced.
7. A standard form agreement that is easy to understand and free of burdensome terms should be used.
8. Clear, transparent technical screens should be established.
9. Utilities should not be permitted to require an external disconnect switch for smaller, inverter-‐
based systems.
10. Utilities should not be permitted to require customers to purchase liability insurance (in addition to the coverage provided by a typical insurance policy), and utilities should not be permitted to require customers to add the utility as an additional insured.
11. There should be a dispute resolution process.

74
Appendix 4 A Select Set of Other Clean Energy Technology Policy Tools192 Renewable Energy Carve-‐outs or Set-‐asides Within an RPS policy, states can choose to carve-‐out or set-‐aside a specific percentage of renewable energy generation to be derived from a specific renewable technology. Very few examples of resource carve-‐out or set-‐aside exist in current RPS policies, but the examples that do exist are for solar and wind or allow electric utilities to use a small percentage of energy efficiency to meet renewable energy requirements. An RPS allows electric utilities to select from a large menu of renewable energy options to meet the requirement, which can help to bolster development of large renewable generation projects, which benefit from economies of scale. However, biogas projects that are mostly distributed and have smaller energy generation can have a more difficult time securing power-‐purchase agreements when competing with larger generation projects. A carve-‐out or set-‐aside would require that a small percentage of an RPS be met with renewable electricity derived from biogas projects. A carve-‐out or a set-‐aside is more difficult to amend to an existing RPS. However, if the state of Wisconsin considers increasing the RPS requirement, a biogas carve-‐out could be a part of the discussion. Compliance/Credit Tracking In order to determine utility compliance with an RPS policy, states use some form of credit calculation and tracking. Most states call these credits renewable energy certificates or renewable energy credits (RECs). In Wisconsin these credits are referred to as Renewable Resource Credits (RRCs). Although the names are slightly different they are used to demonstrate RPS compliance and track voluntary renewable electricity purchases to ensure the same credit is not used in both the compliance and voluntary market. RRCs enable utilities in Wisconsin to buy and sell credits among utilities with excess renewable generation to utilities needing additional generation to demonstrate policy compliance. Wisconsin is also a member of the Midwest Renewable Energy Tracking System (M-‐RETS) which tracks renewable energy generation and assists in verifying compliance in Illinois, Iowa, Manitoba, Minnesota, Montana, North Dakota, Ohio, South Dakota, and Wisconsin. Credits contain information about the environmental and non-‐power attributes of renewable electricity generation including type of renewable energy resource, date when energy generation began, date when the renewable energy generation was built, generator’s location, eligibility for certification, and greenhouse gas emissions associated with the generation.193 Credits can monetize the value of renewable electricity by allowing renewable generators to sell credit attributes into the compliance or voluntary market. However, there is price volatility associated with the sale of renewable energy credits that presents some risk to the holder of the credit. Utility Green Pricing Programs Green pricing programs for different forms of renewable electricity make up a large share of the voluntary market for renewable electricity. A utility green pricing program offers an option to utility ratepayers to purchase renewable energy above standard electricity rates. Voluntary purchases by customers require electric utilities to supply enough renewable electricity to meet customer demand. Tracking systems, such as MRETS verify compliance and voluntary market transactions. MRETS assists
75
participating states to follow the REC’s path through a voluntary or compliance market and retire the credit once it has been used to avoid counting the credit again in the future.194 In Wisconsin, the law allows utilities to count green pricing sales towards the RPS, but utilities do not double count these credits as a best practice. Green Pricing for Biogas Projects Few models exist in the U.S. for utility green pricing programs focused on electricity generated from biogas projects. Central Vermont Public Service (CVPS) operates of the most successful green pricing programs for biogas electricity in the country. CVPS serves approximately 18,000 retail customers across the state of Vermont and created a program known as “CVPS Cow Power™.” The CVPS Cow Power™ program was the first manure-‐based, farm-‐to-‐consumer green power purchasing program in the U.S. CVPS customers who sign up to participate receive all, half, or a quarter of their energy through the program, which support renewable energy development and Vermont dairy farms. Utility customers who opt into the program pay a four-‐cent premium per kWh,100 percent is paid to cow power-‐producing farms. The program currently has six participating farms that receive a premium price for their electricity. Voluntary and compliance markets are both important to driving renewable electricity development and could become even more important with tailored programs for biogas-‐to-‐electricity voluntary purchases or statutory requirements such as carve-‐out or set-‐aside within an RPS policy or adopted of an enhanced renewable energy portfolio. Renewable Fuel Standards RFS policies require a specified percentage of fuel sold in a state or the United States to come from defined renewable sources. Twelve states have RFS policies, such as Iowa’s requirement that begins at 10 percent renewable fuel by 2010 and increases to 23 percent by 2018. Most activities for RFS policies waned following the large expansion of the federal RFS program passed in the December 2007 (Energy Independence and Security Act) and recently promulgated by the EPA as the RFS2 program. This policy specifies a specific volume of renewable fuels that must be sold in the United States, reaching a total volume of 36 billion gallons by 2022. The RFS2 program further divides the volumetric goal into subcategories for advanced biofuels and cellulosic biofuels, and fuels for each subcategory must meet greenhouse gas reduction targets and other definitions. A producer of biogas CNG must petition the EPA to generate credits under the RFS 2 program and these credits are further limited to the advanced biofuels sub-‐category, the smallest portion of the RFS2 program. Thus, the RFS program may provide some incentives for biogas CNG, but it is more difficult for a biogas CNG producer to generate credits than producers of conventional liquid biofuels (e.g., ethanol or biodiesel). Low Carbon Fuel Standards (LCFS) An LCFS rates different types of transportation fuels by their energy content and carbon footprint and allows fuel providers to choose what mix of fuels will be used to meet the requirement. The flexibility of an LCFS is unique among fuel policies, allowing all transportation fuels, including ethanol, biodiesel, natural gas, electricity for electric cars, and biogas CNG, to compete with petroleum to meet the standard. By increasing the diversity of fuels in a market, an LCFS will also reduce fuel price volatility that comes from over-‐dependence on petroleum. LCFS policies have been enacted in California; proposed at

76
the federal level; and proposed in 11 northeast states, Washington, Oregon, British Columbia, and Europe. LCFS policies have significant benefits for biogas CNG. Biogas producers that supply biogas CNG to vehicles, such as bus fleets, would generate credits that could be sold to petroleum suppliers that must meet the overall carbon footprint requirement of the policy. Since biogas CNG has been found to have the lowest carbon footprint of available fuels, credits generated by biogas CNG vehicle use are likely to have significant value to an LCFS credit market. Under California’s LCFS policy, the carbon footprint for various biogas CNG sources has been established making it easier for producers to generate credits under this policy. The Energy Title in the Federal Farm Bill In the 2002 Farm Bill, the first ever Energy Title was created with strong bipartisan support in the Congress. The concern about energy security was strong and many saw this as a value added economic opportunity for farmers and other landowners. In 2008, these Energy Title provisions were expanded and more mandatory funding commitments were put in place. The Congressional emphasis was on advanced biofuels and energy crops. Overall the energy title had some $1.12 billion in mandatory funding for a wide range of clean energy programming. Some of the 2008 Farm Bill Energy Title programs included:
• Rural Energy for America Program (REAP) with incentives for on-‐farm and business renewable energy and energy efficiency systems. The appropriation was $255 million.
• Biomass Crop Assistance Program (BCAP) with incentives for establishing energy crops on the landscape and for a portion of related costs for the collection, harvest and storage of these crops. Initially, the appropriation was “such sums as necessary” and later some overall caps were placed onto the program.
• Repowering Assistance with incentives to encourage conversion of existing ethanol plant boilers from fossil fuels to renewable biomass. The appropriation was for $35 million.
• Biorefinery Assistance Program with incentives to develop and construct pre-‐commercial and advanced biofuel production plants. The appropriation was for $320 million.
• Biobased Markets Program took an existing USDA initiative to expand biobased products and made some changes along with a $9 million appropriation.
• Biodiesel Fuel Education took an existing program and provided another $5 million appropriation.
• Bioenergy Program for Advanced Biofuels with incentives for advancing non-‐starch biofuels and a $300 million appropriation.
Of these Energy Title programs, REAP has been one of the most popular and generated the broad range of users. Rural small businesses and agricultural producers were the eligible recipients and it is the only significant program targeting these audiences. The eligible technologies include energy efficiency

77
measures, wind, solar, geothermal, anaerobic digesters, biomass energy, biofuels and small hydroelectric. It was both a grant and loan program with the grants limited to 25 percent cost-‐share with a maximum of $500,000 for renewable energy and $250,000 for efficiency projects. The program also had a 20 percent set-‐aside for small size grants. The program could also cover costs for energy audits and feasibility studies. The loan guarantees could go up to $25 million. From 2002 to the present the program saw sturdy growth in the number of applicants funding some 6,000 projects through 2011. 196
78
References 1. Energy Information Agency (EIA). (2012) Electric Power Monthly. June and November 2012 2. Jenkins, Jessie; Muro, Mark; Nordhaus, Ted; Shellenberger, Michael; Tawney, Letha; Trembath,
Alex. (2012). Beyond Boom & Bust. Putting Clean Tech on a Path to Subsidy Independence. Breakthrough Institute, Brookings Institute and World Resources Institute.
3. Energy Information Agency (EIA). (2012) Electric Power Monthly. June and November 2012. 4. Andrew Winston, 2012 (Sept. 26) http:www.businessweekcom/news/2012-‐09-‐26/the-‐
supposed-‐decline-‐of-‐green-‐energy. 5. World Wildlife Federation and David Gardiner & Associates, LLC. (2012) Power Forward: Why
the World’s Largest Companies Are Investing in Renewable Energy. 6. Andrew Winston, 2012 (Sept. 26) http:www.businessweekcom/news/2012-‐09-‐26/the-‐
supposed-‐decline-‐of-‐green-‐energy. 7. Post, W. (2011) GE Flex Efficiency 50 CCGT Facilities and Wind Turbine Facilities. The Energy
Collective. http://theenergycollective.com/willem-‐post/59747/ge-‐flexefficiency-‐50-‐ccgt-‐facilities-‐and-‐wind-‐turbine-‐facilities.
8. Google. (2011). “The Impact of Clean Energy Innovation. Examining the Impact of Clean Energy Innovation on the United States Energy System and Economy.” Google, July 2011.
9. Trebath, A., Jenkins, J., Nordhaus, T. and Shellenberger, M. (2012). Where the Shale Gas Revolution Came From. Government’s Role in the Development of Hydraulic Fracturing in Shale. Breakthrough Institute Energy and Climate Program.
10. Lester, R. (2013). In the war against climate change, look to the states. The Boston Globe. January 27, 2013.
11. Sierra Club. (2012) Locked-‐In. The Financial Risks of New Coal-‐fired Power Plants in Today’s Volatile International Coal Market.
12. World Wildlife Federation and David Gardiner & Associaties, LLC. (2012) Power Forward: Why the World’s Largest Companies Are Investing in Renewable Energy.
13. Crawford, S. (2012). What is the energy planning network and who dominates it? Energy Policy 45.
14. U.S. Energy Information Administration (EIA) (2012). Electric Power Monthly. June and November 2012.
15. Public Service Commission of Wisconsin (2012a). Final Strategic Energy Assessment. Energy 2018. Docket 5-‐ES-‐106.
16. Tromans, S. (2013) Emission performance standards – a good thing? ThirtyNine Essex Street. http://energylaw.39essex.com/blog/2013/01/emissions-‐performance-‐standards-‐a-‐good-‐thing#page=1 Listed as 14 in quote box highlighted.
17. Jenkins, J., Muro, M., Nordhaus, T., Shellenberger, M., Tawney, L. and Trembath, A. (2012) Beyond Boom & Bust. Putting Clean Tech on a Path to Subsidy Independence. Breakthrough Institute, Brookings Institute and World Resources Institute. April 20, 2012.
18. Jenkins, J., Muro, M., Nordhaus, T., Shellenberger, M., Tawney, L. and Trembath, A. (2012) Beyond Boom & Bust. Putting Clean Tech on a Path to Subsidy Independence. Breakthrough Institute, Brookings Institute and World Resources Institute. April 20, 2012.
19. Pew Charitable Trusts. (2012) Innovate, Manufacture, Compete: A Clean Energy Action Plan. Listed as 16 in quote box highlighted.
20. Nemet, G.F. (2009). Demand-‐pull, technology push, and government-‐led incentives for non-‐incremental technical change. Research Policy 38.
21. Nemet, G.F. (2009). Demand-‐pull, technology push, and government-‐led incentives for non-‐incremental technical change. Research Policy 38.
79
22. Lovins, Amory B. and the Rocky Mountain Institutes (2011). Reinventing Fire. Bold Business Solutions for the New Era. Chelsea Publishing. White River Junction, Vermont. Listed as 17 in quote box highlighted.
23. International Panel on Climate Change. (2007). Summary for Policymakers: Climate Change 2007: Synthesis Report.
24. U.S. Environmental Protection Agency. (2011). Inventory of U.S. Greenhouse Gas Emissions and Sinks: 1990-‐2009. EPA 430-‐R-‐11-‐005, April, 2011.
25. U.S. Environmental Protection Agency. (2011). Inventory of U.S. Greenhouse Gas Emissions and Sinks: 1990-‐2009. EPA 430-‐R-‐11-‐005, April, 2011.
26. Weyant, J. (2011). Accelerating the development and diffusion of new energy technologies: Beyond the “valley of death” Energy Economics 33.
27. Weyant, J. (2011). Accelerating the development and diffusion of new energy technologies: Beyond the “valley of death” Energy Economics 33. Listed as 20 in quote box highlighted.
28. Milwaukee Journal Sentinel. (2012) We Energies Authorized to Raise Rates. November 28, 2012. www.jsonline.com.
29. Milwaukee Journal Sentinel. (2012) Dominion Says Kewaunee Nuclear Plant Will Shut Down For Good. October 22, 2012. www.jsonline.com.
30. Public Service Commission of Wisconsin (PSC) (2012b). Report on the Rate and Revenue Impacts of the Wisconsin Renewable Portfolio Standard. Docket 5-‐GF-‐220. June 15, 2012.
31. Public Service Commission of Wisconsin (2012a). Final Strategic Energy Assessment. Energy 2018. Docket 5-‐ES-‐106.
32. Marshfield News Herald. (2013). 2012 Was Warmest Year in US History. January 28, 2012. www.marshfieldnewshearld.com.
33. Energy & Capital Newsletter. (2012). The November 19, 2012, Energy & Capital newsletter. 34. Public Service Commission of Wisconsin (2012a). Final Strategic Energy Assessment. Energy
2018. Docket 5-‐ES-‐106. 35. Public Service Commission of Wisconsin (PSC) (2012b). Report on the Rate and Revenue Impacts
of the Wisconsin Renewable Portfolio Standard. Docket 5-‐GF-‐220. June 15, 2012. 36. Sierra Club. (2012) Locked-‐In. The Financial Risks of New Coal-‐fired Power Plants in Today’s
Volatile International Coal Market. 37. Sierra Club. (2012) Locked-‐In. The Financial Risks of New Coal-‐fired Power Plants in Today’s
Volatile International Coal Market. 38. Oxford Economics. (2011). Fossil Fuel Price Shocks and a Low Carbon Economy. A report for the
UK Department of Energy. December 2011. www.oxfordeconomics.com. 39. Oxford Economics. (2011). Fossil Fuel Price Shocks and a Low Carbon Economy. A report for the
UK Department of Energy. December 2011. www.oxfordeconomics.com. 40. Newsweek. (2011). April 11, 2011. P. 24. (Listed as 27 in quote box highlighted). 41. Burtraw, Dallas and Krupnick, Alan. Center for Energy Economics and Policy, Resources for the
Future. (2012). The True Cost of Electric Power. 42. Burtraw, Dallas and Krupnick, Alan. Center for Energy Economics and Policy, Resources for the
Future. (2012). The True Cost of Electric Power. 43. Burtraw, Dallas and Krupnick, Alan. Center for Energy Economics and Policy, Resources for the
Future. (2012). The True Cost of Electric Power. 44. Burtraw, Dallas and Krupnick, Alan. Center for Energy Economics and Policy, Resources for the
Future. (2012). The True Cost of Electric Power. 45. Ludewig, D., Meyer, Bettina, & Schlegelmilch, K. Green Budget Germany (GBG). 2010. Heinrich
Boll Stiftung. Greening the Budget: Pricing Carbon and Cutting Energy Subsidies to Reduce the Financial Deficit in Germany.

80
46. Ludewig, D., Meyer, Bettina, & Schlegelmilch, K. Green Budget Germany (GBG). 2010. Heinrich Boll Stiftung. Greening the Budget: Pricing Carbon and Cutting Energy Subsidies to Reduce the Financial Deficit in Germany.
47. Burtraw, Dallas and Krupnick, Alan. Center for Energy Economics and Policy, Resources for the Future. (2012). The True Cost of Electric Power.
48. Binz, R., Sedano, R., Furey, D., and Mullen, D. (2012). Practicing Risk-‐Aware Electricity Regulation: What Every State Regulator Needs to Know. A Ceres Report. April, 2012.
49. Binz, R., Sedano, R., Furey, D., and Mullen, D. (2012). Practicing Risk-‐Aware Electricity Regulation: What Every State Regulator Needs to Know. A Ceres Report. P.6.
50. Binz, R., Sedano, R., Furey, D., and Mullen, D. (2012). Practicing Risk-‐Aware Electricity Regulation: What Every State Regulator Needs to Know. A Ceres Report. April, 2012.
51. Binz, R., Sedano, R., Furey, D., and Mullen, D. (2012). Practicing Risk-‐Aware Electricity Regulation: What Every State Regulator Needs to Know. A Ceres Report. P.7.
52. Binz, R., Sedano, R., Furey, D., and Mullen, D. (2012). Practicing Risk-‐Aware Electricity Regulation: What Every State Regulator Needs to Know. A Ceres Report. P.24.
53. Public Service Commission of Wisconsin (2012a). Final Strategic Energy Assessment. Energy 2018. Docket 5-‐ES-‐106.
54. Binz, R., Sedano, R., Furey, D., and Mullen, D. (2012). Practicing Risk-‐Aware Electricity Regulation: What Every State Regulator Needs to Know. A Ceres Report. P.27-‐32.
55. Binz, R., Sedano, R., Furey, D., and Mullen, D. (2012). Practicing Risk-‐Aware Electricity Regulation: What Every State Regulator Needs to Know. A Ceres Report. P.3.
56. Government Accounting Office (GAO). 57. Government Accounting Office (GAO). 58. Union of Concerned Scientists. (2012). Ripe for Retirement. The Case for Closing America’s
Costliest Coal Plants. 59. Union of Concerned Scientists. (2012). Ripe for Retirement. The Case for Closing America’s
Costliest Coal Plants 60. Union of Concerned Scientists. (2012). Ripe for Retirement. The Case for Closing America’s
Costliest Coal Plants 61. Union of Concerned Scientists. (2012). Ripe for Retirement. The Case for Closing America’s
Costliest Coal Plants 62. Union of Concerned Scientists. (2012). Ripe for Retirement. The Case for Closing America’s
Costliest Coal Plants. P.60. 63. Tierney, S. (2012). Why Coal Plants Retire: Power Market Fundamental as of 2012. P.2. 64. Energy Information Agency (EIA). (2012) EIA Weekly from 12/05/12 & the Early Release of 2013
Overview. 65. Personal Communication Wisconsin Public Service Commission. (2012) 66. Tierney, S. (2012). Why Coal Plants Retire: Power Market Fundamental as of 2012. P.4. 67. Trebath, A., Jenkins, J., Nordhaus, T. and Shellenberger, M. (2012). Where the Shale Gas
Revolution Came From. Government’s Role in the Development of Hydraulic Fracturing in Shale. Breakthrough Institute Energy and Climate Program.
68. Trebath, A., Jenkins, J., Nordhaus, T. and Shellenberger, M. (2012). Where the Shale Gas Revolution Came From. Government’s Role in the Development of Hydraulic Fracturing in Shale. Breakthrough Institute Energy and Climate Program.
69. Behr, P. (2013) ‘There’s no way to tell’ how much gas the U.S. can produce. In Energy Wire. February 11, 2013. www.eenews.net
70. Fordney, J. (2012). Renewable costs to continue to slide, natural gas to rise. In Platts online newservice. July 23, 2012. www.platts.com Listed as 40 in quote box highlighted.

81
71. Fordney, J. (2012). Renewable costs to continue to slide, natural gas to rise. In Platts online newservice. July 23, 2012. www.platts.com
72. Behr, P. (2013). Shale oil output anchors a record growth in U.S. production. In Energy Wire. January 9, 2013. www.eenews.net
73. Nelder, C. (2012). The Murky Future of U.S. Shale Gas. October 17, 2012. www.smartplanet.com 74. Potential Gas Committee. http://potentialgas.org//what-‐we-‐do-‐2 75. Behr, P. (2013) ‘There’s no way to tell’ how much gas the U.S. can produce. In Energy Wire.
February 11, 2013. www.eenews.net 76. Behr, P. (2013) ‘There’s no way to tell’ how much gas the U.S. can produce. In Energy Wire.
February 11, 2013. www.eenews.net 77. Downing, B. (2012). Water is big topic at World Shale Summit in Texas. October 24, 2012. The
OhioShale blog/Houston Chronicle www.ohio.com 78. Downing, B. (2012). Water is big topic at World Shale Summit in Texas. October 24, 2012. The
OhioShale blog/Houston Chronicle www.ohio.com 79. Binz, R., Sedano, R., Furey, D., and Mullen, D. (2012). Practicing Risk-‐Aware Electricity
Regulation: What Every State Regulator Needs to Know. A Ceres Report. 80. Union of Concerned Scientists (UCS) (2012). Ripe for Retirement. The Case for Closing America’s
Costliest Coal Plants. 81. Binz, R., Sedano, R., Furey, D., and Mullen, D. (2012). Practicing Risk-‐Aware Electricity
Regulation: What Every State Regulator Needs to Know. A Ceres Report. 82. Public Service Commission of Wisconsin (2012a). Final Strategic Energy Assessment. Energy
2018. Docket 5-‐ES-‐106. 83. Union of Concerned Scientists (UCS) (2012). Ripe for Retirement. The Case for Closing America’s
Costliest Coal Plants. 84. Chittum, Anna and Sullivan, Terry. (2012). American Council for an Energy-‐Efficient Economy.
Washington D.C. Coal Retirements and the CHP Investment Opportunity. Report Number IE123. September, 2012.
85. Chittum, Anna and Sullivan, Terry. (2012). American Council for an Energy-‐Efficient Economy. Washington D.C. Coal Retirements and the CHP Investment Opportunity. Report Number IE123. September, 2012.
86. Chittum, Anna and Sullivan, Terry. (2012). American Council for an Energy-‐Efficient Economy. Washington D.C. Coal Retirements and the CHP Investment Opportunity. Report Number IE123. September, 2012.
87. Massachusetts Net Metering, Database of State Incentives for Renewables and Efficiency. January 13, 2013.
88. American Wind Energy Association (AWEA). 2012. 89. Bloomberg New Energy Finance. (2012). Summary from North American Wind Power.
www.nawindpower.com/e107_plugins/content/content.php?content.10993. 90. Bloomberg New Energy Finance. (2012). Summary from North American Wind Power.
www.nawindpower.com/e107_plugins/content/content.php?content.10993. 91. Fagan, B., Chang, M., Knight, P., Schulz, M., Comings, T., Hausman, E., & Wilson, R. Synapse
Energy Economics (2012). The Potential Rate Effects of Wind Energy and Transmission in the Midwest ISO Region. May 22, 2012.
92. The Electricity Journal, April 2011. Elsevier Inc. (doi:/10.1016/j.tej.2011.03.014). 93. The Electricity Journal, April 2011. As cited from the Solar Energy Industries Association. 94. Post, W. (2011). GE FlexEfficiency 50 CCGT Facilities and Wind Turbine Facilities. The Energy
Collective. And a General Electric Web Site Fact Sheet. 95. The Electricity Journal, April 2011. Elsevier Inc. (doi:/10.1016/j.tej.2011.03.014).

82
96. California Net Metering, Database of State Incentives for Renewables and Efficiency. DSIRE. http://www.dsireusa.org/incentives/incentive.cfm?Incentive_Code=CA02R&ee=1
97. Margarett Jolly, David Logsdon, and Christopher Raup in August, 2012, Public Utilities Fortnightly. www.fortnightly.com.
98. Margarett Jolly, David Logsdon, and Christopher Raup in August, 2012, Public Utilities Fortnightly. www.fortnightly.com.
99. Margarett Jolly, David Logsdon, and Christopher Raup in August, 2012, Public Utilities Fortnightly. www.fortnightly.com.
100. Margarett Jolly, David Logsdon, and Christopher Raup in August, 2012, Public Utilities Fortnightly. www.fortnightly.com.
101. Kamentz, A. (2012). “If You Had a Microgrid, You Wouldn’t Be Waiting for the Power Company,” Scientific American, www.scientifcamerican.com/article.cfm?id=if-‐you-‐had-‐a-‐microgrid-‐you-‐wouldn’t-‐2012-‐11
102. Kamentz, A. (2012). “If You Had a Microgrid, You Wouldn’t Be Waiting for the Power Company,” Scientific American, www.scientifcamerican.com/article.cfm?id=if-‐you-‐had-‐a-‐microgrid-‐you-‐wouldn’t-‐2012-‐11
103. Kamentz, A. (2012). “If You Had a Microgrid, You Wouldn’t Be Waiting for the Power Company,” Scientific American, www.scientifcamerican.com/article.cfm?id=if-‐you-‐had-‐a-‐microgrid-‐you-‐wouldn’t-‐2012-‐11
104. Milwaukee Journal Sentinel. (2011). Microgrids energy storage project announced. October 4, 2011.
105. Crawford, S. (2012). What is the energy planning network and who dominates it? Energy Policy 45. P. 430-‐439. Listed as 54 in quote box highlighted.
106. Freeman, C., (1987). Technology Policy and Economic Performance: Lessons From Japan. Pinter, London World.
107. Negro, S., Hekkert, M.P., (2008). Explaining the success of emerging technologies by innovation system functioning: the case of biomass digestion in Germany. Technology Analysis and Strategic Management 20(4), 465-‐482.
108. Gross, R., Stern, J., Charles, C., Nicholls, J., Candelise, C., Heptonstall, P., and Greenacre, P., (2012). On picking winners: The need for targeted support for renewable energy. The Center for Energy Policy and Technology. Imperial College of London. October 2012. Ref: ICEPT/WP/2012/013.
109. Grubb, M. (2004). Technology Innovation and Climate Change Policy: an Overview of Issues and Options. Keio Journal of Economic Studies 41(2) 103-‐132.
110. Mokyr, J., (2002). Technologies and institutions. In: Steil, B., Victor, D., Nelson, R. (Eds), Technology Innovation and Economic Performance. Princeton University Press, Princeton, NJ.
111. Lundvall, B-‐A., (1992) National Innovation Systems: Towards a theory of innovation and interactive learning. Pinter, London. And Foxon, T.J., Gross, R., Chase, A., Howes, J., Arnall, A., Anderson, D., (2005). UK innovation systems for new and renewable energy technologies: drivers, barriers, and system failures. Energy Policy 33(6), 2123-‐2137.
112. Arrow, K., (1962). The economic implications of learning by doing. Review of Economic Studies 29, 155-‐173.
113. Rosenberg, N., 1982. Inside the Black Box: Technology and Economics. Cambridge University Press, Cambridge.
114. Lundvall, B-‐A., (1992). National Innovation Systems: Towards a Theory of Innovation and Interactive Learning. Pinter, London.

83
115. Negro, S., Hekkert, M.P., (2008). Explaining the success of emerging technologies by innovation system functioning: the case of biomass digestion in Germany. Technology Analysis and Strategic Management 20(4), 465-‐482.
116. Jacobsson, S., Bergek, A. (2011). Innovation system analyses and sustainability transitions: Contributions and suggestions for research. Environmental Innovation and Societal Transitions 1 (1), 41-‐57.
117. Negro, S., Hekkert, M.P., (2008). Explaining the success of emerging technologies by innovation system functioning: the case of biomass digestion in Germany. Technology Analysis and Strategic Management 20(4), 465-‐482.
118. Negro, S., Hekkert, M.P., (2008). Explaining the success of emerging technologies by innovation system functioning: the case of biomass digestion in Germany. Technology Analysis and Strategic Management 20(4), 465-‐482.
119. Al-‐Saleh, Yasser M. (2010). Systems of innovation as a conceptual framework for study the emergence of national renewable energy industries. World Journal of Science, Technology and Sustainable Development, Vol. 7, No. 4. P. 309-‐334.
120. Hekkert, M.P., Suurs, R., Negro, S.O., Kulmann, S., Smits, R.E.H.M., (2007). Functions of innovation systems: a new approach for analyzing technology change. Technological Forecasting and Social Change 74)4), 413-‐432.
121. Dosi, G., (1982). Technology paradigms and technology trajectories. Research Policy, Vol. 11, No. 3.
122. Schot, J., Hoogma, R., and Elzen, B. (1994) Strategies for Shifting Technology Systems: The cast of the automobile system. Futures 26(10)
123. Hekkert, M.P., Suurs, R., Negro, S.O., Kulmann, S., Smits, R.E.H.M., (2007). Functions of innovation systems: a new approach for analyzing technology change. Technological Forecasting and Social Change 74)4), 413-‐432.
124. Milborrow, D., (2002). External Costs and Real Truth. Windpower Monthly, 18(1), 32. 125. Sabatier, P.A., (1988). An advocacy coalition framework of policy change and the role of
policy-‐oriented learning therein. Policy Sciences 21, No. 2-‐3: 129-‐68. Also in Sabatier, P.A. and also in Jenkinssmith, H.C., (1988). Policy change and policy oriented learning—exploring an advocacy coalition framework—introduction. Policy Sciences 21, no. 2-‐3: 123-‐27. Also in Sabatier, P.A., (1998). The advocacy coalition framework: revisions and relevance for Europe. Journal of European Public Policy 5, no.1: 98-‐130.
126. Pew Charitable Trusts. (2012) Innovate, Manufacture, Compete: A Clean Energy Action Plan. Listed as 18 in quote box highlighted.
127. Gipe, Paul. (2012). World Future Council Newsletter on Feed In Tariffs. www.wind-‐works.org.
128. Gipe, Paul. (2012). World Future Council Newsletter on Feed In Tariffs. www.wind-‐works.org.
129. Gross, R., Stern, J., Charles, C., Nicholls, J., Candelise, C., Heptonstall, P., and Greenacre, P., (2012). On picking winners: The need for targeted support for renewable energy. The Center for Energy Policy and Technology. Imperial College of London. October 2012. Ref: ICEPT/WP/2012/013.
130. Unruh, G. (2002) Escaping Carbon Lock-‐In. Energy Policy 30 (2002) 317-‐325. & Unruh, G. (2000). Understanding Carbon Lock-‐In. Energy Policy 28 (2000) 817-‐830.
131. Beck, Fred and Martinot, Eric. (2004). From the Encyclopedia of Energy. Culter J. Cleveland, ed. Academic Press/Elsevier Science. 2004.
132. Deutsche Bank Group, “Paying for Renewable Energy: TLC at the Right Price: Achieving Scale through Efficient Policy Design.” (2009).

84
133. National Renewable Energy Laboratory www.nrel.gov 134. Bohme, D., Durrschmidt, W & van Mark, M. (Eds) (2009). Renewable Energy Sources and
Figures: National Development. Berlin, Germany: Federal Ministry for the Environment, Nature Conservation and Nuclear Safety.
135. Cory, K. National Renewable Energy Laboratory (NREL). (2009) Renewable Energy Feed-‐in Tariffs: Lessons Learned from the U.S. and Abroad powerpoint. July 10, 2009.
136. Del Rio, P., Bleda, M. (2012). Comparing the innovation effects of support schemes for renewable electricity technologies: A function of innovation approach. Energy Policy 50 (2012) 272-‐282 World Wildlife Federation and David Gardiner & Associaties, LLC. (2012) Power Forward: Why the World’s Largest Companies Are Investing in Renewable Energy.
137. Del Rio, P., Bleda, M. (2012). Comparing the innovation effects of support schemes for renewable electricity technologies: A function of innovation approach. Energy Policy 50 (2012) 272-‐282 World Wildlife Federation and David Gardiner & Associaties, LLC. (2012) Power Forward: Why the World’s Largest Companies Are Investing in Renewable Energy.
138. Bergek, A., Jacobsson, S., Carlsson, B., Lindmark, S., Rickne, A., 2008. Analyzing the functional dynamics of technological innovation systems–a scheme of analysis. Research Policy 37 (3), 407–429
139. Raven, R., 2005. Strategic Niche Management for Biomass. Ph.D. Thesis, Technical University Eindhoven, The Netherlands.
140. Dewald, U., Truffer, B., 2011. Market formation in technological innovation systems—diffusion of photovoltaic applications in Germany. Industry and Innovation 18 (3), 285–300
141. Wisconsin Renewable Portfolio Standard, Database of State Incentives for Renewables and Efficiency. http://www.dsireusa.org/incentives/incentive.cfm?Incentive_Code=WI05R&re=1&ee=1, accessed January 14, 2013.
142. Fulton, M., & Capalino, R. Deutsche Bank Group, Deutsche Bank Climate Change Advisors (2012). Ramping up Renewables: Leveraging State RPS Programs amid Uncertain Federal Support.
143. Fulton, M., & Capalino, R. Deutsche Bank Group, Deutsche Bank Climate Change Advisors (2012). Ramping up Renewables: Leveraging State RPS Programs amid Uncertain Federal Support.
144. Menz, F.C., Vachon, S., (2006) The effectiveness of different policy regimes for promoting wind power: experiences from the states. Energy Policy 34, 1786-‐1896. & Carley, S., (2009b).
145. Langniss, O., Wiser, R., (2003). The renewable portfolio standard in Texas; an early assessment. Energy Policy 31 (6), 527-‐535 & Wiser, R., Porter, K., Grace, R. (2005). Evaluating experience with renewable portfolio standards in the United States. Mitigation and Adaptation Strategies for Global Change 10, 237-‐263
146. Langniss, O., Wiser, R., (2003). The renewable portfolio standard in Texas; an early assessment. Energy Policy 31 (6), 527-‐535 & Wiser, R., Porter, K., Grace, R. (2005). Evaluating experience with renewable portfolio standards in the United States. Mitigation and Adaptation Strategies for Global Change 10, 237-‐263
147. Brown, E., Busche, S., (2008). State of the States 2008: Renewable Energy Development and the Role of Policy. National Renewable Energy Laboratory. NREL/TP-‐670-‐43021.
148. Shrimali, G., Kniefel, J. (2011). Are government policies effective in promoting deployment of renewable electricity resources? Energy Policy 39, 4726-‐4741.
85
149. Menz, F.C., Vachon, S., (2006) The effectiveness of different policy regimes for promoting wind power: experiences from the states. Energy Policy 34, 1786-‐1896. & Carley, S., (2009b).
150. Carley, S. (2009b). State renewable energy electricity policies: an empirical evaluation of effectiveness. Energy Policy 37, 3071-‐3081.
151. Yin, H., Powers, N. (2010). Do state renewable portfolio standards promote in-‐state renewable generation. Energy Policy 38, 1140-‐1149.
152. Yin, H., Powers, N. (2010). Do state renewable portfolio standards promote in-‐state renewable generation. Energy Policy 38, 1140-‐1149.
153. Shrimali, G., Kniefel, J. (2011). Are government policies effective in promoting deployment of renewable electricity resources? Energy Policy 39, 4726-‐4741.
154. Brown, P. Congressional Research Service (2012) U.S. Renewable Electricity: How Does the Production Tax Credit (PTC) Impact Wind Markets? October 10, 2012. www.crs.gov.
155. Brown, P. Congressional Research Service (2012) U.S. Renewable Electricity: How Does the Production Tax Credit (PTC) Impact Wind Markets? October 10, 2012. www.crs.gov.
156. Bloomberg New Energy Finance. (2012). Summary from North American Wind Power at www.nawindpower.com/e107_plugins/content/content.php?content.10993.
157. Bloomberg New Energy Finance. (2012). Summary from North American Wind Power at www.nawindpower.com/e107_plugins/content/content.php?content.10993.
158. Wisconsin Net Metering. Database of State Incentives for Renewbales and Efficiency. http://www.dsireusa.org/incentives/incentive.cfm?Incentive_Code=WI03R,, accessed January 14, 2013.
159. Browning, A. (2011). The Vote Solar Initiative. Network for New Energy Choices. Freeing the Grid. Best Practices in State Net Metering Policies and Interconnetion Procedures. 2011 Edition.
160. Vermont Net Metering, Database of State Incentives for Renewables and Efficiency. http://www.dsireusa.org/incentives/incentive.cfm?Incentive_Code=VT02R&re=1&ee=1, accessed January 13, 2013.
161. New York Net Metering, Database of State Incentives for Renewables and Efficiency. http://www.dsireusa.org/incentives/incentive.cfm?Incentive_Code=NY05R&re=1&ee=1, accessed January 13, 2013.
162. Stiles, T. and Foley and Lardner LLP. (2012). Massachusetts Provides Additional Policy Support for Net Metering. Lexology. October 1, 2012. www.lexology.com. Accessed on 10/08/12.
163. Wisconsin Public Service Commission (PSC) (2012a). Final Strategic Energy Assessment . Energy 2018. Docket E-‐ES-‐106. November 2012.
164. Milwaukee Journal Sentinel. (2012). September 22, 2012. www.jsonline.com 165. Wisconsin Public Service Commission (PSC) (2012a). Final Strategic Energy Assessment .
Energy 2018. Docket E-‐ES-‐106. November 2012. P.52. 166. Milwaukee Journal Sentinel. (2013). January 6, 2013. www.jsonline.com 167. Milwaukee Journal Sentinel. (2013). January 6, 2013. www.jsonline.com 168. Milwaukee Journal Sentinel. (2013). “Big energy users get rate increase breaks – at
other businesses, homeowners’ expense.” January 12, 2013. www.jsonline.com 169. Milwaukee Journal Sentinel. (2013). “Big energy users get rate increase breaks – at
other businesses, homeowners’ expense.” January 12, 2013. www.jsonline.com 170. Wisconsin Public Service Commission (PSC) (2012a). Final Strategic Energy Assessment .
Energy 2018. Docket E-‐ES-‐106. November 2012.

86
171. Wisconsin Public Service Commission (PSC) (2012a). Final Strategic Energy Assessment . Energy 2018. Docket E-‐ES-‐106. November 2012. P.33-‐34
172. Virent Energy. (2012) Web Site with Bioforming technology definition taken from www.virent.com/technology/bioforming. Accessed on January 24, 2012.
173. Milford, L., Muro, M., Morey, J., Saha, D., and Sinclair, M. (2012). Brookings-‐Rockefeller Project on State and Metropolitan Innovation. Leveraging State Clean Energy Funds for Economic Development. January, 2012.
174. Milford, L., Muro, M., Morey, J., Saha, D., and Sinclair, M. (2012). Brookings-‐Rockefeller Project on State and Metropolitan Innovation. Leveraging State Clean Energy Funds for Economic Development. January, 2012.
175. Milwaukee Journal Sentinel. (2013). “Big energy users get rate increase breaks – at other businesses, homeowners’ expense.” January 12, 2013. www.jsonline.com
176. Milford, L., Muro, M., Morey, J., Saha, D., and Sinclair, M. (2012). Brookings-‐Rockefeller Project on State and Metropolitan Innovation. Leveraging State Clean Energy Funds for Economic Development. January, 2012.
177. Milford, L., Muro, M., Morey, J., Saha, D., and Sinclair, M. (2012). Brookings-‐Rockefeller Project on State and Metropolitan Innovation. Leveraging State Clean Energy Funds for Economic Development. January, 2012.
178. Stepp, M. Forbes (2012). Three Warning Signs America is Losing the Global Energy Race. 10/22/12. www.forbes.com Accessed October 26, 2012.
179. Pew Charitable Trust. (2012) Innovate, Manufacture, Compete: A Clean Energy Action Plan.
180. Information Technology and Innovation Foundation (ITIF). (2013) News Release announcing the report “Breaking Down Federal Investments in Clean Energy” March 7, 2013.
181. NASEO (2012) State and Industry Partnerships: Advancing U.S. Industrial Competitiveness through Energy Efficiency and Advance Energy Technology Investments. January, 2012. www.naseo.org Accessed March 5, 2013.
182. NASEO (2009). Models of Energy Innovation: Best Practices Study for State Energy Officials. www.naseo.org Accessed March 5, 2013.
183. Clean Edge (2012). The 2012 State Clean Energy Index. www.cleanedge.com Accessed March 8, 2013.
184. Lovins, Amory B. and the Rocky Mountain Institutes (2011). Reinventing Fire. Bold Business Solutions for the New Era. Chelsea Publishing. White River Junction, Vermont.
185. Lovins, Amory B. and the Rocky Mountain Institutes (2011). Reinventing Fire. Bold Business Solutions for the New Era. Chelsea Publishing. White River Junction, Vermont.
186. Fox-‐Penner, Peter. (2010). “Smart Power. Climate Change, the Smart Grid, and the Future of Electric Utilities. Island Press. The Center for Resource Economics. Washington D.C.
187. Fox-‐Penner, Peter. (2010). “Smart Power. Climate Change, the Smart Grid, and the Future of Electric Utilities. Island Press. The Center for Resource Economics. Washington D.C.
188. Radloff, G. Du, X., Porter. P. and Runge, T. (2012) Wisconsin Strategic Bioenergy Feedstock Assessment. Wisconsin Bioenergy Initiative.
189. Doris, E., Busche, S. Hockett, S., and McLaren, J. (2009). The Role of State Policy in Renewable Energy Development. National Renewable Energy Laboratory (NREL). July, 2009. NREL/CP-‐6a2-‐45971.
190. Del Rio, P., Bleda, M. (2012). Comparing the innovation effects of support schemes for renewable electricity technologies: A function of innovation approach. Energy Policy 50 (2012) 272-‐282 World Wildlife Federation and David Gardiner & Associaties, LLC. (2012) Power Forward: Why the World’s Largest Companies Are Investing in Renewable Energy.
87
191. From Freeing the Grid. http://freeingthegrid.org/#education-‐center/best-‐practices/ Accessed on January 24, 2013.
192. Bilek, A., Taglia, P., and Radloff, G. (2011). The Biogas Opportunity in Wisconsin. Wisconsin Bioenergy Initiative. (A more extensive policy menu found on pp. 34-‐47).
193. U.S. EPA, Renewable Energy Certificates. http://www.epa.gov/greenpower/gpmarket/rec.htm, accessed January 14, 2013.
194. Bird, Lori, and Elizabeth Lokey. “Interaction of Compliance and Voluntary Renewable Energy Markets.” Golden, CO. National Renewable Energy Laboratory. October, 2007. http://www.nrel.gov/docs/fy08osti/42096.pdf
195. Environmental Law & Policy Center. (2013) Summary of Energy Title in the Farm Bill. Web Site. 2013. http://farmenergy.org/farm-‐bill-‐policy/farm-‐energy-‐legislation/quick-‐summary-‐of-‐energy-‐title-‐programs accessed 12/09/12
196. Environmental Law & Policy Center. (2013) Summary of Energy Title in the Farm Bill. Web Site. 2013. http://farmenergy.org/farm-‐bill-‐policy/farm-‐energy-‐legislation/quick-‐summary-‐of-‐energy-‐title-‐programs accessed 12/09/12
Bibliography
Al-‐Saleh, Yasser M. (2010). Systems of innovation as a conceptual framework for study the emergence of national renewable energy industries. World Journal of Science, Technology and Sustainable Development, Vol. 7, No. 4. P. 309-‐334.
Arrow, K., (1962). The economic implications of learning by doing. Review of Economic Studies 29, 155-‐173.
Beck, Fred and Martinot, Eric. (2004). From the Encyclopedia of Energy. Culter J. Cleveland, ed. Academic Press/Elsevier Science. 2004.
Bilek, A., Taglia, P., and Radloff, G. (2011). The Biogas Opportunity in Wisconsin. Wisconsin Bioenergy Initiative. (A short summary of the policy menu found on pp. 34-‐47). Binz, R., Sedano, R., Furey, D., and Mullen, D. (2012). Practicing Risk-‐Aware Electricity Regulation: What Every State Regulator Needs to Know. A Ceres Report. April, 2012.
Bloomberg New Energy Finance. (2012). Summary from North American Wind Power. www.nawindpower.com/e107_plugins/content/content.php?content.10993. Accessed on January 23, 2013
Bohme, D., Durrschmidt, W & van Mark, M. (Eds) (2009). Renewable Energy Sources and Figures: National Development. Berlin, Germany: Federal Ministry for the Environment, Nature Conservation and Nuclear Safety.
88
Brown, E., Busche, S., (2008). State of the States 2008: Renewable Energy Development and the Role of Policy. National Renewable Energy Laboratory. NREL/TP-‐670-‐43021.
Brown, P. Congressional Research Service (2012) U.S. Renewable Electricity: How Does the Production Tax Credit (PTC) Impact Wind Markets? October 10, 2012. www.crs.gov.
Bull, P., Long, N. and Steger, C. (2011). Designing Feed-‐in Tariff Policies to Scale Clean Distributed Generation in the U.S. The Electricity Journal. Elsevier Inc. 1040-‐6190.
Burtraw, Dallas and Krupnick, Alan. Center for Energy Economics and Policy, Resources for the Future. (2012). The True Cost of Electric Power.
Busche, S. (2010). Clean Energy Policy Analyses: Analysis of the Status and Impact of Clean Energy Policies at the Local Level. NREL Technical Report (NREL/TR-‐6a20-‐49720. December 2010.
Caperton, R. (2012). Center for American Progress. Renewable Energy Standards Deliver, Affordable, Clean Power. April 11, 2012.
Carley, S. (2009a). Distributed generation: An empirical analysis of primary motivators. Energy Policy 37, 1648-‐1659)
Carley, S., (2009b). State renewable energy electricity policies: an empirical evaluation of effectiveness. Energy Policy 37, 3071-‐3081.
Cardwell, Diane. (2012). Chain Stores Said to Lead Firms in Use of Sun Power. The New York Times. September 12, 2012.
Celebi, M., Graves, F. and Russell, C. The Brattle Group. (2012) Potential Coal Plant Retirements; 2012 Update. Discussion Paper, October 2012.
Coons, C. News Release Office of U.S. Senator Chris Coons. (2012). Bipartisan group of legislators urge President Obama to work with Congress on tax code changes reflective of an all-‐of-‐the-‐above energy strategy. December 12, 2012.
Cory, K. (2009). Renewable Energy Feed-‐in Tariffs: Lessons Learned from the US and Abroad. National Renewable Energy Lab (NREL). Presentation at the Vermont Public Service Board on July 10, 2009.
Chittum, Anna and Sullivan, Terry. American Council for an Energy-‐Efficient Economy. Washington D.C. Coal Retirements and the CHP Investment Opportunity. Report Number IE123. September, 2012.
Clean Edge (2012). The 2012 State Clean Energy Index. www.cleanedge.com Accessed March 8, 2013.
Clean Energy and Bond Finance Initiative. (2013). State Clean Energy Finance Initiative. February, 2013. www.cleanegroup.org/publications Accessed March 5, 2013.

89
Crawford, Seth. (2012). What is the energy policy-‐planning network and who dominates its?: A network and QCA analysis of leading firms and organizations. Energy Policy 45 (2012) p. 430-‐439.
Del Rio, P., Bleda, M. (2012). Comparing the innovation effects of support schemes for renewable electricity technologies: A function of innovation approach. Energy Policy 50 (2012) 272-‐282.
Doris, E., Busche, S. Hockett, S., and McLaren, J. (2009). The Role of State Policy in Renewable Energy Development. National Renewable Energy Laboratory (NREL). July, 2009. NREL/CP-‐6a2-‐45971.
Dosi, G. (1982). Technology paradigms and technology trajectories. Research Policy, Vol. 11, No. 3.
Deutsche Bank, 2009. Global Energy Transfer Feed-‐in Tariffs for Developing Countries. DB Climate Change Advisers (DBCCA), Frankfurt, Germany.
Energy & Capital Newletter. (2012). Arthur Berman cited in the November 19, 2012, Energy & Capital newsletter. Accessed on 11/19/12.
Environmental Law & Policy Center. (2013) Summary of Energy Title in the Farm Bill. Web Site. 2013. http://farmenergy.org/farm-‐bill-‐policy/farm-‐energy-‐legislation/quick-‐summary-‐of-‐energy-‐title-‐programs accessed 12/09/12.
Epstein, Paul, Jonathan J. Buonocore, Kevin Eckerle, Michael Hendryx, Benjamin M. Stout III, Richard Heinberg, Richard W. Clapp, Beverly May, Nancy L. Reinhart, Melissa M. Ahern, Samir K. Doshi, and Leslie Glustrom. 2011. Full cost accounting for the life cycle of coal in “Ecological Economics Reviews.” Robert Costanza, Karin Limburg & Ida Kubiszewski, Eds. Ann. N.Y. Acad. Sci. 1219: 73–98
Fagan, B., Chang, M., Knight, P., Schulz, M., Comings, T., Hausman, E., & Wilson, R. Synapse Energy Economics (2012). The Potential Rate Effects of Wind Energy and Transmission in the Midwest ISO Region. May 22, 2012.
Freeman, C., (1987). Technology Policy and Economic Performance: Lessons From Japan. Pinter, London.
Freeing the Grid. http://freeingthegrid.org/#education-‐center/best-‐practices/ Accessed on January 24, 2013.
Fox-‐Penner, Peter. (2010). “Smart Power. Climate Change, the Smart Grid, and the Future of Electric Utilities. Island Press. The Center for Resource Economics. Washington D.C.
Foxon, T.J., Gross, R., Chase, A., Howes, J., Arnall, A., Anderson, D., (2005). UK innovation systems for new and renewable energy technologies: drivers, barriers, and system failures. Energy Policy 33(6), 2123-‐2137.
Fulton, M., & Capalino, R. Deutsche Bank Group, Deutsche Bank Climate Change Advisors (2012). Ramping up Renewables: Leveraging State RPS Programs amid Uncertain Federal Support.

90
Gipe, Paul. (2012). World Future Council Newsletter on Feed In Tariffs. www.wind-‐works.org.
Gross, R., Stern, J., Charles, C., Nicholls, J., Candelise, C., Heptonstall, P., and Greenacre, P., (2012). On picking winners: The need for targeted support for renewable energy. The Center for Energy Policy and Technology. Imperial College of London. October 2012. Ref: ICEPT/WP/2012/013.
Grubb, M. (2004). Technology Innovation and Climate Change Policy: an Overview of Issues and Options. Keio Journal of Economic Studies 41(2) 103-‐132.
Herndon, A. Bloomberg News Service. (2013). Solar Costs to Fall as REITs Emerge as Source of Funding. January 24, 2013. www.renewableenergyworld.com
Hekkert, M.P., Suurs, R., Negro, S.O., Kulmann, S., Smits, R.E.H.M., (2007). Functions of innovation systems: a new approach for analyzing technology change. Technological Forecasting and Social Change 74)4), 413-‐432.
Hurlbut, David. (2008). State Clean Energy Policies: Renewable Portfolio Standards. National Renewable Energy Laboratory (NREL). July, 2008. NREL/TP-‐670-‐43512.
Information Technology and Innovation Foundation (ITIF). (2013) News Release announcing the report “Breaking Down Federal Investments in Clean Energy” March 7, 2013. www.energyinnovation.us Accessed March 8, 2013.
Jenkins, Jessie; Muro, Mark; Nordhaus, Ted; Shellenberger, Michael; Tawney, Letha; Trembath, Alex. (2012). Beyond Boom & Bust. Putting Clean Tech on a Path to Subsidy Independence. Breakthrough Institute, Brookings Institute and World Resources Institute. April, 2012.
Jacobsson, S., Bergek, A. (2011). Innovation system analyses and sustainability transitions: Contributions and suggestions for research. Environmental Innovation and Societal Transitions 1 (1), 41-‐57.
Johnson, L., and Hope, C. (2012). The social cost of carbon in U.S. regulatory impact analyses: an introduction and critique. Journal of Environmental Studies. DOI 10.1007/s13412-‐012-‐0087-‐7. September 12, 2012.
Jolly, Margaret, Logsdon, David, and Raup, Christopher for Con Edison. (2012) Capturing Distributed Benefits. Public Utilities Fortnightly. August, 2012. http://www.fortnightly.com. Accessed on August 27, 2012.
Kamentz, A. (2012). “If You Had a Microgrid, You Wouldn’t Be Waiting for the Power Company,” Scientific American, 11/06/12. accessed online on 11/08/12 at
www.scientifcamerican.com/article.cfm?id=if-‐you-‐had-‐a-‐microgrid-‐you-‐wouldn’t-‐2012-‐11
Langniss, O., Wiser, R., (2003). The renewable portfolio standard in Texas; an early assessment. Energy Policy 31 (6), 527-‐535.

91
Lester, R. (2013). In the war against climate change, look to the states. The Boston Globe. January 27, 2013.
Lovins, Amory B. and the Rocky Mountain Institutes (2011). Reinventing Fire. Bold Business Solutions for the New Era. Chelsea Publishing. White River Junction, Vermont. September, 2011.
Ludewig, D., Meyer, Bettina, & Schlegelmilch, K. Green Budget Germany (GBG). 2010. Heinrich Boll Stiftung. Greening the Budget: Pricing Carbon and Cutting Energy Subsidies to Reduce the Financial Deficit in Germany.
Lundvall, B-‐A., (2002) Innovation, Growth and Social Cohesion: The Danish Model, Cheltham, Edward Elgar.
Lundvall, B-‐A., (1992) National Innovation Systems: Towards a theory of innovation and interactive learning. Pinter, London.
Menz, F.C., Vachon, S., (2006) The effectiveness of different policy regimes for promoting wind power: experiences from the states. Energy Policy 34, 1786-‐1896.
Milborrow, D. (2002). External Costs and Real Truth.” Windpower Monthly, 18 (1), 32.
Milford, L., Muro, M., Morey, J., Saha, D., and Sinclair, M. (2012). Brookings-‐Rockefeller Project on State and Metropolitan Innovation. Leveraging State Clean Energy Funds for Economic Development. January, 2012.
Milwaukee Journal Sentinel. (2012) We Energies Authorized to Raise Rates. November 28, 2012. www.jsonline.com
Milwaukee Journal Sentinel. (2011). Microgrids energy storage project announced. October 4, 2011. www.jsonline.com
Milwaukee Journal Sentinel. (2013) Green-‐Power Users Get Brunt of Rate Increase. January 6. 2013. www.jsonline.com
Milwaukee Journal Sentinel. (2013). “Big energy users get rate increase breaks – at other businesses, homeowners’ expense.” January 12, 2013. www.jsonline.com
Mokyr, J., (2002). Technologies and institutions. In: Steil, B., Victor, D., Nelson, R. (Eds), Technology Innovation and Economic Performance. Princeton University Press, Princeton, NJ.
Mormann, F. and Reicher, D. Brookings. (2012). Smarter Finance for Cleaner Energy: Open Up Master Limited Partnerships (MLPs) and Real Estate Investment Trusts (REITs) to Renewable Investment. November, 2012. NASEO (2012). State and Industry Partnerships: Advancing U.S. Industrial Competitiveness through Energy Efficiency and Advanced Energy Technology Investments. January, 2012. www.naseo.org Accessed March 5, 2013.
92
NASEO (2009). Models of Energy Innovation: Best Practices Study for State Energy Officials. www.naseo.org Accessed March 5, 2013.
Negro, S., Hekkert, M.P., (2008). Explaining the success of emerging technologies by innovation system functioning: the case of biomass digestion in Germany. Technology Analysis and Strategic Management 20(4), 465-‐482.
Nemet, G.F. (2009). Demand-‐pull, technology push, and government-‐led incentives for non-‐incremental technical change. Research Policy 38, 2009, 700-‐709.
Newsweek. (2011). April 11, 2011. P. 24. Steven Chu interview by John Avalon.
Oxford Economics. (2011). Fossil Fuel Price Shocks and a Low Carbon Economy. A report for the UK Department of Energy. December 2011. www.oxfordeconomics.com
Pew Charitable Trusts. (2012) Innovate, Manufacture, Compete: A Clean Energy Action Plan.
Public Service Commission of Wisconsin (PSC) (2012a). Final Strategic Energy Assessment. Energy 2018. Docket 5-‐ES-‐106. November 2012.
Public Service Commission of Wisconsin (PSC) (2012b). Report on the Rate and Revenue Impacts of the Wisconsin Renewable Portfolio Standard. Docket 5-‐GF-‐220. June 15, 2012.
Public Service Commission of Wisconsin (PSC) (2009). Strategic Energy Assessment. Final Report. Ensuring the Availability, Reliability and Sustainability of Wisconsin’s Electric Supply. Docket 5-‐ES-‐104. April 2009.
Radloff, G. Du, X., Porter. P. and Runge, T. (2012) Wisconsin Strategic Bioenergy Feedstock Assessment. Wisconsin Bioenergy Initiative.
Rosenberg, N., 1982. Inside the Black Box: Technology and Economics. Cambridge University Press, Cambridge.
Sabatier, P.A., (1988). An advocacy coalition framework of policy change and the role of policy-‐oriented learning therein. Policy Sciences 21, No. 2-‐3: 129-‐68.
Sabatier, P.A., and Jenkinssmith, H.C., (1988). Policy change and policy oriented learning—exploring an advocacy coalition framework—introduction. Policy Sciences 21, no. 2-‐3: 123-‐27.
Sabatier, P.A., (1998). The advocacy coalition framework: revisions and relevance for Europe. Journal of European Public Policy 5, no.1: 98-‐130
Schot, J., Hoogma, R., and Elzen B. (1994) Strategies for shifting technological systems: The case of the automobile system. Futures, 26(10), 1060-‐1076.

93
Shrimali, G., Kniefel, J. (2011). Are government policies effective in promoting deployment of renewable electricity resources? Energy Policy 39, 4726-‐4741.
Sierra Club. (2012) Locked-‐In. The Financial Risks of New Coal-‐fired Power Plants in Today’s Volatile International Coal Market.
Stepp, M. Forbes (2012). Three Warning Signs America is Losing the Global Energy Race. 10/22/12. www.forbes.com Accessed October 26, 2012.
Stiles, T. and Foley and Lardner LLP. (2012). Massachusetts Provides Additional Policy Support for Net Metering. Lexology. October 1, 2012. www.lexology.com. Accessed on 10/08/12.
Tierney, S. (2012). Why Coal Plants Retire: Power Market Fundamental as of 2012. The Analysis Group, Inc. February 16, 2012. www.analysisgroup.com/uploadedFiles/News_and_Events/News/2012_Tierney_WhyCoalPlantsRetire.pdf
The Electricity Journal. (2011). Solar PVs Are Now Cheaper Than Natural Gas. Elsevier Inc. April, 2011. 1040-‐6190.
The Wisconsin Taxpayer Alliance. (2010). Electricity: Competitive Advantage Eroding? The Wisconsin Taxpayer. October 2010. Vol. 78. No. 10.
Trebath, A., Jenkins, J., Nordhaus, T. and Shellenberger, M. (2012). Where the Shale Gas Revolution Came From. Government’s Role in the Development of Hydraulic Fracturing in Shale. Breakthrough Institute Energy and Climate Program. May, 2012.
Tromans, S. (2013) Emission performance standards – a good thing? ThirtyNine Essex Street. Lexcology January 17, 2013. http://energylaw.39essex.com/blog/2013/01/emissions-‐performance-‐standards-‐a-‐good-‐thing#page=1 (accessed on January 17, 2003).
Union of Concerned Scientists. (2012). Ripe for Retirement. The Case for Closing America’s Costliest Coal Plants.
United States Government Accountability Office. (2012) Significant Changes Are Expected in Coal-‐Fueled Generation, but Coal is Likely to Remain a Key Fuel Source. GAO-‐13-‐72.
United States Energy Information Administration (EIA) (2012). Annual Energy Outlook 2012.
United States Energy Information Administration. (EIA) (2012) Electric Power Monthly. June and November 2012.
Unruh, G. (2002) Escaping Carbon Lock-‐In. Energy Policy 30 (2002) 317-‐325.
Unruh, G. (2000). Understanding Carbon Lock-‐In. Energy Policy 28 (2000) 817-‐830.

94
Virent Energy. (2012) Web Site with Bioforming technology definition taken from www.virent.com/technology/bioforming. Accessed on January 24, 2012.
World Wildlife Federation and David Gardiner & Associaties, LLC. (2012) Power Forward: Why the World’s Largest Companies Are Investing in Renewable Energy. www.ceres.org/resources/reports/power-‐forward-‐why-‐the-‐world2019s-‐largest-‐companies-‐are-‐investing-‐in-‐renewable-‐energy/view
Accessed December 14, 2012.
Winston, Andrew. (2012). Bloomberg Businessweek. The Supposed Decline of Green Energy. September 26, 2012. Accessed at: http:www.businessweekcom/news/2012-‐09-‐26/the-‐supposed-‐decline-‐of-‐green-‐energy on October 25, 2012.
Wiser, R., Porter, K., Grace, R. (2005). Evaluating experience with renewable portfolio standards in the United States. Mitigation and Adaptation Strategies for Global Change 10, 237-‐263.
Wiser, R., Barbose, G. (2008) Renewable Portfolio Standards in the United States: A Status Report with Data Through 2007. Lawrence Berkeley National Laboratory Report LBNL-‐154E.
Yin, H., Powers, N. (2010). Do state renewable portfolio standards promote in-‐state renewable generation. Energy Policy 38, 1140-‐1149.
![05[2] Strategy competitors, competitive rivalry, competitive behavior, and competitive dynamics · PDF fileDefine competitors, competitive rivalry, competitive behavior, and competitive](https://img.pdfslide.us/doc/110x75/5aa5b2eb7f8b9ac8748d8018/052-strategy-competitors-competitive-rivalry-competitive-behavior-and-competitive.jpg)