Embed Size (px)
Citation preview
Journal of Education and Learning; Vol. 10, No. 4; 2021 ISSN 1927-5250 E-ISSN 1927-5269
Published by Canadian Center of Science and Education
87
How to Effectively and Efficiently Communicate Research Results? Experimental Study on the Influence of Interactivity and Presentation
form on Knowledge Transfer and Cognitive Activity
Andreas Krämer1,2, Sandra Böhrs3 & Susanne Ilemann3
1 exeo Strategic Consulting AG, Bonn, Germany 2 Value Research Institute, Iserlohn, Germany 3 Simpleshow S.A., Luxembourg
Correspondence: Prof. Dr. Andreas Krämer, exeo Strategic Consulting AG, Wittelsbacherring 24, 53115 Bonn, Germany. E-mail: [email protected]
Received: May 10, 2021 Accepted: June 17, 2021 Online Published: June 24, 2021
doi:10.5539/jel.v10n4p87 URL: https://doi.org/10.5539/jel.v10n4p87
Abstract
When it comes to presenting research results, the usual approach is to use PowerPoint or similar slide applications, or to opt for alternative presentation tools. A central question is how well the knowledge is transferred and to what extent the target audience is addressed emotionally. Based on a 2*2 factorial design, the effects of presentation form (PowerPoint slide presentation vs. explainer video) and interaction (no interaction vs. interaction by means of additional questions on the topic) were investigated. Overall, the presentation factor is more important for learning success than the interaction factor and explainer videos perform significantly better than the PowerPoint presentation. This applies to the objective and subjective learning success, but also to the emotional appeal and the increase in engagement, interest and other cognitive activities. The effects of the interaction factor are relatively low, achieving minor improvements in combination with the PowerPoint presentation, while no statistically significant and relevant effects were found in combination with the explainer video.
Keywords: slide presentation, interactivity, explainer video, experimental online survey, learning effects
1. Introduction
In a world with an overabundance of information sources, contradictory statements and increasing complexity, the efficiency of knowledge transfer is a key challenge. In order to improve the learning process four main elements are emphasized: learning result (knowledge achievement), content type, learning method and delivery media (Clark, 2008; Rusli et al., 2014). When it comes to delivery media there are considerable controversies regarding advantages and disadvantages of different multimedia. Here, the level of interactivity and the type of visualization are two prominent facettes (Koć-Januchta et al., 2020).
The question of how to communicate research results effectively and efficiently is not only important for the school or university sector, but also for companies. In this context, two developments concerning the factor delivery media should be considered. First, traditional forms of knowledge transfer, such as the use of slide presentations, represent the standard, despite various criticisms, both in the field of education and business. Second, consumer preferences are changing at a rapid pace in favor of videos (Krämer & Böhrs, 2020) while at the same time the trend of MOOCs (Massive Open Online Courses) leads to the usage of videos for teaching (Khalil & Ebner, 2013; Krämer & Böhrs, 2015). Although there are examples of companies abandoning the use of PowerPoint or similar slide programs altogether—the case of Amazon, where Jeff Bezos banned his employees from using PowerPoint presentations, is one of the most prominent (Ciriello et al., 2015)—these are rather isolated cases. For most companies, it is more likely that PowerPoint is judged to be virtually indispensable in everyday work. In this context, Gabrielle (2010) highlights, “PowerPoint is more than a visual aid for presenters, it has become one of the business leaders most important tools for winning in the idea market place (competition for attention, budget and headcount by selling ideas). In this logic, therefore, it is not only a matter of transmitting information, but also the aspect of persuasion and decision support. Here, a core challenge is how well the central messages reach the target persons and remain present in their minds.”
jel.ccsenet.org Journal of Education and Learning Vol. 10, No. 4; 2021
88
In recent years the use of videos as a learning tool has been growing steadily, driven by an increasing relevance of eLearning (Zhang & Nunamaker, 2003) in general and ODL (Open and Distance Learning) in particular (Fozdar, 2015). Videos play a crucial role since video is by far one of the most powerful and expressive non-textual media that captures and conveys information in education (Hampapur & Jain, 1998) and enhances creative problem-solving skills (Mayer, 1997). At the same time, companies use eLearning programs (including videos as a main element) to take advantage of the possibilities of digitization to achieve economies of scale in the transfer of knowledge among employees (Derouin, Fritzsche, & Salas, 2005).
2. Focus on Improvements in the Learning Process
2.1 Explainer Videos as a Learning Tool
Explainer videos effectively convey complex facts to a target group within a very short time (Tu, 2015; Sedej, 2019). Characterizing features are storytelling and multisensory elements (Schmelzle, 2014; Wright, 2004). Explainer videos are usually one to three minutes long. Rather than going into detail, they focus on the most relevant facts. The visualization includes animated illustrations, graphics, or photos. There are different types of explainer videos, such as paper cut-out or so-called papermation videos, live scribble, whiteboard animation, or fully animated explainer videos (Kulgemeyer, 2018). In recent years, a larger number of providers have established themselves that enable the independent online creation of videos, with explainer videos representing only one aspect. One particularly prominent example is the DIY platform Powtoon (Graham, 2015). While there are a range of other DIY animated video creator tools on the market such as Vyond or simpleshow video maker, the corporate market is still largely serviced by full-service providers, a few of the better known being Switch Video, Firestarter, epipheo, You-know, explainity and again simpleshow. The simpleshow video maker tool has a distinct approach: Here, the creation process of a video is text-based, analogous to the first step in a full-service project approach. Thereafter, the visualization is generated in the tool by artificial intelligence (AI). In an automated process (image composition, animation and sound), the customer receives an individual video based on the provided storyline (Krämer & Böhrs, 2015).
Online video has quickly emerged as the preferred content medium for business-to-business (B2B) marketers around the world (Krämer & Böhrs, 2016; Krämer & Böhrs, 2017a). The scope of application (compliance, strategic topics, processes in sales and production, IT, new programs, etc.) is extremely broad (Krämer & Böhrs, 2018; Sedej, 2019). Today, explainer videos are used at all stages of the sales cycle to educate, entertain, inspire, and engage potential customers (Litt, 2014), both in the B2B and B2C market. Another area of application is education (Laaser & Toloza, 2017; Krämer & Böhrs, 2015). There are different assessments regarding the performance of explainer videos as a learning tool. While some authors emphasize the innovative character, other researchers express doubts about the efficient use of such tools. Thus, Laaser and Toloza (2017) point out that “the fun effect of the animation techniques can also provoke the illusion that learning is extremely easy and that the content presented is a fast-track to acquiring knowledge”. Gamble (2016) briefly and succinctly describes: “Animated explainer video shops have been growing like weeds… Here, our concern is quality….” However, there are also studies that empirically examine the learning effect of different types of explainer videos and confirm generally positive effects in knowledge transfer, but also considerable differences in the effect depending on the design (Krämer & Böhrs, 2017b; Kulgemeyer, 2018).
2.2 Slide Presentations as a Learning Tool
PowerPoint, the world-leading presentation software developed by Microsoft, is used for displaying specific digital content to target audiences. The application establishes an organizational structure in slides, in which a bulleted presentation of instructional material summarizes the main ideas of instructors in a well-ordered manner (Susskind, 2008). Slide presentations have become popular because of the option to reduce complex issue to some basic aspects. As Gabriel (2008) describes: “Instead of having to plough through lengthy reports, busy business people could quickly skim through a few transparencies and absorb the essential features of a case or an argument”, indicating that slide presentations are perceived as easier to comprehend compared to information provided in mere text form.
Although the program enjoys a high level of popularity, its use in education, among other areas, has been criticized. Basically, it is doubted that the tool is suitable as a learning tool (Lane, 2008). Yet, research on the effectiveness of PowerPoint as a learning tool is limited (Penciner, 2013). When comparing PowerPoint and Prezi in a classroom Chou et al. (2015) describe PowerPoint to be a cost-effective approach to delivering instructional content. In order to improve PowerPoint’s effectiveness in learning success researchers and academics recommend “employing more relevant images with narration and less text” (Penciner, 2013), embedding video, audio, and hyperlink documents (Clark, 2008) or using the application as an interactive
jel.ccsenet.org Journal of Education and Learning Vol. 10, No. 4; 2021
89
element of presentations (Jordan & Papp, 2014). Despite these possibilities, the practical use is often not very innovative, PowerPoint is used by lecturers more text-based and less interactive (Pamadhi & Zulfiati, 2019). The same applies to the business environment. Hertz, van Woerkum and Kerkhof (2013) confirm that even after more than one decade of discussion about the deficits of PowerPoint presentations, typical criticisms such as an overabundance of text or an overly monotonous presentation of results still are valid. Slide presentations can be used to give a presentation in person, but also to document results or structures. When presenting study results from market research typically a chart presentation is provided for documenting the findings (Sarstedt & Mooi, 2014). Although the results can be communicated much better in this way than in the context of tabular reports, enthusiasm is also limited among market researchers and their clients with regard to the usual presentation of results. For this reason, alternatives have been discussed for quite some time, namely the change from PowerPoint presentation to the integration of dashboards for result summarization (Zhang et al., 2020) and substitution by new media (Brewster, 2011).
2.3 Interaction as a Determinant for Learning Success
Interaction is considered to be an important element to increase learning success (Geri, 2017; Koć-Januchta et al., 2020). Conversely, the absence of interactivity can be a barrier to knowledge transfer. Criticism of the use of slide presentations, for example, mainly concerns the lack of interaction (Penciner, 2013; Brewster, 2011).
There are different aspects to be considered in the interaction, among others the direction of the interaction and the form of the interaction. Garrison and Shale (1990) defined various styles of education covering content, students and teachers. In a digital multimedia environment “student-content interaction” initiated by the computer system has a particularly high relevance (Schär & Krueger, 2000; Nandi et al., 2015).
A target audience’s interaction may include reading informational texts, using study guides, watching videos, interacting with computer-based multimedia, and completing assignments and projects. But there are also risks. For example, animations may disadvantageously increase the cognitive load. The cognitive load theory (van Merriënboer & Sweller, 2005) is linking cognitive effort to the learning process (Paas et al., 2004). In addition to images and animations, researchers have also examined the strategies of embedding questions or providing students with notes/handouts that align with the PowerPoint (Valdez, 2013). One way to reduce mental effort is to provide learners with a possibility to control the pace and sequence of processing the information (Tabbers & de Koeijer, 2010). That way, learners have the opportunity to adjust the presentation speed to their needs i.e., subjects make use of the possibility to select relevant information and to organize and integrate it into a mental model (Mayer & Chandler, 2001).
2.4 Background of Study and Objectives
Simpleshow is a media company (founded in 2008) specializing in the provision of tools and services for the creation of explainer videos, mainly in the business sector. While an accumulated full-service production volume of approximately 25,000 videos has gained simpleshow the leading position in this worldwide market, the online DIY tool simpleshow video maker has outgrown the service offering of the company in the past years. Since its launch in April 2016, a seven-digit number of online videos has been created on the digital platform by its hundreds of thousands of users. The format approach of simpleshow explainer videos is to summarize information and improve the learning outcome using empathetic storytelling and a finely tuned interplay of sound and image. This makes this charming and engaging format a perfect key element for an online course.
The general objective of the study is to explore the future prospects of explainer videos and the learning effects compared with a traditional slide presentation using a quantitative approach and taking into account different user segments and variations in video affinity. The goal is also to analyze the effectiveness (learning effect) and efficiency (ratio learning effect per time of consumed video) of the explainer video as a format to improve the knowledge base of the user in comparison with a PowerPoint presentation and to investigate moderating effects of interactive elements while presenting study results.
The basic population for the study comprises customers who have created explainer videos themselves using the DIY tool on the simpleshow video maker platform or who have commissioned the creation of explainer videos as corporate customers. Therefore, the sample is not aiming to meet population-representative structures, but to represent the customer structure of the company simpleshow well. Since Germany is a major market for simpleshow, the study was conducted in German-speaking countries.
2.5 Research Questions
The study aims to provide answers to the following questions:
• How strong are respondents’ preferences for consuming videos on the one hand and texts on the other?
jel.ccsenet.org Journal of Education and Learning Vol. 10, No. 4; 2021
90
How do the structures of the sample match the results of representative studies? Can clusters with homogeneous media preferences be identified?
• How do respondents use explainer videos and slide presentations in their private and professional lives in general, and specifically what potential exists for either replacing or expanding slide presentations with explainer videos?
• How do different presentation styles such as slide presentations and explainer videos (EV) perform in terms of knowledge effect (case study: results on the relevance of remote work during the COVID-19 crisis)? Is the integration of interactive elements (e.g., additional questions about the content shown) a key to increase knowledge transfer?
• How can the empirical results be classified in the current state of research on the learning effect of explainer videos and what recommendations can be made for the practical use of explainer videos as a substitute or supplement to a slide presentation?
3. Method
3.1 Procedures and Methodology
In order to answer the research questions, an empirical study was carried out. It provided insights into different customer segments of simpleshow. In addition to the economic benefits of an online research study, this survey type also has further substantive advantages for an experimental testing. This is particularly true when different types of information such as videos and graphics will be presented during the interview (Krämer, 2016).
The online survey—representing two different sample groups—was conducted in March 2021 and was focused on B2C (Education) and B2B (Corporate) segments (see Table 1). In total 472 interviews could be used for the analysis. The average time to complete the interview was almost 14 minutes.
Table 1. Sample groups and characteristics
Sample group* Interviews (field, 2021) Respondents Interview time Age (years)
# 1 Education March 15th –24th N=220 (47%) ∅ 12.6 min ∅ 45.5 y. # 2 Corporations March 15th –28th N=252 (53%) ∅ 14.6 min ∅ 44.5 y. Total March 15th –28th N=472 (100%) ∅ 13.7 min ∅ 45.0 y.
Note. * Total contacts: 29,190, net response rate = 1.6%. Respondents with an unrealistic short interview time were eliminated (Note 1).
Segments differ significantly in terms of age groups, creation or commissioning of explainer videos, and simpleshow video maker (SVM) use (see Appendix A).
3.2 Structure of the Study and the Experiment
The survey consists of a general part in which respondents provide information about how often they use explainer videos and what their media preferences are (in particular, affinity for consuming texts vs. videos) in order to be able to cluster interviewees according to their preferences (Riding & Douglas, 1993).
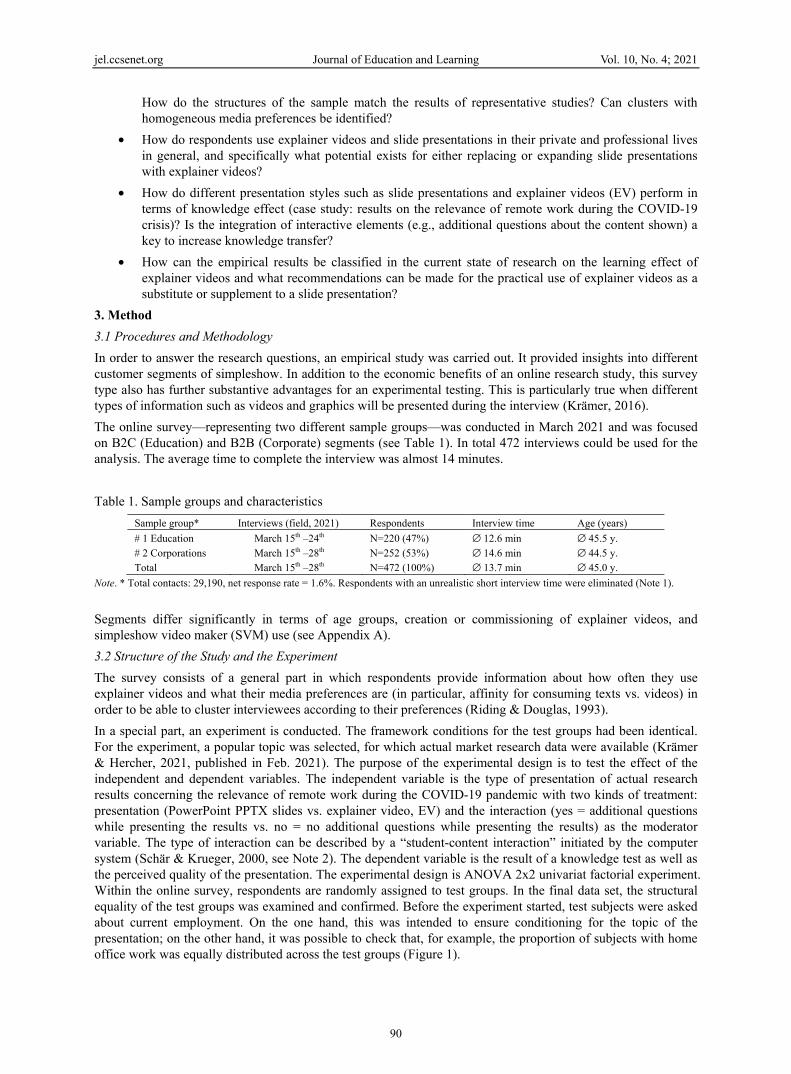
In a special part, an experiment is conducted. The framework conditions for the test groups had been identical. For the experiment, a popular topic was selected, for which actual market research data were available (Krämer & Hercher, 2021, published in Feb. 2021). The purpose of the experimental design is to test the effect of the independent and dependent variables. The independent variable is the type of presentation of actual research results concerning the relevance of remote work during the COVID-19 pandemic with two kinds of treatment: presentation (PowerPoint PPTX slides vs. explainer video, EV) and the interaction (yes = additional questions while presenting the results vs. no = no additional questions while presenting the results) as the moderator variable. The type of interaction can be described by a “student-content interaction” initiated by the computer system (Schär & Krueger, 2000, see Note 2). The dependent variable is the result of a knowledge test as well as the perceived quality of the presentation. The experimental design is ANOVA 2x2 univariat factorial experiment. Within the online survey, respondents are randomly assigned to test groups. In the final data set, the structural equality of the test groups was examined and confirmed. Before the experiment started, test subjects were asked about current employment. On the one hand, this was intended to ensure conditioning for the topic of the presentation; on the other hand, it was possible to check that, for example, the proportion of subjects with home office work was equally distributed across the test groups (Figure 1).
jel.ccsenet.o
In additionend of the
3.3 Measu
Having woperformanparticipant
Questions study Opinquestions,
• InT
• C
• 1(m
3.4 Data A
To examingroup) andto performstatistical knowledgestatistical a
4. Results
4.1 Experi
In the firstcreate themvideos themthemselvescustomer srespondeneffect size)
org
Figur
n to the core arinterview, dem
urement of the L
orked through nce. Questions ts were asked t
to quantify lenionTRAIN 20consisting of o
n total, 5 questThese questions
Correct answers
5 optional ansminimum resu
Analysis
ne the significad to statisticallm overall comsignificance, te or perceptioanalyses of the
iences with the
t part of the sum themselves. mselves, and as. As Table 2 segment. Resp
nts from the ed).
re 1. Different
reas of the studmographic cha
Learning Effec
the computer-were related t
to evaluate sta
earning succes020). At the eobjective ques
tions were asks covered main
s were rated as
swers were offult: -8 points).
ance within thly evaluate bac
mparisons, Chithe effect size ons (Sullivan e data are base
e Creation of E
urvey, study pMore than a q
another quartershows, there apondents fromducation segm
Journal of Ed
steps to condu
dy, there is a saracteristics we
ct (Knowledge
-presented matto the core findatements measu
ss were deriveend of the interstions (with sta
ked after presen topics of the
s plus points, w
fered: 7 correc
he two sample ckground chari-Square testsis controlled i& Feinn, 20
ed on SPSS ver
Explainer Vide
participants repquarter of the rr of the respon
are dependencim the corporatiment (Chi-squa
ducation and Le
91
uct the experim
screening part ere recorded, w
e Test)
terial, participdings presenteuring the indiv
ed from the rerview, participandard answers
enting the resupresentation/e
wrong answers
ct answers (ma
groups (as weracteristics, the and T-test win order to exa012). K-Meansrsion 22.
eos
ported on howrespondents standents stated thies between theon segment in
are test; p < 0
earning
ment and speci
at the beginninwhich later serv
ants were giveed to the audievidual percepti
eference presepants from all s). Key elemen
lts from the mexplainer video
s were rated as
aximum result
ell as other splie repeated meawere used. In amine the relevs-Clustering w
w they use explated that they hhat they had cre number of ex
ndicate a lowe.001, Cramér’
ific challenges
ng of the onlinved as descrip
en a post-test fence. Immediation of the style
entation (PPTXtest groups w
nts of the know
market researcho.
s minus points.
t: 7 points) and
its according tasures ANOVaddition to t
vance of measwas used for
lainer videos ahad not yet crereated 6 or moxplainer video
er number of cs V of 0.32 in
Vol. 10, No. 4;
ne interview. Ative variables.
for overall leartely following
e of presentatio
X, results fromere given the
wledge tests w
h (multiple cho
.
d 8 wrong ans
to age group oVA, given its ab
the parametersured differenc
segmentation
and how ofteneated any expl
ore explainer vios produced ancreated videos ndicates a me
2021
At the
rning this,
on.
m the same ere:
oice).
swers
r test bility s for
ces in . All
they ainer ideos
nd the than
dium
jel.ccsenet.org Journal of Education and Learning Vol. 10, No. 4; 2021
92
Table 2. Experiences with the creation of explainer videos
# Explainer videos created* Segment Education Segment Corporations Total**
None 12% 41% 27% 1-5 60% 39% 49% 6+ 28% 21% 24%
Note. * Question: Have you already created an explainer video yourself? ** Chi-square-test: χ²(2)=49.2, p < 0.001, V = 0.32 (medium effect size).
4.2 Statements Concerning the Consumption of Videos
In order to check the basic affinity of the study participants for videos, an evaluation of different statements on the preference and use of videos was carried out. Partially, these statements were already used in an earlier study from 2016 (population-representative study for Germany, online, n = 1,000). This allows comparisons between the current study (not population-representative, only customers of the company simpleshow) and available secondary data. In addition, two statements on the experience and assessment of slide presentations were evaluated (Table 3). Around 90% of respondents agreed with the statement “For presentations or lectures I mostly use PowerPoint or other slide presentation programs”. This underlines the strong use of slide presentations both, in the education as well as the business segment (Zhang et al., 2020). However, 73% of respondents consider slide presentations to be monotonous. Employees in larger companies (> 2,000 employees) were particularly critical. This reflects a certain dissatisfaction with the tool as a whole or the lack of interaction (Penciner, 2013; Brewster, 2011).
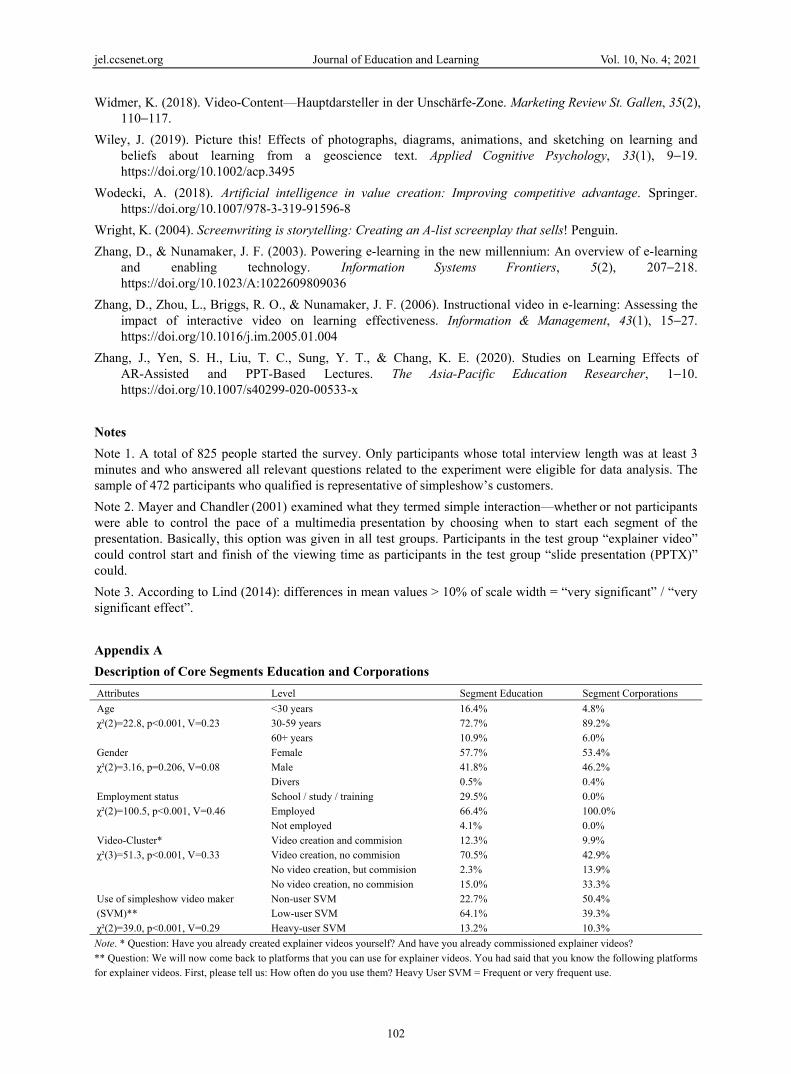
Although there is a period of about 5 years between the studies, similar results emerge regarding the preference for consuming videos or texts. In the current study, the statement “I prefer watching videos to reading texts” receives a mean agreement of 2.6, while this was 2.7 in the reference study (1 = I fully agree to 5 = I fully disagree). A presumed bias in media preference in favor of video (determined by experience with explainer videos) cannot be confirmed. Mean values in both samples are similar (effect size below the threshold of 5% deviation). A strong age dependence in video preference is also present in both studies (see Appendix B).
When comparing the effect sizes (Cohens’ d), in most cases values are below the threshold of 0.2. It can therefore be assumed that there are no relevant differences. Only in the case of the statement “I prefer reading texts to watching a video”, differences between the studies have a low relevance (d = 0.37).
Table 3. Statements concerning the consumption of videos (mean values, % top-2 agreement in brackets)
Evaluation of statements (rating scale)* Current study: German-speaking customers (2021)
Reference study Germany (2016)**
For presentations or lectures I mostly use PowerPoint or other slide presentation programs.
1.67 (90%) Not asked
Videos that explain something must be short. 1.82 (84%) Not asked Many presentations or result reports in slide form are too monotonous for me. 2.08 (73%) Not asked I can remember videos better than text content. 2.290.22 (62%) 2.5 (52%) I prefer watching videos to reading texts. 2.610.07 (49%) 2.74 (43%) I often watch videos on my smartphone, because I can’t read texts as well on it. 2.830.11 (43%) 3.58 (23%) If I’m searching for information, I often watch a video. 2.850.11 (43%) 2.99 (39%) I prefer reading texts to watching a video. 3.440.37(16%) 2.99 (29%)
Note. * Question: To what degree do you agree with the following statements? (Scale from 1 = I fully agree to 5 = I fully disagree). % top-2 agreement (). Superscripts indicate the value for Cohen’s d referring to the differences in mean values: no effect: d < 0.2, small effect d=0.2-0.49. ** Krämer & Böhrs (2016); representative study population for Germany 18+ years, recruitment via online access panel.
4.3 Customer Segments Concerning Text-Video-Orientation
Based on the statements presented on media orientation, a cluster analysis was carried out in which three different groups could be identified. The group of text-oriented people (22%) gives priority to texts over videos when searching for and absorbing information (Table 4). Here, the level of agreement with the statement “If I’m searching for information, I often watch a video” is low (69% disagreement), while agreement with the statement “I prefer to read texts to watching a video” is high (67% agreement). The group of video-oriented subjects (39%) shows a high affinity for using videos at the expense of texts. There is no pronounced affinity for video or text
jel.ccsenet.org Journal of Education and Learning Vol. 10, No. 4; 2021
93
among the third group of individuals (39%, segment “indifferent”).
Table 4. Customer segments according to statement evaluation (media orientation)
Media-orientation* Segment Education Segment Corporations Total sample**
Text-oriented 28% 17% 22% Text-video indifferent 39% 39% 39% Video-oriented 34% 44% 39%
Note. * Question: To what degree do you agree with the following statements? (Scale from 1 = I fully agree to 5 = I fully disagree). Cluster analysis by K-means algorithm. ** Chi-square-test: χ²(2) = 9.8, p = 0.007, V = 0.14 (small effect).
The orientation in favor of video and at the expense of text information is comparatively more pronounced in the corporate segment (statistically significant, small effect size).
Regardless of a stronger affinity to texts or to videos, the statements on the use of slide presentations do not strongly differ. For example, more than 96% of respondents assigned to the text-oriented group stated that they frequently use PowerPoint or other slide presentations for lectures or presentations (86% in the segment of video-oriented customers). However, differences emerge in the evaluation of PowerPoint presentations. In the text-oriented segment, only 49% confirm that they regard PPTX presentations as monotonous, whereas this is the case for more than 80% of the video-oriented users.
4.4 Potential to Substitute or Enhance Slide Presentations by Explainer Videos
In a further step, it was determined how often the respondents create slide presentations and whether they can imagine either replacing them with explainer videos or enriching them with explainer videos, for example, by integrating the core results in the form of a video.
On average, respondents create about two slide presentations per month (M = 24.1 p.a., SD 37.0). The number of slide presentations created varies considerably. On the one hand, 52% of the respondents mention values of up to ten p.a. (i.e., less than one slide presentation per month), while about 18% put the total number at more than 40 slide presentations per year. Overall, there is a significant potential to replace slide presentations with explainer videos (M = 3.9 p.a.) or to integrate explainer videos (M = 9.2 p.a.). With regard to the education and corporate customer segments, there are no significant differences in the average number of slide presentations created per year, but there are differences with regard to the potential for substitution or expansion with explainer videos. The educational segment shows higher values in both aspects (Table 5).
Table 5. Usage of slide presentation and potential for substitution/enhancement by explainer videos
Media-orientation* Segment Education Segment Corporations Total sample
# slide presentations p.a. ∅ 23.6 (100%) ∅ 24.6 (100%) ∅ 24.1 (100%) … # potentially substituted ∅ 4.6 (20%) ∅ 3.3 (13%) ∅ 3.9 (13%) … # potentially enhanced ∅ 11.1 (47%) ∅ 7.5 (31%) ∅ 9.2 (38%)
Note. * Question: If you think about the last 12 months, how often did you create presentations with PowerPoint (or other slide presentation programs)? You had indicated that you have created ___ (show: ….) PowerPoint presentations in the last 12 months? For how many presentations, could you imagine working with or integrating an explainer video instead of slides created with PowerPoint or other slide presentation programs?
4.5 Experimental Design: Relevance of Remote Work During the COVID-19 Crisis
The research results presented in the experiment are results of a representative survey in 4 European countries (Krämer & Hercher, 2021). Specifically analyzed was the extent to which respondents had worked in home office in Nov. 2020, their current experience with working and how relevant home office is seen to be in the near future. The study results thus relate to a highly topical and very strongly discussed issue during the COVID-19 pandemic. In order to examine the extent to which the study participants are affected by a change in the organization of work, several statements were presented to describe the current work status. Since the question design used was identical to the study on the topic of home office, results can be directly compared (Table 6).
When comparing the structure of the responses, it becomes clear that the simpleshow customer sample deviates significantly from the structures of a representative sample of the German population. While more than 80% of respondents in the simpleshow sample stated that they work from home more often or completely, only 22% of
jel.ccsenet.o
responden
Due to theof educatiorientation
Table 6. St
Evalu
I still I go aI workMy wI haveI am oBecauNone
Note. * Queposition) ** Krämer an
4.6 Knowl
The resultsubjects acnegative re
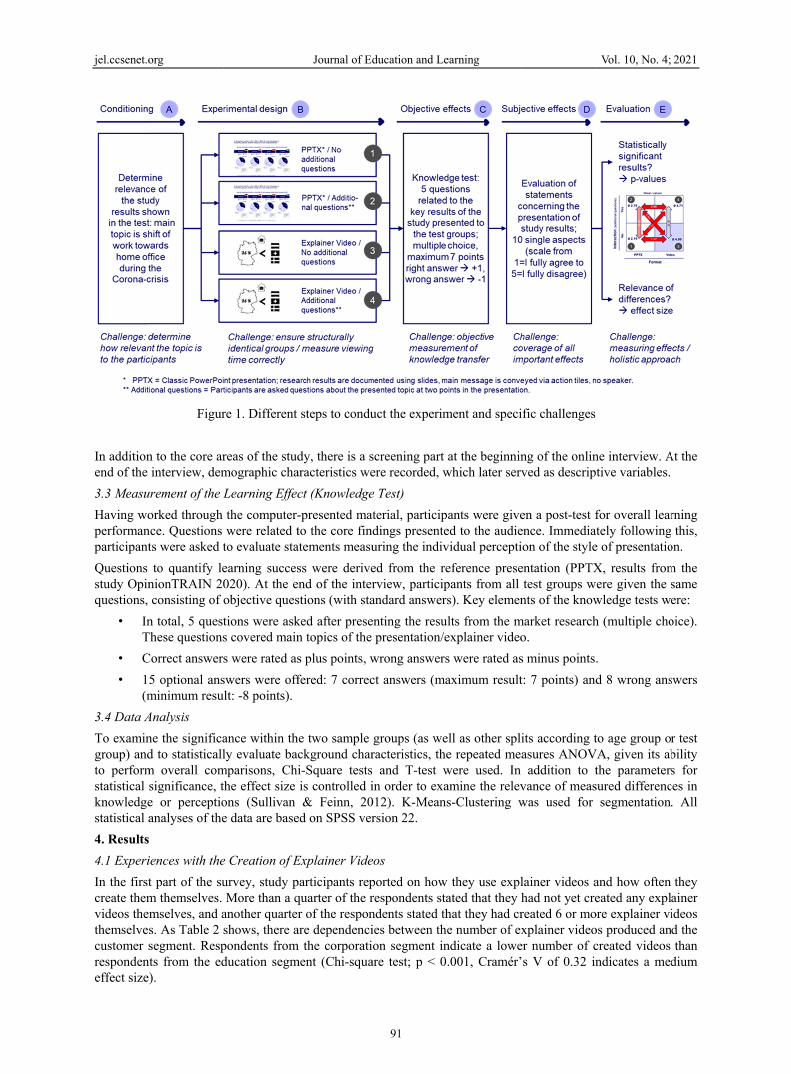
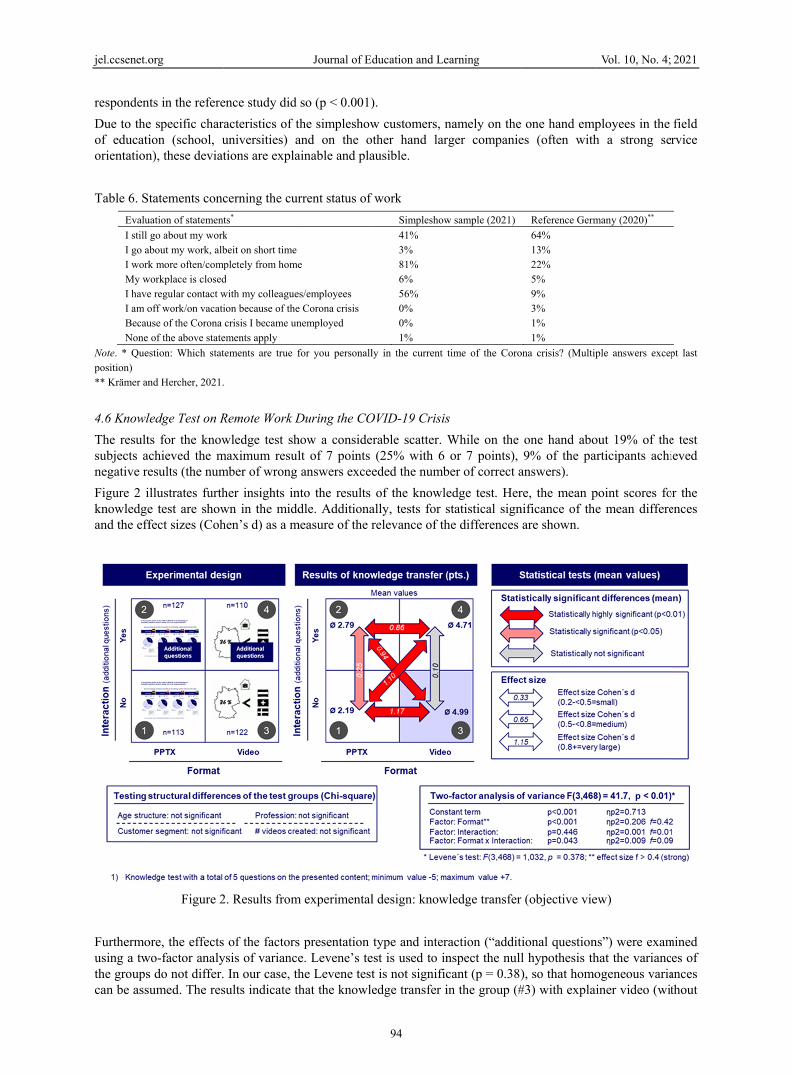
Figure 2 iknowledgeand the eff
Furthermousing a twthe groupscan be ass
org
nts in the refere
e specific charion (school, un), these deviat
tatements conc
uation of statement
go about my workabout my work, albk more often/comp
workplace is closede regular contact woff work/on vacatiuse of the Corona of the above state
stion: Which stat
nd Hercher, 2021.
ledge Test on R
ts for the knowchieved the mesults (the num
llustrates furthe test are showfect sizes (Coh
Figure 2
ore, the effectswo-factor analys do not differ.umed. The res
ence study did
acteristics of tuniversities) ations are expla
cerning the cur
ts*
k beit on short time pletely from homed with my colleagueion because of thecrisis I became un
ements apply
tements are true f
.
Remote Work D
wledge test shmaximum resulmber of wrong
her insights inwn in the middhen’s d) as a m
2. Results from
s of the factorsysis of variance In our case, th
sults indicate t
Journal of Ed
so (p < 0.001)
the simpleshowand on the oainable and pla
rrent status of
e
es/employees e Corona crisis nemployed
for you personall
During the CO
how a considerlt of 7 points answers excee
nto the results dle. Additiona
measure of the r
m experimental
s presentation e. Levene’s tehe Levene testthat the knowle
ducation and Le
94
).
w customers, nther hand lar
ausible.
work
Simpleshow
41% 3% 81% 6% 56% 0% 0% 1%
ly in the current t
OVID-19 Crisis
rable scatter. W(25% with 6
eded the numb
of the knowleally, tests for srelevance of th
l design: know
type and interest is used to int is not significedge transfer i
earning
namely on the rger companie
w sample (2021)
time of the Coro
s
While on the or 7 points),
ber of correct a
edge test. Herstatistical signhe differences
wledge transfer
raction (“additinspect the nullcant (p = 0.38)in the group (#
one hand empes (often with
Reference Germ
64% 13% 22% 5% 9% 3% 1% 1%
ona crisis? (Multip
one hand abo9% of the pa
answers).
re, the mean pnificance of theare shown.
(objective vie
ional questionl hypothesis th), so that homo#3) with explai
Vol. 10, No. 4;
ployees in the h a strong se
many (2020)**
ple answers excep
out 19% of thearticipants achi
point scores foe mean differe
ew)
ns”) were examhat the variancogeneous variainer video (wi
2021
field rvice
pt last
e test ieved
or the ences
mined ces of ances thout
jel.ccsenet.org Journal of Education and Learning Vol. 10, No. 4; 2021
95
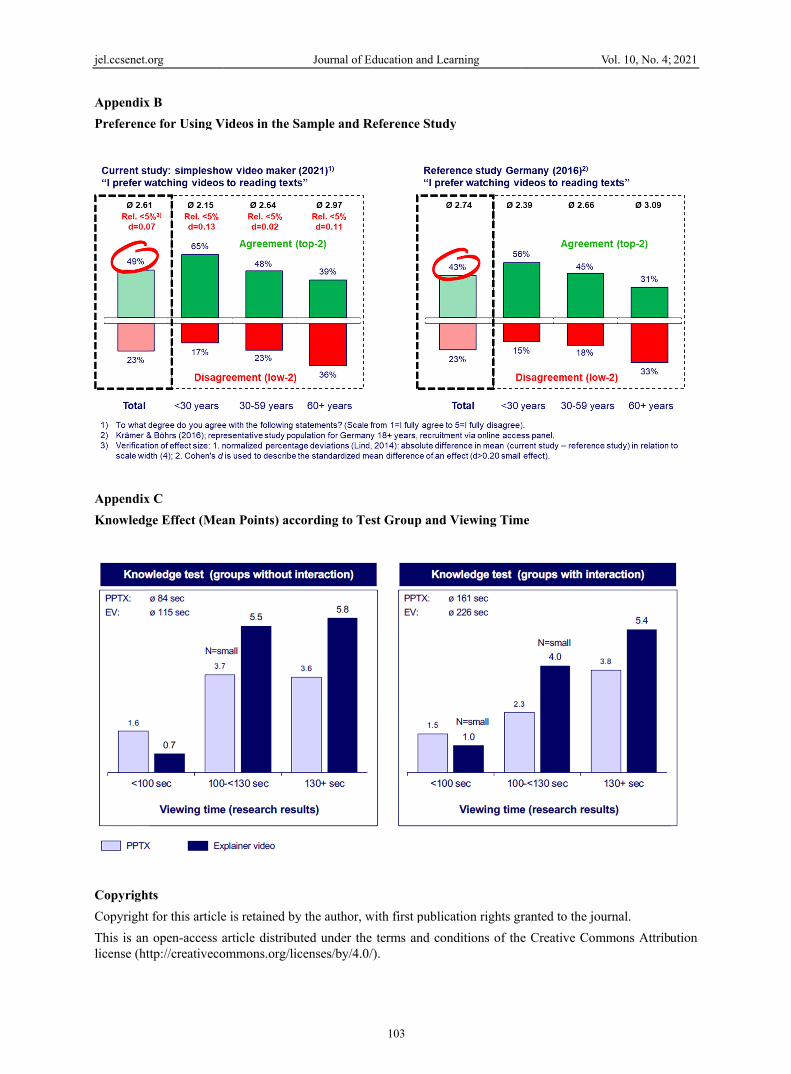
interaction) is best (M = 4.99), the test group (#4) with explainer video and with interaction comes to a slightly lower level (M = 4.71; differences not statistically significant, no relevant effect size). The smallest effect of knowledge transfer occurs in the test group (#1) with the presentation via PPTX (without interaction). Here, only a mean value of 2.19 points is reached. In contrast, the group with presentation via PPTX and additional interaction achieves a better value (M = 2.79). This difference is statistically significant (p < 0.05) and shows a small effect size (d = 0.25). At the same time differences between the test groups with presentation via PPTX or explainer video are statistically highly significant and show larger, partly extremely large, effect sizes (d > 1.0). The analysis of variance confirms that the factor presentation format has a significantly stronger effect on the knowledge transfer than the interaction factor. As can be seen in Figure 2, there is a main effect by the presentation format on the knowledge effect (F(1,470) = 121.19, p < 0.001, ηp2 = 0.21). No main effect is evident for the interaction factor (F(1,470) = 0.581, p = 0.446, ηp2 = 0.001). Thus, the knowledge effect appears to be independent of the interaction. The interaction term is statistically significant, but the effect size is rather low.
4.7 Length of Viewing Time and Resulting Input/Output-Ratios
When interpreting the knowledge transfer, it seems necessary to check whether the different test groups spent the same amount of time to have the study results explained to them. Finally, it is to be expected that a more intensive examination of the topic leads to improved effects in knowledge transfer (Krämer & Böhrs, 2016). Basically, both with the presentation of slides and the video, the participants had the possibility to determine for themselves how long the presentation should take. The explainer video (EV) was played for a fixed time. In addition, there was also the possibility to spool the video and to repeat or shorten the video. During the slide presentation, the test persons had to actively request the insertion of the next page. In the interview, the total time for viewing the entire presentation was measured. With regard to viewing time, the following results can be noted (Table 7):
• The interaction, i.e., the processing of additional questions on the topic leads to a significant extension of the viewing time (including answering additional questions as part of the interaction). For the PPTX presentation the viewing time is increased from 84 seconds (without interaction) to 161 seconds (with interaction) (+92%; for the explainer video the increase is from 115 to 226 seconds=+97%).
• Shortest average viewing time was measured for the PPTX presentation without interaction (“no additional questions”; 84 sec.).
• The total duration of the explainer video without interaction was 110 seconds. The mean effective viewing time was on a similar level, i.e., participants with video generally accepted the pacing of the video and watched the video in its entirety.
• Group #3 does not only achieve the absolute best result in knowledge transfer, but also the relatively best result of the four test groups when the knowledge effect is evaluated in relation to the viewing time.
Table 7. Knowledge improvement related to time spent to watch the video
Mean parameters #1 PPTX format / no interaction
#2 PPTX format / interaction
#3 EV format / no interaction
#4 EV format / interaction
Knowledge post-level (mean points) ∅ 2.19 ∅ 2.79 ∅ 4.99 ∅ 4.72 Viewing time (sec.) ∅ 84 ∅ 161 ∅ 115 ∅ 226 Efficiency index* 100 65 165 78
Note. * Index=100 for PPTX presentation without interaction (improved knowledge level in relation to time spend to watch the video (sec.)). Interaction=additional questions.
4.8 Customer Evaluation: Subjective Perspective of the Participants
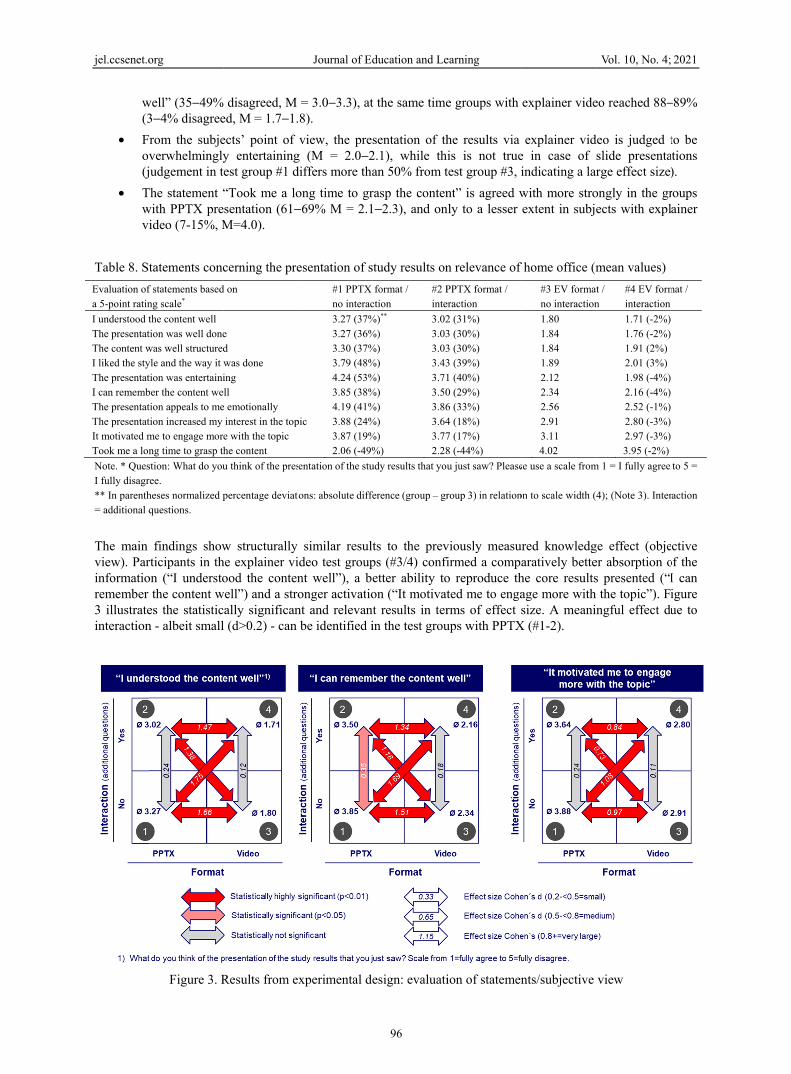
In addition to the objective recording of the effects on knowledge transfer (knowledge test), the respondents were also asked to directly give a subjective assessment on the presentation they regarded. Ten different statements were used for this purpose (rating scale from 1 = I fully agree to 5 = I fully disagree). Also here, considerable differences in level between PPTX and the EV are apparent, with a significantly more positive rating in each case for the EV (Table 8). In the Table, in addition to the mean values of the rating scale scores, the normalized percentage deviations compared to test group 3 are given in parentheses. Main results are:
• 30−35% of test group members with PPTX (#1/2) agreed with the statement “I understood the content
jel.ccsenet.o
w(3
• Fov(j
• Twvi
Table 8. St
Evaluation ofa 5-point ratin
I understood tThe presentatThe content wI liked the styThe presentatI can remembThe presentatThe presentatIt motivated mTook me a lon
Note. * QuesI fully disagr** In parenth= additional q
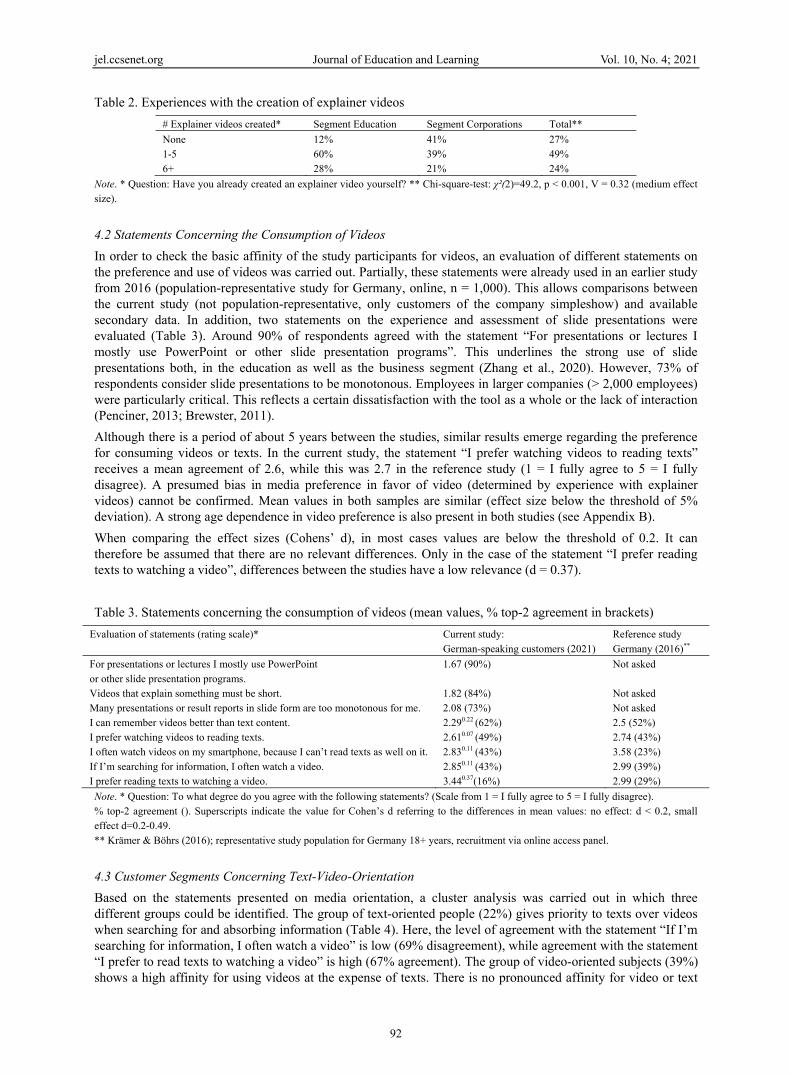
The main view). Parinformatioremember 3 illustrateinteraction
org
well” (35−49%3−4% disagree
rom the subjeverwhelminglyjudgement in t
The statement “with PPTX pre
ideo (7-15%, M
tatements conc
f statements basedng scale*
the content well tion was well donewas well structuredyle and the way it wtion was entertainiber the content wetion appeals to metion increased my me to engage moreng time to grasp th
stion: What do youree. heses normalized pquestions.
findings showrticipants in thon (“I understo
the content wes the statisticn - albeit small
Figure 3. R
disagreed, M ed, M = 1.7−1.
ects’ point of y entertainingest group #1 d
“Took me a losentation (61−M=4.0).
cerning the pre
d on
e d was done ing ll
e emotionally interest in the tope with the topic he content
u think of the pres
percentage deviati
w structurally he explainer viood the conten
well”) and a stroally significan
l (d>0.2) - can
Results from e
Journal of Ed
= 3.0−3.3), at8).
view, the preg (M = 2.0−2differs more tha
ong time to gr−69% M = 2.1
esentation of s
#1 PPTX no interac
3.27 (37%3.27 (36%3.30 (37%3.79 (48%4.24 (53%3.85 (38%4.19 (41%
pic 3.88 (24%3.87 (19%2.06 (-49%
entation of the stu
ions: absolute diffe
similar resultideo test groupnt well”), a beonger activationt and relevanbe identified i
xperimental de
ducation and Le
96
t the same time
sentation of th2.1), while than 50% from t
rasp the conten1−2.3), and on
study results on
format / ction
#2 Pinte
%)** 3.02%) 3.03%) 3.03%) 3.43%) 3.71%) 3.50%) 3.86%) 3.64%) 3.77%) 2.28
udy results that you
ference (group – gr
ts to the prevps (#3/4) confietter ability toon (“It motivatt results in terin the test grou
esign: evaluati
earning
e groups with
he results via is is not truetest group #3, i
nt” is agreed wnly to a lesser
n relevance of
PPTX format / eraction
2 (31%) 3 (30%) 3 (30%) 3 (39%) 1 (40%) 0 (29%) 6 (33%) 4 (18%) 7 (17%) 8 (-44%)
u just saw? Please
roup 3) in relation
viously measurfirmed a compao reproduce thted me to engarms of effect sups with PPTX
ion of statemen
explainer vide
explainer vide in case of indicating a lar
with more stroextent in subje
f home office (m
#3 EV formatno interaction
1.80 1.84 1.84 1.89 2.12 2.34 2.56 2.91 3.11 4.02
se use a scale from
on to scale width (
red knowledgaratively bettehe core resultsage more with size. A meanin
X (#1-2).
nts/subjective
Vol. 10, No. 4;
eo reached 88−
deo is judged tslide presentarge effect size
ongly in the grects with expl
mean values)
t / n
#4 EV forminteraction
1.71 (-2%)1.76 (-2%)1.91 (2%)2.01 (3%)1.98 (-4%)2.16 (-4%)2.52 (-1%)2.80 (-3%)2.97 (-3%)3.95 (-2%)
m 1 = I fully agree
4); (Note 3). Inter
ge effect (objeer absorption os presented (“Ithe topic”). F
ngful effect du
view
2021
−89%
to be ations ).
roups ainer
mat /
to 5 =
raction
ective of the I can igure ue to
jel.ccsenet.org Journal of Education and Learning Vol. 10, No. 4; 2021
97
5. Discussion
In the following, some interrelations will be examined in more detail. This concerns different aspects: (a) the dependencies between presentation form, viewing time (pacing) and learning success, (b) the link between objective learning success and the subjective evaluation and (c) the aspect of the verbalization or the missing speaker in the PowerPoint presentation.
The experimental design leads to relatively clear results with regard to the target variable of knowledge transfer for the test groups with explainer video. To the authors’ knowledge, this is the first study to investigate and quantify the learning effects of slide presentations and explainer videos in a direct comparison (in a non-educational environment). The results remain unambiguous when considering the better results on knowledge transfer in relation to time spent. Krämer and Böhrs (2016) introduced this approach in order to measure efficiency of knowledge transfer. However, the question arises how the comparatively short viewing time in the test group PPTX presentation without interaction can be explained. One explanation is that in the case of the explainer video, the test subjects accept the timing of the video shown (they likely perceive it as a system pacing, although they had the opportunity for an individualized pacing), whereas in the case of the slide presentation, the timing/pacing is perceived flexible (learner pacing). Obviously, during the experiment some subjects cut short the viewing time in this case. The state of academic research to date would lead one to expect that learning speed meant mainly an extension of the viewing time, i.e., subjects make use of the possibility to select relevant information and to organize and integrate it into a mental model (Mayer & Chandler, 2001). In contrast, the viewing time in our study is shortened when results from research are presented via slides. However, similar effects have already been pointed out by Stiller et al. (2009). When defining the experimental design, the project team explicitly excluded the possibility of providing each participant with a fixed time budget, since learning with instructional animations was expected to overstretch limited working memory (see Hatsidimitris & Kalyuga, 2013). Since the time required to process the information shown during the test can vary from person to person, self-determined timing was allowed. Obviously, presentation format and pacing are interlinked (see Koć-Januchta et al., 2020). However, if test persons are classified in groups with comparable viewing time, the superiority of the explainer video over the slide presentation persists (see Appendix C).
The results of the experiment with regard to the effect of presentation format and interaction are similar, regardless of whether the objective results of the knowledge test are considered or the self-assessment of the test subjects. This is remarkable insofar that other studies have come to the conclusion subjects would overestimate the effective learning success, especially in the context of explainer video. Kulgemeyer and Wittwer (2021) investigated this relationship with students majoring in physics and concluded: “While the experimental group watched a video introducing the concept of force relying on misconceptions, the control group watched the scientifically correct video. Both videos were comparable in terms of comprehensibility and duration. In the posttest, the experimental group believed that the video was scientifically correct, well-explained, and that they do not require further instruction to understand the concept.” They refer to other empirical findings suggesting that humans have difficulties distinguishing between their feelings of efficacy and their actual level of understanding, an effect Wiley (2019) called “seduction effect” of pictures.
Behind the factor “presentation form explainer video” there were partial factors, which were different compared to the presentation form slide presentation. In addition to the timing and the animation, the absence of a speaker should also be mentioned (the slide presentation lacks acoustic support). Particularly the interaction of spoken text and moving images is seen as a determinant for an improved learning effect. As Stiller et al. (2009) state: “the modality principle of multimedia design recommends using spoken rather than written texts in conjunction with dynamic or static pictures, because learners learn more effectively in computer based and book-based environments when spoken texts are used.” The cognitive theory of multimedia learning (CTML; Mayer, 2001) helps to explain this mechanism, assuming that pictorial and verbal information is processed in two separate systems. Both are functionally independent of each other, although they can interact. Written words are initially processed in the visual/pictorial channel before they move to the auditory/verbal channel in the working memory. When spoken words are presented simultaneously with text during a presentation, there is a third and detrimental effect at work, called the redundancy principle (Sweller, 2005).
In order to classify the results, it should be noted that the comparatively poor results of the slide presentation with regard to knowledge transfer—as well as the subjective assessment by the recipients—can possibly be improved if a time frame is given for the viewing (e.g., if the slides are presented as a video) or if the results are explained verbally (i.e., by integrating a speaker in an animated slide presentation or by personally presenting results in a live presentation).
jel.ccsenet.org Journal of Education and Learning Vol. 10, No. 4; 2021
98
6. Implications
The most important findings for the future use of explainer videos are: (a) use of explainer videos to convey core messages, (b) use of options to substitute or enhance PowerPoint presentations by explainer videos and (c) examine need for interactive elements.
6.1 Use of Explainer Videos to Convey Core Messages
When Laaser and Toloza (2017) claim “the cartoon type of explainer videos is limited to easily understandable short topics and is more entertainment than a serious academic presentation”, then this does not necessarily apply to all explainer videos. In fact, it should be noted that depending on the supplier of explainer videos, a more or less professional creation of didactically efficient explainer videos is made possible. The range of offerings is very fragmented (Böhrs & Krämer, 2020). The format of the explainer video is less responsible for the learning success, but rather the quality of the explanation. For example, Kulgemeyer (2018) compared high explaining quality (HE) video and one low explaining quality (LE), concluding that “the HE group outperformed the LE group in the achievement of declarative knowledge.”
Therefore, general statements are problematic or inaccurate in specific cases. As was shown, the explainer video in the experiment demonstrates a high level of effectiveness and efficiency in the transfer of knowledge. However, the application spectrum is limited to short presentations, as Sedej (2019) highlights: “With explainer videos companies can explain a business idea, product, or project in a one-to-three-minute-long video with informational, educational, and even entertaining value at the same time.”
Against this background, it is recommended that explainer videos should be used, for example, where study results are summarized in a highly condensed form (Kulgemeyer, 2018). These experimental results correspond with the findings of other investigations, if for example Rusli et al. (2014) conclude that “learning with multimedia using animation visualization presentation is better than the static visualization presentation”.
6.2 Use Options to Substitute or Enhance PowerPoint Presentations by Explainer Videos
Whether PowerPoint can maintain its dominant position as a medium in the classroom and in companies depends on how the presentation format can be adapted to the changing needs of the target audience. The meta-analysis by Baker et al. (2018), which focused on the use of PowerPoint in education, was conducted to summarize the effectiveness of PowerPoint compared to traditional instruction on cognitive skills, concludes “that PowerPoint had no effect on learning.” In Brewster’s (2011) opinion, PowerPoint shows poor performance, especially in summarizing important content, therefore dashboards are recommended instead of slides. Other authors propose using Augmented Reality (AR)-assisted tools instead of PowerPoint presentations (experimental research by Zhang et al. (2020) showed that the AR-assisted lecture was significantly more effective than the PPTX-based lecture). Based on their research results, explainer videos can also replace PowerPoint presentations in this framework. However, it is also conceivable to dovetail explainer videos more closely with slide presentations, for example in the case of longer presentations.
Videos could be used especially in areas where either the knowledge base is at a very low level, or the involvement of consumers is rather low. Based on these results, it is expected that the knowledge improvements in other areas could be even more substantial than in the test (the majority of respondents were very interested in the topic). Furthermore, in case the interest is low potential users of explainer video only have a limited willingness to spend a longer time to watch the video (Krämer & Böhrs, 2016). This emphasizes the crucial role of a short video time.
6.3 Examine Need for Interactive Elements
Integrating interactive elements can not only lead to an improved knowledge transfer, but also to better perception by the target audience, to an increased interest in the presented topic as well as to promote engagement (Evans & Gibbons, 2007; Zhang et al., 2006). However, based on our findings, this is rather the case for the PowerPoint presentation. This corresponds with the results of Jordan ad Papp (2014), pointing out that PowerPoint can easily be used in an interactive manner. They recommend to “pose discussion questions or introduce short quizzes or group application exercises into presentations to allow time for interaction, discussion and reflection.”
In our experimental design, slightly positive effects were obtained by superimposing additional questions on the topic (factor interaction). It is to be expected that the effects are significantly more positive for longer presentations (e.g., 45 min). No positive effects resulted from the interaction in the presentation form explainer video. This can possibly be due to the fact that the presentation of results in the video was already highly compressed and well-structured; the presentation of the study results was very short and the presentation was
jel.ccsenet.org Journal of Education and Learning Vol. 10, No. 4; 2021
99
optimized by storylining. Hence, no incremental positive effects can be achieved by forcing the test subjects to deal more intensively with the topic. In longer presentations, interaction may have a positive effect (Geri, 2017). However, in our analysis we only focused on a very short and very condensed result presentation. Therefore, it is recommended to make the use of interactive elements dependent on the presentation form and especially length, taking into account that the efficiency of knowledge transfer was lowest in the explainer video test group with interaction (#4).
7. Conclusion
Numerous researchers have recently proposed principles for the design of effective presentations for improving the knowledge transfer of slide presentations, both in the education as well as in the business environment. Our study contributes to a better understanding of the effectiveness and efficiency of knowledge transfer depending on the type of presentation. Overall, the study shows that a classic presentation of research results based on PowerPoint slides (without a speaker, the viewing time is determined by the target persons themselves) is inferior to a presentation via explainer video. This correlates not only with a potential for substituting short slide presentations with explainer videos, but also with the integration of explainer videos into slide presentations.
Some special limitations of this experiment must be acknowledged. (1) The content covered is relatively limited, scientific, and factual, (2) time to present results from research was short, and (3) performance measures were not of the problem-solving type and only concerned declarative knowledge. In addition, it should be noted that the study does not claim to be able to provide results representative of the population, but representative results for simpleshow’s customers. However, a comparison of the media preferences of our own sample with representative studies shows structural similarities. Nevertheless, there is a need for research to repeat the study based on a representative sample of the population and to investigate the effects of verbal support in PowerPoint presentations.
Acknowledgments
The authors are grateful to Rogator AG, Nuremberg, for the provision of survey software, the programming of the questionnaire and the entire data management as well as Dr. Gerd Wilger, Dr. Robert Bongaerts (exeo Strategic Consulting) and Lisa Burschik (simpleshow) for substantive comments and input to the study and David Weber from simpleshow for creating the video material.
References
Baker, J. P., Goodboy, A. K., Bowman, N. D., & Wright, A. A. (2018). Does teaching with PowerPoint increase students’ learning? A meta-analysis. Computers & Education, 126, 376−387. https://doi.org/10.1016/j.compedu.2018.08.003
Böhrs, S., & Krämer, A. (2020). Explainer-Videos: Zwischen Agenturleistung und DIY-Tool. Marketing Review St. Gallen, 37(2), 70−78.
Brewster, K. (2011). Dashboards–the new PowerPoint? Shifting the Boundaries of Research, 246−258.
Chou, P. N., Chang, C. C., & Lu, P. F. (2015). Prezi versus PowerPoint: The effects of varied digital presentation tools on students’ learning performance. Computers & Education, 91, 73−82. https://doi.org/10.1016/j.compedu.2015.10.020
Ciriello, R. F., Richter, A., & Schwabe, G. (2015). PowerPoint use and misuse in digital innovation. Twenty-Third European Conference on Information Systems (ECIS), Münster.
Clark, J. (2008). PowerPoint and pedagogy: Maintaining student interest in university lectures. College Teaching, 56(1), 39−44. https://doi.org/10.3200/CTCH.56.1.39-46
Derouin, R. E., Fritzsche, B. A., & Salas, E. (2005). E-learning in organizations. Journal of Management, 31(6), 920−940. https://doi.org/10.1177/0149206305279815
Gabriel, Y. (2008). Against the tyranny of PowerPoint: Technology-in-use and technology abuse. Organization Studies, 29(2), 255−276. https://doi.org/10.1177/0170840607079536
Gabrielle, B. R. (2010). Speaking PowerPoint: The new language of business. Insights Publishing.
Gamble, S. (2016). Visual Content Marketing: Leveraging Infographics, Video, and Interactive Media to Attract and Engage Customers. John Wiley & Sons.
Garrison, D. R., & Shale, D. (1990). A new framework and perspective. In D. R. Garrison & D. Shale (Eds.), Education at a distance: From issues to practice (pp. 123−133). Malabar, Florida: Robert E. Krieger Publishing Company.
jel.ccsenet.org Journal of Education and Learning Vol. 10, No. 4; 2021
100
Geri, N., Winer, A., & Zaks, B. (2017). Challenging the six-minute myth of online video lectures: Can interactivity expand the attention span of learners? Online Journal of Applied Knowledge Management (OJAKM), 5(1), 101−111. https://doi.org/10.36965/OJAKM.2017.5(1)101-111
Graham, B. (2015). Power up your PowToon Studio project. Packt Publishing Ltd.
Khalil, H., & Ebner, M. (2013). Interaction possibilities in MOOCs—how do they actually happen (pp. 1−24)? In 3rd International Conference on Higher Education Development” Future Visions for Higher Education Development”.
Hampapur, A., & Jain, R. (1998). Chapter 9: Video data management systems: Metadata and architecture. In Multimedia Data Management, 1998, McGraw-Hill.
Hatsidimitris, G., & Kalyuga, S. (2013). Guided self-management of transient information in animations through pacing and sequencing strategies. Educational Technology Research and Development, 61(1), 91−105. https://doi.org/10.1007/s11423-012-9276-z
Hertz, B., van Woerkum, C., & Kerkhof, P. (2013). Wetenschappelijke presentaties met PowerPoint. Schadelijke software? (Scientific presentations with PowerPoint. Detrimental software?). In R. Boogaart & H. Janssen (Eds.), Studies in taalbeheersing (pp. 125−134). Assen, Netherlands: Van Gorcum
Jordan, L. A., & Papp, R. (2014). PowerPoint®: It’s not “yes” or “no”: It’s “when” and “how”. Research in Higher Education Journal, 22, 1−11.
Koć-Januchta, M. M., Höffler, T. N., Prechtl, H., & Leutner, D. (2020). Is too much help an obstacle? Effects of interactivity and cognitive style on learning with dynamic versus non-dynamic visualizations with narrative explanations. Educational Technology Research and Development, 68(6), 2971−2990. https://doi.org/10.1007/s11423-020-09822-0
Krämer, A., & Böhrs, S. (2015). Experiences and Future Expectations Towards Online Courses—an Empirical Study of the B2C and B2B Segments. Journal of Education and Training Studies, 1(4), 23−31. https://doi.org/10.11114/jets.v4i1.1104
Krämer, A., & Böhrs, S. (2016). International study on the use and effects of different explainer video formats. Berlin.
Krämer, A., & Böhrs, S. (2017a). Erklärvideos als effektives und effizientes Marketing-Instrument. Marketing Review St. Gallen, 34(2), 54−61.
Krämer, A., & Böhrs, S. (2017b). How Do Consumers Evaluate Explainer Videos: An Empirical Study on the Effectiveness and Efficiency of different Explainer Video Formats. Journal of Education and Learning, 6(1), 254−266. https://doi.org/10.5539/jel.v6n1p254
Krämer, A. (2016). Experimental-Designs als (neue) Basis der Marketingforschung. Präsentation auf dem Rogator-Kundentag, Nürnberg, 23. Juni 2016.
Krämer, A., & Hercher, J. (2021). New Work in Zeiten von Corona: Wenig Änderung im Berufsprestige, viel Änderung bei Homeoffice-Tätigkeiten. Rogator / exeo untersuchen zum zweiten Mal das Berufsprestige und die Homeoffice-Tätigkeit in Deutschland, Österreich, der Schweiz und Schweden, 3. Februar 2021. Retrieved from https://www.rogator.de/new-work-corona-berufsprestige-homeoffice/
Kulgemeyer, C. (2018). A framework of effective science explanation videos informed by criteria for instructional explanations. Research in Science Education, 1−22. https://doi.org/10.1007/s11165-018-9787-7
Kulgemeyer, C., & Wittwer, J. (2021). When Learners Prefer the Wrong Explanation: Misconceptions in Physics Explainer Videos and the Illusion of Understanding. https://doi.org/10.31234/osf.io/q36zf
Laaser, W., & Toloza, E. A. (2017). The changing role of the educational video in higher distance education. The International Review of Research in Open and Distributed Learning, 18(2). https://doi.org/10.19173/irrodl.v18i2.3067
Lane, P. (2019). Spark Video Strikes Back: Reigniting Learning and Practice in Presentations in a PowerPoint Universe. CELE Journal, 27, 76−105.
Lind, G. (2014). Effektstärken: Statistische, praktische und theoretische Bedeutsamkeit empirischer Befunde. Retrieved from https://www. uni-konstanz. de/ag-moral/pdf/Lind-2014_Effektstaerke-Vortrag. pdf
Litt, M. (2014). How online video is changing the way B2B marketers engage and convert prospects. Journal of
jel.ccsenet.org Journal of Education and Learning Vol. 10, No. 4; 2021
101
Brand Strategy, 3(2), 129−134.
Mayer, R. E., & Chandler, P. (2001). When learning is just a click away: Does simple user interaction foster deeper understanding of multimedia messages? Journal of Educational Psychology, 93, 390−397. https://doi.org/10.1037/0022-0663.93.2.390
Mayer, R. E. (2001). Multimedia learning. New York, NY: Cambridge University Press. https://doi.org/10.1017/CBO9781139164603
Nandi, D., Hamilton, M., & Harland, J. (2015). What factors impact student—Content interaction in fully online courses. IJ Modern Education and Computer Science, 7, 28−35. https://doi.org/10.5815/ijmecs.2015.07.04
Paas, F., Renkl, A., & Sweller, J. (2004). Cognitive load theory: Instructional implications of the interaction between information structures and cognitive architecture. Instructional Science, 32(1), 1−8. https://doi.org/10.1023/B:TRUC.0000021806.17516.d0
Pamadhi, H., & Zulfiati, H. M. (2019). Improving The Ability of Writing Art Criticism Through Blended Learning (p. 255). In ICOSS 2018: Proceedings of International Conference of Social Science, ICOSS 2018, Denpasar, Indonesia. European Alliance for Innovation. https://doi.org/10.4108/eai.21-9-2018.2281188
Penciner, R. (2013). Does PowerPoint enhance learning? Canadian Journal of Emergency Medicine, 15(2), 109−112. https://doi.org/10.2310/8000.2013.130756
Riding, R., & Douglas, G. (1993). The effect of cognitive style and mode of presentation on learning performance. British Journal of Educational Psychology, 63(2), 297−307. https://doi.org/10.1111/j.2044-8279.1993.tb01059.x
Rusli, M., Ardhana, I. W., Sudana, I. N. D., & Kamdi, W. (2014). The Effect of Presentation Strategy on Multimedia Learning-Animation vs Static Visualization-and Learning Style to Learning Result. Academic Research International, 5(1), 216−226.
Sarstedt, M., & Mooi, E. (2014). A concise guide to market research. The Process, Data, and MethodsUsing IBM SPSS Statistics, Springer-Verlag Berlin Heidelberg. https://doi.org/10.1007/978-3-642-53965-7
Schär, S., & Krueger, H. (2000). Using new learning technologies with multimedia. IEEE Multimedia, 7(3), 40−51. https://doi.org/10.1109/93.879767
Schmelzle, J. (2014). 5 Rules for explaining things simply. Retrieved from a simpleshow whitepaper.
Sedej, T. (2019). The digital economy: The use of explainer videos in SMEs’ communication. International Journal of Diplomacy and Economy, 5(2), 150−162. https://doi.org/10.1504/IJDIPE.2019.106765
Stiller, K. D., Freitag, A., Zinnbauer, P., & Freitag, C. (2009). How pacing of multimedia instructions can influence modality effects: A case of superiority of visual texts. Australasian Journal of Educational Technology, 25(2), 184−203. https://doi.org/10.14742/ajet.1149
Sullivan, G. M., & Feinn, R. (2012). Using effect size—or why the P value is not enough. Journal of Graduate Medical Education, 4(3), 279−282. https://doi.org/10.4300/JGME-D-12-00156.1
Susskind, J. E. (2008). Limits of PowerPoint’s power: Enhancing students’ self-efficacy and attitudes but not their behavior. Computers & Education, 50(4), 1228−1239. https://doi.org/10.1016/j.compedu.2006.12.001
Sweller, J. (2005). The redundancy principle in multimedia learning. In R. E. Mayer (Ed.), The Cambridge handbook of multimedia learning (pp. 159−167). New York, NY: Cambridge University Press. https://doi.org/10.1017/CBO9780511816819.011
Tabbers, H. K., & de Koeijer, B. (2010). Learner control in animated multimedia instructions. Instructional Science, 38, 441−453. https://doi.org/10.1007/s11251-009-9119-4
Tu, D. L. (2015). Feature and Narrative Storytelling for Multimedia Journalists. CRC Press. https://doi.org/10.4324/9781315851297
Tufte, E. R. (2003). The cognitive style of PowerPoint.
van Merriënboer, J. G., & Sweller, J. (2005). Cognitive load theory and complex learning: Recent developments and future directions. Educational Psychology Review, 17, 147−177. https://doi.org/10.1007/s10648-005-3951-0
Valdez, A. (2013). Multimedia learning from PowerPoint: Use of adjunct questions. Psychology Journal, 10(1), 35−44.
jel.ccsenet.org Journal of Education and Learning Vol. 10, No. 4; 2021
102
Widmer, K. (2018). Video-Content—Hauptdarsteller in der Unschärfe-Zone. Marketing Review St. Gallen, 35(2), 110−117.
Wiley, J. (2019). Picture this! Effects of photographs, diagrams, animations, and sketching on learning and beliefs about learning from a geoscience text. Applied Cognitive Psychology, 33(1), 9−19. https://doi.org/10.1002/acp.3495
Wodecki, A. (2018). Artificial intelligence in value creation: Improving competitive advantage. Springer. https://doi.org/10.1007/978-3-319-91596-8
Wright, K. (2004). Screenwriting is storytelling: Creating an A-list screenplay that sells! Penguin.
Zhang, D., & Nunamaker, J. F. (2003). Powering e-learning in the new millennium: An overview of e-learning and enabling technology. Information Systems Frontiers, 5(2), 207−218. https://doi.org/10.1023/A:1022609809036
Zhang, D., Zhou, L., Briggs, R. O., & Nunamaker, J. F. (2006). Instructional video in e-learning: Assessing the impact of interactive video on learning effectiveness. Information & Management, 43(1), 15−27. https://doi.org/10.1016/j.im.2005.01.004
Zhang, J., Yen, S. H., Liu, T. C., Sung, Y. T., & Chang, K. E. (2020). Studies on Learning Effects of AR-Assisted and PPT-Based Lectures. The Asia-Pacific Education Researcher, 1−10. https://doi.org/10.1007/s40299-020-00533-x
Notes
Note 1. A total of 825 people started the survey. Only participants whose total interview length was at least 3 minutes and who answered all relevant questions related to the experiment were eligible for data analysis. The sample of 472 participants who qualified is representative of simpleshow’s customers.
Note 2. Mayer and Chandler (2001) examined what they termed simple interaction—whether or not participants were able to control the pace of a multimedia presentation by choosing when to start each segment of the presentation. Basically, this option was given in all test groups. Participants in the test group “explainer video” could control start and finish of the viewing time as participants in the test group “slide presentation (PPTX)” could.
Note 3. According to Lind (2014): differences in mean values > 10% of scale width = “very significant” / “very significant effect”.
Appendix A
Description of Core Segments Education and Corporations
Attributes Level Segment Education Segment Corporations
Age χ²(2)=22.8, p<0.001, V=0.23
<30 years 16.4% 4.8% 30-59 years 72.7% 89.2% 60+ years 10.9% 6.0%
Gender χ²(2)=3.16, p=0.206, V=0.08
Female 57.7% 53.4% Male 41.8% 46.2% Divers 0.5% 0.4%
Employment status χ²(2)=100.5, p<0.001, V=0.46
School / study / training 29.5% 0.0% Employed 66.4% 100.0% Not employed 4.1% 0.0%
Video-Cluster* χ²(3)=51.3, p<0.001, V=0.33
Video creation and commision 12.3% 9.9% Video creation, no commision 70.5% 42.9% No video creation, but commision 2.3% 13.9% No video creation, no commision 15.0% 33.3%
Use of simpleshow video maker (SVM)** χ²(2)=39.0, p<0.001, V=0.29
Non-user SVM 22.7% 50.4% Low-user SVM 64.1% 39.3% Heavy-user SVM 13.2% 10.3%
Note. * Question: Have you already created explainer videos yourself? And have you already commissioned explainer videos? ** Question: We will now come back to platforms that you can use for explainer videos. You had said that you know the following platforms for explainer videos. First, please tell us: How often do you use them? Heavy User SVM = Frequent or very frequent use.
jel.ccsenet.o
Appendix
Preferenc
Appendix
Knowledg
Copyright
Copyright
This is an license (ht
org
x B
ce for Using V
x C
ge Effect (Mea
ts
for this article
open-access attp://creativeco
Videos in the S
an Points) acc
e is retained by
article distribuommons.org/lic
Journal of Ed
Sample and R
cording to Tes
y the author, w
uted under thecenses/by/4.0/
ducation and Le
103
Reference Stud
st Group and
with first public
terms and con/).
earning
dy
Viewing Tim
cation rights gr
nditions of the
me
ranted to the jo
e Creative Com
Vol. 10, No. 4;
ournal.
mmons Attrib
2021
ution


![[Book];[Communicate effectively]](https://img.pdfslide.us/doc/110x75/5549c292b4c90564768b55e3/bookcommunicate-effectively.jpg)