Embed Size (px)
Citation preview
How to Earn Money with an EMI Problem:Static Energy Meters Running Backwards
Tom Hartman1, Bas ten Have1, Niek Moonen1, Frank Leferink1,2
1University of Twente, Enschede, the Netherlands2THALES Nederland B.V., Hengelo, the Netherlands
Abstract—The increased use of non-linear appliances in house-holds has resulted in several conducted electromagnetic interfer-ence issues, such as misreadings of static energy meters used forbilling purposes of the households’ energy consumption. In thispaper a case is presented where a static energy meter indicatesa power generation, while power is actually being consumed. Aperceived power generation of more than 430 W is measured by astatic energy meter installed in a household when a television witha commercial off the shelf remote controlled switch with dimmingfunctionalities consumed 21 W. The same situation is reproducedin a controlled lab environment, to eliminate possible influencesof other appliances in the grid, which confirmed the on-siteresults. The current waveforms causing this supposed generationof power are investigated and it is observed that the phase firingangle of the current pulse drawn by the load in combinationwith the commercial off the shelf remote controlled switch affectsthe metering errors and determines whether the errors indicatea false generation, a too high consumption of power, or noerror at all. A combination of the household equipment and abasic unloaded switched mode power supply in conjunction withtwo remote controlled switches resulted in a perceived powergeneration of more than 600 W. Having these loads connectedfor the entire day would counteract the total consumption of anaverage household and could even ”generate” energy, and thusgenerate money for the consumer.
Index Terms—Static energy meter, conducted electromagneticinterference, non-linear, dimming, phase firing angle.
I. INTRODUCTION
Nowadays a lot of conducted electromagnetic interfer-ence (EMI) is created by the cyclic switching of non-linearelectronic devices [1]. The increased use of this non-linearequipment in households in comparison to traditional resistiveequipment has resulted in several EMI cases [2], [3]. One im-portant issue is the immunity of static energy meters resultingin misreadings, which has a large impact as consumers mightbe over or under billed. Examples of non-linear equipmentresulting in misreadings are dimmed lighting equipment ofcompact fluorescent lamp (CFL) and light-emmiting diode(LED) technology [4], [5], and a speed controlled water pump[6], [7]. These experimental studies show maximum errors thatexceeded 2000% due to the fast rising of pulsed currents beingdrawn [8]. The existence of similar equipment resulting instatic energy meter errors is shown in [9].
This project 17NRM02 MeterEMI has received funding from the EMPIRprogramme co-financed by the Participating States and from the EuropeanUnion’s Horizon 2020 research and innovation programme.
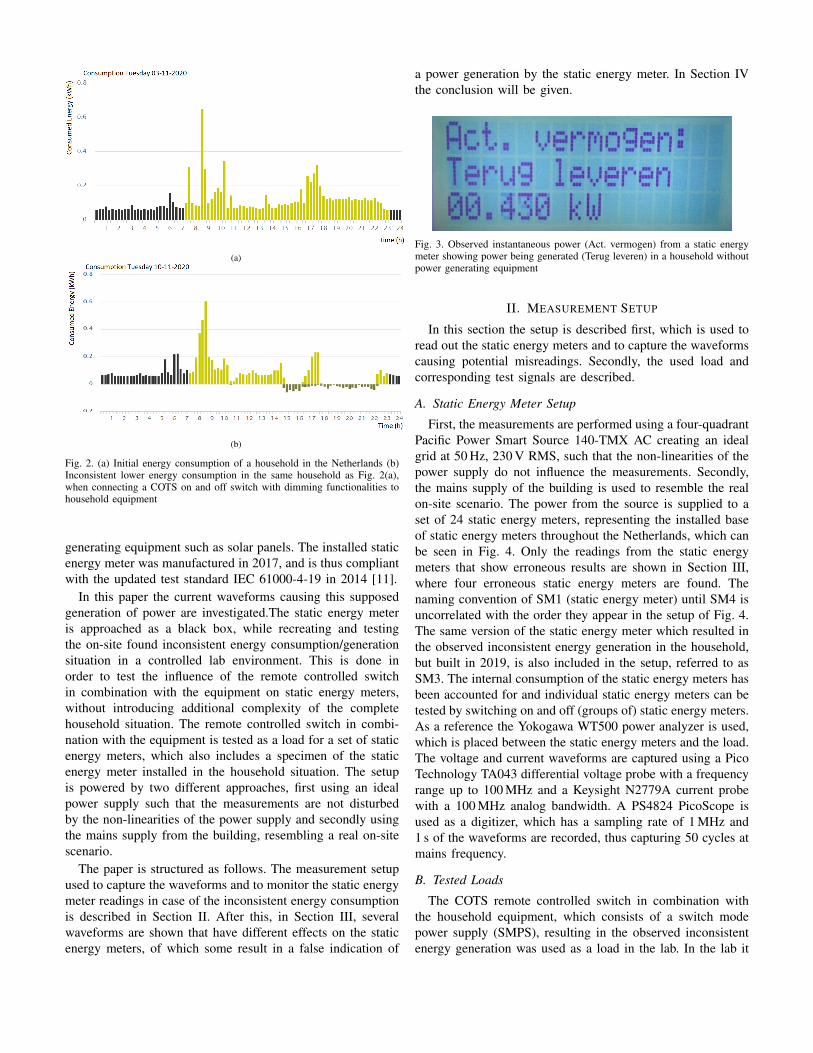
Hereafter, several possible interference cases have beenreported by consumers. Some show an unexpected energyconsumption, but not explicitly due to misreadings of staticenergy meters. With the introduction of applications, such asthe Dutch Slimmemeterportal [10], consumers can monitortheir energy consumption and get a much better insight. Thishelps with explaining the unexpected energy consumption. Aconsumer in the Netherlands observed an inconsistent energyconsumption which appeared after installing a commercialoff the shelf (COTS) remote control for switching householdequipment on and off, see Fig. 1. The remote control switchalso included a dimming functionality, but the salespersontold the consumer it could also be used solely for turningequipment on and off.
Fig. 1. COTS switch with dimming functionalities initially bought with theidea of using it as an on and off switch
The initial energy consumption is visible in Fig. 2(a), wherethe black data corresponds to off peak hours and the yellowdata to peak hours. It shows a constant consumption of around250 W which is present 24/7 due to water pumps in a pond,but no other out of the ordinary energy consumption is visible.After connecting the COTS switch however, something pecu-liar happened. The energy consumption dropped significantlywhen the equipment was turned on and even reached negativevalues, as can be seen clearly in Fig. 2(b). Clear gaps canbe seen here around 15:00 and between 18:00 and 22:00. Atthese moments the installed static energy meter’s instantaneouspower reported a power generation, which has been seen togo up to 430 W, see Fig. 3. The household has no power
(a)
(b)
Fig. 2. (a) Initial energy consumption of a household in the Netherlands (b)Inconsistent lower energy consumption in the same household as Fig. 2(a),when connecting a COTS on and off switch with dimming functionalities tohousehold equipment
generating equipment such as solar panels. The installed staticenergy meter was manufactured in 2017, and is thus compliantwith the updated test standard IEC 61000-4-19 in 2014 [11].
In this paper the current waveforms causing this supposedgeneration of power are investigated.The static energy meteris approached as a black box, while recreating and testingthe on-site found inconsistent energy consumption/generationsituation in a controlled lab environment. This is done inorder to test the influence of the remote controlled switchin combination with the equipment on static energy meters,without introducing additional complexity of the completehousehold situation. The remote controlled switch in combi-nation with the equipment is tested as a load for a set of staticenergy meters, which also includes a specimen of the staticenergy meter installed in the household situation. The setupis powered by two different approaches, first using an idealpower supply such that the measurements are not disturbedby the non-linearities of the power supply and secondly usingthe mains supply from the building, resembling a real on-sitescenario.
The paper is structured as follows. The measurement setupused to capture the waveforms and to monitor the static energymeter readings in case of the inconsistent energy consumptionis described in Section II. After this, in Section III, severalwaveforms are shown that have different effects on the staticenergy meters, of which some result in a false indication of
a power generation by the static energy meter. In Section IVthe conclusion will be given.
Fig. 3. Observed instantaneous power (Act. vermogen) from a static energymeter showing power being generated (Terug leveren) in a household withoutpower generating equipment
II. MEASUREMENT SETUP
In this section the setup is described first, which is used toread out the static energy meters and to capture the waveformscausing potential misreadings. Secondly, the used load andcorresponding test signals are described.
A. Static Energy Meter Setup
First, the measurements are performed using a four-quadrantPacific Power Smart Source 140-TMX AC creating an idealgrid at 50 Hz, 230 V RMS, such that the non-linearities of thepower supply do not influence the measurements. Secondly,the mains supply of the building is used to resemble the realon-site scenario. The power from the source is supplied to aset of 24 static energy meters, representing the installed baseof static energy meters throughout the Netherlands, which canbe seen in Fig. 4. Only the readings from the static energymeters that show erroneous results are shown in Section III,where four erroneous static energy meters are found. Thenaming convention of SM1 (static energy meter) until SM4 isuncorrelated with the order they appear in the setup of Fig. 4.The same version of the static energy meter which resulted inthe observed inconsistent energy generation in the household,but built in 2019, is also included in the setup, referred to asSM3. The internal consumption of the static energy meters hasbeen accounted for and individual static energy meters can betested by switching on and off (groups of) static energy meters.As a reference the Yokogawa WT500 power analyzer is used,which is placed between the static energy meters and the load.The voltage and current waveforms are captured using a PicoTechnology TA043 differential voltage probe with a frequencyrange up to 100 MHz and a Keysight N2779A current probewith a 100 MHz analog bandwidth. A PS4824 PicoScope isused as a digitizer, which has a sampling rate of 1 MHz and1 s of the waveforms are recorded, thus capturing 50 cycles atmains frequency.
B. Tested Loads
The COTS remote controlled switch in combination withthe household equipment, which consists of a switch modepower supply (SMPS), resulting in the observed inconsistentenergy generation was used as a load in the lab. In the lab it
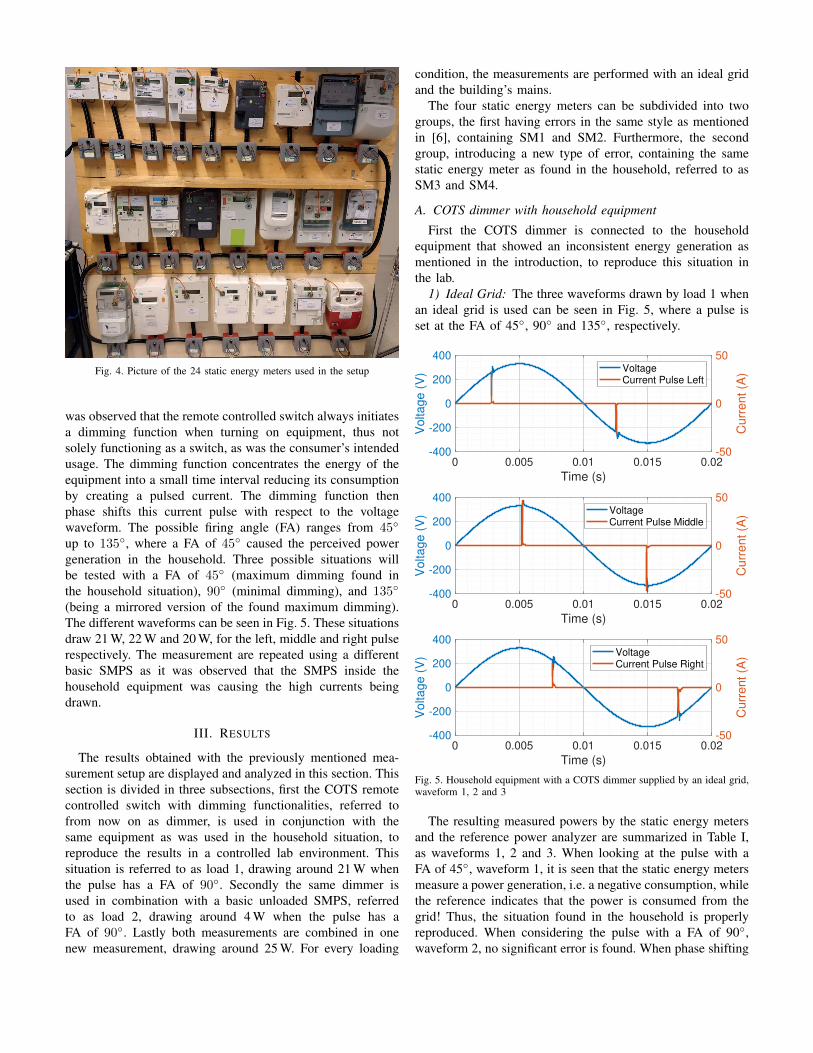
Fig. 4. Picture of the 24 static energy meters used in the setup
was observed that the remote controlled switch always initiatesa dimming function when turning on equipment, thus notsolely functioning as a switch, as was the consumer’s intendedusage. The dimming function concentrates the energy of theequipment into a small time interval reducing its consumptionby creating a pulsed current. The dimming function thenphase shifts this current pulse with respect to the voltagewaveform. The possible firing angle (FA) ranges from 45◦
up to 135◦, where a FA of 45◦ caused the perceived powergeneration in the household. Three possible situations willbe tested with a FA of 45◦ (maximum dimming found inthe household situation), 90◦ (minimal dimming), and 135◦
(being a mirrored version of the found maximum dimming).The different waveforms can be seen in Fig. 5. These situationsdraw 21 W, 22 W and 20 W, for the left, middle and right pulserespectively. The measurement are repeated using a differentbasic SMPS as it was observed that the SMPS inside thehousehold equipment was causing the high currents beingdrawn.
III. RESULTS
The results obtained with the previously mentioned mea-surement setup are displayed and analyzed in this section. Thissection is divided in three subsections, first the COTS remotecontrolled switch with dimming functionalities, referred tofrom now on as dimmer, is used in conjunction with thesame equipment as was used in the household situation, toreproduce the results in a controlled lab environment. Thissituation is referred to as load 1, drawing around 21 W whenthe pulse has a FA of 90◦. Secondly the same dimmer isused in combination with a basic unloaded SMPS, referredto as load 2, drawing around 4 W when the pulse has aFA of 90◦. Lastly both measurements are combined in onenew measurement, drawing around 25 W. For every loading
condition, the measurements are performed with an ideal gridand the building’s mains.
The four static energy meters can be subdivided into twogroups, the first having errors in the same style as mentionedin [6], containing SM1 and SM2. Furthermore, the secondgroup, introducing a new type of error, containing the samestatic energy meter as found in the household, referred to asSM3 and SM4.
A. COTS dimmer with household equipment
First the COTS dimmer is connected to the householdequipment that showed an inconsistent energy generation asmentioned in the introduction, to reproduce this situation inthe lab.
1) Ideal Grid: The three waveforms drawn by load 1 whenan ideal grid is used can be seen in Fig. 5, where a pulse isset at the FA of 45◦, 90◦ and 135◦, respectively.
0 0.005 0.01 0.015 0.02
Time (s)
-400
-200
0
200
400
Vo
lta
ge
(V
)
-50
0
50
Cu
rre
nt
(A)Voltage
Current Pulse Left
0 0.005 0.01 0.015 0.02
Time (s)
-400
-200
0
200
400
Vo
lta
ge
(V
)
-50
0
50
Cu
rre
nt
(A)Voltage
Current Pulse Middle
0 0.005 0.01 0.015 0.02
Time (s)
-400
-200
0
200
400
Vo
lta
ge
(V
)
-50
0
50
Cu
rre
nt
(A)Voltage
Current Pulse Right
Fig. 5. Household equipment with a COTS dimmer supplied by an ideal grid,waveform 1, 2 and 3
The resulting measured powers by the static energy metersand the reference power analyzer are summarized in Table I,as waveforms 1, 2 and 3. When looking at the pulse with aFA of 45◦, waveform 1, it is seen that the static energy metersmeasure a power generation, i.e. a negative consumption, whilethe reference indicates that the power is consumed from thegrid! Thus, the situation found in the household is properlyreproduced. When considering the pulse with a FA of 90◦,waveform 2, no significant error is found. When phase shifting
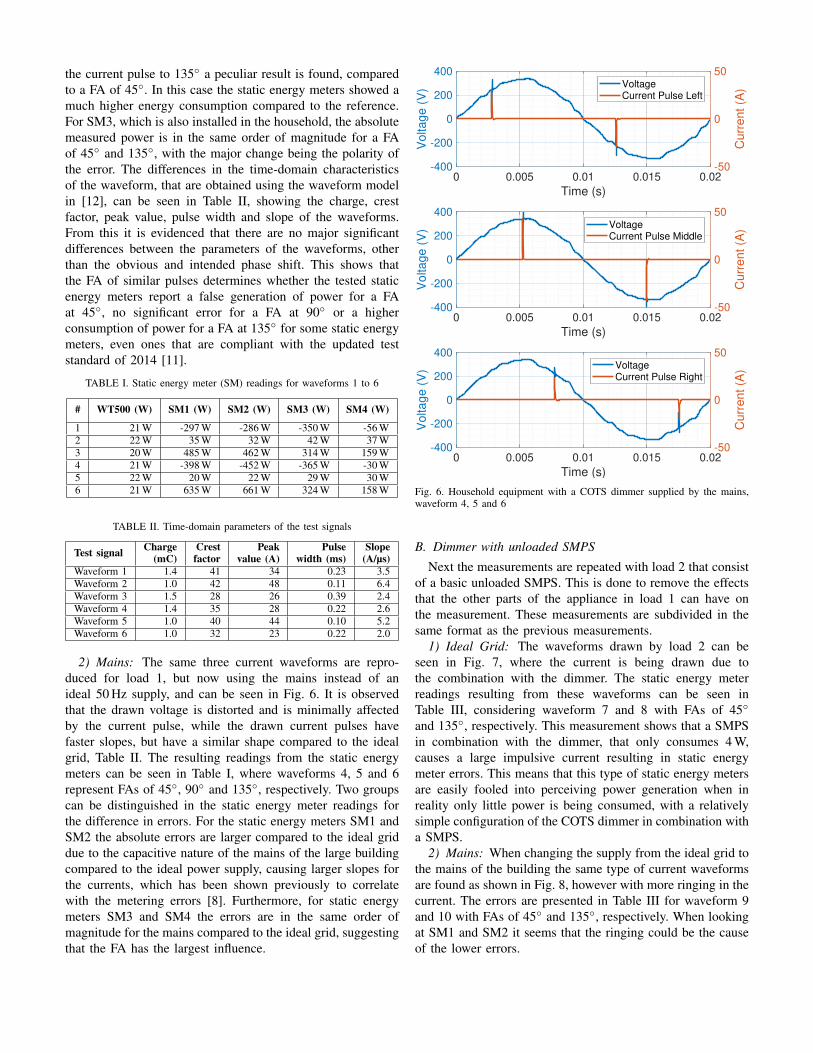
the current pulse to 135◦ a peculiar result is found, comparedto a FA of 45◦. In this case the static energy meters showed amuch higher energy consumption compared to the reference.For SM3, which is also installed in the household, the absolutemeasured power is in the same order of magnitude for a FAof 45◦ and 135◦, with the major change being the polarity ofthe error. The differences in the time-domain characteristicsof the waveform, that are obtained using the waveform modelin [12], can be seen in Table II, showing the charge, crestfactor, peak value, pulse width and slope of the waveforms.From this it is evidenced that there are no major significantdifferences between the parameters of the waveforms, otherthan the obvious and intended phase shift. This shows thatthe FA of similar pulses determines whether the tested staticenergy meters report a false generation of power for a FAat 45◦, no significant error for a FA at 90◦ or a higherconsumption of power for a FA at 135◦ for some static energymeters, even ones that are compliant with the updated teststandard of 2014 [11].
TABLE I. Static energy meter (SM) readings for waveforms 1 to 6
# WT500 (W) SM1 (W) SM2 (W) SM3 (W) SM4 (W)
1 21 W -297 W -286 W -350 W -56 W2 22 W 35 W 32 W 42 W 37 W3 20 W 485 W 462 W 314 W 159 W4 21 W -398 W -452 W -365 W -30 W5 22 W 20 W 22 W 29 W 30 W6 21 W 635 W 661 W 324 W 158 W
TABLE II. Time-domain parameters of the test signals
Test signal Charge Crest Peak Pulse Slope(mC) factor value (A) width (ms) (A/µs)
Waveform 1 1.4 41 34 0.23 3.5Waveform 2 1.0 42 48 0.11 6.4Waveform 3 1.5 28 26 0.39 2.4Waveform 4 1.4 35 28 0.22 2.6Waveform 5 1.0 40 44 0.10 5.2Waveform 6 1.0 32 23 0.22 2.0
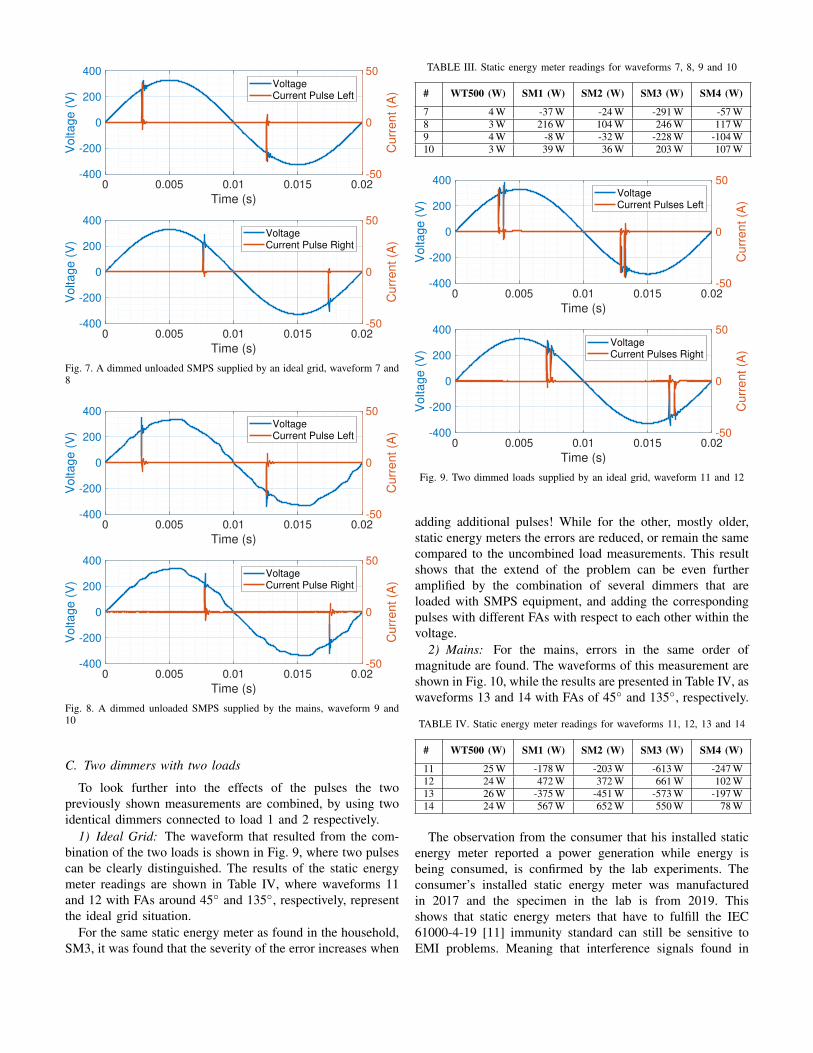
2) Mains: The same three current waveforms are repro-duced for load 1, but now using the mains instead of anideal 50 Hz supply, and can be seen in Fig. 6. It is observedthat the drawn voltage is distorted and is minimally affectedby the current pulse, while the drawn current pulses havefaster slopes, but have a similar shape compared to the idealgrid, Table II. The resulting readings from the static energymeters can be seen in Table I, where waveforms 4, 5 and 6represent FAs of 45◦, 90◦ and 135◦, respectively. Two groupscan be distinguished in the static energy meter readings forthe difference in errors. For the static energy meters SM1 andSM2 the absolute errors are larger compared to the ideal griddue to the capacitive nature of the mains of the large buildingcompared to the ideal power supply, causing larger slopes forthe currents, which has been shown previously to correlatewith the metering errors [8]. Furthermore, for static energymeters SM3 and SM4 the errors are in the same order ofmagnitude for the mains compared to the ideal grid, suggestingthat the FA has the largest influence.
0 0.005 0.01 0.015 0.02
Time (s)
-400
-200
0
200
400
Voltage (
V)
-50
0
50
Curr
ent (A
)VoltageCurrent Pulse Left
0 0.005 0.01 0.015 0.02
Time (s)
-400
-200
0
200
400
Voltage (
V)
-50
0
50
Curr
ent (A
)VoltageCurrent Pulse Middle
0 0.005 0.01 0.015 0.02
Time (s)
-400
-200
0
200
400
Voltage (
V)
-50
0
50
Curr
ent (A
)VoltageCurrent Pulse Right
Fig. 6. Household equipment with a COTS dimmer supplied by the mains,waveform 4, 5 and 6
B. Dimmer with unloaded SMPS
Next the measurements are repeated with load 2 that consistof a basic unloaded SMPS. This is done to remove the effectsthat the other parts of the appliance in load 1 can have onthe measurement. These measurements are subdivided in thesame format as the previous measurements.
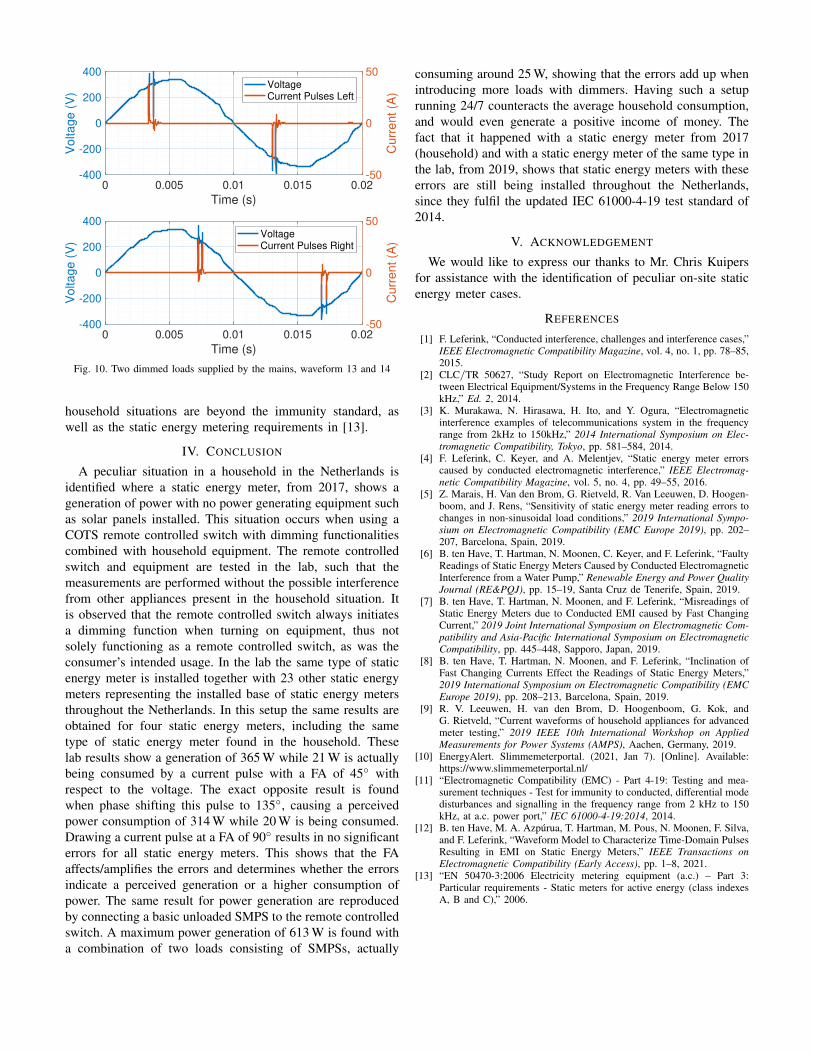
1) Ideal Grid: The waveforms drawn by load 2 can beseen in Fig. 7, where the current is being drawn due tothe combination with the dimmer. The static energy meterreadings resulting from these waveforms can be seen inTable III, considering waveform 7 and 8 with FAs of 45◦
and 135◦, respectively. This measurement shows that a SMPSin combination with the dimmer, that only consumes 4 W,causes a large impulsive current resulting in static energymeter errors. This means that this type of static energy metersare easily fooled into perceiving power generation when inreality only little power is being consumed, with a relativelysimple configuration of the COTS dimmer in combination witha SMPS.
2) Mains: When changing the supply from the ideal grid tothe mains of the building the same type of current waveformsare found as shown in Fig. 8, however with more ringing in thecurrent. The errors are presented in Table III for waveform 9and 10 with FAs of 45◦ and 135◦, respectively. When lookingat SM1 and SM2 it seems that the ringing could be the causeof the lower errors.
0 0.005 0.01 0.015 0.02
Time (s)
-400
-200
0
200
400V
olta
ge
(V
)
-50
0
50
Cu
rre
nt
(A)
VoltageCurrent Pulse Left
0 0.005 0.01 0.015 0.02
Time (s)
-400
-200
0
200
400
Vo
lta
ge
(V
)
-50
0
50
Cu
rre
nt
(A)
VoltageCurrent Pulse Right
Fig. 7. A dimmed unloaded SMPS supplied by an ideal grid, waveform 7 and8
0 0.005 0.01 0.015 0.02
Time (s)
-400
-200
0
200
400
Vo
lta
ge
(V
)
-50
0
50
Cu
rre
nt
(A)
VoltageCurrent Pulse Left
0 0.005 0.01 0.015 0.02
Time (s)
-400
-200
0
200
400
Vo
lta
ge
(V
)
-50
0
50
Cu
rre
nt
(A)
VoltageCurrent Pulse Right
Fig. 8. A dimmed unloaded SMPS supplied by the mains, waveform 9 and10
C. Two dimmers with two loads
To look further into the effects of the pulses the twopreviously shown measurements are combined, by using twoidentical dimmers connected to load 1 and 2 respectively.
1) Ideal Grid: The waveform that resulted from the com-bination of the two loads is shown in Fig. 9, where two pulsescan be clearly distinguished. The results of the static energymeter readings are shown in Table IV, where waveforms 11and 12 with FAs around 45◦ and 135◦, respectively, representthe ideal grid situation.
For the same static energy meter as found in the household,SM3, it was found that the severity of the error increases when
TABLE III. Static energy meter readings for waveforms 7, 8, 9 and 10
# WT500 (W) SM1 (W) SM2 (W) SM3 (W) SM4 (W)
7 4 W -37 W -24 W -291 W -57 W8 3 W 216 W 104 W 246 W 117 W9 4 W -8 W -32 W -228 W -104 W10 3 W 39 W 36 W 203 W 107 W
0 0.005 0.01 0.015 0.02
Time (s)
-400
-200
0
200
400
Vo
lta
ge
(V
)
-50
0
50
Cu
rre
nt
(A)
VoltageCurrent Pulses Left
0 0.005 0.01 0.015 0.02
Time (s)
-400
-200
0
200
400
Vo
lta
ge
(V
)-50
0
50
Cu
rre
nt
(A)
VoltageCurrent Pulses Right
Fig. 9. Two dimmed loads supplied by an ideal grid, waveform 11 and 12
adding additional pulses! While for the other, mostly older,static energy meters the errors are reduced, or remain the samecompared to the uncombined load measurements. This resultshows that the extend of the problem can be even furtheramplified by the combination of several dimmers that areloaded with SMPS equipment, and adding the correspondingpulses with different FAs with respect to each other within thevoltage.
2) Mains: For the mains, errors in the same order ofmagnitude are found. The waveforms of this measurement areshown in Fig. 10, while the results are presented in Table IV, aswaveforms 13 and 14 with FAs of 45◦ and 135◦, respectively.
TABLE IV. Static energy meter readings for waveforms 11, 12, 13 and 14
# WT500 (W) SM1 (W) SM2 (W) SM3 (W) SM4 (W)
11 25 W -178 W -203 W -613 W -247 W12 24 W 472 W 372 W 661 W 102 W13 26 W -375 W -451 W -573 W -197 W14 24 W 567 W 652 W 550 W 78 W
The observation from the consumer that his installed staticenergy meter reported a power generation while energy isbeing consumed, is confirmed by the lab experiments. Theconsumer’s installed static energy meter was manufacturedin 2017 and the specimen in the lab is from 2019. Thisshows that static energy meters that have to fulfill the IEC61000-4-19 [11] immunity standard can still be sensitive toEMI problems. Meaning that interference signals found in
0 0.005 0.01 0.015 0.02
Time (s)
-400
-200
0
200
400V
olta
ge
(V
)
-50
0
50
Cu
rre
nt
(A)
VoltageCurrent Pulses Left
0 0.005 0.01 0.015 0.02
Time (s)
-400
-200
0
200
400
Vo
lta
ge
(V
)
-50
0
50
Cu
rre
nt
(A)
VoltageCurrent Pulses Right
Fig. 10. Two dimmed loads supplied by the mains, waveform 13 and 14
household situations are beyond the immunity standard, aswell as the static energy metering requirements in [13].
IV. CONCLUSION
A peculiar situation in a household in the Netherlands isidentified where a static energy meter, from 2017, shows ageneration of power with no power generating equipment suchas solar panels installed. This situation occurs when using aCOTS remote controlled switch with dimming functionalitiescombined with household equipment. The remote controlledswitch and equipment are tested in the lab, such that themeasurements are performed without the possible interferencefrom other appliances present in the household situation. Itis observed that the remote controlled switch always initiatesa dimming function when turning on equipment, thus notsolely functioning as a remote controlled switch, as was theconsumer’s intended usage. In the lab the same type of staticenergy meter is installed together with 23 other static energymeters representing the installed base of static energy metersthroughout the Netherlands. In this setup the same results areobtained for four static energy meters, including the sametype of static energy meter found in the household. Theselab results show a generation of 365 W while 21 W is actuallybeing consumed by a current pulse with a FA of 45◦ withrespect to the voltage. The exact opposite result is foundwhen phase shifting this pulse to 135◦, causing a perceivedpower consumption of 314 W while 20 W is being consumed.Drawing a current pulse at a FA of 90◦ results in no significanterrors for all static energy meters. This shows that the FAaffects/amplifies the errors and determines whether the errorsindicate a perceived generation or a higher consumption ofpower. The same result for power generation are reproducedby connecting a basic unloaded SMPS to the remote controlledswitch. A maximum power generation of 613 W is found witha combination of two loads consisting of SMPSs, actually
consuming around 25 W, showing that the errors add up whenintroducing more loads with dimmers. Having such a setuprunning 24/7 counteracts the average household consumption,and would even generate a positive income of money. Thefact that it happened with a static energy meter from 2017(household) and with a static energy meter of the same type inthe lab, from 2019, shows that static energy meters with theseerrors are still being installed throughout the Netherlands,since they fulfil the updated IEC 61000-4-19 test standard of2014.
V. ACKNOWLEDGEMENT
We would like to express our thanks to Mr. Chris Kuipersfor assistance with the identification of peculiar on-site staticenergy meter cases.
REFERENCES
[1] F. Leferink, “Conducted interference, challenges and interference cases,”IEEE Electromagnetic Compatibility Magazine, vol. 4, no. 1, pp. 78–85,2015.
[2] CLC/TR 50627, “Study Report on Electromagnetic Interference be-tween Electrical Equipment/Systems in the Frequency Range Below 150kHz,” Ed. 2, 2014.
[3] K. Murakawa, N. Hirasawa, H. Ito, and Y. Ogura, “Electromagneticinterference examples of telecommunications system in the frequencyrange from 2kHz to 150kHz,” 2014 International Symposium on Elec-tromagnetic Compatibility, Tokyo, pp. 581–584, 2014.
[4] F. Leferink, C. Keyer, and A. Melentjev, “Static energy meter errorscaused by conducted electromagnetic interference,” IEEE Electromag-netic Compatibility Magazine, vol. 5, no. 4, pp. 49–55, 2016.
[5] Z. Marais, H. Van den Brom, G. Rietveld, R. Van Leeuwen, D. Hoogen-boom, and J. Rens, “Sensitivity of static energy meter reading errors tochanges in non-sinusoidal load conditions,” 2019 International Sympo-sium on Electromagnetic Compatibility (EMC Europe 2019), pp. 202–207, Barcelona, Spain, 2019.
[6] B. ten Have, T. Hartman, N. Moonen, C. Keyer, and F. Leferink, “FaultyReadings of Static Energy Meters Caused by Conducted ElectromagneticInterference from a Water Pump,” Renewable Energy and Power QualityJournal (RE&PQJ), pp. 15–19, Santa Cruz de Tenerife, Spain, 2019.
[7] B. ten Have, T. Hartman, N. Moonen, and F. Leferink, “Misreadings ofStatic Energy Meters due to Conducted EMI caused by Fast ChangingCurrent,” 2019 Joint International Symposium on Electromagnetic Com-patibility and Asia-Pacific International Symposium on ElectromagneticCompatibility, pp. 445–448, Sapporo, Japan, 2019.
[8] B. ten Have, T. Hartman, N. Moonen, and F. Leferink, “Inclination ofFast Changing Currents Effect the Readings of Static Energy Meters,”2019 International Symposium on Electromagnetic Compatibility (EMCEurope 2019), pp. 208–213, Barcelona, Spain, 2019.
[9] R. V. Leeuwen, H. van den Brom, D. Hoogenboom, G. Kok, andG. Rietveld, “Current waveforms of household appliances for advancedmeter testing,” 2019 IEEE 10th International Workshop on AppliedMeasurements for Power Systems (AMPS), Aachen, Germany, 2019.
[10] EnergyAlert. Slimmemeterportal. (2021, Jan 7). [Online]. Available:https://www.slimmemeterportal.nl/
[11] “Electromagnetic Compatibility (EMC) - Part 4-19: Testing and mea-surement techniques - Test for immunity to conducted, differential modedisturbances and signalling in the frequency range from 2 kHz to 150kHz, at a.c. power port,” IEC 61000-4-19:2014, 2014.
[12] B. ten Have, M. A. Azpurua, T. Hartman, M. Pous, N. Moonen, F. Silva,and F. Leferink, “Waveform Model to Characterize Time-Domain PulsesResulting in EMI on Static Energy Meters,” IEEE Transactions onElectromagnetic Compatibility (Early Access), pp. 1–8, 2021.
[13] “EN 50470-3:2006 Electricity metering equipment (a.c.) – Part 3:Particular requirements - Static meters for active energy (class indexesA, B and C),” 2006.