Embed Size (px)
Citation preview

HAL Id: hal-01706788https://hal.archives-ouvertes.fr/hal-01706788v2
Submitted on 1 Jun 2018
HAL is a multi-disciplinary open accessarchive for the deposit and dissemination of sci-entific research documents, whether they are pub-lished or not. The documents may come fromteaching and research institutions in France orabroad, or from public or private research centers.
L’archive ouverte pluridisciplinaire HAL, estdestinée au dépôt et à la diffusion de documentsscientifiques de niveau recherche, publiés ou non,émanant des établissements d’enseignement et derecherche français ou étrangers, des laboratoirespublics ou privés.
How to Design a Park and Its Surrounding UrbanMorphology to Optimize the Spreading of Cool Air?
Jérémy Bernard, Auline Rodler, Benjamin Morille, Xueyao Zhang
To cite this version:Jérémy Bernard, Auline Rodler, Benjamin Morille, Xueyao Zhang. How to Design a Park and ItsSurrounding Urban Morphology to Optimize the Spreading of Cool Air?. Climate , MDPI, 2018, 6(1), �10.3390/cli6010010�. �hal-01706788v2�

Article
How to design a park and its surrounding urbanmorphology to optimize the spreading of cool air?
Jérémy Bernard 1,:,; ID , Auline Rodler 2,3,;, Benjamin Morille 2,4,;* and Xueyao Zheng 2
1 CNRS, Lab-STICC laboratory UMR 6285 - Vannes (France); [email protected] CNRS, Institut de Recherche en Sciences et Techniques de la Ville, FR 2488, École Centrale de Nantes -
Nantes (France); [email protected] Cerema Ouest - Nantes (France); [email protected] UMR CNRS AAU CRENAU, Ecole Nationale Supérieure d’Architecture de Nantes, Nantes (France);
[email protected]* Correspondence: [email protected]; Tel.: +33-632541716; These authors have all contributed equally to this work.
Academic Editor: nameVersion January 19, 2018 submitted to Climate
Abstract: Green areas induce smaller increases in the air temperature than built-up areas. They can1
offer a solution to mitigating the Urban Heat Island impacts during heat waves since the cool air2
generated by a park is diffused into its immediate surroundings through forced or natural convection.3
The purpose of this study is to characterize the effect of several variables (park size, morphology4
of surrounding urban area and wind speed) on the spreading of cool air. A parametric study5
is performed to run computational fluid dynamic simulations. The air temperature entering the6
computational domain was set at 35°C, and the 2-m high surface included within the 34°C isotherm7
was defined as an indicator of cool air spreading. The effects of park shape and orientation are8
negligible in comparison with its size effects. The number of buildings is better correlated with the9
cooled surface area than the typical urban parameters identified in the literature (i.e. building density,10
aspect ratio or mean building height). Since the number of buildings is obviously related to the11
number of streets, this result suggests that the greater the number of streets around a park, the wider12
the area that cool air spreads.13
Keywords: park cool island; urban cooling; urban morphology; micro-climate simulations14
1. Introduction15
According to the Intergovernmental Panel on Climate Change (IPCC) reports, heat wave intensity16
and frequency should increase in the coming decades [1], which may lead to situations of outdoor and17
indoor discomfort as well as major health impacts. During the summer of 2003, European countries18
recorded 70,000 excess deaths, attributing them to an unusually hot summer [2].19
Urban areas are especially vulnerable when facing such problems, and this for two reasons. First,20
heat waves are exacerbated in cities when compared to their surroundings due to the Urban Heat21
Island (UHI) phenomenon [3]. Second, urban areas concentrate most of the human population (i.e.22
70% in European Union countries - [4]).23
In order to cool cities, several solutions are investigated: evaporative techniques (fountains, water24
ponds, street watering), green techniques (grass, trees, green facades or green roofs, etc.), and material25
techniques (reflective, water retentive, etc.). All of these techniques have shown cooling potential, but26
further research is still needed to improve their performance [5]. This article focuses on the use of27
parks as cooling solutions.28
Submitted to Climate , pages 1 – 16 www.mdpi.com/journal/climate

Version January 19, 2018 submitted to Climate 2 of 16
Several studies have shown that parks may create cool air during the day [6] but also at night29
[7]. Moreover, this cool air may be transported to the neighborhoods surrounding parks [8,9]. The30
ability of a park to cool the air and spread this cooler air to its vicinity depends mainly on three factors:31
park characteristics, wind speed conditions, and urban morphology of the peripheral areas. The32
characteristics of a park (tree species and density, presence of water ponds, soil types, etc.) are key33
parameters in explaining its cooling potential [9]. The cool air produced within the park is transported34
into the surrounding areas by diffusion, advection and convection. For the sake of simplification, the35
term spreading will be used in the following sections. The spreading of cool air varies in intensity36
depending on both wind conditions and the urban layout of the park surroundings. This article focuses37
solely on the aspect of cool air spreading (i.e. on the effect of wind speed and urban layout on the level38
of spreading).39
In 1991, Jauregui [7] established that park cooling may be measured up to one park’s width away40
from its boundaries, which is consistent with several other studies [9–12]. However, the methodology41
used to assess this distance was not clearly stated, which makes the results difficult to replicate. To42
explain the relationship between air temperature drop and distance from the park, Shashua-Bar and43
Hoffman [12], Doick et al. [13] proposed an asymptotic nonlinear model, which was then used to define44
the Park Cool island Distance (PCD) as the ‘distance [from the park] where 10% of the UHI is still45
present’ [13]. Despite its interest, this method has been applied based on air temperature observations46
for a single park, hence the model is only valid for this specific park and cannot be used to draw general47
conclusions. We have previously seen that the production of cool air depends on park characteristics,48
whereas its spreading depends on both wind conditions and the layout of the urban surroundings.49
The spreading of cool air is affected by wind speed value [14]. Under light winds, the temperature50
difference observed between the park and the streets is responsible for the advection phenomenon51
[15,16]. In the presence of high wind speeds, this phenomenon becomes negligible. Skoulika et al. [17]52
showed that for a wind speed above 5.5 m/s, the PCD decreases linearly as wind speed value increases,53
whereas Doick et al. [13], Upmanis et al. [15], Oke et al. [18] considered the PCD to be negligible54
whenever wind speed exceeds 2.3 m/s, 5 m/s and 6 m/s, respectively. According to Doick et al. [13],55
this wind speed threshold is likely a function of street geometry, but they did not study this point in56
further detail.57
Chandler [14] demonstrated that some urban structural parameters characterizing the58
surroundings of a park play a key role in the spreading of cool air. Chang and Li [8] analyzed the air59
temperature gradient around 60 parks relative to the urban canyon dimensions. Their results agreed60
with the previous literature regarding the average cooling distance from the park, i.e. approx. one park61
width. They were unable however to establish any relationship between cool air spreading and the62
aspect ratio or building density. This shortcoming might be explained by the use of experimental data,63
which make it difficult to differentiate the influence of street dimensions on both radiation trapping64
and the reduction of cool air flow originating from the park. Moreover, the performance of the shelter65
protecting the air temperature sensor from the sun was very sensitive to solar radiation conditions66
[19,20]. A temperature measurement conducted with a shelter located in a street exposed to direct67
solar radiation may be overestimated, thus complicating comparisons with a measurement performed68
in a shaded street.69
The objective of this article is to better understand the phenomenon of cool air drainage from70
a park to its surroundings, particularly the effects of wind conditions and street dimensions on the71
spreading of air. Simulation rather than observation is used in order to better control the key variables,72
such as wind speed, urban layout, and both park and urban thermal characteristics. Simulation is also73
appropriate to facilitate obtaining a temperature field, thus avoiding having to deploy a large number74
of sensors, which could lead to numerous observation issues [21].75

Version January 19, 2018 submitted to Climate 3 of 16
2. Methodology76
2.1. Definition of urban form parameters77
A numerical approach is used herein to establish relationships between cool air spreading and78
both wind speed and urban form parameters. The urban form parameters are selected from a literature79
review, namely: building height, building density, and aspect ratio [8,13,22]. For purposes of this80
analysis, a square park has been designed, and the street width (W), building footprint area (SB) and81
reference area (Sre f ) are all shown in Figure 1.82
412 m
200
m
W
1000 m
Building surface (SB)
Park surface (Spark)
Computational domain
Reference surface (Sref)
Figure 1. Study area and parameter definition - note that the reference surface consists of the entiresquare surface area
The aspect ratio (H{W) and building density (DB) are calculated by means of Equations 1 and 2:
H{W “HW
(1)
83
where H is the building height
DB “SB
Sre f ´ Spark(2)
84
Since this investigation concerns the effect of the urban form on air spreading, the scenario used85
as a reference is represented by a park on its own (the reference area contains a park but no building86
and consists of the entire square surface area).87

Version January 19, 2018 submitted to Climate 4 of 16
2.2. Model and implementation88
The park is assumed to produce cool air that will then be spread over the urban area. Depending89
on the morphology of the urban area, radiation trapping may vary in intensity and thus interfere with90
the cool air originating from the park. To focus solely on air spreading and simplify the simulation91
analysis, we assume herein that the urban surfaces do not exchange any energy with the air, whereas92
the park surface cools the air at a constant energy rate of 300W{m2. This initial assumption is a major93
one: during a summer, Rodriguez [23] measured in Nantes (city in western France) both the latent94
and sensible heat fluxes according to an eddy-covariance method. At noon, they observed an average95
sensible heat flux value of 250W{m2 for a highly urban neighborhood (i.e. vegetation density less than96
10% in a 200-m buffer circle around the station) versus just 100W{m2 for a more highly vegetated area97
(76% vegetation). The second assumption is much closer to reality, at least for cities located in the Cfb198
or Dfb2 climate zone [24]. The cooling flux of 300W{m2 corresponds to the maximum latent heat flux99
measured around noon in the urban forested park of Chicago [25] and is consistent with observations100
recorded in the City of Nantes in a fairly green urban neighborhood (measurement performed using101
the eddy-covariance method with a vegetation density in the 200-m buffer circle around the station102
of 76%) [23]. The results of our study may not be replicable for any park type (differences in the103
proportion of grass, tree, concrete, etc.) or climate zone (differences in the amount of solar radiation,104
air humidity, air temperature, etc.) since the cooling intensity may be affected [5]. Several other latent105
heat flux values (100 and 200W{m2) have been tested, but the natural convection effect was harder106
to observe. We thus decided to apply the method for the most sensible case (300W{m2). The air107
temperature was also set very high (35°C) to reflect the peak temperature that Europe has had to face108
during its most recent heat waves.109
To assess the spreading phenomenon of the cooled air generated by a park, the Computational110
Fluid Dynamics (CFD) tool Code_Saturne is used in the environment of SOLENE-microclimat (Morille111
et al. [26], Musy et al. [27]), a numerical tool dedicated to urban climate modeling. Thanks to112
Code_Saturne, the airflow is computed by resolving Navier-Stokes equations (momentum, mass113
continuity, energy, species transport) using a k´ ε turbulence model. The tool configuration is similar114
to that described in Malys [28], except that the buoyancy forces have been modeled in order to115
obtain realistic airflow when natural convection is predominant (i.e. under low wind speed and116
high temperature differences). These forces are modeled using the Boussinesq approximation, which117
considers air density to be a function of air temperature.118
ρ “ ρr ¨ p1´ β ¨ pT´ Trqq (3)
where:119
Tr is the reference air temperature (“ 300K)120
T the air temperature121
ρr the air density at temperature Tr (“ 1.18kg ¨m´3)122
ρ the air density123
β the coefficient of thermal expansion (“ 1Tr
)124
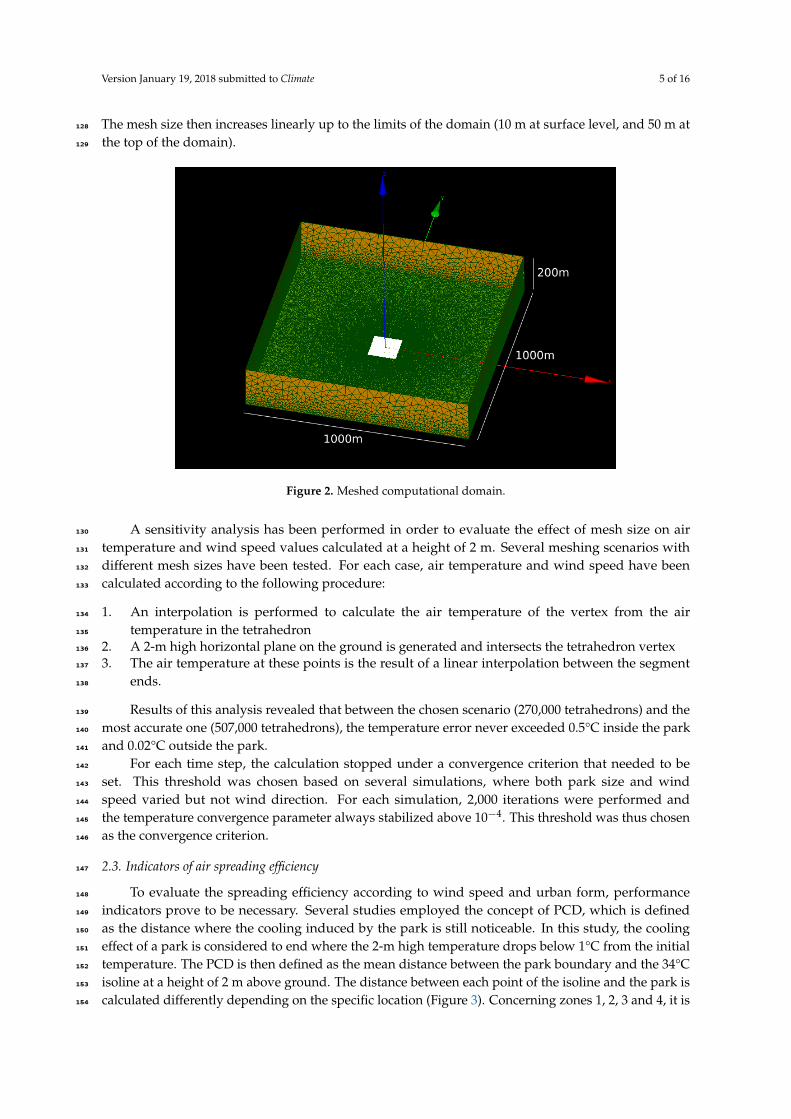
The computational domain represents a 100-ha square area discretized using 270,000 tetrahedral125
meshes (Figure 2). The mesh size varies within the domain. The minimum size of 1.5 m for the126
tetrahedron side is set in the region of interest (the park and its close surroundings under 2 m high).127
1 Temperate Without dry season Warm summer2 Cold Without dry season Warm summer
Version January 19, 2018 submitted to Climate 5 of 16
The mesh size then increases linearly up to the limits of the domain (10 m at surface level, and 50 m at128
the top of the domain).129
Figure 2. Meshed computational domain.
A sensitivity analysis has been performed in order to evaluate the effect of mesh size on air130
temperature and wind speed values calculated at a height of 2 m. Several meshing scenarios with131
different mesh sizes have been tested. For each case, air temperature and wind speed have been132
calculated according to the following procedure:133
1. An interpolation is performed to calculate the air temperature of the vertex from the air134
temperature in the tetrahedron135
2. A 2-m high horizontal plane on the ground is generated and intersects the tetrahedron vertex136
3. The air temperature at these points is the result of a linear interpolation between the segment137
ends.138
Results of this analysis revealed that between the chosen scenario (270,000 tetrahedrons) and the139
most accurate one (507,000 tetrahedrons), the temperature error never exceeded 0.5°C inside the park140
and 0.02°C outside the park.141
For each time step, the calculation stopped under a convergence criterion that needed to be142
set. This threshold was chosen based on several simulations, where both park size and wind143
speed varied but not wind direction. For each simulation, 2,000 iterations were performed and144
the temperature convergence parameter always stabilized above 10´4. This threshold was thus chosen145
as the convergence criterion.146
2.3. Indicators of air spreading efficiency147
To evaluate the spreading efficiency according to wind speed and urban form, performance148
indicators prove to be necessary. Several studies employed the concept of PCD, which is defined149
as the distance where the cooling induced by the park is still noticeable. In this study, the cooling150
effect of a park is considered to end where the 2-m high temperature drops below 1°C from the initial151
temperature. The PCD is then defined as the mean distance between the park boundary and the 34°C152
isoline at a height of 2 m above ground. The distance between each point of the isoline and the park is153
calculated differently depending on the specific location (Figure 3). Concerning zones 1, 2, 3 and 4, it is154

Version January 19, 2018 submitted to Climate 6 of 16
defined as the distance between the point and the closest corner of the park. As for zones 5, 6, 7 and 8,155
it is defined as the minimum distance between the point and a side of the park.156
Figure 3. Zoning (dashed lines and numbers) and example of calculation (red lines) used to calculatethe distance between any point on the 34°C isoline and the park boundary.
The PCD however is a 1-dimensional indicator: in the case of a long but narrow isotherm shape,157
the average distance of the 34°C isotherm can be high, whereas the surface benefiting from the cooled158
air may be small. The surface of the area included in the 34°C isoline is then also calculated in order159
to overcome the shortcomings of the PCD. Yet these results show that both indicators exhibit similar160
behavior for all of the following analyses. For the sake of simplification, only the results obtained with161
the cooled surface area will be presented and analyzed.162
2.4. Parametric study163
The cooling surface is impacted by several kinds of parameters. Three of them will be investigated164
herein: park size (with the shape remaining square), the urban form of its surrounding areas, and wind165
conditions.166
The park width is set at 50, 100 and 200 m. One simulation is run for each park width without167
any adjacent buildings.168
Several Urban Form (UF) scenarios are adopted to investigate the effect of urban parameters on169
the spreading of cool air. Each scenario is established to define a building height, building size and170
street width in order to obtain a building density and aspect ratio values (Table 1). Values are chosen171
so as to highlight the separate effect of H{W, DB and H on the cool air spreading, but also to optimize172
the number of simulations to be carried out. Seven Urban Forms are proposed (Table 2). First, the173
building density influence is investigated by changing either the building size (UF 1 to 3 - method 1) or174
the street width (UF 2 to 4 - method 2). Three density levels are obtained and defined as low, medium175
and high. Next, the aspect ratio influence is investigated by adopting either a low density (UF 1 and 4)176
or high density (UF 3 and 5). Lastly, the height is varied while the building density remains constant177
at a low value (UF 1 and 6) or high value (UF 3 and 7). For each scenario, the resulting number of178
buildings is also given in the Table.179

Version January 19, 2018 submitted to Climate 7 of 16
Table 1. Parameters set for each of the seven scenarios investigated
UF height (m) building width (m) street width (m) DB(%) H/W number of buildings
1 10 8 8 25 (low) 1.25 6722 10 18 8 48 (medium) 1.25 2603 10 96 8 85 (high) 1.25 124 10 18 18 25 (low) 0.56 1605 10 18 5 95 (high) 2.00 3606 17 8 8 25 (low) 2.12 6727 4 96 8 85 (high) 0.50 12
Table 2. Geometry of each urban form
UF1 / UF6 UF2 UF3 / UF7
UF4 UF5
The influence of wind speed is investigated for each of these scenarios: values are selected every180
0.5 m/s from 0.5 m/s to 5 m/s. The scenario combinations derived from urban form and wind speed181
lead to a total of 70 simulations. For all simulations, wind crosses the park along its diagonal (Figure182
3). The effect of wind direction and park shape have been investigated, but only the conclusions will183
be briefly presented in the following section.184
3. Results185
3.1. Influence of park size186
For each park size (50, 125 and 200 m wide), the variation in the cooled surface area (i.e. where187
temperature is lower than 34°C) is evaluated for various wind speeds. It is obvious that a larger park188
will cool a larger area. The cooled surface is then divided by the park area in order to obtain a cooling189

Version January 19, 2018 submitted to Climate 8 of 16
efficiency (Ce) indicator. This value may be interpreted as an equivalent surface cooled by each square190
meter of park.191
The simulations show that Ce increases with park size or as wind speed decreases (Figure 4).192
Figure 4. Cooled surface evolution with wind speed
The first observation implies that one square meter of a large park is more efficient than one193
square meter of a small park. The second observation may be attributed to the assumption made for194
the simulation: the cooling rate of the air located in the park is constant regardless of its air temperature195
or wind speed. One result of this assumption is that the longer the air stays in the park, the cooler it196
leaves the park. Thus, when wind speed is very low (0.5 m/s), the air temperature difference between197
the park and its surroundings is high (8°C). In this case, the air temperature of 34°C is easily reached198
and natural convection dominates: the cool air flow is emitted in all directions, including the opposite199
direction of the incoming wind, and the 34°C isotherm is quite large (Figure 5(a)). For higher wind200
speeds (2 m/s), the air temperature difference between the park and its surroundings is lower (2°C), in201
which case the air temperature barely reaches 34°C and spreading is mainly driven by the wind. As a202
result, the flow is channeled in a single direction and the 34°C isotherm is small (Figure 5(b)). Overall,203
upon analysis of the temperature distribution around a park, we can conclude that the lower the wind204
speed, the further the spreading of cooled air in the direction opposite the incoming air flow.205

Version January 19, 2018 submitted to Climate 9 of 16
(a) (b)
Figure 5. 2 m high air temperature distribution inside and around a park with a width of 125 m: (a)Exposed to a wind speed of 2 m/s. (b) Exposed to a wind speed of 0.5 m/s - the white line is the 34°Cisoline
The shape and orientation of the park (with respect to wind speed) have been investigated. For a206
given surface area, they both exert a very limited influence compared to park size (which is why the207
results are not shown in this study).208
Overall, two main observations can be drawn:209
• The larger the park, the greater the cooling intensity210
• The higher the wind speed, the smaller the cooled surface area.211
In conclusion, the longer the air stays in the park, the cooler it is and the larger the size of the212
34°isotherm.213
3.2. Influence of the neighboring district214
Adding buildings around the park has a direct impact on the cooled surface shape. To investigate215
the influence of the neighboring district on cool air spreading, the larger park is used (200 m wide).216
The surface generated by the 34°C isotherm has nearly the same size for both the reference urban217
form (without any buildings) and the UF 1 (with buildings). However, the former is located further218
downstream than the latter (Figure 6). The buildings can be seen as contributing to slowing the wind219
speed. In agreement with the previous analysis, this finding leads to increasing the natural convection220
influence, diffusing the air further toward the incoming airflow direction.221

Version January 19, 2018 submitted to Climate 10 of 16
Figure 6. 34°C isotherm at a 0.5 m/s wind speed for the reference urban form (no buildings - orangeline) and for the UF 1 (red line) - the small white squares represent building footprints
The influence of the urban form of the district surrounding the park is now investigated. Three222
parameters are considered: building density, aspect ratio, and building height. As described in the223
Methodology section, the building density is increased using two distinct methods (either the building224
size is modified - method 1 - or the street width is modified - method 2). These two methods are225
considered separately and results are shown on separate plots. As previously observed, the cooled226
surface decreases as wind speed increases under all scenarios (Figure 7). For a given wind speed, when227
building density is increased by increasing the building size, the cooled surface area decreases (Figure228
7(a)). In contrast, when building density is increased by increasing street width, the cooled surface229
area expands (Figure 7(b)).230
(a) (b)
Figure 7. Influence of wind speed on the cooled surface for various building density values: (a) Whenbuilding density is increased modifying the building size (b) When building density is increasedmodifying the street width
Building density cannot therefore be used as the lone parameter explaining the influence of the231
built environment on the cooled surface of a park.232
The effect of the aspect ratio on the cooled surface is tested by decreasing the street width. In this233
manner, the aspect ratio is increased, thus keeping building density and building height constant. For234

Version January 19, 2018 submitted to Climate 11 of 16
a given wind speed, the size of the cooled surface increases as the aspect ratio increases (as well for a235
given building density regardless of its value 8.236
(a) (b)
Figure 8. Influence of wind speed on the cooled surface for different aspect ratio values. (a) For highbuilding density (b) For low building density
Thirdly, the building height is increased for a given building density with an increasing aspect237
ratio. For high building density (Figure 9(a)) and at a given wind speed, the cooled surface area is238
nearly similar when the building height increases from 10 m to 17 m. For the low building density case239
(Figure 9(b)), it increases as the building height rises from 4 m to 10 m. According to an initial analysis,240
we could assume that building height, like building density, is not a key parameter in explaining the241
cooled surface, while the aspect ratio is a key parameter. It is also possible that the effect of building242
height only appears at a certain threshold value. This assumption will be further analyzed in the243
following section.244
Figure 9. Influence of wind speed on the cooled surface for various building heights. (a) For a lowbuilding density district (b) For a high building density district
The three urban form parameters (building density, aspect ratio and height) investigated herein245
do not impact the air spreading pattern in a way that could have been expected:246
• For a given building height and aspect ratio, the building density increase enhances or reduces247
the spreading of cooled air, depending on how the density is modified. Density does not seem to248
be a key parameter affecting air spreading.249
• For a given building height and building density, the aspect ratio appears to enhance the cooling250
process, whereas it is not often identified in the literature as a key parameter.251

Version January 19, 2018 submitted to Climate 12 of 16
• Higher buildings may increase air spreading under a certain threshold value, which has not yet252
been identified (note that this threshold may be dependent on wind speed conditions).253
4. Discussion254
The results presented above lead to investigating in greater detail the simulation results and then255
discussing them. This discussion section will focus on two points:256
• An understanding of the influence of building height on air spreading based on the configuration257
• The identification of other parameters that could be relevant for the air spreading characterization.258
The air temperature field for UF 3 and UF 7 (buildings 10 m and 4 m high, respectively, in a259
high-density district due to large buildings - few streets) is presented in Figure 10. In the low building260
height case (UF 7), the cool air diffuses over the buildings (Figure 10(a)). In the tall building case (UF261
3), the buildings seem to be sufficiently high to avoid air from spreading above them (Figure 10(b)). As262
a result, the cool air is channeled into the streets, reaching a further distance from the park and thus263
covering a wider area.264
Figure 10. Vertical slice of the air temperature field for a high building density district. (a) UF 7 :buildings are 4 m high. (b) UF 3 : buildings are 10 m high - the white line is the 34°C isotherm
The air temperature field for the UF 1 and UF 6 (buildings 10 m and 17 m high, respectively, in265
a low-density district - many streets) is presented Figure 11. For the UF 1, the cool air does not pass266
over the buildings; it remains channeled in the streets. It is obvious that in this case building height267
increases do not affect the spreading of cool air.268

Version January 19, 2018 submitted to Climate 13 of 16
Figure 11. Vertical slice of the air temperature field for a low building density district. (a) UF 1 :buildings are 10 m high. (b) UF 6 : buildings are 17 m high) - the white line is the 34°C isotherm
Above a certain building height threshold, the cool air can no longer spread over the buildings.269
Further increasing the building height would then have no effect on the cooled surface since the air is270
only spreading under the urban canopy.271
The issue of building height relevance calls into question the relevance of two other indicators,272
namely: urban fragmentation (e.g. number of buildings), and street width. We previously showed273
that the aspect ratio is positively correlated with the cooled surface area. The aspect ratio is defined as274
the ratio of building height to street width. Since past results have demonstrated that building height275
only affects the cool air spreading in very specific configurations, we might wonder whether street276
width is an influential parameter. Urban fragmentation was not initially identified as an important277
parameter as regards the cool air spreading. However, the number of buildings varies along the chosen278
urban form and thus its cooling potential warrants investigation. The cooled surface area is plotted279
versus both the number of buildings (Figure 12(a)) and the street width (Figure 12(b)). The number of280
buildings appears to be much more closely correlated than street width with the cooled surface area. A281
large variability in the cooled surface area exists for the UF with 8-m width streets, thus making this282
parameter insignificant (Figure 12(b)). In Figure 12(a), the cooled surface area clearly increases as the283
number of buildings or streets increases. Moreover, the distance to the regression line remains low284
(except when the number of buildings is very small).285
Ultimately, urban fragmentation (here the number of buildings) seems to be a more relevant286
variable than building density, aspect ratio or building height for characterizing the cooled air spreading287
from a park through a district.288

Version January 19, 2018 submitted to Climate 14 of 16
Figure 12. Cooled surface area evolution versus: (a) the number of buildings; (b) street width - windspeed set at 2.5m{s
5. Conclusion289
The parameters impacting the spreading of cool air produced by a park have been investigated290
herein. Simulations were performed to observe the cooling distance (surface included inside the 1°C291
temperature decrease isoline) induced by the park and by the form of its surrounding urban district.292
Some of the studied parameters are intrinsic to the park (shape and size), while others describe the293
urban morphology of the surrounding neighborhoods (building density, building height and aspect294
ratio). The simulations were run for various wind speeds and under a constant cooling flux of 300295
W/m² generated by the green area.296
The analysis of results leads to the following conclusions:297
• A larger park will cool more efficiently: it will generate a greater surface area of cooled air per298
square meter than a smaller park.299
• The building density variation can enhance or reduce the spreading of cooled air. This parameter300
therefore is irrelevant as regards cool air spreading.301
• For a given building height and building density, the aspect ratio seems to enhance the cooling302
process, even though it has not often been identified in the literature as a key parameter.303
• Building height does not exert any influence on air spreading above a certain threshold value.304
• The number of buildings seems to be a very relevant parameter for characterizing the cooled air305
spreading from a park through a district. This parameter and all other fragmentation indicators306
(the number of buildings is an indicator of fragmentation intensity, but the direction and shape of307
fragmentation may also be of interest) should be further analyzed by the research community.308
In this paper, a constant cooling flux was considered in order to focus solely on the spreading of309
the cool air being produced. Some bias was thus introduced when using this method for analysis (if310
air remains for an infinite time in the park, its temperature should be infinitely negative). In reality, the311
flux should have been modified by the temperature difference between the ground and the air and by312
the wind speed. This hypothesis could be revised in future work by employing a coupled heat transfer313
simulation (thermo radiative and CFD) in order to generalize the methodology proposed herein and314
consider a cooling flux that varies in both space and time.315
This paper has highlighted new findings but it is based on strong hypotheses. Further316
investigation is thus required (empirical data should be used) to verify that these assumptions do not317
affect the veracity of the main findings. However, only a few studies regarding the topic of cool park air318
spreading have so far been performed using a numerical approach. The academic approach proposed319
in this paper has led to both a better understanding of the physical phenomena involved and an320
identification of the key parameters affecting cool air spreading. For these reasons, it is complementary321
to the experimental studies available in the literature.322
Version January 19, 2018 submitted to Climate 15 of 16
Author Contributions: This work was been conducted within the scope of Xueyao Zhang’s internship. The work323
program was managed by Jérémy Bernard, Benjamin Morille and Auline Rodler. Xueyao Zhang studied the324
bibliography and carried out all of the simulation runs. Jérémy Bernard, Benjamin Morille and Auline Rodler325
wrote the paper and contributed to this effort in equal measure.326
Conflicts of Interest: The authors declare no conflict of interest.”327
References328
1. Revel, D.; Füssel, H.M.; Jol, A. Climate change, impacts and vulnerability in Europe 2012, 2012.329
2. Robine, J.M.; Cheung, S.L.K.; Le Roy, S.; Van Oyen, H.; Griffiths, C.; Michel, J.P.; Herrmann, F.R. Death toll330
exceeded 70,000 in Europe during the summer of 2003. Comptes rendus biologies 2008, 331, 171–178.331
3. Oke, T.R. Boundary layer climates; Routledge, 2002.332
4. Eurostat. Eurostat regional yearbook 2014: Focus on european cities, 2014.333
5. Santamouris, M.; Ding, L.; Fiorito, F.; Oldfield, P.; Osmond, P.; Paolini, R.; Prasad, D.; Synnefa, A. Passive334
and active cooling for the outdoor built environment–Analysis and assessment of the cooling potential of335
mitigation technologies using performance data from 220 large scale projects. Solar Energy 2016.336
6. Barradas, V.L. Air temperature and humidity and human comfort index of some city parks of Mexico City.337
International Journal of Biometeorology 1991, 35, 24–28.338
7. Jauregui, E. Influence of a large urban park on temperature and convective precipitation in a tropical city.339
Energy and buildings 1991, 15, 457–463.340
8. Chang, C.R.; Li, M.H. Effects of urban parks on the local urban thermal environment. Urban Forestry &341
Urban Greening 2014, 13, 672–681.342
9. Spronken-Smith, R.; Oke, T. Scale modelling of nocturnal cooling in urban parks. Boundary-Layer343
Meteorology 1999, 93, 287–312.344
10. Cao, X.; Onishi, A.; Chen, J.; Imura, H. Quantifying the cool island intensity of urban parks using ASTER345
and IKONOS data. Landscape and urban planning 2010, 96, 224–231.346
11. Ca, V.T.; Asaeda, T.; Abu, E.M. Reductions in air conditioning energy caused by a nearby park. Energy and347
Buildings 1998, 29, 83–92.348
12. Shashua-Bar, L.; Hoffman, M.E. Vegetation as a climatic component in the design of an urban street: An349
empirical model for predicting the cooling effect of urban green areas with trees. Energy and Buildings 2000,350
31, 221–235.351
13. Doick, K.J.; Peace, A.; Hutchings, T.R. The role of one large greenspace in mitigating London’s nocturnal352
urban heat island. Science of the total environment 2014, 493, 662–671.353
14. Chandler, T.J. The Climates of London; Hutchinson, 1965.354
15. Upmanis, H.; Eliasson, I.; Lindqvist, S. The influence of green areas on nocturnal temperatures in a high355
latitude city (Göteborg, Sweden). International journal of climatology 1998, 18, 681–700.356
16. Jansson, C.; Jansson, P.E.; Gustafsson, D. Near surface climate in an urban vegetated park and its357
surroundings. Theoretical and Applied Climatology 2007, 89, 185–193.358
17. Skoulika, F.; Santamouris, M.; Kolokotsa, D.; Boemi, N. On the thermal characteristics and the mitigation359
potential of a medium size urban park in Athens, Greece. Landscape and Urban Planning 2014, 123, 73–86.360
18. Oke, T.R.; Crowther, J.; McNaughton, K.; Monteith, J.; Gardiner, B. The micrometeorology of the urban361
forest [and discussion]. Philosophical Transactions of the Royal Society B: Biological Sciences 1989, 324, 335–349.362
19. Lacombe, M.; Bousri, D.; Leroy, M.; Mezred, M. WMO Field Intercomparison of Thermometer363
Screens/Shields and Humidity Measuring Instruments, Ghardaia, Algeria, November 2008–October364
2009. Technical report, World Meteorological Organization, 2011.365
20. Lacombe, M. Results of the WMO intercomparison of thermometer screens/shields and hygrometers in366
hot desert conditions. TECO-2010–WMO Technical Conference on Meteorological and Environmental367
Instruments and Methods of Observation, Helsinki, Finland, 30 August–1 September 2010, http://www.368
wmo. int/pages/prog/www/IMOP/publications/IOM-104 TECO-2010/3 4 Lacombe France. pdf, 2010.369
21. Oke, T. Initial guidance to obtain representative meteorological observations at urban sites; Vol. 81, World370
Meteorological Organization Geneva, 2004.371
22. Perini, K.; Magliocco, A. Effects of vegetation, urban density, building height, and atmospheric conditions372
on local temperatures and thermal comfort. Urban Forestry & Urban Greening 2014, 13, 495–506.373

Version January 19, 2018 submitted to Climate 16 of 16
23. Rodriguez, F. FluxSAP - A collaborative experimental campaign on water and energy fluxes in urban areas374
and the relation with the vegetation : the case of a Nantes district . 9th International Conference on Urban375
Climate (ICUC9); Météo-France, , 2015.376
24. Peel, M.C.; Finlayson, B.L.; McMahon, T.A. Updated world map of the Köppen-Geiger climate classification.377
Hydrology and earth system sciences discussions 2007, 4, 439–473.378
25. McPherson, G.E.; Nowak, D.J.; Rowntree, R.A. Chicago’s urban forest ecosystem: results of the Chicago379
Urban Forest Climate Project 1994.380
26. Morille, B.; Lauzet, N.; Musy, M. SOLENE-microclimate: a tool to evaluate envelopes efficiency on energy381
consumption at district scale. Energy Procedia 2015, 78, 1165–1170.382
27. Musy, M.; Malys, L.; Morille, B.; Inard, C. The use of SOLENE-microclimat model to assess adaptation383
strategies at the district scale. Urban Climate 2015, 14, 213–223.384
28. Malys, L. Évaluation des impacts directs et indirects des façades et des toitures végétales sur le385
comportement thermique des bâtiments. PhD thesis, École nationale supérieure d’architecture (Nantes),386
2012.387
© 2018 by the authors. Submitted to Climate for possible open access publication under the terms and conditions388
of the Creative Commons Attribution (CC BY) license (http://creativecommons.org/licenses/by/4.0/).389