Embed Size (px)
Citation preview

ORIGINAL ARTICLE
Kohji Yamamura Æ Masayuki Yokozawa
Motoki Nishimori Æ Yasuo Ueda Æ Tomoyuki Yokosuka
How to analyze long-term insect population dynamics under climatechange: 50-year data of three insect pests in paddy fields
Received: 2 May 2005 / Accepted: 1 September 2005 / Published online: 22 November 2005� The Society of Population Ecology and Springer-Verlag Tokyo 2005
Abstract We can precisely predict the future dynamics ofpopulations only if we know the underlying mechanismof population dynamics. Long-term data are importantfor the elucidation of such mechanisms. In this article weanalyze the 50-year dynamics of annual light-trap catchesof three insect pest species living in paddy fields in Japan:the rice stem borer, Chilo suppressalis (Walker) (Lepi-doptera: Pyralidae); the green rice leafhopper, Neph-otettix cincticeps (Uhler) (Hemiptera: Deltocephalidae);and the small brown planthopper, Laodelphax striatellus(Fallen) (Hemiptera: Delphacidae). We separate thelong-term dynamics into two components by usinglocally weighted scatterplot smoothing: (1) the underly-ing dynamics of populations, and (2) the influence of thepast changes in the environment. The former componentis analyzed by response surface analysis and vectorautoregression to evaluate the nonlinearity of density-dependence and the inter-specific influence of density,respectively. On the basis of these analyses, we performthe state-space model analyses. The state-space modelselected by Akaike’s information criterion indicates thatthe observed number of light-trap catches of C. sup-pressalis and N. cincticeps in summer increases withincreasing temperatures in the previous winter. It alsoindicates that the influence of temperature is not carriedover to the next year. We utilize the selected model topredict the impact of global warming on these species, by
substituting the temperature predicted by a generalcirculation model.
Keywords Chilo suppressalis Æ Laodelphax striatellus ÆLong-term dynamics Æ Nephotettix cincticeps Æ Paddyfield
Introduction
The study of the mechanism of population regulationhas a considerable history. This was most clearly sum-marized by Turchin (1995, 2003). He wrote that: ‘‘timeseries analysis of population fluctuations can be tracedto the famous debate about population regulation,which crystallized at the 1957 meeting in Cold SpringHarbor.’’ In this debate, Nicholson (1954) claimed thatthe population density is regulated by density-dependentmechanisms. Elton (1949) supported Nicholson’s views.Andrewartha and Birch (1954), however, disagreed withNicholson. They claimed that a general theory cannot bebased on density-dependent factors because they do notdescribe any substantial body of empirical facts. Re-cently, this old debate has reappeared, as seen in thecontroversy between Murray (1999), Turchin (1999) andothers (Selas et al. 2001; White 2001; Berryman et al.2002; Hixon et al. 2002; Berryman 2004; White 2004).
Most analyses of long-term terrestrial dynamics seemto be confined to the study of forest insects and verte-brates (e.g., Royama 1992; Bjørnstad et al. 1995; Turchin2003; Royama et al. 2005) with a few exceptions such asdescribed in Alyokhin et al. (2005). The dynamics of in-sect pest populations living in agricultural environmentshave not been so widely analyzed over the long-term, duepartly to the frequent change in agricultural environ-ments; agricultural practices frequently change as agro-technology progresses or due to other economic factors,and the abundance of insects changes accordingly. Wegenerally have a dilemma in this respect. Long-term dataare preferable for estimating the mechanism of popula-tion dynamics, but environmental conditions change
Special feature: Global climate change and the dynamicsof biological communities
K. Yamamura (&)Laboratory of Population Ecology, National Institute for AgroEnvironmental Sciences, 3-1-3 Kannondai,Tsukuba 305-8604, JapanE-mail: [email protected].: +81-298-388253Fax: +81-298-388199
M. Yokozawa Æ M. NishimoriDepartment of Global Resources, National Institute for AgroEnvironmental Sciences, Tsukuba, Japan
Y. Ueda Æ T. YokosukaAgricultural Research Institute,Ibaraki Agricultural Center, Mito, Japan
Popul Ecol (2006) 48:31–48DOI 10.1007/s10144-005-0239-7

over a long period. The resultant population dynamicswill be a mixture of two components: (1) exogenousdynamics that are driven by a change of environment,and (2) endogenous dynamics that are driven by theintrinsic mechanism. If we could remove the dynamicscaused by exogenous factors by using a smoothingtechnique, we would be able to clarify the underlyingmechanism of population dynamics.
In this paper, we analyze the dynamics over a periodof 50 years of three insect pest species in paddy fields: therice stem borer, Chilo suppressalis (Walker) (Lepidop-tera: Pyralidae); the green rice leafhopper, Nephotettixcincticeps (Uhler) (Hemiptera: Deltocephalidae); and thesmall brown planthopper, Laodelphax striatellus (Fallen)(Hemiptera: Delphacidae). We demonstrate how insectpopulation dynamics can be analyzed from differentangles. For convenience, in our explanation we proceedfrom models that are simple in principle to those whichare more complicated. We first discuss the importance ofappropriate transformation to enhance additivity andhomoscedasticity. We next perform the preliminary testfor density-dependence, which is a traditional topic inpopulation ecology. Then, we apply an analysis using thegeneralized additive model (GAM), which automaticallydetermines the smoothing parameter. After discussingthe limitation of such automated analyses, we performthe empirical smoothing where empirical knowledge isused to determine the smoothing parameter. All furtheranalyses are performed using the difference between theobserved quantity and the smoothed quantity. Responsesurface analysis is then performed for each species byconsidering the possibility that the density-dependentregulation is nonlinear. This analysis indicates that themechanism causing the dynamics of C. suppressalis andN. cincticeps is mostly linear. Next, in order to considerthe possibility of interspecies interaction in the dynamics,we perform linear vector autoregression analysis (VAR).Measurement errors are ignored in these analyses wherethe measurement error is defined as a component thatinfluences an observation without influencing the obser-vation of the subsequent year. We next incorporate suchmeasurement errors into VAR to clarify the mechanismgenerating the influence of temperature. This analysisindicates that temperature most influences measurementerrors and that it does not strongly influence the abun-dance of the next year. It indicates that the fluctuation inthe ‘‘observed’’ population is influenced by the climaticfluctuation as was claimed by Andrewartha and Birch(1954) but that the underlying ‘‘true’’ population is reg-ulated in a density-dependent manner across years, aswas claimed by Nicholson (1954).
The estimated model for population dynamics can beutilized for various purposes. Predicting outcomes ofglobal warming will be one of the major fields to employsuch applications. Future climatic change caused by anincrease in the atmospheric concentration of greenhousegas including CO2 is usually predicted by using globalclimate models (GCM), especially atmosphere–oceanGCM, that simulate the substantial circulation of the
atmosphere and oceans. The intergovernmental panel onclimate change (IPCC), in its third assessment reportpublished in 2001, used models based upon the latestemissions scenarios from the IPCC special report onemission scenarios (SRES) (IPCC 2001). For the fullrange of 35 SRES scenarios, based upon a number ofclimate models, the globally averaged surface tempera-ture was projected to increase by 1.4–5.8�C over theperiod 1990–2100. We substitute the temperature datathat were predicted by GCM into the estimated popu-lation models to predict the outcome of global warming;we predict the populations in the period from 2031 to2050 relative to those in the period from 1980 to 2000.We further predict the amount of relative yield losscaused by C. suppressalis.
Materials and methods
Light trap survey
A light-trap survey was carried out at Ibaraki PrefecturalExperiment Station at Mito (36�16¢N and 140�20¢E) inline with the project standards for forecasting pest inci-dence (Ministry of Agriculture Forestry and Fisheries1986). We use the annual total catches (May–September)of 1949–2001 for three principal insect pests in paddyfields: C. suppressalis, N. cincticeps, and L. striatellus.The data from 1957 to 2001 are cited from the annualreport of the experiment station (Ibaraki Prefecture1957–2001), and the data from 1949 to 1956 are citedfrom the data compiled by Otake (unpublished data) ofannual totals of important rice pest insects caught in lighttraps in Japan. The data for L. striatellus in 1949 areabsent. No catch was recorded for C. suppressalis in1987. We omit these data when we use the ordinary leastsquares (OLS) method for estimating parameters, whilemissing quantities are automatically interpolated whenwe use Kalman filter algorithms in later sections. Toevaluate the effect of climatic factors on populationdynamics, we use the climatic data recorded by the MitoLocal Meteorological Observatory (36�23¢N, 140�28¢E).
Insect species
The rice stemborer,C. suppressalis, is amothwith a lengthof 12–15 mm.This species has two generations in a year inmost areas of Japan.Matured larvae, which overwinter inthe dried rice straw in fields (Kojima and Emura 1971),emerge from May to July to lay their egg mass. Hatchedlarvae enter the stem, sometimes causing the death of theleaf sheath or the death of the growing point. These larvaeemerge from August to September. The larvae of thesecond generation cause the production of sterile grains orthe death of young ears. Various studies were conductedduring the 1950s to clarify the population dynamics ofC. suppressalis (Fukaya 1950a, b; Ishikura 1950a, b, 1951;Fukaya et al. 1954; Utida 1954, 1957a, b, 1958;Miyashita
32

1955; Fukaya and Nakatsuka 1956). The increase in thepopulation density over several successive years, called‘‘gradation’’, has been frequently observed in this species(Ishikura 1951). Miyashita (1955) detected a 6-year cyclein the population dynamics of Shimane Prefecture, but noclear cycles have been detected in most prefectures (Ito1968). Centrifugal spatial spread of infested areas wasobserved over several years during the gradation period inthe Kyushu district of Japan (Kiritani and Oho 1961).Climatic factors such as the low temperatures in July havebeen thought to responsible for the cause of the initiationof gradation ofC. suppressalis (Ishikura 1950b;Miyashitaand Ito 1961).
The green rice leafhopper, N. cincticeps, is a suckinginsect with a length of 4.5–6 mm. This species has threeor four generations in a year. In winter, the leafhopperlives on grass weeds such as Poa annua L. and Alope-curus aequalis Sobol. in the overwintering nymphalstage, mainly of the fourth stage. These weeds provideboth food and habitat for N. cincticeps in late winter.This species has been considered a typical insect, thedensity of which is regulated by a density-dependentprocess (Kuno 1968). The density-dependent dispersal ofadults of the second generation is one of the mechanismsof negative feedback at work in the Kyushu district inJapan (Hokyo 1972). N. cincticeps is a serious pest as itis the vector of the rice dwarf virus in central and wes-tern parts of Japan. The fluctuation of the population isrelatively large in the Tohoku and Hokuriku districts,occasionally causing a yield loss as a consequence of thedirect sucking by the insects, or via the sooty mould thatemerges on their excretions (Johraku et al. 1976, 1983;Kidokoro 1979; Johraku 1984; Hirano and Fujii 1995).The length of the snow-covered period and the abun-dance of weeds in winter is considered to be one of themajor factors determining their abundance in the Hok-uriku district (Oda 1971; Johraku and Kato 1974; Imai1976; Johraku 1976; Sekiguchi et al. 1981).
The small brown planthopper, L. striatellus, is asucking insect with a length of 3–4 mm. This species hasabout five generations in a year in the Ibaraki Prefecture.The abundance of this species is very influenced by theexistence of wheat or barley fields. The planthopper en-ters diapause in the nymphal stage in levees around fal-low paddy fields in winter (Murakami and Suzuki 1971).In the Kanto district, brachypterous and macropterousadults emerge from the levees from March to April andenter wheat or barley fields. These adults lay eggs whichin turn yield the first-generation macropterous adultsfrom May to June. Wheat is an especially good food forthis species. These macropterous adults then emigrate topaddy fields that are transplanted with rice from May toJune (Kisimoto and Yamada 1986). Although the riceplant is less preferred as a food by this species, three orfour generations of these insects are produced in thepaddy fields. Nymphs of the final generation enter dia-pause, induced by a short-day photoperiod at low tem-peratures, and move to levees where they overwinter.L. striatellus is a serious pest as the vector of the rice
stripe virus (RSV). The occurrence of this disease isdetermined by a complex interaction between three bio-logical entities: the rice plant, the virus, and the insect.Several epidemiological models have been constructed topredict the disease’s prevalence (Kono 1966; Muramatsu1979; Kisimoto and Yamada 1986, 1988; Taira et al.1995; Yamamura 1998).
Transformation
We first perform transformations to improve the addi-tivity and homoscedasticity of the time-series. Variousforms of transformation could be used, including asquare root transformation, a logarithmic transforma-tion and, more generally, the Box–Cox transformation(1964). Among these, a logarithmic transformation isusually preferred when analyzing population dynamicsfor the following reasons. Most populations change bymultiplicative factors such as the mortality and birthrates. The logarithmic transformation makes a multi-plicative factor into an additive factor. Therefore, if weuse logarithmic transformation, we are able to use anadditive model, which is analytically more tractable.Simultaneously, homoscedasticity arises in most casesbecause the multiplicative error factor becomes additiveby a logarithmic transformation. Thus, we use a loga-rithmic transformation in the following analyses. Tosolve the problem that arises from the discreteness of thenumber of individuals, we use log(x+0.5) where x is thenumber of individuals, although most people tradition-ally use a transformation of the form log(x+1), which isless preferable (Yamamura 1999). We use a commonlogarithm log10(x+0.5) instead of a natural logarithmloge(x+0.5) so that we are able to easily back-transformthe variable using mental calculations.
Test for density-dependence
Testing density-dependence and testing the hypothesisof random walk are two sides of the same analysis,because a random walk is a situation where there is nodensity-dependence. We are liable to detect a significantcorrelation between two time-series, even if they areindependent, if they have stochastic trends caused by arandom walk. Such a regression is called ‘‘spuriousregression’’ in the field of econometrics (Greene 2000).A preliminary test to detect a random walk is requiredin order to avoid a spurious regression. Various testingprocedures collectively referred to as ‘‘unit root tests’’have been developed for this purpose (Greene 2000;Hayashi 2000; Maddala 2001). Recent versions of sta-tistical software for econometrics such as EViews,LIMDEP, SHAZAM, SAS, Stata, or TSP provide sev-eral unit root tests (SAS Institute 1993; Greene 2002;Stata Corp 2003; Quantitative Micro Software 2004;Whistler et al. 2004; Hall and Cummins 2005).
In ecological literature, the difficulty that arises in thedetection of density-dependence was first discussed by
33

Maelzer (1970) and St. Amant (1970). The test statisticscalculated from the regression do not follow a standarddistribution such as the t-distribution. Hence, variousmethods, including those of Bulmer (1975) and Pollardet al. (1987), have been proposed as alternative tests (seeDen Boer and Reddingius 1996 for the review of earlierliterature in ecological journals). To further complicatematters, measurement errors also yield a bias in theestimation of density-dependence (Kuno 1971; Fuller1987; Den Boer and Reddingius 1996; Shenk et al. 1998;Solow 1998, 2001). We will discuss the bias caused bymeasurement errors in estimating parameters in latersections. Initially, however, we ignore measurement er-rors as we test the null hypothesis of random walk,considering the influence of measurement errors to berelatively small in such extreme cases. Then, we can useseveral standard procedures such as the Dickey–Fullertest, augmented Dickey–Fuller test, and Phillips–Perrontest. Among these, we apply the Dickey–Fuller test thatis most widely used in econometrics (Dickey and Fuller1979; Greene 2000; Maddala 2001). Let Nt be thetransformed quantity, in the form of log10(x+0.5), ofthe total number of captured individuals of a species inyear t. We first consider the following model:
Nt ¼ a0 þ a1Nt�1 þ et; et � Nð0; r2Þ; ð1Þwhere a0 and a1 are constants, and et denotes an errorthat follows a normal distribution. The null hypothesis isa1=1 while the alternative hypothesis is a1<1.
The P-value that was evaluated by the approximationdescribed by MacKinnon (1994) was 0.811 for C. sup-pressalis. Thus, no significant density-dependence wasdetected; we cannot discard the hypothesis that thepopulation dynamics of C. suppressalis shown in theupper panel in Fig. 1 were generated by a random walk.In contrast, we found P<0.001 for N. cincticeps, indi-cating that the dynamics of N. cincticeps is regulated bya density-dependent mechanism, and P=0.072 forL. striatellus, indicating that the density-dependence isonly marginally significant.
Additive model
Most techniques for conventional time-series analysesassume that the time-series is stationary. Hence, non-stationary time-series are conventionally converted intostationary time-series by removing the trend beforeperforming an analysis. However, such a procedure isnot always appropriate. Many times-series show trends,which are one of two types: stochastic trends that aregenerated by a random walk and deterministic trendsthat are generated by a change in exogenous factors.The removal of trends is effective only for deterministictrends. The above unit root test for C. suppressalisindicated that the dynamics of this species may have astochastic trend that was generated by a random walk.If this is true, removing the trend before analysis would
generate an artificial stationary time-series. However,empirically we consider that the biological componentsof the dynamics will not be a random walk. There is along history of pest management practices used againstC. suppressalis. The population of C. suppressalis willrather fluctuate around the potential equilibrium that isdetermined by the balance between the efficiency of pestmanagement and the reproductive rate of insects. Thispotential equilibrium may fluctuate continuously by arandom walk, but the biological dynamics of C. sup-pressalis around the equilibrium will not be a randomwalk. Thus, we will be able to assume that the trend isdeterministic but not stochastic. Then, we divide theobserved dynamics into two components: (1) thedynamics of environmental factors influencing the po-tential equilibrium of insect pests, and (2) the biologicaldynamics of insect pests in a given environment.Here we are interested in the influence of temperature,and hence include it in the second component. In the
0
0.5
1
1.5
2
2.5
3
3.5
4
1950 1960 1970 1980 1990 2000
gol01
)sehctac fo rebmun launna(
-1.5
-1
-0.5
0
0.5
1
1.5
1950 1960 1970 1980 1990 2000
evruc dehtooms
morf noit aiveD
Year
Fig. 1 Population dynamics of Chilo suppressalis (logarithmicscale). Upper panel Observed annual number of individuals caughtby a light trap, log10(x+0.5). Thin curve Locally weightedscatterplot smoothing (LOWESS) selected by generalized cross-validation (GCV) criterion in the full additive model (Eq. 2). Boldcurve LOWESS selected by GCV criterion in the null model (Eq. 3).Dotted curve LOWESS calculated by a normal kernel with a SD of5 years. Lower panel Deviation (Dt) between log10(x+0.5) and theLOWESS that was calculated by a normal kernel with a SD of5 years
34

first component, we include only those environmentalfactors that are beyond our major interest; these factorscan be called ‘‘nuisance factors’’. For example, thedensity of insect pests will become much smaller if thearea of paddy field is reduced due to changes in landuse. Such an artificial reduction is a nuisance factorin the sense that we need not explain the reason for thatreduction. In order to isolate those factors that weneed to explain, our first concern is to consider how wemight automatically remove the influence of nuisancefactors.
Two kinds of procedures are usually used to removethese trends (Brockwell and Davis 2002): one is a finitedifference procedure, the other is a smoothing proce-dure. The finite difference procedure, largely derivedfrom Box and Jenkins (1970), uses artificial assumptionsin most cases, although they are not always explicitlynoted. For example, the time-series may become sta-tionary when a first-order difference such as Nt�Nt�1 isused. In this case, we implicitly assume that the differ-ence is not determined by the previous quantities ofvariables but by the previous difference between vari-ables. However, there would be no clear reason for thedifference to become the cause of the next difference. Inthis respect, smoothing procedures will logically be moreappropriate than difference procedures in most cases.We use a smoothing procedure to divide the dynamicsbetween those components that are environmental nui-sance factors and those that are biological factors.
We are interested in the influence of a temperaturerise on the abundance of these populations. Hence, weadditionally include temperatures as exogenous vari-ables in the analysis. It may be preferable to treat thetemperature of each month separately because the tem-perature in different months is likely to influence thedynamics differently. A considerable number of regres-sion analyses were performed before the 1970s to explorethe influence of the environmental factors of eachmonth on the abundance of C. suppressalis (Ishikura1950b; Fukaya and Nakatsuka 1956). However, most ofthese analyses seem unsuccessful, in part due to themultiplicity that arises with multiple testing. In orderto avoid such problems, we divide a year into only twoseasons: the previous November–April and May–Octo-ber, referred to as the ‘‘winter season’’ and the ‘‘summerseason’’, respectively. The summer season correspondsto that period during which rice is cultivated, while thewinter season corresponds to that period when insectslive outside paddy fields. We denote the mean temper-ature of the previous winter season (W) and summerseason (S) in year t by sWt and sSt, respectively. We usethe following model by including lags of up to 2 years:
Nt ¼ a0 þ a1Nt�1 þ a2Nt�2 þ f ðtÞ þ bWsWt þ bSsSt þ et;
et � Nð0; r2Þ; ð2Þ
where bW and bS are constants. f(t) is a smoothed quantityat year t. Two categories of smoothing procedures areusually available: (1) smoothing spline, and (2) local
regression. The former procedure assumes a situationwhere some penalty, such as repulsion force, arises whenwe bend the curve. The smoothness of the curve becomeslarge if the repulsion to bending is large, while thesmoothness becomes small if the repulsion force is small.The latter procedure, sometimes called locally weightedscatterplot smoothing (LOWESS) after Cleveland (1979)in the broad sense, assumes that the trend consists of locallinear components or polynomial components. Thesmoothness becomes large if the duration of a componentis long, while the smoothness becomes small if the dura-tion of a local component is short. As will be discussedlater, it is more reasonable to opt for the assumption ofLOWESS to remove the dynamics of environmentalcomponents from the time-series of populations.Then,weadopt LOWESS as f(t) in the estimation of the parametersof Eq. 2.Weuse ProcGAMof the statistical software SAS(SAS Institute 2001). The optimal smoothness is deter-mined by using generalized cross-validation (GCV) thatwas originally proposed by Craven and Wahba (1979). Atricube weight function is used as the kernel function inProc GAM. We might alternatively use a Poisson distri-bution with a logarithmic link in an arithmetic scale, in-stead of using a normal distribution in a logarithmic scale,by using the framework of GAM (Chambers and Hastie1991). Fewster et al. (2000) used a quasi-likelihood ap-proach using a Poisson distribution in applying GAM todata from the common bird census of the British Trust forOrnithology. However, we do not use a Poisson distri-bution in our analysis because the actual distribution willnot follow a Poisson distribution with a constant overdi-spersion as is assumed in the quasi-likelihood approach.This problem will be discussed in more detail later in thispaper.
The estimated parameters were quite different amongthe species (Table 1; thin curves in the upper panels ofFigs. 1, 2, and 3). The first-order lagged term was
Table 1 Estimated parameters in the additive model given by Eq. 2(where a, and b are constants). W Winter, S summer
Species Parameter Estimate SE P
Chilo suppressalis a0 0.247 1.291 0.850a1 0.630 0.133 <0.001a2 �0.199 0.140 0.164bW 0.124 0.059 0.043bS 0.016 0.064 0.806r2 0.074
Nephotettix cincticeps a0 0.647 2.560 0.802a1 0.007 0.118 0.955a2 0.055 0.121 0.654bW 0.148 0.111 0.190bS 0.140 0.119 0.245r2 0.265
Laodelphax striatellus a0 �1.814 1.927 0.352a1 0.351 0.111 0.003a2 �0.234 0.111 0.041bW �0.165 0.098 0.099bS 0.263 0.102 0.014r2 0.211
35

significant for C. suppressalis (P<0.001). Both the firstand second lagged terms were significant for L. striatellus(P=0.003 and 0.041, respectively). However, no lag termwas significant for N. cincticeps, indicating that thepopulation abundance of this species does not depend onpast dynamics. The influence of temperature is significantfor C. suppressalis and L. striatellus. The population ofC. suppressalis becomes larger with increasing wintertemperature (P=0.043), while that of L. striatellus be-comes larger with increasing summer temperature(P=0.014).
It should be noted that the smoothed curve achievedby using GAM changes greatly if we do not incorporateappropriate factors into the model. The bold curves inthe upper panels of Figs. 1, 2, and 3 indicate thesmoothed curves that were estimated under the follow-ing null model:
Nt ¼ a0 þ f ðtÞ þ et; et � Nð0; r2Þ: ð3ÞIn the analysis of C. suppressalis, the components thatshould be attributable to factors such as the laggedpopulation are automatically incorporated into thesmoothed curve f(t). Consequently, the f(t) curvebecomes very variable; the curve is very close to the ob-served quantity. A similar phenomenon occurs in theanalysis of L. striatellus. In contrast, in the analysis of
N. cincticeps, the smoothed curve that was estimatedfrom the null model was close to the curve that wasestimated from Eq. 2, because the null model is eventu-ally the same as that selected by GCV for this species.
Empirical smoothing
The smoothing procedure using GAM will be useful asindicated above, but it appears to have a shortcoming;we cannot correctly estimate the influence of non-nui-sance factors if there is a correlation between the time-series of non-nuisance factors and that of nuisancefactors. In our case, the change in temperature corre-lates with nuisance factors. Actually, the temperaturehas increased during the past 50 years (Fig. 4). Whenwe perform smoothing to remove the influence ofnuisance factors, the influence of a temperature rise issimultaneously partially removed. Hence, the influenceof global warming will be underestimated if we useGAM. Let Nt, sWt, sSt be the vectors containing thetime-series of Nt, sWt, and sSt, respectively. Let us de-note f(t) by a more precise expression, f(Nt). Then, ifwe smooth the factors other than Nt�1, Nt�2, sWt, andsSt, the relation is given by:
2
2.5
3
3.5
4
4.5
5
5.5
6
1950 1960 1970 1980 1990 2000
gol01
)sehctac fo rebmun launna(
-1.5
-1
-0.5
0
0.5
1
1.5
1950 1960 1970 1980 1990 2000
evruc dehtooms
morf noitaiveD
Year
Fig. 2 Population dynamics of Nephotettix cincticeps (logarithmicscale). For an explanation of the curves, see Fig. 1
0
0.5
1
1.5
2
2.5
3
3.5
4
1950 1960 1970 1980 1990 2000
gol01
)sehctac fo rebmun launna(
-1.5
-1
-0.5
0
0.5
1
1.5
1950 1960 1970 1980 1990 2000
evruc dehtooms
morf noitaiveD
Year
Fig. 3 Population dynamics of Laodelphax striatellus (logarithmicscale). For an explanation of the curves, see Fig. 1
36

Nt ¼a0 þ a1Nt�1 þ a2Nt�2
þ f ðNt � a1Nt�1 � a2Nt�2 � bWsWt � bSsStÞþ bWsWt þ bSsSt þ et:
ð4Þ
We can use the following relation because LOWESS isadditive:
f ðNt � a1Nt�1 � a2Nt�2 � bWsWt � bSsStÞ¼ f ðNtÞ � a1f ðNt�1Þ � a2f ðNt�2Þ � bWf ðsWtÞ� bSf ðsStÞ:
ð5Þ
Then, by substituting Eq. 5 into Eq. 4, we obtain thefollowing relation:
Nt � f Ntð Þ½ � ¼ a0 þ a1 Nt�1 � f Nt�1ð Þ½ �þ a2 Nt�2 � f Nt�2ð Þ½ �
þ bW sWt � f sWtð Þ½ � þ bS sSt � f sStð Þ½ � þ et:ð6Þ
Thus, we can estimate the parameters by applyingsmoothing to temperatures as well as logarithmic popu-lations by using the same function for smoothing. Let usdenote the difference between the observed andsmoothed quantities by Dt=Nt�f(Nt), TWt=sWt�f(sWt),and TSt=sSt�f(sSt). Then, we can express the aboveequation by a simpler form:
Dt ¼ a0 þ a1Dt�1 þ a2Dt�2 þ bWTWt þ bSTSt þ et: ð7Þ
It currently seems difficult to automatically estimatethe optimal function f of the form of Eq. 6. In order toempirically determine the function f, we should thereforediscuss which nuisance factors caused the populationdecline in these species during the past 50 years. Severalchanges in cultivation practices are said to be the causeof this decline although the exact reason is not known(Miyashita 1982). Two agricultural machines, the com-bine harvester and the rice planting machine, are knownto be related to the population decline of C. suppressalis.The larvae of C. suppressalis overwinter in the dried stemof rice plants (Kojima and Emura 1971). A combineharvester kills such larvae when it cuts the stems of riceplants. A rice-planting machine is used for youngerseedlings, which are not suitable for the development oflarvae (Yuno and Johraku 1975, 1976). Thus, the prev-alence of these machines reduces the survival rate of thelarvae of C. suppressalis. In addition, sprayingthe seedling plate used in mechanical planting reducedthe survival of larvae. Figure 5 shows that the use ofthese machines took 10 or 15 years to spread amongfarmers (Ministry of Agriculture Forestry and Fisheries1970–1990, 1970–1995). The use of industrial chemicalsalso seems to have taken several years to become pop-ular. For example, the change in how pesticides areapplied gradually changed the percentage of egg-parasitism of C. suppressalis over 10 years (Nozato andKiritani 1976); it was about 60% before 1955 but haddecreased to a new equilibrium level of about 20% byabout 1965. Thus, we can roughly anticipate that thedecline of insect pests will be the value generated by thesum of local declines that continued for about 10 years.Some components have large slope while the slope ofother components is small. The sum of these slopesgradually changes as it reflects the era. Therefore, we usea normal kernel with the SD of 5 years in applyingfirst-order LOWESS. We use SAS/INSIGHT for the
4
4.5
5
5.5
6
6.5
7
7.5
8
1950 1960 1970 1980 1990 2000
retniw ni erutarep
met naeM
18.5
19
19.5
20
20.5
21
21.5
22
1950 1960 1970 1980 1990 2000
rem
mus ni erutarepmet nae
M
Year
Fig. 4 Change in temperature (�C) during the past 50 years atMito, Japan. Dotted curve LOWESS that was calculated by anormal kernel with a SD of 5 years. Upper panel Mean temperaturefrom the previous November to April. Lower panel Meantemperature from May to October
1970 1975 1980 1985 1990 19950
2
4
6
8
10
noillim ni stinu fo reb
muN
Year
Combine harvester
Rice-planting machine
Fig. 5 Increase in the use of agricultural machines in IbarakiPrefecture, Japan, which is a potential cause of the decline ofC. suppressalis
37
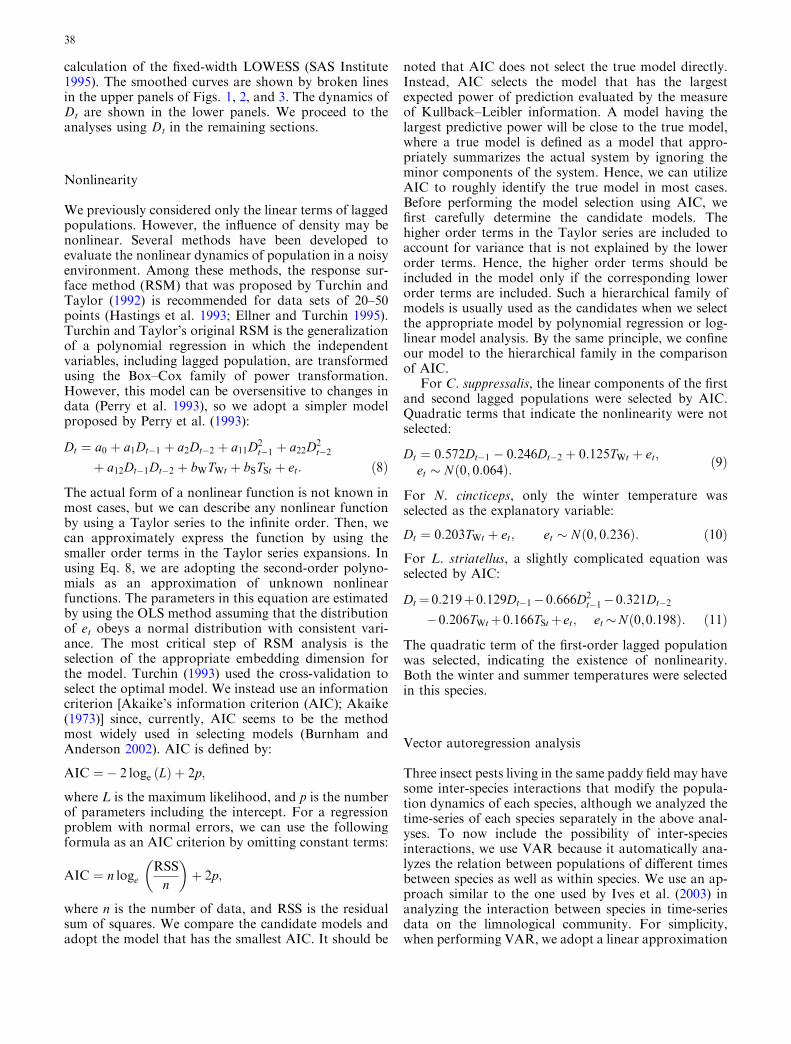
calculation of the fixed-width LOWESS (SAS Institute1995). The smoothed curves are shown by broken linesin the upper panels of Figs. 1, 2, and 3. The dynamics ofDt are shown in the lower panels. We proceed to theanalyses using Dt in the remaining sections.
Nonlinearity
We previously considered only the linear terms of laggedpopulations. However, the influence of density may benonlinear. Several methods have been developed toevaluate the nonlinear dynamics of population in a noisyenvironment. Among these methods, the response sur-face method (RSM) that was proposed by Turchin andTaylor (1992) is recommended for data sets of 20–50points (Hastings et al. 1993; Ellner and Turchin 1995).Turchin and Taylor’s original RSM is the generalizationof a polynomial regression in which the independentvariables, including lagged population, are transformedusing the Box–Cox family of power transformation.However, this model can be oversensitive to changes indata (Perry et al. 1993), so we adopt a simpler modelproposed by Perry et al. (1993):
Dt ¼ a0 þ a1Dt�1 þ a2Dt�2 þ a11D2t�1 þ a22D2
t�2þ a12Dt�1Dt�2 þ bWTWt þ bSTSt þ et: ð8Þ
The actual form of a nonlinear function is not known inmost cases, but we can describe any nonlinear functionby using a Taylor series to the infinite order. Then, wecan approximately express the function by using thesmaller order terms in the Taylor series expansions. Inusing Eq. 8, we are adopting the second-order polyno-mials as an approximation of unknown nonlinearfunctions. The parameters in this equation are estimatedby using the OLS method assuming that the distributionof et obeys a normal distribution with consistent vari-ance. The most critical step of RSM analysis is theselection of the appropriate embedding dimension forthe model. Turchin (1993) used the cross-validation toselect the optimal model. We instead use an informationcriterion [Akaike’s information criterion (AIC); Akaike(1973)] since, currently, AIC seems to be the methodmost widely used in selecting models (Burnham andAnderson 2002). AIC is defined by:
AIC ¼� 2 loge ðLÞ þ 2p;
where L is the maximum likelihood, and p is the numberof parameters including the intercept. For a regressionproblem with normal errors, we can use the followingformula as an AIC criterion by omitting constant terms:
AIC ¼ n logeRSS
n
� �þ 2p;
where n is the number of data, and RSS is the residualsum of squares. We compare the candidate models andadopt the model that has the smallest AIC. It should be
noted that AIC does not select the true model directly.Instead, AIC selects the model that has the largestexpected power of prediction evaluated by the measureof Kullback–Leibler information. A model having thelargest predictive power will be close to the true model,where a true model is defined as a model that appro-priately summarizes the actual system by ignoring theminor components of the system. Hence, we can utilizeAIC to roughly identify the true model in most cases.Before performing the model selection using AIC, wefirst carefully determine the candidate models. Thehigher order terms in the Taylor series are included toaccount for variance that is not explained by the lowerorder terms. Hence, the higher order terms should beincluded in the model only if the corresponding lowerorder terms are included. Such a hierarchical family ofmodels is usually used as the candidates when we selectthe appropriate model by polynomial regression or log-linear model analysis. By the same principle, we confineour model to the hierarchical family in the comparisonof AIC.
For C. suppressalis, the linear components of the firstand second lagged populations were selected by AIC.Quadratic terms that indicate the nonlinearity were notselected:
Dt ¼ 0:572Dt�1 � 0:246Dt�2 þ 0:125TWt þ et;et � Nð0; 0:064Þ: ð9Þ
For N. cincticeps, only the winter temperature wasselected as the explanatory variable:
Dt ¼ 0:203TWt þ et; et � Nð0; 0:236Þ: ð10ÞFor L. striatellus, a slightly complicated equation wasselected by AIC:
Dt¼ 0:219þ0:129Dt�1�0:666D2t�1�0:321Dt�2
�0:206TWtþ0:166TStþ et; et�Nð0;0:198Þ: ð11Þ
The quadratic term of the first-order lagged populationwas selected, indicating the existence of nonlinearity.Both the winter and summer temperatures were selectedin this species.
Vector autoregression analysis
Three insect pests living in the same paddy field may havesome inter-species interactions that modify the popula-tion dynamics of each species, although we analyzed thetime-series of each species separately in the above anal-yses. To now include the possibility of inter-speciesinteractions, we use VAR because it automatically ana-lyzes the relation between populations of different timesbetween species as well as within species. We use an ap-proach similar to the one used by Ives et al. (2003) inanalyzing the interaction between species in time-seriesdata on the limnological community. For simplicity,when performing VAR, we adopt a linear approximation
38

of the influence of lagged populations as well as otherexogenous factors. We use the subscripts C, N, and L, toindicate the variable for C. suppressalis, N. cincticeps,and L. striatellus, respectively. Then the vector autore-gression model is expressed by:
DCt ¼ aC þ aCC1DCt�1 þ aCC2DCt�2 þ aCN1DNt�1
þ aCN2DNt�2 þ aCL1DLt�1 þ aCL2DLt�2
þ bCWTWt þ bCSTSt þ eCt; ð12ÞDNt ¼ aN þ aNC1DCt�1 þ aNC2DCt�2 þ aNN1DNt�1
þ aNN2DNt�2 þ aNL1DLt�1 þ aNL2DLt�2
þ bNWTWt þ bNSTSt þ eNt; ð13ÞDLt ¼ aL þ aLC1DCt�1 þ aLC2DCt�2 þ aLN1DNt�1
þ aLN2DNt�2 þ aLL1DLt�1 þ aLL2DLt�2
þ bLWTWt þ bLSTSt þ eLt: ð14Þ
In Eq. 12, the parameters aC, aCC1, aCC2, aCN1, aCN2,aCL1, aCL2, bCW, and bCS are constants, eCt is a normalerror. The parameters in Eqs. 13 and 14 are defined in asimilar manner. We use Stata for the estimation (Stata2003).
VAR indicates that the influence of the first-orderlagged terms was statistically significant within speciesfor C. suppressalis and L. striatellus (aCC1 and aLL1 inTable 2 ). The results of these tests, however, indicatetrivial phenomena such as the population at time t tendsto be large if the population at time t�1 is large. Thefirst-order lagged terms of C. suppressalis and L. stria-tellus have a marginally significant influence onN. cincticeps (P=0.012 and 0.042, respectively). Theinfluence of temperature is significant for C. suppressalisand L. striatellus. The population of C. suppressalis in-creases with increasing winter temperatures (P=0.019).The population of L. striatellus increases with increasingsummer temperatures (P=0.003), but decreases withincreasing winter temperatures (P=0.041).
The problem of measurement error
We define ‘‘measurement error’’ as the component thatinfluences the observation without influencing theobservation of the subsequent year. The influence ofmeasurement errors was ignored in the above analyses.Although our definition of measurement error is differ-ent from common usage, we adopt this term because wecan use the same approach, the state-space model that isused for removing the measurement error in commonusage. State-space modelling has been used recently inecological literature when analyzing populationdynamics (Zeng et al. 1998; deValpine and Hastings2002; Calder et al. 2003; Williams et al. 2003; Clark andBjørnstad. 2004; Viljugrein et al. 2005). We can use theKalman filter algorithm if we use a linear model and ifthe errors obey a normal distribution (Harvey 1989;Durbin and Koopman 2001; Brockwell and Davis 2002).Numerical integration or simulation will be required if
we incorporate nonlinear terms into the equation(Kitagawa 1987; Durbin and Koopman 2001; deValpineand Hastings 2002). Hence, we consider the linear casewhere the terms for Dt
2 are omitted for convenience. Theabove response surface analyses imply that the linearapproximations will be reasonable for C. suppressalisand N. cincticeps. When we assume a distribution otherthan a normal distribution, such as a Poisson distribu-tion in an arithmetic scale, the calculation also becomescomplicated (Durbin and Koopman 2001). Bayesianestimation using the Markov chain Monte Carlo algo-rithm is especially useful in such cases (Shephard andPitt 1997; Calder et al. 2003; Saitoh et al. 2003; Stensethet al. 2003; Clark and Bjørnstad. 2004); however, theassumption of Poisson distribution becomes less likely ifthe mean fluctuates spatially at random due to somenatural or artificial reasons. It seems preferable to usesome overdispersed Poisson distributions such as anegative binomial distribution in an arithmetic scale.Actually, the spatial distribution of most populations inthe field does not obey a Poisson distribution; the mean-variance relation is instead described by Taylor’s powerlaw where the exponent is relatively closer to 2 than 1 asexpected by a Poisson distribution (Taylor et al. 1978,1979; Yamamura 2000). The quasi-likelihood approachis not appropriate because the dispersion parameter willnot be constant. The exponent close to 2 will be partlygenerated by the multiplicative nature of population
Table 2 Estimated parameters in vector autoregression defined byEqs. 12, 13, and 14
Species Parameter Estimate SE P
C. suppressalis aC 0.009 0.036 0.794aCC1 0.502 0.152 0.001aCC2 �0.272 0.160 0.089aCN1 0.115 0.090 0.202aCN2 0.002 0.089 0.982aCL1 �0.005 0.079 0.954aCL2 �0.073 0.085 0.389bCW 0.136 0.058 0.019bCS �0.017 0.064 0.788
rC2 0.071
N. cincticeps aN �0.012 0.061 0.848aNC1 0.648 0.259 0.012aNC2 �0.028 0.274 0.918aNN1 �0.025 0.154 0.869aNN2 �0.121 0.151 0.426aNL1 0.274 0.135 0.042aNL2 �0.129 0.146 0.378bNW 0.180 0.099 0.067bNS 0.108 0.109 0.324
rN2 0.209
L. striatellus aL 0.030 0.064 0.641aLC1 0.305 0.271 0.260aLC2 �0.384 0.286 0.179aLN1 �0.198 0.160 0.216aLN2 0.283 0.158 0.073aLL1 0.353 0.141 0.012aLL2 �0.041 0.152 0.787bLW �0.210 0.103 0.041bLS 0.339 0.114 0.003
rL2 0.227
39

dynamics. In such situations, as discussed above, it isreasonable to assume a normal distribution with aconstant variance for the error of Dt as an approxima-tion. We use normal errors for this reason.
Let lCt, lNt, and lLt be the ‘‘true population’’ at yeart of C. suppressalis, N. cincticeps, and L. striatellus,respectively. We use the term true population in thesense that it influences the population of the followingyear. Then, if we ignore the multicollinearity, the fullstate-space model for C. suppressalis is expressed by aform as follows:
lCt ¼ aCþaCC1lCt�1þaCC2lCt�2þaCN1lNt�1
þaCN2lNt�2þaCL1lLt�1 þaCL2lLt�2
þbClwswtþbClssstþ eClt; eClt�Nð0;r2ClÞ; ð15Þ
DCt ¼ lCt þ aCNlNt þ aCLlLt þ bCDwswt
þ bCDssst þ eCDt; eCDt � Nð0; r2CDÞ; ð16Þ
where eClt is a process error, and eCDt is a signal error.Equations 15 and 16 are a state equation and anobservation equation (signal equation), respectively. Thenotation of parameters is similar to that of Eq. 12. Weonly show the equations for C. suppressalis for conve-nience, but the corresponding equations are defined forthe other two species in a similar manner. The factor oftemperature is included in both the state equation andobservation equation, because it may influence either orboth the true population and the observation. The termsfor lNt and lLt are included in Eq. 16, because the ob-served number of individuals may be influenced by thetrue population of another species of the same year. Weuse EViews for the estimation by Kalman filer (Quan-titative Micro Software 2004). The optimal equationthat is suitable for prediction is selected by minimizingAIC. Non-zero covariance is allowed among eClt, eNlt,and eLlt, and among eCDt, eNDt, and eLDt. However, inthis application, no covariance was selected by AIC.
For C. suppressalis, the following equation was se-lected:
lCt ¼ 0:504lCt�1 � 0:276lCt�2 þ eClt;eClt � Nð0; 0:059Þ; ð17Þ
DCt ¼ lCtþ0:087TWt: ð18ÞThat the term eCDt was not adopted by AIC indicatesthat the random component of the measurement error isrelatively small. The observed number of individualsincreases with increasing winter temperature, while thetrue population is not influenced by the temperature.
For the dynamics of N. cincticeps, we obtain:
lNt ¼ eNlt; eNlt � Nð0; 0:202Þ ð19ÞDNt ¼ lNt þ 0:699lCtþ0:171TWt; ð20Þor
lNt ¼ 0; ð21ÞDNt ¼ lNt þ 0:699lCtþ0:171TWt þ eNDt;
eNDt � Nð0; 0:202Þ: ð22Þ
These two models have the same log likelihood and AIC.The true population at year t�1 does not influence thepopulation at year t. Hence, there is logically no dis-crimination between the measurement error and error ofthe true population. The influence of temperature issimilar to that in C. suppressalis; the winter temperatureinfluences the observed number of individuals but doesnot influence the true population. The above equationsalso indicate that the true population of C. suppressalispositively influences the observed number of N. cincti-ceps but does not influence the true population ofN. cincticeps.
For the dynamics of L. striatellus, we obtain:
lLt ¼ 0:430lLt�1 � 0:246lLt�2 þ eLlt;eLlt � Nð0; 0:210Þ; ð23Þ
DLt ¼ lLt � 0:149TWt þ 0:273TSt: ð24ÞThe term eLDt was not adopted by AIC, indicating thatthe random component of measurement error is rela-tively small, while both winter temperature and summertemperature were adopted in the observation equation.
Both combinations of (aCC1 and aCC2) for C. sup-pressalis and (aLL1 and aLL2) for L. striatellus lie withinthe stable region, yielding complex roots that causedamping oscillations [see Fig. 2.2 in Harvey (1981), orthe equivalent Fig. 2.5 in Royama (1992)]. Such adamping oscillation is observable also intuitively in thelower panel of Fig. 1 for C. suppressalis. In contrast, thepopulation dynamics of N. cincticeps are non-cyclicallystable: the population simply fluctuates around its meandensity without any oscillation.
Abundance of insect pests under global warming
We next utilize the above equations to predict the yieldloss that will result from the increase in pest populationsunder global warming. The outcomes of global warminggreatly depend upon the future behavior of humanbeings. Hence, we should assume a clear scenario offuture human action before calculating the prediction.SRES scenarios of IPCC are divided into four families,A1, A2, B1, and B2, each of which contains qualitativestorylines (IPCC 2000). The A1 family describes a futureworld of very rapid economic growth, a global popula-tion that peaks in mid-century and declines thereafter,and the rapid introduction of new and more efficienttechnologies. The A2 family describes a very heteroge-neous world. The underlying theme is self-reliance andpreservation of local identities. Fertility patterns acrossregions converge very slowly, which results in a contin-uously increasing global population unlike in the A1family. The B1 family resembles the A1 family but theconditions seen with the latter are accompanied by rapidchanges in economic structures toward the introductionof clean and resource-efficient technologies. Theiremphasis is on ‘‘global solutions’’ to economic, social,and environmental sustainability. The B2 family
40

resembles the A2 family but describes a world in whichthe emphasis is on ‘‘local solutions’’ for the sustain-ability of economic, social, and environmental systems.
The Meteorological Research Institute (MRI) con-structed GCM by adopting the A2 family scenario ofthe SRES, that is, heterogeneous population growthwithout sustainability. Their GCM called MRI-CGCM2 has a horizontal resolution of 280 km with 30atmospheric layers (Yukimoto et al. 2001; Yukimotoand Noda 2002). The horizontal resolution is toosparse for actual use. Then, MRI used a regional cli-mate model (RCM) called RCM-20 km having a res-olution of 20 km and nested it into MRI-CGCM2 over2,500·2,500 km around Japan (Kurihara 2004). Thepredicted climatic data for the 20-year average weregiven for the present and for two future periods: 1981–2000, 2031–2050, and 2081–2100. Data includedmeasured and predicted temperature, rainfall, windvelocities, and atmospheric pressure. However, theresolution of 20 km adopted by this RCM is differentfrom the standard mesh grids of Japan, which causesproblems when we use the predicted climatic dataalong with existing mesh data. Then, Nishimori et al.(2005) converted the predicted climatic data into stan-dard second-order mesh data by using the same manneras that of Yokozawa et al. (2003). First, the baselineclimatic data were calculated with the average from 1981to 2000 at a resolution of 7.5¢ in longitude and 5¢ inlatitude (approximately 10·10 km) by re-sampling thethird-order mesh climatic data (approximately 1·1 kmresolution) calculated from automated meteorologicaldata acquisition system (AMeDAS) data, whereAMeDAS was constructed by the MeteorologicalAgency of Japan. For predicting the average climaticdata from 2031 to 2050, the climatic difference betweenthe prediction for 1981–2000 and 2031–2050 was calcu-lated for each grid point of RCM. For each second-ordermesh, the four grid points of RCM that were nearest thecenter of the second-order mesh were selected. Theclimatic differences at these four points were averaged byusing a weight that is inversely proportional to thedistance. The average climatic data from 2031 to 2050were then calculated by adding the average difference tothe baseline climatic data. The average climatic datafrom 2081 to 2100 were calculated by a similar manner.The predicted change in the temperature is listed inTable 3. We use only the prediction for 2031–2050 in thisarticle as an illustration.
We predict the average annual trap catches ofC. suppressalis, N. cincticeps, and L. striatellus from2031 to 2050 by using Eqs. 18, 20, and 24, respectively.We ignore the unknown parameters, lCt, lNt, and lLt
that appear in these equations. Hence, we only predictthe abundance relative to that expected in a normal year.The temperature rise may also influence the efficiency oftraps. For the dynamics of C. suppressalis andN. cincticeps, however, summer temperature, that is, thetemperature during the period of light-trap catches, isnot included in Eqs. 18 and 20, indicating that the
influence of temperature on the trap efficiency is small.Thus, we can consider that Eqs. 18 and 20 indicate thedynamics of the number of individuals that actuallyexist. Figure 6 shows that the population of C. sup-pressalis will increase by a ratio of from 1.6 to 1.8 inmost areas in Japan. Figure 7 shows that the populationof N. cincticeps will increase by a ratio of from 3 to 4. Itis more complicated to determine the increase ratio inL. striatellus since it is influenced by both winter andsummer temperatures according to Eq. 24. The ratio islarger for the seaboard of the Sea of Japan (Fig. 8).
We should note that the extrapolation that was usedin calculating the abundance relies upon the assumptionthat the future climate change will not modify thestructure of the system. Davis et al. (1995, 1998a, 1998b)reported examples which show that the temperature risemay modify the essential interaction between species.Thus, we should carefully interpret the results given inFigs. 6, 7, and 8.
Prediction of yield loss caused by C. suppressalis
C. suppressalis injures the plant directly while the othertwo species, N. cincticeps and L. striatellus, cause yieldloss by transmitting viral diseases. The occurrence ofthese diseases is determined by a complex interactionamong three biological entities: the rice plant, the virus,and the insect. The sensitivity of rice plants to RSVinfection is restricted to the young stages (Shinkai 1962).Hence, the synchronization between the emergence ofadult L. striatellus and the developmental stage of riceplants susceptible to the virus is one of the major causesfor the disease’s prevalence. Yamamura and Yokozawa(2002) predicted the influence of global warming on theprevalence of RSV by calculating the degree of syn-chronization between the emergence of adult L. stria-tellus and the date of transplantation. In contrast, theyield loss caused by C. suppressalis is straightforward.Hence, we focus on C. suppressalis in predicting the yieldloss in this article.
We first examine the relation between the proportionof injured stems in a plant and the number of larvae in theplant. Kono and Ishikawa (1955) performed experiments
Table 3 Future mean temperaturea in Japanb under global warm-ing predicted by the Meteorological Research Institute’s globalclimate model (MRI-CGCM2)
Period Mean wintertemperature (�C)c
Mean summertemperature (�C)d
Mean annualtemperature (�C)
1981–2000 3.55 17.92 10.732031–2050 5.97 19.71 12.842081–2100 6.66 20.30 13.48
aCurrent temperature calculated from automated meteorologicaldata acquisition system is also shown for comparisonbData for Nansei-Shoto are not usedcWinter temperature is the average from November to AprildSummer temperature is the average from May to October
41

where 300 or 1,000 eggs were placed regularly in anexperimental wire mesh cage that contained 10·6 riceplants (1.82·1.82 m). They reported the proportion ofinjured stems and the total number of larvae in 60 plants.We use these data to express the relation between thenumber of larvae in a plant,which is denotedbym, and theproportion of injured stems in the plant, which is denotedby q, as an approximation. This is a rough approximationas the larvae are not distributed completely uniformlyover the 60 plants. The number of larvae in a plant istreated as continuous variable although it is actually a
discrete variable. Then, we obtained the following esti-mate of the linear relation:
loge½� logeð1� qÞ� ¼ �2:36þ 2:14 log10ðmÞ; ð25Þwhere the parameters were estimated by linear regression(upper panel in Fig. 9). The SE of the slope is 0.08. Thiskind of linear relation, which is called the Kono–Suginorelation (1958), has been used frequently to estimatepopulation density from binomial sampling (Gerrardand Chiang 1970; Nachman 1984; Kuno 1986; Ekbom1987; Nyrop et al. 1989; Binns and Bostanian 1990;Schaalje et al. 1991; Feng and Nowierski 1992; Roux etal. 1992; Feng et al. 1993). The transformation in the left-hand side of Eq. 25 is called complementary log-logtransformation in statistical literature related to gener-alized linear models or proportional hazard models.
Several authors have examined the relation betweenthe proportion of stems injured by larvae of C. suppres-salis and the yield loss (Kono and Ishikawa 1955;Okamoto and Sasaki 1957; Takagi et al. 1958; Nitta andNaruse 1985). We use the data of Takagi et al. (1958) inestimating this relation because their report seems themost reliable. Because one cannot directly compare theyields of various fields as yield varies considerablydepending upon the variety, the cultivation conditions,and the fertility of the soil, they adopted the followingstandardization. They first classified the sample plantsinto strata by varieties and farmers. For each stratum,sample plants were classified into ten classes by the per-centage of the injured stems at 10% intervals. Theaverage yield per plant in each class was examined ineach stratum. Then the yield index for each class wascalculated by the following formula: 100·(average yield
R 4.1 <
4.1 R 6.1<
6.1 R 8.1<
8.1 R
silasserppus .C
≤
≤
≤
Fig. 6 Estimated increase in the abundance of C. suppressalis underglobal warming. R Predicted annual number of individuals caughtby a light-trap in the period from 2031 to 2050 divided by thatnumber caught in the period from 1981 to 2000
R 2<
2 R 3<
3 R 4<
4 R
specitcnic .N
≤≤
≤
Fig. 7 Estimated increase in the abundance of N. cincticeps underglobal warming. R Predicted annual number of individuals caughtby a light-trap in the period from 2031 to 2050 divided by thatnumber caught in the period from 1981 to 2000
R 2.1<
2.1 R 4.1
4.1 R 6.1
6.1 R
sulletairts .L
≤≤
≤
Fig. 8 Estimated increase in the abundance of L. striatellus underglobal warming. R Predicted annual number of individuals caughtby a light-trap in the period from 2031 to 2050 divided by thatnumber caught in the period from 1981 to 2000
42

in a class)/(average yield in the lowest class where thepercentage of injured stems is <10%). The yield indexwas then averaged over strata for each class of injuredstems. We define the proportion of yield loss in a plant,denoted by w, as 1�(yield index)/100. Then, we found thefollowing linear relation (see lower panel in Fig. 9):
log10ðwÞ ¼ �0:75þ 0:448 loge½� logeð1� qÞ�; ð26Þwhere the parameters were estimated by the linearregression. The SE of the slope is 0.027. We obtain thefollowing relation by substituting Eq. 25 into Eq. 26:
w ¼ 0:0155m0:957: ð27Þ
Knowledge about the spatial distribution of larvaeper plant is required to calculate the average proportionof yield loss in a field. As previously stated, we aretreating the number of discrete individuals as a contin-uous variable for convenience. Hence, for the simplestapproximation, we use an exponential distribution,which is a continuous distribution with only oneparameter. The probability that a plant contains m lar-vae in a field where the average number of larvae perplant is M is given by the probability density functiong(m),
gðmÞ ¼ 1
Mexp � m
M
� �: ð28Þ
The average yield loss in a field, which is denoted by�w; is given by integrating the multiplication of Eqs. 27and 28.
�w ¼Z 1
m¼00:0155m0:957gðmÞdm ¼ 0:0152M0:957: ð29Þ
The expected number of light-trap catches is determinedby the multiplication of the number of insects and theprobability that an insect is caught by the trap. Thesecond component that is determined by the trapefficiency will be also influenced by the temperature. ForC. suppressalis, however, only the winter temperatureinfluences the light-trap catches of the summer season;the temperature during the period of the light-trap cat-ches does not influence the number of light-trap catches.Hence, we can assume that the influence of temperatureon the trap efficiency is small. Then, let us assume thatthe annual number of light-trap catches, which is givenby (smoothed component)·10Dt, is approximately pro-portional to the number of larvae in the field (M). Then,we have a relation:
�w ¼ c1 � 100:957Dt; ð30Þwhere c1 is a constant. By substituting Eq. 18 into Eq.30, we obtain
�w ¼ c2 � 100:083TWt ; ð31Þwhere c2 is a constant, for a given lCt. We can calculatethe average yield loss relative to that expected in anormal year by substituting the predicted temperatureinto Eq. 31. Figure 10 indicates that the yield loss in theperiod from 2031 to 2050 becomes larger than that in theperiod from 1980 to 2000 by a factor of 1.6 or 1.8 inmost areas of Japan.
The actual distribution of C. suppressalis will be morecomplicated than an exponential distribution. The larvaldistribution is described by a negative binomial distri-bution (Kono et al. 1952) as well as the distribution ofmany other organisms. The parameter 1/k of the nega-tive binomial distribution, usually used as the index ofaggregation, changes depending on the developmentalstage (Kanno 1962; Iwao 1968) and the density (Konoet al. 1952). In applying Eq. 28, we are assuming that the1/k lies around 1, as for the case reported by Kono et al.(1952). Some biases might be thus suspected in severalsituations.
Results and discussion
The analyses conducted by using the state-space modelindicated that the ‘‘observed population’’ is influencedby the temperature (Eqs. 18, 20, 24), whereas the ‘‘truepopulation’’ is regulated in a species-specific manner,
-3.5
-3
-2.5
-2
-1.5
-1
-0.5
-0.4 -0.2 0 0.2 0.4 0.6 0.8 1
gole
gol-(e
-1(q
))
log10(number of larvae in a plant)
-2
-1.5
-1
-0.5
0
-3 -2 -1 0 1 2
gol01
)tnalp a f o ssol dl eiy fo noitroporp(
loge(-loge(1-q))
Fig. 9 Upper panel Kono–Sugino relation between the density oflarvaeofC. suppressalisandtheproportionof injured stems (q).LowerpanelLinear relation between the logarithmic proportion of yield lossand q that was transformed by a complementary log–log link
43

which is rather independent of temperature (Eqs. 17, 19,23). These equations are typically expressed in thefollowing form:
lt ¼ hðlt�1Þ þ elt; ð32ÞDt ¼ lt þ kðTtÞ; ð33Þwhere h is a function of the vector of past density lt�1, kis a function of the vector of environmental variable Tt.The fluctuation in environmental factors does notinfluence Eq. 32. Thus, it is indicated that the populationdynamics may be a result of multi-level regulation. Thedeviation in population, which is caused by the fluctu-ation in environmental factors, is regulated immediately.The regulated populations are further regulated by thefunction h(lt�1).
The two viewpoints in the classic debate about reg-ulation may correspond to the extreme case of Eqs. 32and 33. If the function k is close to zero, the system ismost appropriately described according to Nicholson(1954); the population is regulated in a density-depen-dent manner without suffering the explicit influence ofenvironment. In contrast, if the function h is close tozero, the system is most appropriately describedaccording to Andrewartha and Birch (1954); the popu-lation is determined by the environmental factor withoutthe influence of apparent density-dependent mechanismsas they defined them. The difference in the viewpoints ofNicholson (1954) and Andrewartha and Birch (1954)may have arisen from the difference in the material theystudied. Nicholson (1954) used an experimental popu-lation, e.g blowflies, where the function k may be nearzero; such a system may be called a ‘‘Nicholson typesystem’’. Andrewartha and Birch (1954) used thrips infields where the function h may be near zero; this can be
called the ‘‘Andrewartha–Birch type system’’. Thedynamics of thrips will be expressed by a form similar tothat found for N. cincticeps (Eqs. 19, 20). The type ofsystem may partly depend on the size or generation timeof the organisms. For very small organisms such asfungi, the system may be described as an Andrewartha–Birch type system in most cases. For example, theprevalence of the fungal rice blast disease in a year ispredicted from information on climatic conditionswithout considering the disease prevalence in the previ-ous year. BLASTAM, a system used to predict out-breaks of rice blast disease, only uses weather data fromAMeDAS, including data on precipitation, temperature,duration of sunshine, wind force and hourly winddirection (Hayashi and Koshimizu 1988). The BLA-STAM system has been used recently in several prefec-tures in Japan, and its efficacy has been well recognized.In contrast, population dynamics of large mammalsseem to be best described as a Nicholson type system.For example, in describing the population dynamics ofsika deer, Matsuda et al. (1998, 2002) constructeddemographic models including exogenous hunting fac-tors. Insect population may lie in the intermediate po-sition in the continuum from fungi to large mammals;accordingly, both Nicholson type and Andrewartha–Birch type systems arise in the population dynamics ofinsects, depending on the situation. Such a continuumlooks like a classic argument of Pianka (1978) concern-ing r- and K-strategies. The continuum of r–K strategiesis rather ambiguous, but our continuum is clearly de-fined by Eqs. 32 and 33. Smaller organisms will begenerally more sensitive to the environmental change,because they have usually a larger surface–volume ratio.A large surface–volume ratio may enable a largeintrinsic rate of increase under their optimal environ-ment. Such a large intrinsic rate of increase will beusually yielded through a shorter generation time ratherthan a larger number of offspring per individual.
Global warming has seemingly similar influences onthe abundance of C. suppressalis and N. cincticeps(Figs. 6, 7). An increase in winter temperature (definedby the average temperature from the previous Novemberto April) enhances the abundance of both species.However, the increment is much larger for N. cincticepsthan for C. suppressalis as indicated by the difference inscale between Figs. 6 and 7. Such a difference may berelated to the difference in the number of generations peryear. N. cincticeps has twice the number of generations,which may cause a sensitive response to the change intemperature. The prediction for L. striatellus (Fig. 8) isvery different from that for C. suppressalis andN. cincticeps. Equation 24 predicts that the higher win-ter temperature has a negative influence on the abun-dance of L. striatellus. However, the current predictionfor L. striatellus does not seem that reliable. Thedynamics of Dt shown in the lower panel in Fig. 3appear somewhat strange for the 20-year period from1970 to 1990. The Dt is extremely small for 6 years whilein the remaining 14 years, the Dt is always larger than 0.
R 4.1 <
4.1 R 6.1 <
6.1 R 8.1 <
8.1 R
yb ssol dleiY silasserppus .C
≤
≤
≤
Fig. 10 Estimated increase in the yield loss of rice caused byC. suppressalis under global warming. R Predicted annual yield lossin the period from 2031 to 2050 divided by that loss in the periodfrom 1981 to 2000
44

It seems that the smoothing procedure using a normalkernel could not successfully remove the influence ofnuisance factors for this species. The reliability of theprediction would be enhanced if we could identifythe nuisance factor and remove the influence beforeperforming analysis.
No nonlinear component was selected by AIC inthe response surface analysis for C. suppressalis andN. cincticeps (Eqs. 9, 10). A nonlinear component wasselected for L. striatellus (Eq. 11) but the results for thisspecies may not be reliable, as previously stated.Although a nonlinear relation is widely observed in thelaboratory experiments of single species (e.g. Utida1941), it seems to be rare in field populations except forthose in Arctic regions (Ellner and Turchin 1995). Ararity of nonlinear relations in the field seems partly dueto the spatial heterogeneity of density. Let us consider asituation where the density at time t is determined by thedensity at time t�1 without error. Let kit be the localdensity on an arithmetic scale at the ith spatial position.Let g(kit) be the function expressing the local density-dependent relation, that is kit=g(kit�1). Then, by using aTaylor series, we can approximately express the spatialmean density at time t by:
EðktÞ � gðEðkt�1ÞÞ þg0000ðEðkt�1ÞÞ
2V ðkt�1Þ; ð34Þ
where the double prime (¢¢) indicates the secondderivative; E and V indicate the mean and variance,respectively (Yamamura 1989, 1998). The right handside of Eq. 34 approaches a linear form with increasingspatial heterogeneity V(kit�1) under several forms of g.The systems tend to enter a stable region simulta-neously. Such a linearization in an arithmetic scale isclosely related to the classic concept of the ‘‘spreadingof risks’’ that was first formulated by Den Boer (1968).He wrote that ‘‘the chances of surviving and repro-ducing must be different in these different places. Thismeans for the population as a whole that the effect ofextreme conditions in one place will be damped tosome degree by the effect of less extreme conditions inothers. In other words: the risk of wide fluctuation inanimal numbers is spread unequally over a number ofsubpopulations living in different micro-environments.’’Various simulations have been conducted to demon-strate that the spreading of risks can contribute tostabilization (Reddingius and Den Boer 1970; Reddin-gius 1971; Den Boer and Reddingius 1996). However,Eq. 34 concisely indicates the condition under whichstabilization occurs by spreading of risks; the stabil-ization effect occurs if the function g is sufficientlyconvex and if there is sufficient heterogeneity V(kit�1).In this respect, the ‘‘linearization effect’’ and thespreading of risks are almost the same thing. In anecosystem where the species richness of plants is high,the spatial heterogeneity for herbivores or predatorsinevitably becomes high. The population dynamics insuch systems are inevitably stabilized because of a lin-earization effect, i.e. the spreading of risks. It seems of
critical importance to understand that the diversity–stability paradigm that was posed by Elton (1958) canbe explained by such trivial logic without assuming anyspecial mechanism (Yamamura 2002).
Acknowledgements We thank two anonymous referees for theircomments that improved the manuscript.
References
Akaike H (1973) Information theory and an extension of themaximum likelihood principle. In: Petrov BN, Csadki F (eds)Second international symposium on information theory. Aka-demiai Kiado, Budapest, pp 267–281
Alyokhin A, Drummond FA, Sewell G (2005) Density-dependentregulation in populations of potato-colonizing aphids. PopulEcol 47:257–266
Andrewartha HG, Birch LC (1954) The distribution and abun-dance of animals. Chicago Press, Chicago, IL
Berryman AA (2004) Limiting factors and population regulation.Oikos 105:667–670
Berryman AA, Arce ML, Hawkins BA (2002) Population regula-tion, emergent properties, and a requiem for density depen-dence. Oikos 99:600–606
Binns MR, Bostanian NJ (1990) Robustness in empirically basedbinomial decision rules for integrated pest management. J EconEntomol 83:420–427
Bjørnstad ON, Falck W, Stenseth NC (1995) A geographic gradi-ent in small rodent density fluctuations: a statistical modellingapproach. P Roy Soc B-Biol Sci 262:127–133
Box GEP, Cox DR (1964) An analysis of transformations. J RoyStat Soc B 26:211–252
Box GEP, Jenkins GM (1970) Time series analysis: forecasting andcontrol. Holden-Day, CA
Brockwell PJ, Davis RA (2002) Introduction to time series andforecasting, 2nd edn. Springer, Berlin Heidelberg New York
Bulmer MG (1975) The statistical analysis of density dependence.Biometrics 31:901–911
Burnham KP, Anderson DR (2002) Model selection and multi-model inference: a practical information theoretic approach,2nd edn. Springer, Berlin Heidelberg New York
Calder C, Lavine M, Muller P, Clark JS (2003) Incorporatingmultiple sources of stochasticity into dynamic populationmodels. Ecology 84:1395–1402
Chambers JM, Hastie TJ (eds) (1991) Statistical models in S. CRC,Boca Raton, FL
Clark JS, Bjørnstad ON (2004) Population time series: processvariability, observation errors, missing values, lags, and hiddenstates. Ecology 85:3140–3150
Cleveland WS (1979) Robust locally weighted regression andsmoothing scatterplots. J Am Stat Assoc 74:829–836
Craven P, Wahba G (1979) Smoothing noisy data with splinefunctions: estimating the correct degree of smoothing by themethod of generalized cross-validation. Numer Math 31:377–403
Davis AJ, Jenkinson LS, Lawton JH, Shorrocks B, Wood S (1995)Global warming, population dynamics and community struc-ture in a model insect assemblage. In: Harrington R, Stork NE(eds) Insects in a changing environment. Academic Press,London, pp 431–439
Davis AJ, Lawton JH, Shorrocks B, Jenkinson LS (1998a) Indi-vidualistic species responses invalidate simple physiologicalmodels of community dynamics under global environmentalchange. J Anim Ecol 67:600–612
Davis AJ, Jenkinson LS, Lawton JH, Shorrocks B, Wood S(1998b) Making mistakes when predicting shifts in species rangein response to global warming. Nature 391:783–786
Den Boer PJ (1968) Spreading of risk and stabilization of animalnumbers. Acta Biotheor 18:165–194
45

Den Boer PJ, Reddingius J (1996) Regulation and stabilizationparadigms in population ecology. Chapman, London
deValpine P, Hastings A (2002) Fitting population models incor-porating process noise and observation error. Ecol Monogr72:57–76
Dickey DA, Fuller WA (1979) Distribution of the estimators forautoregressive time series with a unit root. J Am Stat Assoc74:427–431
Durbin J, Koopman SJ (2001) Time series analysis by state spacemodels. Oxford University Press, Oxford
Ekbom BS (1987) Incidence counts for estimating densities ofRhopalosiphum padi (Homoptera: Aphididae). J Econ Entomol80:933–935
Ellner S, Turchin P (1995) Chaos in a noisy world: new methodsand evidence from time-series analysis. Am Nat 145:343–375
Elton C (1949) Population interspersion: an essay on animalcommunity patterns. J Ecol 37:1–23
Elton CS (1958) The ecology of invasions by animals and plants.Methuen, London
Feng MG, Nowierski RM (1992) Spatial distribution and samplingplans for four species of cereal aphids (Homoptera: Aphididae)infesting spring wheat in southwestern Idaho. J Econ Entomol85:830–837
Feng MG, Nowierski RM, Zeng Z (1993) Binomial sampling plansfor the English grain aphid, Sitobion avenae (Homoptera:Aphididae) based on an empirical relationship between meandensity and proportion of tillers with different tally thresholdsof aphids. B Entomol Res 83:187–196
Fewster RM, Buckland ST, Siriwardena GM, Baillie SR,Wilson JD (2000) Analysis of population trends for farmlandbirds using generalized additive models. Ecology 81:1970–1984
Fukaya M (1950a) On some fundamental problems for predictingthe occurrence of the rice borer (in Japanese with Englishsummary). Jpn J Appl Zool 16:25–31
Fukaya M (1950b) Rice stem borer (in Japanese). Hoppou Shup-pan, Tokyo
Fukaya M, Kono M, Nakatsuka K (1954) On the factors con-cerning the occurrence of the rice stem borer in the first gen-eration. 1 (in Japanese with English summary). Jpn J Appl Zool19:101–111
Fukaya M, Nakatsuka K (1956) Forecasting of the rice stem boreroccurrence (in Japanese). Japan Plant Protection Association,Tokyo
Fuller WA (1987) Measurement error models. Wiley, NYGerrard DJ, Chiang HC (1970) Density estimation of corn root-
worm egg populations based upon frequency of occurrence.Ecology 51:237–245
Greene WH (2000) Econometric analysis, 4th edn. Prentice-Hall,London
Greene WH (2002) LIMDEP 8.0. Econometric modeling guide.Econometric software, Plainview
Hall BH, Cummins C (2005) TSP 5.0 reference manual. TSPinternational, Palo Alto, CA
Harvey AC (1981) Time series analysis. Allan, OxfordHarvey AC (1989) Forecasting, structural time series models and
the Kalman filter. Cambridge University Press, CambridgeHastings A, Hom CL, Ellner S, Turchin P, Godfray HCJ (1993)
Chaos in ecology: is mother nature a strange attracter? AnnuRev Ecol Syst 24:1–33
Hayashi F (2000) Econometrics. Princeton University Press,Princeton, NJ
Hayashi T, Koshimizu Y (1988) Computer program BLASTAMfor forecasting occurrence of rice leaf blast (in Japanese withEnglish summary). Bull Tohoku Nat Agric Exp Stn 78:123–138
Hirano K, Fujii K (1995) The outbreak mechanisms of the greenrice leafhopper, Nephotettix cincticeps Uhler, in northern Ja-pan. Res Popul Ecol 37:259–267
Hixon MA, Pacala SW, Sandin SA (2002) Population regulation:historical context and contemporary challenges of open vs.closed systems. Ecology 83:1490–1508
Hokyo N (1972) Studies on the life history and the populationdynamics of the green rice leafhopper, Nephotettix cincticepsUhler (in Japanese with English summary). Bull Kyushu AgricExp Stn 16:283–382
Ibaraki Prefecture (1957–2001) Annual report of the survey forforecasting crop pests. Ibaraki Prefecture, Japan
Imai F (1976) A forecasting method concerning occurrence numberof the green rice leafhopper, Nephotettix cincticeps Uhler, in thewestern part of Toyama prefecture (in Japanese). Proc AssocPlant Prot Hokuriku 24:22–24
IPCC (2000) Summary for policymakers, emissions scenarios. 2000,Special report of the intergovernmental panel on climatechange. Intergovernmental panel on climate change, Geneva<http://www.ipcc.ch/pub/reports.htm>
IPCC (2001) Climate change 2001: the scientific basis, Contributionof working group I to the third assessment report of theintergovernmental panel on climate change (IPCC). CambridgeUniversity Press, Cambridge <http://www.grida.no/climate/ipcc_tar/>
Ishikura H (1950a) Short review on the studies on the statisticalprediction of the date and number of rice borer moth appear-ance (in Japanese with English summary). Jpn J Appl Zool16:32–40
Ishikura H (1950b) Forecasting of insect pests of agricultural crops(in Japanese). Tokyo
Ishikura H (1951) Outbreak of insect pest and its prediction (inJapanese). Agric Hortic 26:109–113
Ito Y (1968) Are insect populations cyclical? (in Japanese). Kagaku38:39–45
Ives AR, Dennis B, Cottingham KL, Carpenter SR (2003) Esti-mating community stability and ecological interactions fromtime-series data. Ecol Monogr 73:301–330
Iwao S (1968) A new regression method for analyzing the aggre-gation pattern of animal populations. Res Popul Ecol 10:1–20
Johraku T (1976) Forecasting the abundance of Nephotettixcincticeps (Uhler) and Sogatella furcifera (Horvath) (in Japa-nese). Agric Hortic 51:1367–1372
Johraku T (1984) Local difference in the population dynamics ofNephotettix cincticeps (Uhler): comparison between Hokurikuand Kyushu districts (in Japanese). Agric Hortic 59:62–66
Johraku T, Kato S (1974) Effect of the snow to the survival of greenrice leafhopper, Nephotettix cincticeps Uhler (in Japanese). ProcAssoc Plant Prot Hokuriku 22:30–31
Johraku T, Kato S, Wakamatsu T (1976) Relationship between theearly generation and the peak one concerning the abundance ofgreen rice leafhopper, Nephotettix cincticeps Uhler (in Japa-nese). Proc Assoc Plant Prot Hokuriku 24:19–21
Johraku T, Sekiguchi W, Kato S, Naruse H, Imai F, Wakamatsu T(1983) Fluctuation of population of the green rice leafhopper,Nephotettix cincticeps Uhler (Hemiptera: Deltocephalidae), inHokuriku district (in Japanese with English summary). Jpn JAppl Entomol Z 27:146–151
Kanno M (1962) On the distribution pattern of the rice stem borerin a paddy field (in Japanese with English summary). Jpn J ApplEntomol Z 6:85–89
Kidokoro T (1979) Geographic trend in the annual populationfluctuation of the green rice leafhopper, Nephotettix cincticepsUhler (Hemiptera: Deltocephalidae). Appl Entomol Zool14:127–129
Kiritani K, Oho N (1961) Centrifugal progress of outbreaks of therice stem borer, Chilo suppressalis. Jpn J Appl Entomol Z 6:61–68
Kisimoto R, Yamada Y (1986) A planthopper-rice virus epidemi-ology model: Rice stripe and small brown planthopper, Lao-delphax striatellus Fallen. In: McLean GD, Garrett RG,Ruesink WG (eds) Plant virus epidemics: monitoring, modellingand predicting outbreaks. Academic Press, Sydney, pp 327–344
Kisimoto R, Yamada Y (1998) Present status of controlling ricestripe virus. In: Hadidi A, Khetarpal RK, Koganezawa H (eds)Plant virus disease control. APS Press, St. Paul, MN, pp 470–483
46

Kitagawa G (1987) Non-Gaussian state-space modeling of non-stationary time series. J Am Stat Assoc 82:1032–1063
Kojima S, Emura K (1971) On the estimation method of the sourceof the first generation of rice stem borer, Chilo suppressalis.Proc Assoc Plant Prot Hokuriku 19:38–41
Kono M, Ishikawa M (1955) Studies on the rice stem borer, Chilosuppressalis. 2. Correlation between the population density andthe damage in the second generation (in Japanese with Englishsummary). Bull Saitama Agric Exp Stn 13:17–25
Kono T (1966) Changes in the proportion of infected insects in avector population (in Japanese). Shokubutu Boeki (Plant Pro-tection) 20:131–136
Kono T, Sugino T (1958) On the estimation of the density of ricestems infested by the rice stem borer (in Japanese with anEnglish summary). Jpn J Appl Entomol Z 2:184–188
Kono T, Utida S, Yoshida T, Watanabe S (1952) Pattern of spatialdistribution of the rice-stem borer, Chilo simplex, in a paddyfield: pattern of the spatial distribution of insects, 2nd report.Res Popul Ecol 1:65–82
Kuno E (1968) Studies on the population dynamics of rice leaf-hoppers in a paddy field (in Japanese with English summary).Bull Kyushu Agric Exp Stn 14:131–246
Kuno E (1971) Sampling error as a misleading artifact in ‘‘keyfactor analysis’’. Res Popul Ecol 13:28–45
Kuno E (1986) Evaluation of statistical precision and design ofefficient sampling for the population estimation based on fre-quency of occurrence. Res Popul Ecol 28:305–319
Kurihara K (2004) Development of and utilization of unified cli-mate scenario (in Japanese). Current status and future strategyfor the research on climatic change, symposium proceedings,pp 17–18 <http://www8.cao.go.jp/cstp/project/envpt/prog-meet/ccra/top.html>
MacKinnon JG (1994) Approximate asymptotic distributionfunction for unit-root and cointegration tests. J Bus Econ Stat12:167–176
Maddala GS (2001) Introduction to econometrics, 3rd edn. Wiley,New York
Maelzer DA (1970) The regression of log Nt+1 on log Nn as a testof density dependence: an exercise with computer-constructeddensity-independent populations. Ecology 51:810–822
Matsuda H, Kaji K, Uno H, Hirakawa H, Saitoh T (1998) Amanagement policy for sika deer based on sex-specific hunting.Res Popul Ecol 41:139–149
Matsuda H, Uno H, Tamada K, Kaji K, Saitoh T, Hirakawa H,Kurumada T, Fujimoto T (2002) Harvest-based estimation ofpopulation size for Sika deer on Hakkaido Island, Japan.Wildlife Soc B 30:1160–1171
Ministry of Agriculture Forestry and Fisheries (1970–1990) Cropstatistics, vol 13–33 (in Japanese). Association of Agricultureand Forestry Statistics, Tokyo
Ministry of Agriculture Forestry and Fisheries (1970–1995) Sta-tistical yearbook of ministry of agriculture forestry and fisheriesJapan, vol 46–71 (in Japanese). Association of Agriculture andForestry Statistics, Tokyo
Ministry of Agriculture Forestry and Fisheries (1986) Projectstandards for forecasting pests incidence (in Japanese). Ministryof Agriculture Forestry and Fisheries, Tokyo
Miyashita K (1955) Some considerations on the population fluc-tuation of the rice stem borer (in Japanese with English sum-mary). Bull Natl Inst Agric Sci Ser C 5:99–109
Miyashita K (1982) Ecology of rice stem borer (in Japanese). Pri-vate publication
Miyashita K, Ito Y (1961) Population fluctuations of the insectpests of rice plants. Misc Publ Natl Inst Agr Sci 5:1–6
Murakami M, Suzuki K (1971) Fundamental study on forecastingof the small brown planthopper. II. Developmental rate ofoverwintering nymphs (in Japanese). Annu Rep Plant ProtKanto-Tosan 18:79
Muramatsu Y (1979) A system dynamic model for epidemic of ricestripe virus (in Japanese). Bull Shizuoka Agr Exp Stn 24:1–13
Murray BG (1999) Can the population regulation controversy beburied and forgotten? Oikos 84:148–152
Nachman G (1984) Estimates of mean population density andspatial distribution of Tetranychus urticae (Acarina: Tetrany-chidae) and Phytoseiulus persimilis (Acarina: Phytoseiidae)based upon the proportion of empty sampling units. J ApplEcol 21:903–913
Nicholson AJ (1954) An outline of the dynamics of animal popu-lations. Aust J Zool 2:9–65
Nishimori M, Ishigooka Y, Yokozawa M, Toritani H (2005) Fu-ture climate change scenario in Asian region by using the out-put from the latest GCM experiments. Proceedings of the jointmeeting of environmental engineering in agriculture 2005 (inpress)
Nitta A, Naruse H (1985) Relationship between the damage causedby the rice stem borer, Chilo suppressalis Walker, and the yieldof rice (in Japanese). Proc Assoc Plant Prot Hokuriku 33:48–53
Nozato K, Kiritani K (1976) The role of egg parasites on the de-crease of C. suppressalis (in Japanese). Shokubutu Boeki (PlantProtection) 30:259–263
Nyrop JP, Agnello AM, Kovach J, Reissig WH (1989) Binomialsequential classification sampling plans for European red mite(Acari: Tetranychidae) with special reference to performancecriteria. J Econ Entomol 82:482–490
Oda S (1971) Influence of the depth and duration of snow cover onthe overwintering of the green rice leafhopper, Nephotettixcincticeps Uhler (in Japanese). Proc Assoc Plant Prot Hokuriku19:42–44
Okamoto D, Sasaki M (1957) Evaluation method for the injurycaused by the second generation population of the rice stemborer, Chilo suppressalis Walker (in Japanese). ShokubutsuBoeki (Plant Protection) 11:527–530
Perry JN, Woiwod IP, Hanski I (1993) Using response-surfacemethodology to detect chaos in ecological time series. Oikos68:329–339
Pianka ER (1978) Evolutionary ecology, 2nd edn. Harper & Row,NY
Pollard E, Lakhani KH, Rothery P (1987) The detection of density-dependence from a series of animal censuses. Ecology 68:2046–2055
Quantitative Micro Software (2004) EViews 5 user’s guide, IrvineReddingius J (1971) Gambling for existence. a discussion of some
theoretical problems in animal population ecology. Acta Bio-theor 20:1–208
Reddingius J, Den Boer PJ (1970) Simulation experiment illus-trating stabilization of animal numbers by spreading of risk.Oecologia 5:240–284
Roux O, Von Arx R, Baumgartner J (1992) Estimating potatotuberworm (Lepidoptera: Gelechiidae) damage in stored pota-toes in Tunisia. J Econ Entomol 85:2246–2250
Royama T (1992) Analytical population dynamics. Chapman,London
Royama T, Mackinnon WE, Kettela EG, Carter NE, Hartling LK(2005) Analysis of spruce budworm outbreak cycles in NewBrunswick, Canada, since 1952. Ecology 86:1212–1224
Saitoh T, Stenseth NC, Viljugrein H, Kittilsen MO (2003) Mech-anisms of density dependence in fluctuating vole populations:deducing annual density dependence from seasonal processes.Popul Ecol 45:165–173
SAS Institute (1993) SAS/ETS user’s guide, version 6, second edi-tion, Cary, NC
SAS Institute (1995) SAS/INSIGHT software: changes andenhancements, release 6.10. SAS Institute, Cary, NC
SAS Institute (2001) SAS/STAT� software: changes andenhancements, release 8.2. SAS Institute, Cary, NC
Schaalje GB, Butts RA, Lysyk TJ (1991) Simulation studies ofbinomial sampling: a new variance estimator and densitypredictor, with special reference to the Russian wheat aphid(Homoptera: Aphididae). J Econ Entomol 84:140–147
Sekiguchi W, Naruse H, Imai F, Yuno I, Kawahara T, WakamatsuT (1981) Factors concerning the prevalence of the green riceleafhopper, Nephotettix cincticeps Uhler. III. On the regionaldifferences in distribution (in Japanese). Proc Assoc Plant ProtHokuriku 29:19–23
47

Selas V, Hogstad O, Andersson G, von Proschwitz T (2001) Pop-ulation cycles of autumnal moth, Epirrita autumnata, in relationto birch mast seeding. Oecologia 129:213–219
Shenk TM, White GC, Burnham KP (1998) Sampling-varianceeffects on detecting density dependence from temporal trends innatural populations. Ecol Monogr 68:445–463
Shephard N, Pitt MK (1997) Likelihood analysis of non-Gaussianmeasurement time series. Biometrika 84:653–667
Shinkai A (1962) Studies on insect transmission of rice virus dis-eases in Japan (in Japanese with English summary). Bull NatlInst Agr Sci Ser C 14:1–112
Solow AR (1998) On fitting a population model in the presence ofmeasurement error. Ecology 79:1463–1466
Solow AR (2001) Observation error and the detection of delayeddensity dependence. Ecology 82:3263–3264
St. Amant JLS (1970) The detection of regulation in animal pop-ulations. Ecology 51:823–828
Stata Corp. (2003) Stata time-series reference manual release 8.Stata Press, College Station
Stenseth NC, Viljugrein H, Saitoh T, Hansen TF, Kittilsen MO,Bølviken E, Glockner F (2003) Seasonality, density dependenceand population cycles in Hokkaido voles. P Natl Acad Sci USA100:11478–11483
Taira M, Ichihashi H, Yamada H (1995) Computer simulationmodel in the small brown planthopper (Laodelphax striatellusFallen) and rice stripe (in Japanese). Bull Gifu Agr Res C 8:1–22
Takagi S, Sugino T, Nishino M (1958) Reconsideration of the in-jury caused by the second generation population of the ricestem borer, Chilo suppressalis Walker (in Japanese). Bull Shi-zuoka Agr Exp Stn 3:23–35
Taylor LR, Woiwod IP, Perry JN (1978) The density-dependenceof spatial behavior and the rarity of randomness. J Anim Ecol47:383–406
Taylor LR, Woiwod IP, Perry JN (1979) The negative binomial asa dynamic ecological model for aggregation, and the densitydependence of k. J Anim Ecol 48:289–304
Turchin P (1993) Chaos and stability in rodent populationdynamics: evidence from non-linear time-series analysis. Oikos68:167–172
Turchin P (1995) Population regulation: old arguments and a newsynthesis. In: Cappuccino N, Price PW (eds) Populationdynamics: New approaches and synthesis. Academic Press, NY,pp 19–40
Turchin P (1999) Population regulation: a synthetic view. Oikos84:153–159
Turchin P (2003) Complex population dynamics: a theoretical/empirical synthesis. Princeton Univ Press, Princeton
Turchin P, Taylor AD (1992) Complex dynamics in ecological timeseries. Ecology 73:289–305
Utida S (1941) Studies on experimental population of the azukibean weevil, Callosobruchus chinensis (L.) II. The effect ofpopulation density on progeny populations under differentconditions of atmospheric moisture. Mem Coll Agr Kyoto ImpUniv 49:1–20
Utida S (1954) ‘‘Logistic’’ growth tendency in the populationfluctuation of the rice stem borer. Studies on the fluctuation ofpopulation density observed in several insect pests (1st report)(in Japanese with English summary). Oyo-Kontyu 10:3–10
Utida S (1957a) ‘‘Logistic’’ growth tendency in the populationfluctuation of the rice stem borer. Studies on the fluctuation of
population density observed in several insect pests (2nd report)(in Japanese with English summary). Botyu-Kagaku 22:57–63
Utida S (1957b) Outbreaks of insect pests and the mechanism(in Japanese). Shokubutsu Boeki (Plant Protection) 11:55–59
Utida S (1958) On fluctuations in population density of the ricestem borer Chilo suppressalis. Ecology 39:587–599
Viljugrein H, Stenseth NC, Smith GW, Steinbakk GH (2005) Den-sity dependence in North American ducks. Ecology 86:245–254
Whistler D, White KJ, Wong SD, Bates D (2004) SHAZAM user’sreference manual Version 10. Northwest Econometrics, Van-couver
White TCR (2001) Opposing paradigms: regulation or limitation ofpopulations? Oikos 93:148–152
White TCR (2004) Limitation of populations by weather-drivenchanges in food: a challenge to density-dependent regulation.Oikos 105:664–666
Williams CK, Ives AR, Applegate RD (2003) Population dynamicsacross geographical ranges: time-series analyses of three smallgame species. Ecology 84:2654–2667
Yamamura K (1989) Effect of aggregation on the reproductive rateof populations. Res Popul Ecol 31:161–168
Yamamura K (1998) Stabilization effects of spatial aggregation ofvectors in plant disease systems. Res Popul Ecol 40:227–238
Yamamura K (1999) Transformation using (x+0.5) to stabilize thevariance of populations. Res Popul Ecol 41:229–234
Yamamura K (2000) Colony expansion model for describing thespatial distribution of populations. Popul Ecol 42:161–169
Yamamura K (2002) Biodiversity and stability of herbivore pop-ulations: influences of the spatial sparseness of food plants.Popul Ecol 44:33–40
Yamamura K, Yokozawa M (2002) Prediction of a geographicalshift in the prevalence of rice stripe virus disease transmitted bythe small brown planthopper, Laodelphax striatellus (Fallen)(Hemiptera: Delphacidae), under global warming. Appl Ento-mol Zool 37:181–190
Yokozawa M, Goto S, Hayashi Y, Seino H (2003) Mesh climatechange data for evaluating climate change impacts in Japanunder gradually increasing atmospheric CO2 concentration. JAgr Meteorol 59:117–130
Yukimoto S, Noda A (2002) Improvements of the meteorologicalresearch institute global ocean-atmosphere coupled GCM(MRI-CGCM2) and its climate sensitivity. CGER’s Super-computer Activity Rep 10:37–44
Yukimoto S, Noda A, Kitoh A, Sugi M, Kitamura Y, Hosaka M,Shibata K, Maeda S, Uchiyama T (2001) A new meteorologicalresearch institute coupled GCM (MRI-CGCM2)—Model cli-mate and its variability. Pap Meteor Geophys 51:47–88
Yuno I, Johraku T (1975) Occurrence of the first generation of ricestem borer in paddy fields using transplanting machine ofyoung seedlings (in Japanese). Proc Assoc Plant Prot Hokuriku23:32–34
Yuno I, Johraku T (1976) Ovipositional preference and the survivalrate of larvae of the first generation of rice stem borer, Chilosuppressalis Walker, using transplanting machine of youngseedlings (in Japanese). Proc Assoc Plant Prot Hokuriku 24:16–18
Zeng Z, Nowierski RM, Taper ML, Dennis B, Kemp WP (1998)Complex population dynamics in the real world: modeling theinfluence of time-varying parameters and time lags. Ecology79:2193–2209
48