Embed Size (px)
Citation preview
How to achieve long term profits with
By
NIKOS MERMIGAS
All rights reserved 2012
1
www.spartantraderfx.com
“Learn to understand the market
behavior and charts first, follow the
rules, treat your trading as a business
and it will soon become an easy,
profitable and joyful habit”
2
-CONTENT-
Dedication 3
About the Author 4
Intro 8
What is Swing trading anyway 9
The Top-Down Approach
The top down approach 11
Tips & recommendations 12
2 ways to enter and manage a swing trade 13
Our trading tools for successful trading 14
Swing trading style 1 15
Step 2 -Top Down approach & Trading 17
Trade entry and trade management 27
Basic trading and money management Rules! 31
How to calculate your risk on you trading platform 32
The Lot Size 33
Swing trading style 2 34
Practice on the charts! 49
Practice Horizontal support and resistance Lines 65
Full Chart Analysis 79
How to Trade and Manage Trades in a Ranging Market 88
3
A good 123 setup 99
Good, but not perfect setups 106
Setups to avoid 110
Organize the charts on your screen 114
Trade & Money management rules 116

4
Dedication
I am dedicating this eBook to my Son,
Wife and all readers for their strength and will power to achieve long term
trading success.
5
About the Author
Dear Reader! My name is Nikos Mermigas. I was born and raised in Germany. My job as a musician and music teacher forced me to
travel a lot and kept me frequently away from my home and family. A good friend and I decided on a quest to find something that would untie our hands a bit, something that would provide us with more time to spend with our family and have extra money. So our search began! We searched for a way to be our own bosses and a way to work from home using a computer. We searched many months and were flooded with
worthless information and ideas. We couldn’t find anything that we desired. At that time I had some stocks which I was not trading on my own. From time to time I would look to see how they were performing. After a conversation with a stock broker we learned about the foreign exchange (forex) market. We had never heard about the foreign exchange market before and were now curious. Finally we found something we wanted to learn more about!
We learned that forex could indeed be a small, personal business that anybody could manage from anywhere in the world with only a computer and an internet connection. That sounded great and our hope intensified! We also heard that thousands of people are making money from their home sitting on their couch or in their home office, and some of them had quit their full time jobs or were just making an extra income from
trading in the forex market. For me personally, it was love at first sight!

6
I realized there was tremendous potential in the forex market and I started trading forex with confidence. I opened a small account and started to buy and sell currencies without knowing the basic rules of trading and without any knowledge on this subject. In less than six months my friend and I lost almost all the money in our account. But why did we lose? Very simple! We did not trade at all. We were just gambling like 90% of traders do.
At that point I needed a one month break to put my thoughts in order. I asked myself a lot of questions. There were nights I couldn’t sleep because of so many questions and thoughts flying around in my mind! What did I do wrong? What are successful traders doing differently than me?
How can I improve? How can I succeed on a long term
basis and how can I handle my emotions like greed and fear during my trading? After a while I sat down and said to myself; every career, every job and every business needs proper training. It is no different at all in trading the forex market and why should it be? I started reading lots of books (most of them did not help me at all to improve my trading). I also went to trading
psychology and technical analysis seminars. I took all the useful information from these webinars and seminars to help me create my own trading rules and my own trading system. It took me a while but when I really started following my system rules, with patience and discipline, things started to turn around in my favor. I believed in myself and my rules. When I doubled my account I knew I had
succeeded!
7
A person may not need a lot of coaching to become a real trader, but without the right training I think most people are doomed to fail. Looking back, I now see that trading is not hard to learn at all. It truly can be very easy. We humans have the tendency to complicate things without having a real reason to do so. That, in my opinion is why 90%+ of people loose in the forex market.
The biggest advantage about the SPARTAN TRADER FX system is that you can use it successfully in each and every market, not just the forex market. The chart reflects every human emotion and so the signals are the same. In our case it does not matter if we are talking about the forex market or any other financial market. Today, I am a full time trader. My favorite markets are
still forex, metals and indices! I love to do my chart analysis in the morning and then execute my trades when I get the signal as per my system rules. Life as a trader gives me great pleasure. I have goals, I have reasons to think positive, and I am always confronted with new challenges and opportunities day after day and week after week. I have met a lot of traders and 80-90% of them have not made money consistently over the long term. In fact they
have lost it consistently. I thought this was really interesting. Most of these guys were experienced traders with knowledge and passion for trading. Their problem was not necessarily their trading system. They just couldn’t follow their rules because they did not believe in what they were doing.
8
Some had no discipline, some had too much fear, and some were unable to pull the trigger. Their mental state was in bad condition and they looked for excuses why things did not work out. Later on I accidentally started to teach my system to an experienced but unsuccessful trader through the internet. We took live trade together and I tried to help him gain his confidence back. With a little work from both of us, he finally made it!
It was exhilarating helping someone stand on his own two feet again. The feeling was so great it is difficult to describe. That trader asked me if I would help some of his friends with their trading. I started coaching those traders and one thing led to another and hence forth I started with the Norfesia FX and later on the (renamed) SPARTAN TRADER FX LIVE courses.
Trading took on new meaning for me. Now, not only do I enjoy trading but also enjoy helping others overcome their obstacles and traps which are hindering them from becoming successful in their trading. I wish you Health, happiness and success
Nikos Mermigas
9
Intro
Hello Trader around the world!
I would like to thank you for your trust and interest in my
new eBook- Swing Trading Mastery.
Most of you are probably familiar with my first work, the
“Spartan Trader FX Academy eBook & Workbook” In case
you haven’t read the Spartan FX eBook before, I would
suggest that you study it first, before you continue with
this one!
The reason being is that you need to understand the
basics of my trading system in combination with the
trading rules and exercises. If you master these very
important matters, it will be a breeze for you to continue
with the extension about detailed swing trading.
Enough said. Let’ start now
10
What is Swing trading anyway!
Generally speaking, a swing trader does not trade against
the main trend. A swing trader looks for trading setups in
the direction of a major market trend, so he can hold a
position/s for several days.
A swing trader uses normally higher timeframes like the 4
hourly or even the daily chart to place and manage his
trade.
It often happens that a trade stays open for even weeks
or months instead of days, if the swing trader split his
positions into several parts. That again of course depends
on the strategy or system he uses.
A trade that stays in the markets for weeks, months or
even years is called position trade, trend following trade,
or “buy and hold” investment!
11
Things are not as complicated as you might think. Swing
trading is in my opinion a simple and stress free way to
profit highly from financial markets.
Why stress free; because you don’t have to sit in front of
your screen all day or even every day. Depending on what
time frame you are trading. We will go through all
possible timeframe combinations in much detail in this
book of course, so don’t worry.
I have to make one issue very clear right from the
beginning. If you focus on swing trading, you won’t find
trades every day or even every week.
But this is the nice thing about swing trading anyway.
With a good and detailed chart analysis you will be able to
make on average hundreds or even thousands of pips per
trade in a good trending market.
This might sound a bit weird to you if you are used to
trade intraday or scalping using low time frames like the
15, 5, or even 1 min chart.
I can tell you right now that I am not joking or promising
something blue out of the sky.
Many of my students and myself of course are trading the
swing trading strategy for many years now with great
success. The reason being is that you are able to identify
the real direction of the particular market when trading on
high time frames like the daily and 4 h chart.
And that again means that you are able to trade in the
right direction, something that is difficult to do when
focusing on small timeframes only.
12
The top down approach
It simply means; you start your chart analysis on high
time frames. From there you go down step by step to
identify the market behavior.
You need to check if the market you are working on is
trending or ranging. This is what the markets do, in case
you are new to charting. So, markets trend or they move
in a range.
After identifying the market behavior (we will do this step
by step in the book) you have to switch to a lower
timeframe, do your chart analysis again and look for
trading setups.
If a setup is complete and everything you analyzed is
looking good, you will have trade.
Now you have to execute your trade, put your stop in the
right place and try to maximize your trading profits, by
monitoring your charts and updating your positions
carefully. If you do all this correctly and follow the trading
rules, you will be surprised how easy trading can be.
Having that said, you need still to practice a bit. It is not
difficult, but you still need to get used to this first.
13
Tips & recommendations
I recommend that you use a demo account for about 1-3
months, depending on your personality and experience
level, before you go live.
Prove to yourself that you can stick to the rules, make a
lot of pips with swing trading and then go for it with small
lots first (micro/mini lots).
Later on you can try bigger positions. In the trading plan
chapter I will explain in detail how I do that.
It is very important that you follow each and every step
explained in this eBook. I have seen many traders starting
well in their trading career, but ending up in a disaster,
just because they changed rules or just forgot the most
important chart analysis procedure.
Please be aware of that and use this eBook as a guide
right at the beginning.
A quick reminder; my trading system is based on
technical analysis and I use Metatrader 4 charts for my
trading chart analysis. You can use of course whatever
charting software you like.
The reason I use the Metatrader platform is, because they
provide all indicators and features I need and the charts a
clear and easy to use.
The best part is that you can download Metatrader for free
on the web. Just type Metatrader 4 download in your
search engine browser and you will be able to choose
from lot of download links.
14
2 ways to enter and manage a
swing trade
My Swing trading strategy can actually be used in 2 ways.
You can use one or both ways. That depends mainly on
how much time you want to spend trading on a regular
basis. You don’t have to decide that right now. After
practicing a bit you will be able to decide for your own.
Swing trading style 1
(Entries & trade management on daily charts)
Step 1 -Top Down approach
Step 2 -Top Down approach & trade management
Swing trading style 2
(Entries & trade management on 4 hourly charts)
Step 1 -Top Down approach
Step 2 -Top Down approach & trade management
15
Our trading tools for successful trading
We use only 3 technical tools for our chart analysis and
trading. That’s all you need. Many traders believe they
need a lot of indicators all over the chart to make it work,
but that is not true. Too many of these on your screen will
make your live difficult. You will always find an excuse not
to trade, because some indicators will trigger long while
others trigger short signals. You need to only to
understand the market behavior in combination with some
simple tools to become a successful trader on the long
run.
I use only 4 technical tools with my trading system.
1. Simple trend lines
2. EMA’s (Exponential moving average) 12-36-200-633
3. Heikin–Ashi Candles with…
4. …bar charts in the background to see the open and
close price of each candle
Combining these tools with a bit of practice, patience,
discipline and repetition will help you to gain confidence in
yourself and the trading the system.
It is much easier to work on your goals if you have
confidence in yourself and the trading system you use.
You need to track your results and work on your skills,
trying to improve them every month. Make sure you enjoy
what you do. That is probably the most important issue
anyway! If you can’t enjoy your trading, something must
be wrong. Find out what it is.
16
Swing trading style 1
(Entries & trade management on daily charts)
Step 1 -Top Down approach
Open your Charting software (MT4 for example) after you
switched on your computer. Chooses one product you
would like to trade, like Forex, Stocks, Metals or indices
and open the WEEKLY CHART.
17
I give you the steps written here right now, so please try
to remember them a 100%. It is very important that you
get used to the top down approach, so it becomes a
pleasant habit.
Later on in this eBook we will practice everything with
many detailed charts. Repeat all exercises at least 3 times
and build up your confidence.
There are 3 things you want to check when doing your top
down approach and starting with the weekly chart!
A. The market behavior
You need to look for the main trend direction. It is easy to
spot a trending or ranging market on the weekly chart.
B. The actual live price direction
You need to check what the price is doing right now. What
I mean by that is, that the main trend can be up on the
weekly chart, but the price could be retracing to the
downside at the moment. In this case the weekly chart
candle would probably point down!
C. Identify major support & resistance
Look for major support and resistance areas and draw
your lines on the weekly chart. Bounces and breaks of
major support and resistance areas are most important.
In the trading examples later on I will explain why.
18
Step 2 -Top Down approach & Trading
After you are done with all the previous 3 steps you need
to go through with the second part.
Open a 2. Chart with the same pair/product you have
chosen and chose the DAILY CHART. There are now 4
things you want to check when doing your top down
analysis on the daily chart
A. The market behavior
You need to look for the main trend direction again, like
you did on the weekly chart. Make sure the daily chart
points into the same direction as the weekly chart. That is
mostly, but not always the case.
B. Look for major support & resistance bounces or breaks
Look for major support and resistance areas and draw
your trend lines on the daily chart. Look for clear breaks,
bounces and trend changes.
C. Wait for setups on the daily chart
Look for clear trading setups on the daily chart after
identifying the trend direction.
D. Trade entry & trade management
Open 3 positions (one trade split into 3 parts), place your
stop and manage your trade on the daily chart, according
to the swing trading system rules (Style 1).
19
Let’s start with our first chart example on “GOLD”
Swing trading style 1
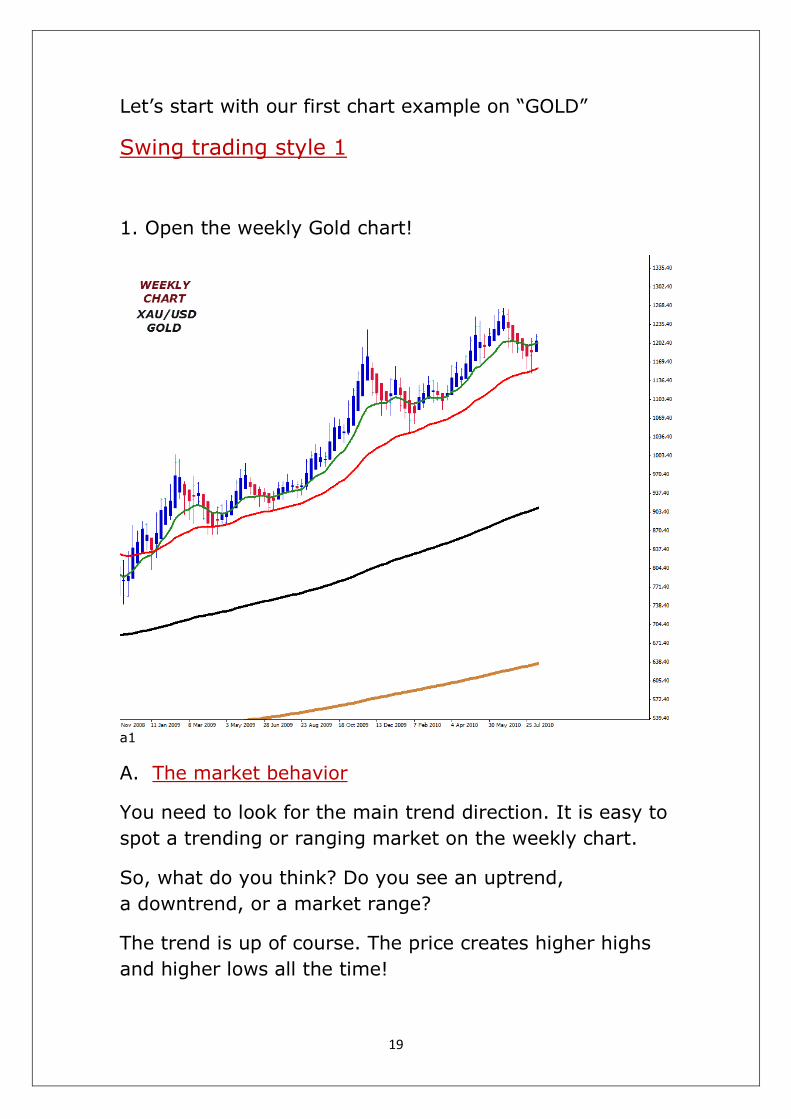
1. Open the weekly Gold chart!
a1
A. The market behavior
You need to look for the main trend direction. It is easy to
spot a trending or ranging market on the weekly chart.
So, what do you think? Do you see an uptrend,
a downtrend, or a market range?
The trend is up of course. The price creates higher highs
and higher lows all the time!
20
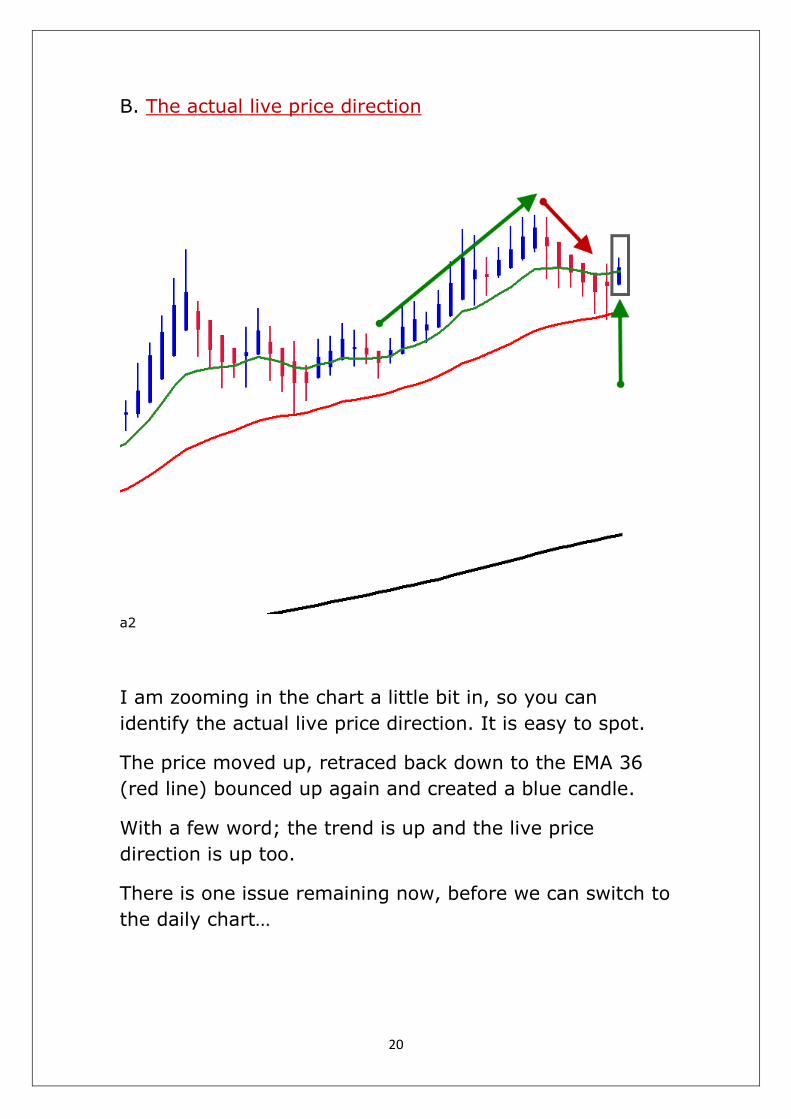
B. The actual live price direction
a2
I am zooming in the chart a little bit in, so you can
identify the actual live price direction. It is easy to spot.
The price moved up, retraced back down to the EMA 36
(red line) bounced up again and created a blue candle.
With a few word; the trend is up and the live price
direction is up too.
There is one issue remaining now, before we can switch to
the daily chart…
21
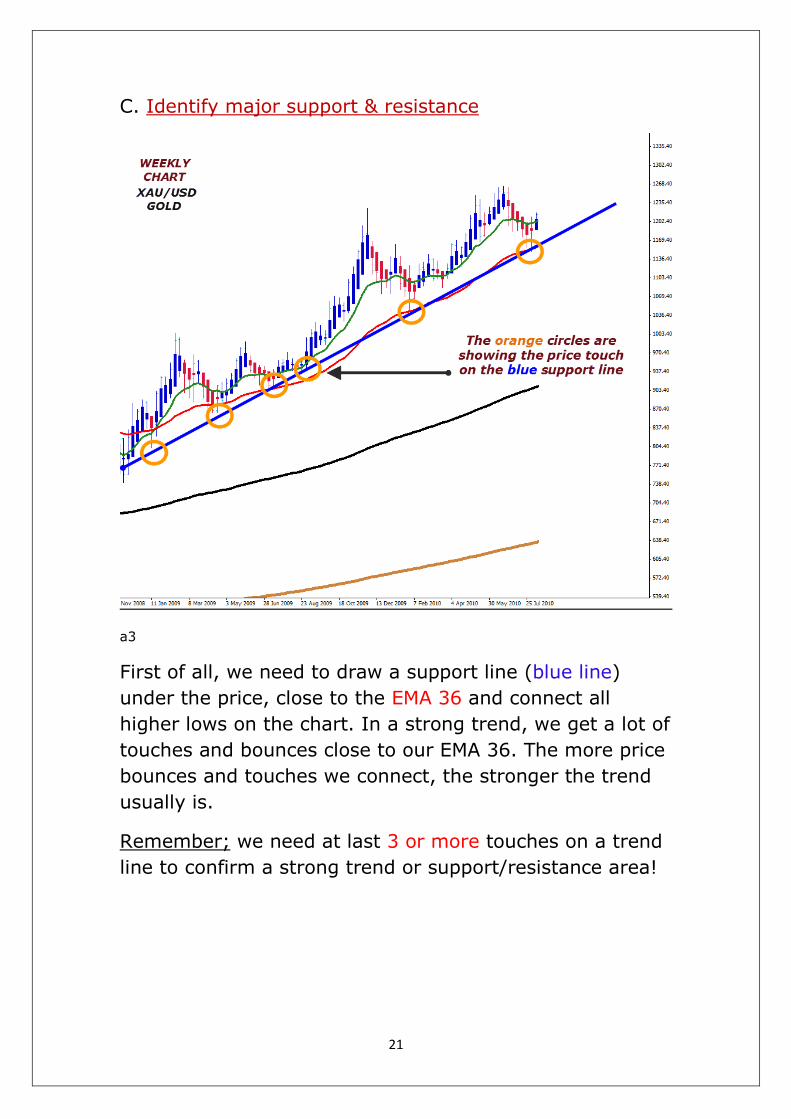
C. Identify major support & resistance
a3
First of all, we need to draw a support line (blue line)
under the price, close to the EMA 36 and connect all
higher lows on the chart. In a strong trend, we get a lot of
touches and bounces close to our EMA 36. The more price
bounces and touches we connect, the stronger the trend
usually is.
Remember; we need at last 3 or more touches on a trend
line to confirm a strong trend or support/resistance area!
22
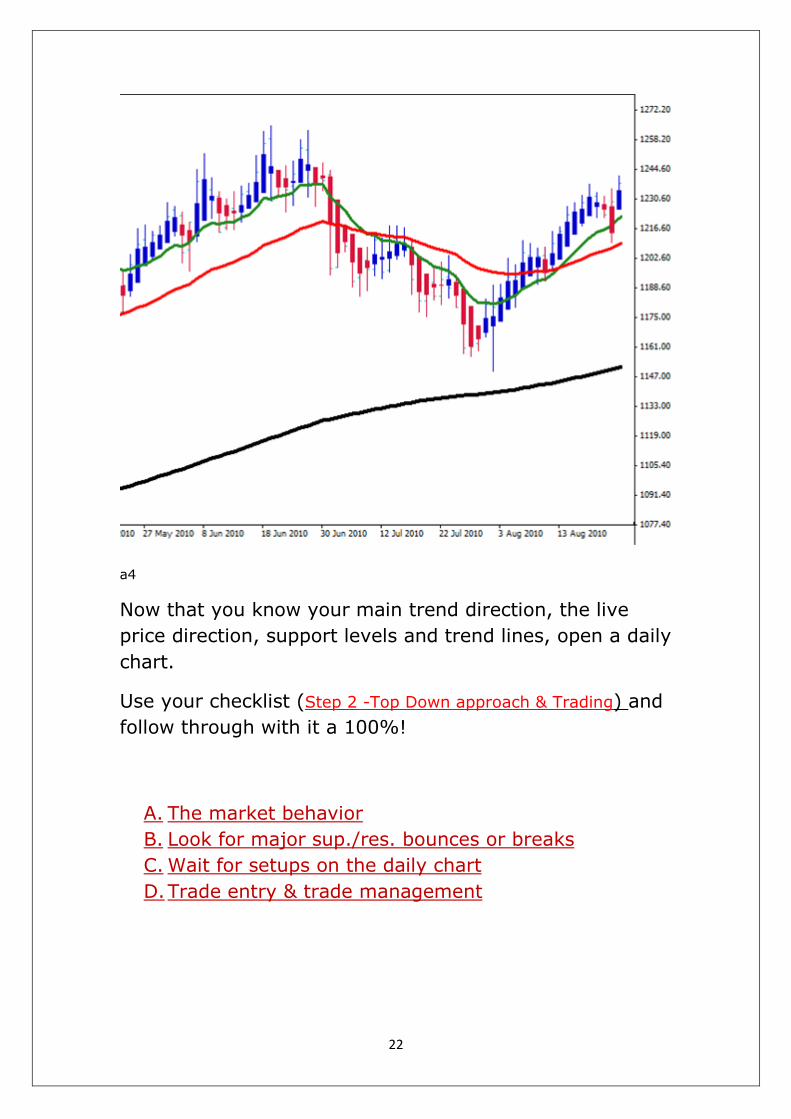
a4
Now that you know your main trend direction, the live
price direction, support levels and trend lines, open a daily
chart.
Use your checklist (Step 2 -Top Down approach & Trading) and
follow through with it a 100%!
A. The market behavior
B. Look for major sup./res. bounces or breaks
C. Wait for setups on the daily chart
D. Trade entry & trade management
23
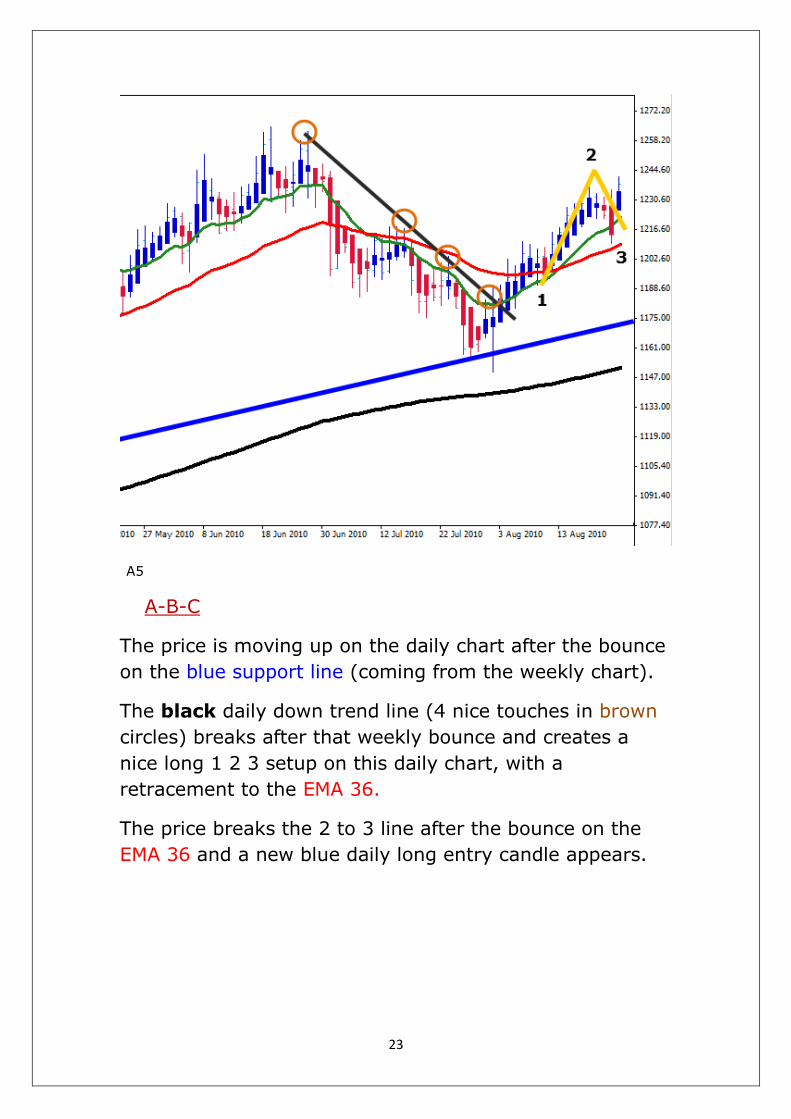
A5
A-B-C
The price is moving up on the daily chart after the bounce
on the blue support line (coming from the weekly chart).
The black daily down trend line (4 nice touches in brown
circles) breaks after that weekly bounce and creates a
nice long 1 2 3 setup on this daily chart, with a
retracement to the EMA 36.
The price breaks the 2 to 3 line after the bounce on the
EMA 36 and a new blue daily long entry candle appears.
24
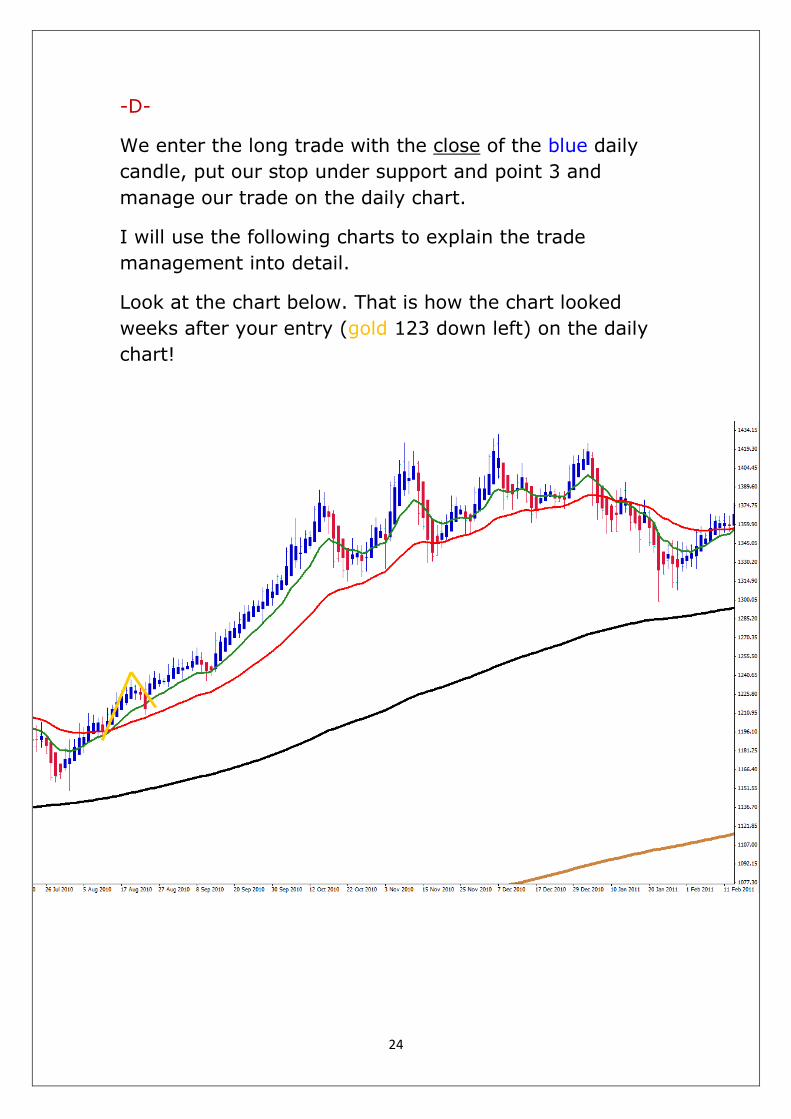
-D-
We enter the long trade with the close of the blue daily
candle, put our stop under support and point 3 and
manage our trade on the daily chart.
I will use the following charts to explain the trade
management into detail.
Look at the chart below. That is how the chart looked
weeks after your entry (gold 123 down left) on the daily
chart!
25
1. Let’s do the setup again…Look at the chart from down left to
right. The EMA 12 (green line) crossed the EMA 36 (redline) to
the upside.
2. The price created a long 123 setup with a retracement back to
the EMA 36.
3. A blue candle appears after the bounce on the EMA 36 and
closes by end of the day over the 2-3 line. The Entry Signal!!!
4. You see the price moving up close and over the EMA 36, which
is your guide.
5. Connect at least 3 touches to define your strong Daily trend
line.
6. Draw resistance level trend lines too, like the topping
formations on the upper chart. These where the first signs of a
trend reversal on the daily chart!
7. Look for a reversal short setup after the EMA 36 break.
Use at the following chart and practice the 7 steps above a few
times, just to get the hang of it.
Don’t continue to read the book until you haven’t understood
and practices the setups and rules to this point.
Better go back and read the swing trading style 1 chapter
again.
If you are good with the basics, just continue.

26
Use this page to make your notes…
27
28
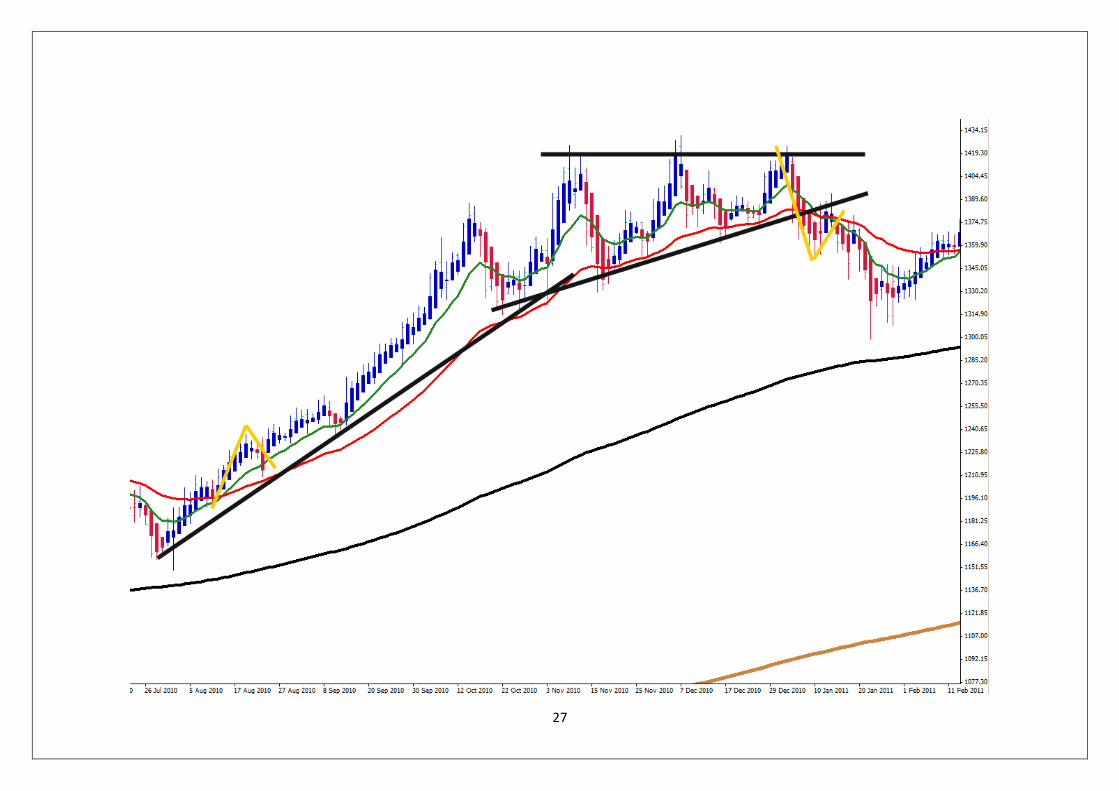
Trade entry and trade management
The following chart will show you all moves you need to
check and follow in much detail. This is an easy example.
Make sure you study it well
1. You enter the long trade after your EMA12/36
crossover, followed by a 123 setup and a 2-3 line break
candle. The candle needs to change the color from red to
blue for long and blue to red for short setups of course.
2. Make sure the candle that breaks the 2-3 line is a
“good” candle! That means, it has not only to break the 2-
3 line, but the candle has to close way over its open price.
I will explain that later on with some nice chart examples.
3. Now look at point 3 on your 123 setup. This is your
lowest point. You have to put your stop under point 3 and
under your trend line. You have to measure the distance
(in pips) between your stop and the entry price now. Use
this amount of pips to calculate your profit targets.
29
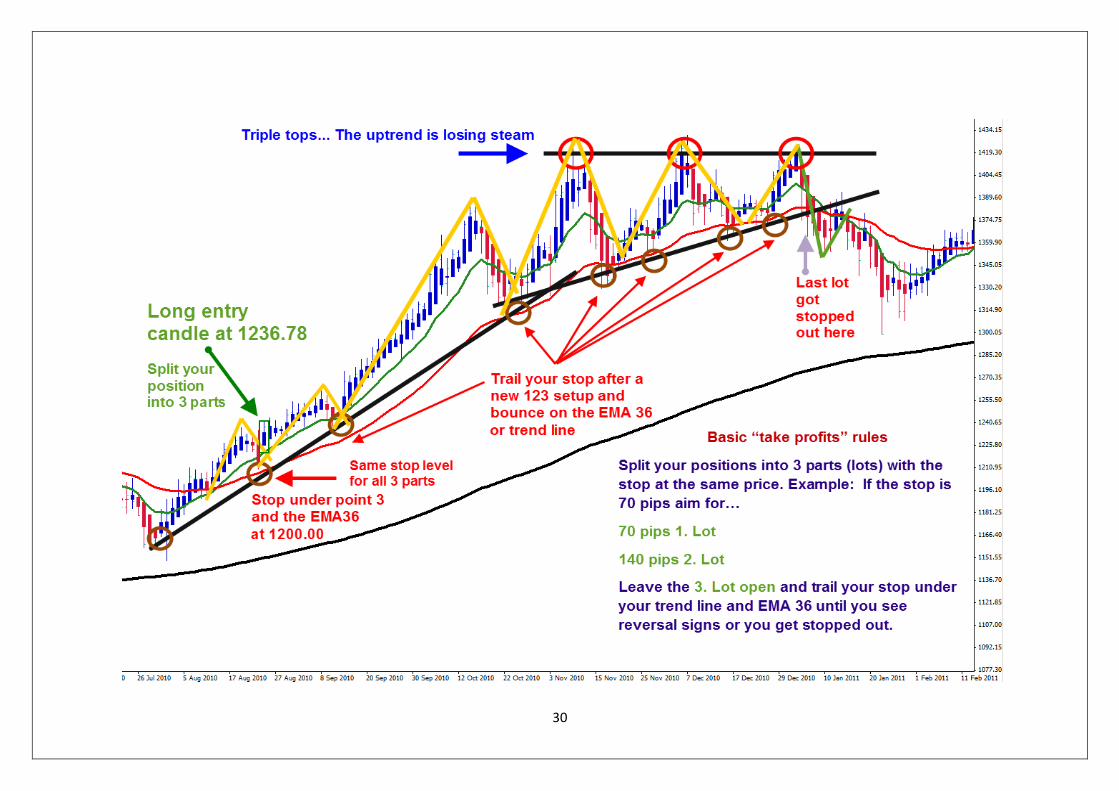
We split our swing trade into 3 parts. That means we open
3 lots with the same stop level but different target levels
in order to maximize our profits.
The Gold (XAU/USD) Chart for example: Stop 300 basis
points*
1. Target 1:1 =300 basis points
2. Target 2:1 =600 basis points
3. Target Bonus Lot…
We leave the third Lot running if the trend is strong and
try to make as many basis points as possible here.
How do we identify a strong trend? Look at the following
chart again. This is an uptrend! As long as you see higher
highs, higher lows, bounces on the trend line (brown
circles), bounces the EMA 36 and new 123 setups (golden)
you know that the trend is strong.
Trail your stop under point 3 of your 123 setup every time
a new confirmed 123 setup appears on your chart. Make
sure you see a price bounce on the trend line or/and EMA
36)
Now look for reversal signs. Topping and bottom
formations, or heavy support/resistance areas coming
from higher time frames are very important. You can take
your profits for the remaining lot in these areas, or you
wait until you get stopped out! This depends on the how
the chart looks at that moment in time.
*Basis points: Since we are referring to a Gold Chart in this example,
whereas if we were looking at an FX chart then the terminology would be
pips.
30

31
Use this page to make your notes…
32
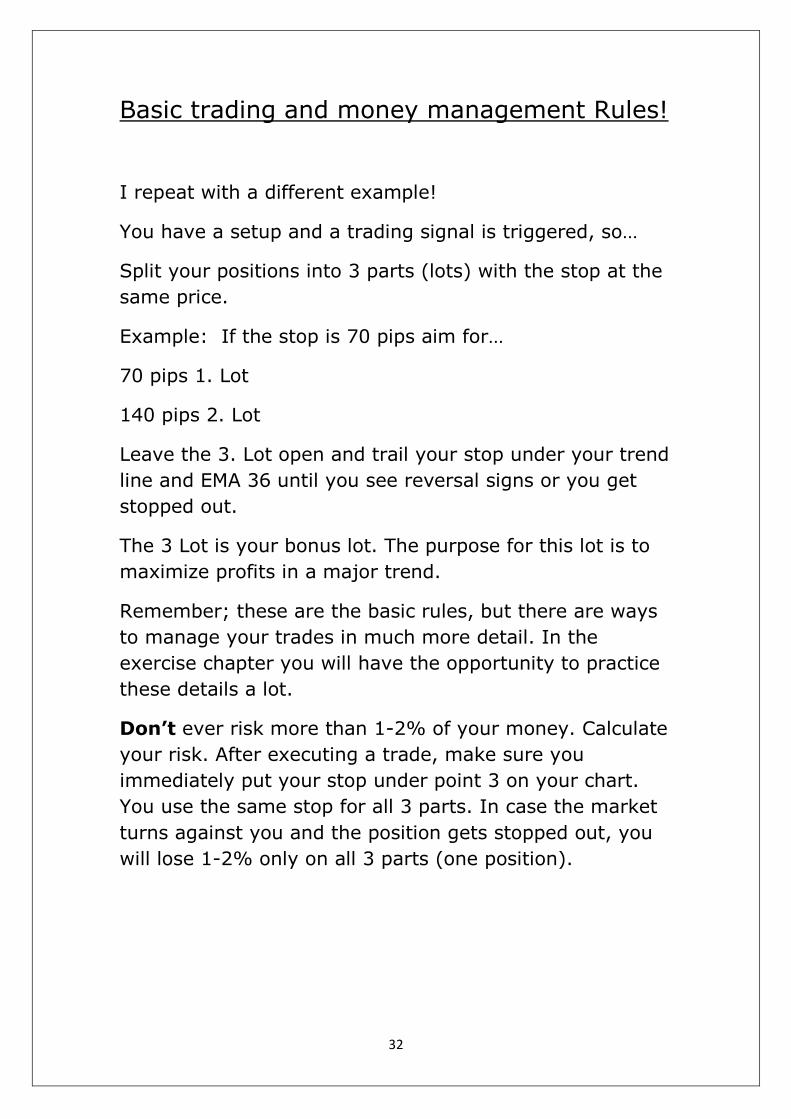
Basic trading and money management Rules!
I repeat with a different example!
You have a setup and a trading signal is triggered, so…
Split your positions into 3 parts (lots) with the stop at the
same price.
Example: If the stop is 70 pips aim for…
70 pips 1. Lot
140 pips 2. Lot
Leave the 3. Lot open and trail your stop under your trend
line and EMA 36 until you see reversal signs or you get
stopped out.
The 3 Lot is your bonus lot. The purpose for this lot is to
maximize profits in a major trend.
Remember; these are the basic rules, but there are ways
to manage your trades in much more detail. In the
exercise chapter you will have the opportunity to practice
these details a lot.
Don’t ever risk more than 1-2% of your money. Calculate
your risk. After executing a trade, make sure you
immediately put your stop under point 3 on your chart.
You use the same stop for all 3 parts. In case the market
turns against you and the position gets stopped out, you
will lose 1-2% only on all 3 parts (one position).
33
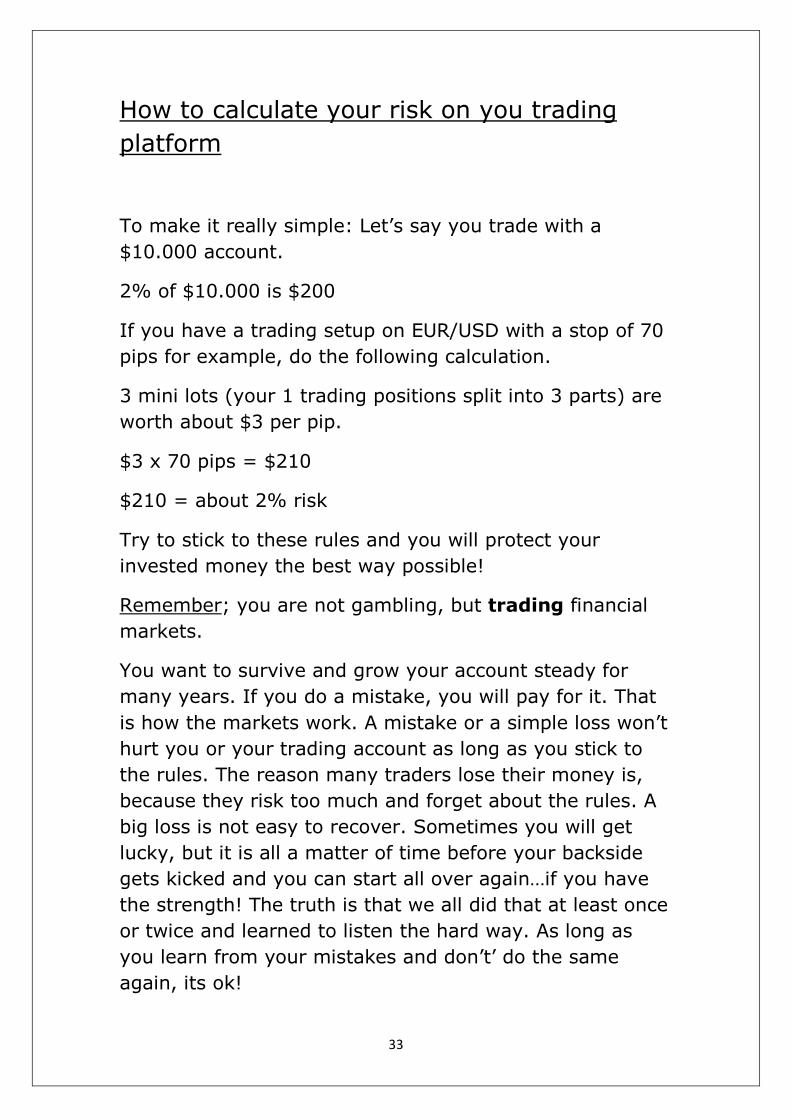
How to calculate your risk on you trading
platform
To make it really simple: Let’s say you trade with a
$10.000 account.
2% of $10.000 is $200
If you have a trading setup on EUR/USD with a stop of 70
pips for example, do the following calculation.
3 mini lots (your 1 trading positions split into 3 parts) are
worth about $3 per pip.
$3 x 70 pips = $210
$210 = about 2% risk
Try to stick to these rules and you will protect your
invested money the best way possible!
Remember; you are not gambling, but trading financial
markets.
You want to survive and grow your account steady for
many years. If you do a mistake, you will pay for it. That
is how the markets work. A mistake or a simple loss won’t
hurt you or your trading account as long as you stick to
the rules. The reason many traders lose their money is,
because they risk too much and forget about the rules. A
big loss is not easy to recover. Sometimes you will get
lucky, but it is all a matter of time before your backside
gets kicked and you can start all over again…if you have
the strength! The truth is that we all did that at least once
or twice and learned to listen the hard way. As long as
you learn from your mistakes and don’t’ do the same
again, its ok!
34
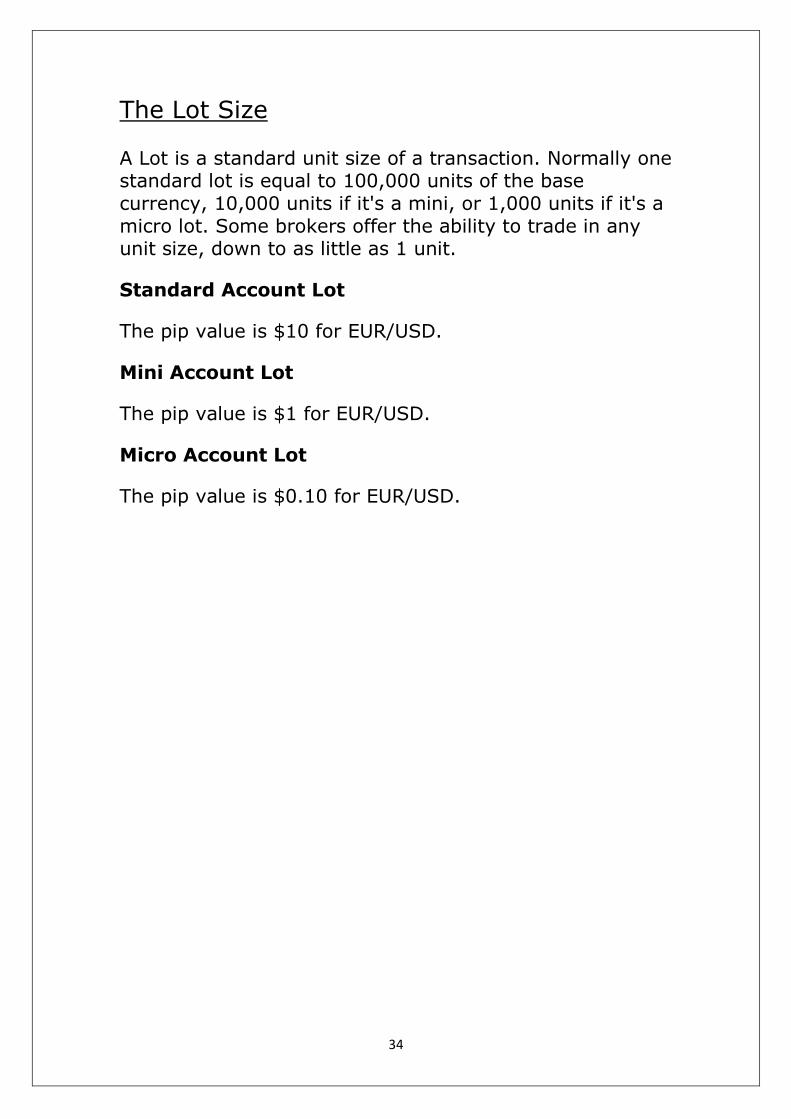
The Lot Size
A Lot is a standard unit size of a transaction. Normally one standard lot is equal to 100,000 units of the base currency, 10,000 units if it's a mini, or 1,000 units if it's a micro lot. Some brokers offer the ability to trade in any unit size, down to as little as 1 unit.
Standard Account Lot
The pip value is $10 for EUR/USD.
Mini Account Lot
The pip value is $1 for EUR/USD.
Micro Account Lot
The pip value is $0.10 for EUR/USD.
35
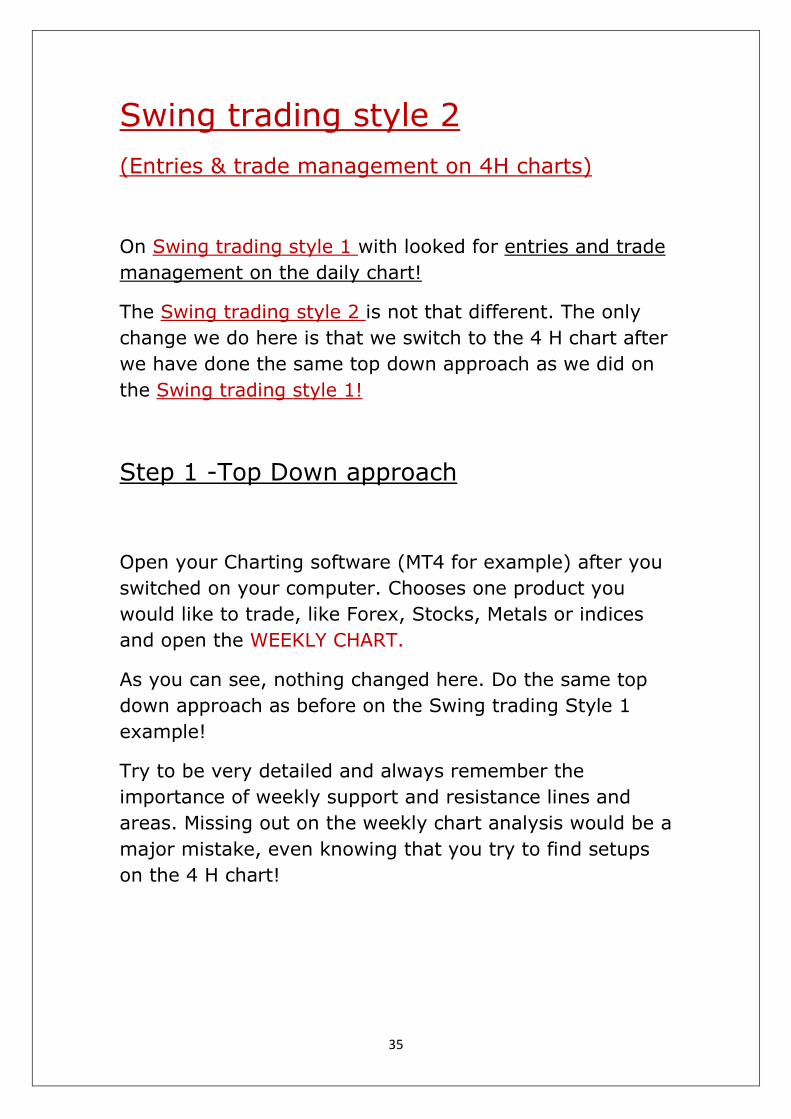
Swing trading style 2
(Entries & trade management on 4H charts)
On Swing trading style 1 with looked for entries and trade
management on the daily chart!
The Swing trading style 2 is not that different. The only
change we do here is that we switch to the 4 H chart after
we have done the same top down approach as we did on
the Swing trading style 1!
Step 1 -Top Down approach
Open your Charting software (MT4 for example) after you
switched on your computer. Chooses one product you
would like to trade, like Forex, Stocks, Metals or indices
and open the WEEKLY CHART.
As you can see, nothing changed here. Do the same top
down approach as before on the Swing trading Style 1
example!
Try to be very detailed and always remember the
importance of weekly support and resistance lines and
areas. Missing out on the weekly chart analysis would be a
major mistake, even knowing that you try to find setups
on the 4 H chart!
36
There are 3 things you want to check when doing your top
down approach and starting with the weekly chart!
A. The market behavior
You need to look for the main trend direction. It is easy to
spot a trending or ranging market on the weekly chart.
B. The actual live price direction
You need to check what the price is doing right now. What
I mean by that is, that the main trend can be up on the
weekly chart, but the price could be retracing to the
downside at the moment. In this case the weekly chart
candle would probably point down!
C. Identify major support & resistance
Look for major support and resistance areas and draw
your lines on the weekly chart. Bounces and breaks of
major support and resistance areas are most important.
After you are done with all the previous 3 steps you need
to go through with the second part of your analysis and
approach. Continue on the next page.
37
Open a 2. Chart with the same pair/product you have
chosen and chose the DAILY CHART. There are now 5
things you want to check when doing your top down
analysis on the daily chart…
E. The market behavior
You need to look for the main trend direction again, like
you did on the weekly chart. Make sure the daily chart
points into the same direction as the weekly chart. That is
mostly, but not always the case.
F. Look for major support & resistance bounces or breaks
Look for major support and resistance areas and draw
your trend lines on the daily chart. Look for clear breaks,
bounces and trend changes.
G. Wait for a 123 setups on the daily chart
Look for clear 123 trading setup on the daily chart after
identifying the trend direction.
H. Switch to your 4 H chart and look for an entry
Look for a 123 setup on the 4 H chart after a confirmed
123 setup on your daily chart. This is the conservative
way to do it.
I. Trade entry & trade management
When you get the entry signal, open 3 positions (one
trade split into 3 parts), place your stop and manage your
trade on the 4 H chart, according to the swing trading
system rules (Style 2).
38
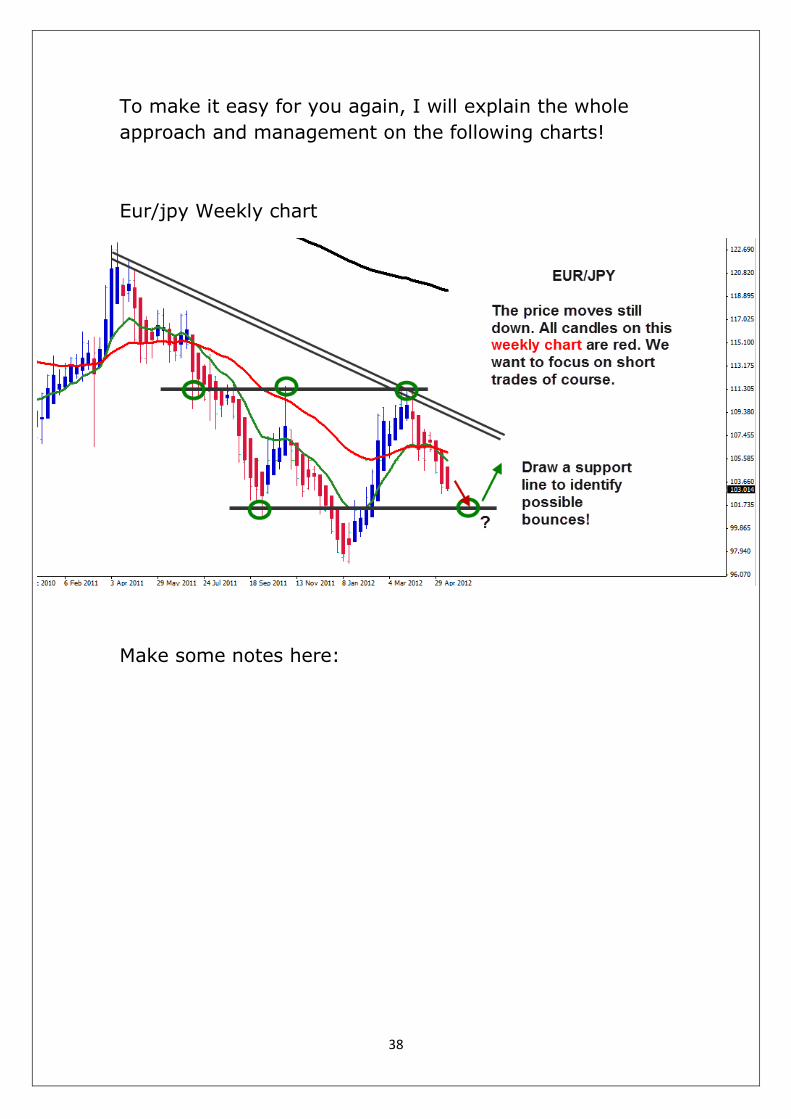
To make it easy for you again, I will explain the whole
approach and management on the following charts!
Eur/jpy Weekly chart
Make some notes here:
39
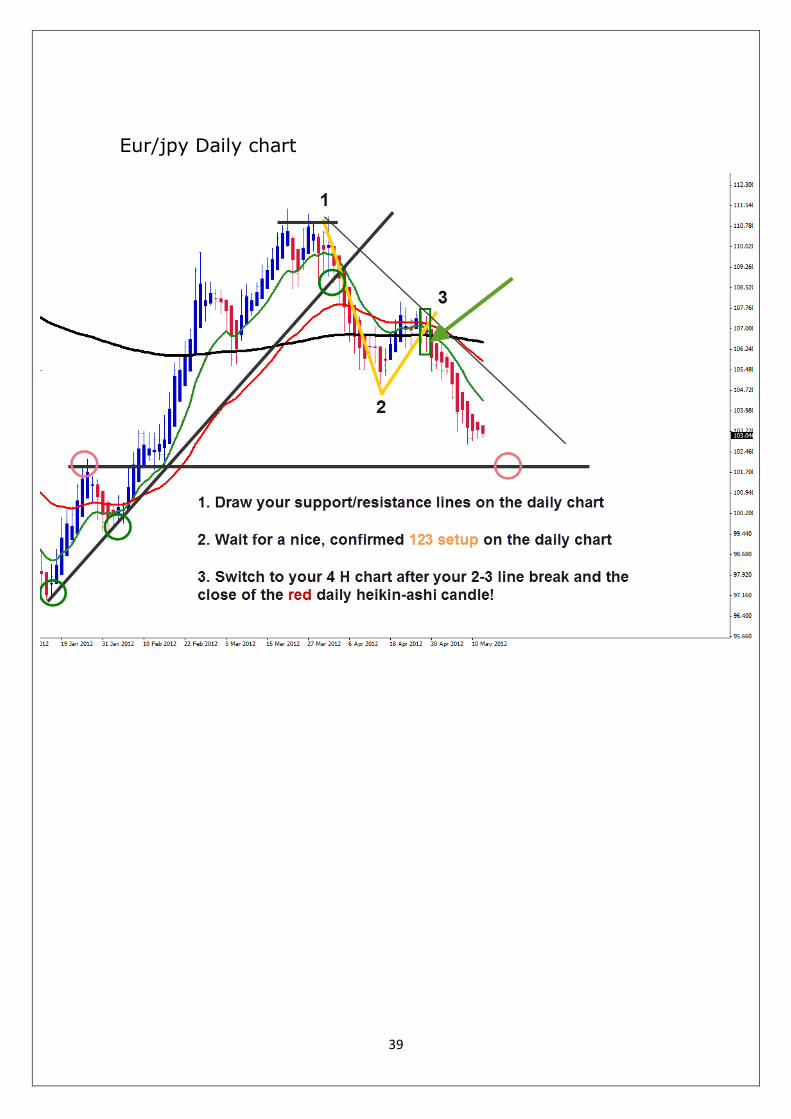
Eur/jpy Daily chart

40
Make your notes here:
41
42
Go over the previous trade example on EUR/JPY
again
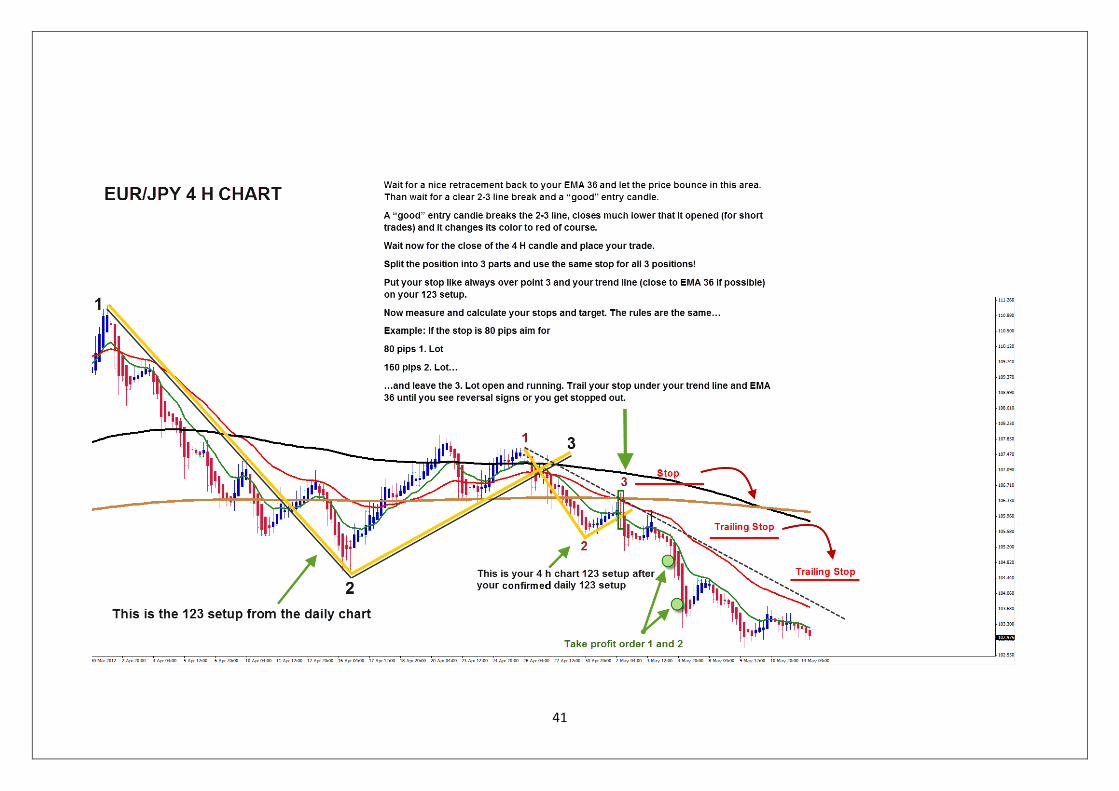
1. Your 123 setup has appeared on the 4 h chart
2. Wait for a nice retracement back to your EMA 36 and
let the price bounce in this area. Than wait for a clear 2-3
line break and a “good” entry candle.
3. A “good” entry candle breaks the 2-3 line, closes much
lower than it opened (for short trades and the opposite for
long trades) and it changes its color to red of course.
4. Wait now for the close of the 4 H candle and place your
trade.
5. Split the position into 3 parts and use the same stop for
all 3 positions!
6. Put your stop like always over point 3 and your trend
line (close to EMA 36 if possible) on your 123 setup.
7. Now measure and calculate your stops and target. The
rules are the same…
Example: If the stop is 80 pips aim for
80 pips 1. Lot
160 pips 2. Lot…
…and leave the 3 Lot open and running. Trail your stop
under your trend line and EMA 36 until you see reversal
signs or you get stopped out.
43
This was the basic swing trade entry and management
explanation. It is now time to practice on some charts.
Sometimes setups are easy to spot, if you have done your
top down approach correctly. But there are some
occasions where you will have trouble to decide whether a
setup looks good or not. You won’t be sure if you should
trade or rather stay out for the time being.
Now, to boost your confidence and knowledge in this
matter, I will show you many chart exercises that will help
you to practice your skills in the following chapter. You will
be able to distinguish between great, good, fair and bad
trading setups. You will learn to compare aggressive and
conservative trades, when to stay out of trades and when
to take action.
You will learn how to trail your stop, how to maximize
your profits and how to manage your trade in case it
moves against your expectations.
Before you start with the exercises, make sure you print
out all the charts and use a pencil to draw your trend lines
and write your comments.
Practice on each and every chart more than just once and
make sure you really understood everything on a
particular example before your switch to the next one.
Take your time and repeat!
If you are tired, take a break and come back later with a
clear mind to continue practicing
Have fun!
44
We start with the “swing trading style one” and that
means 2 charts to practice. I mean a weekly chart for the
top down approach followed by a daily chart to look for a
trade.
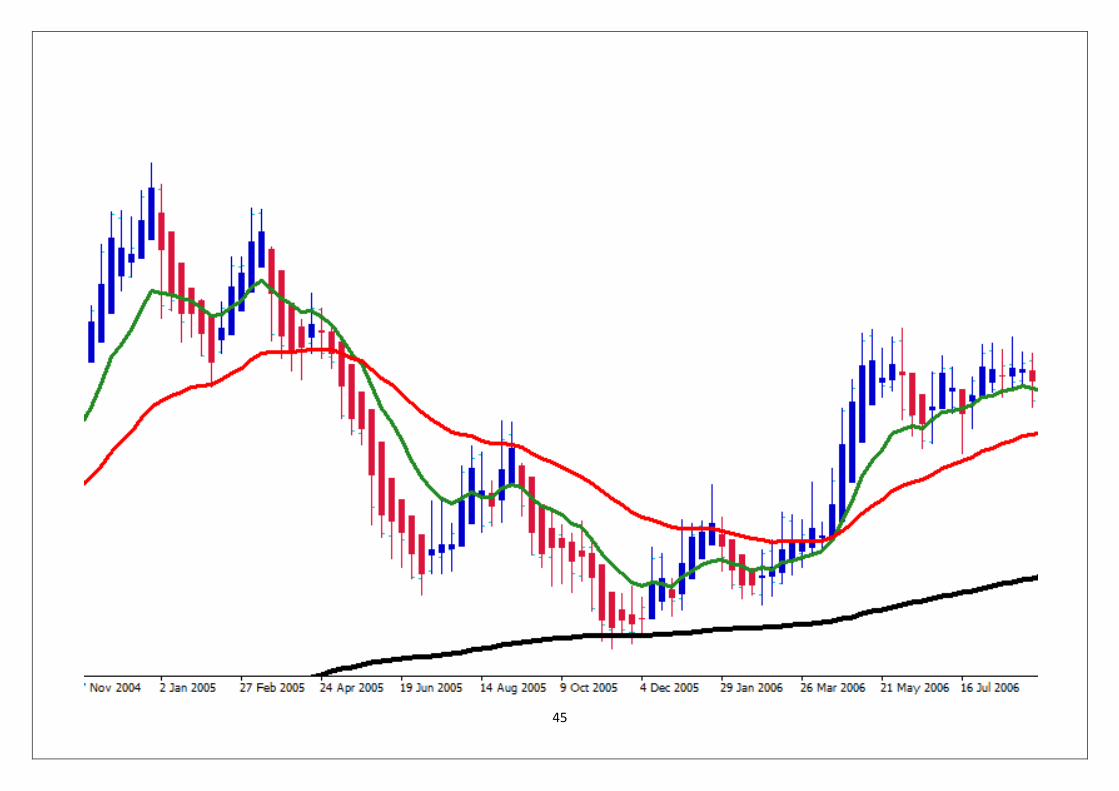
1. Example: EUR/USD
A. The Spartanfx MT4 template showing a EUR/USD
weekly chart.
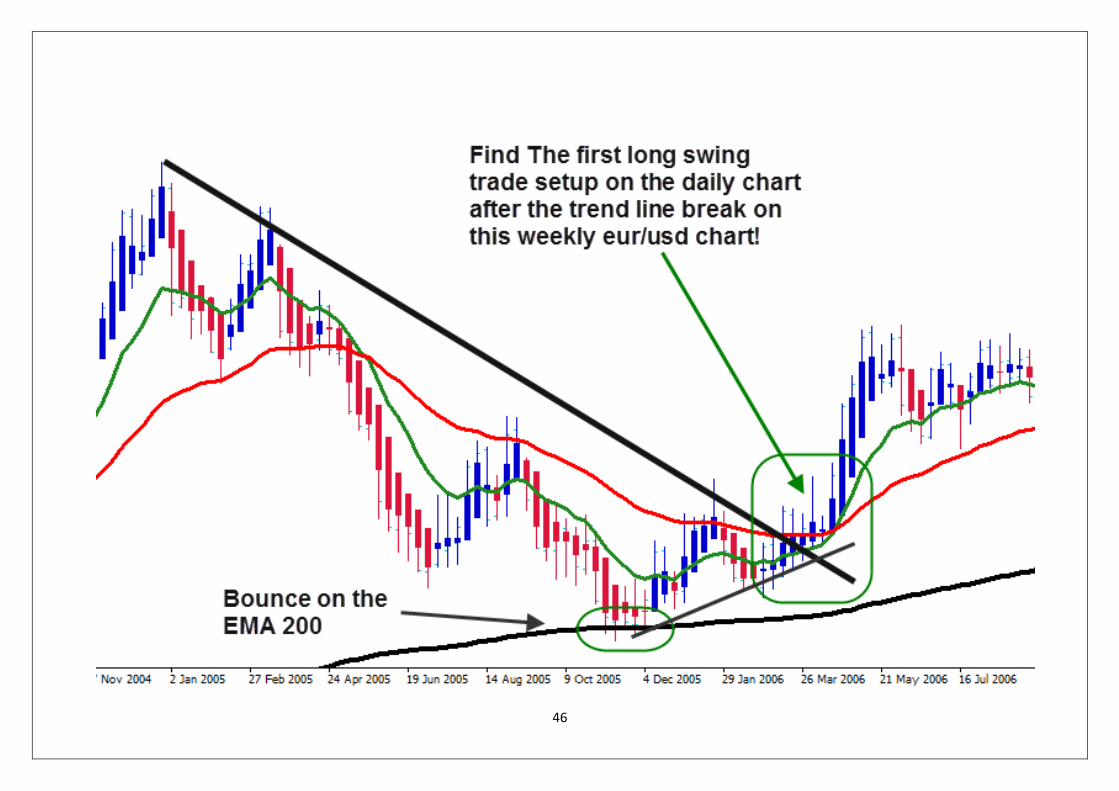
B. The Spartanfx MT4 template showing a EUR/USD
weekly chart with the important trend lines.
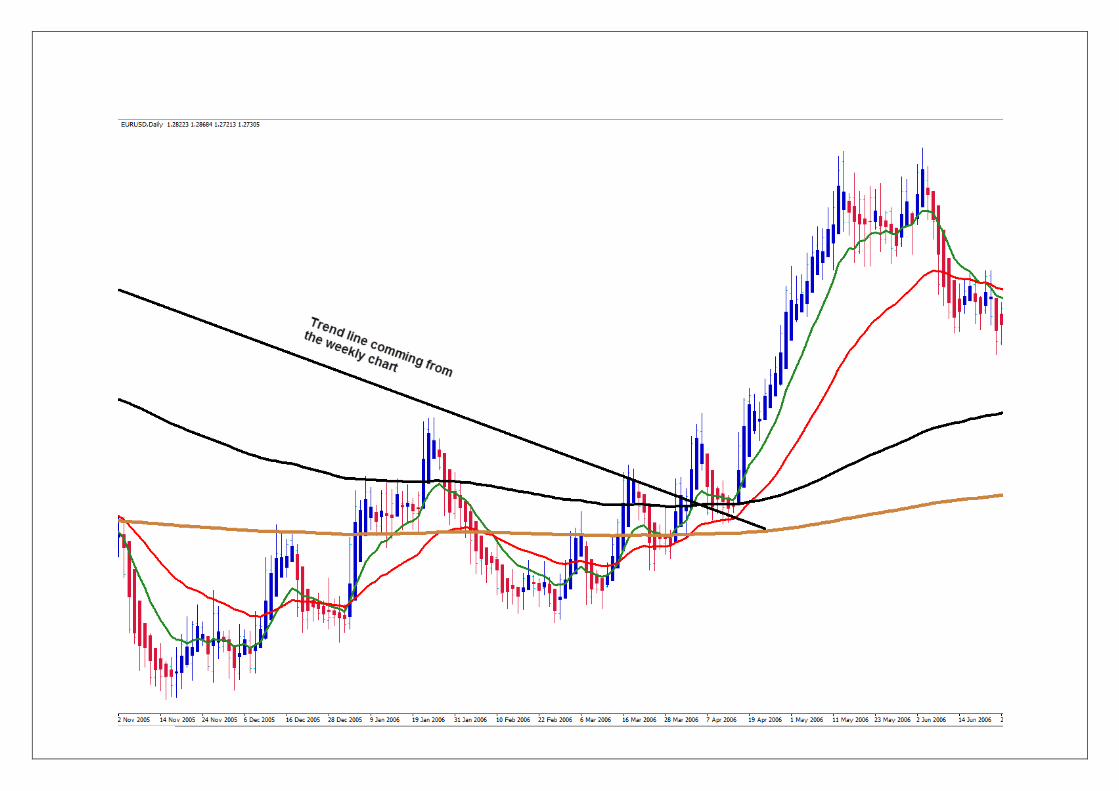
C. The Spartanfx MT4 template showing a EUR/USD
daily chart.
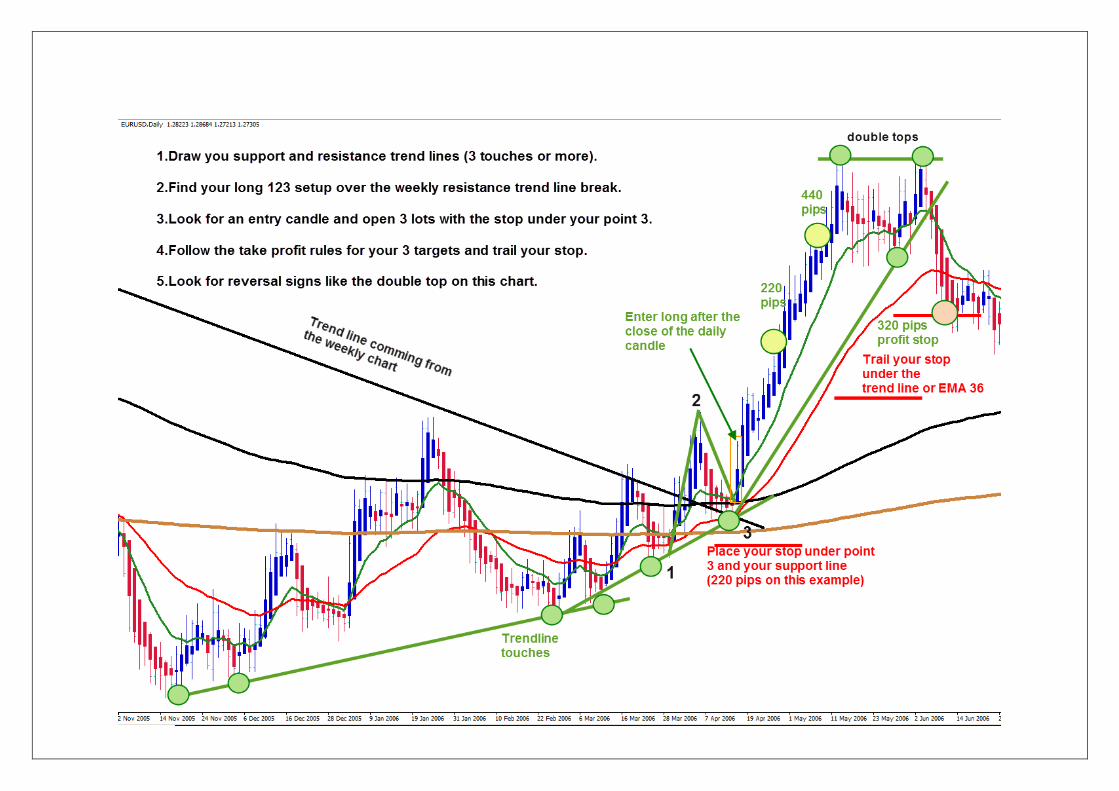
D. The Spartanfx MT4 template showing a EUR/USD
daily chart with all support and resistance trend
lines, the setup, the trade entry, the stop, and the
targets.
I want you to study these 4 charts and use them as an
example. The next exercises will be without any trend
lines or setups. I want you to draw all the support or
resistance lines, setups, stops, trailing stops and targets
yourself!
You will find the solution for every exercise if you switch
to the next page. Please don’t cheat on yourself by
watching at the solutions first. Draw your lines first and
try to figure out all the details yourself. Only after you
have tried and think you are satisfied with your work, go
and compare your results with mine. You can move to the
next exercise if your results match my analysis by (85-
95%). If not, go back and study the basics again.
45
46
47
48
49
This was the standard swing trade entry and management
explanation. It is now time to practice on some charts.
Sometimes setups are easy to spot, if you have done your
top down approach correctly.
But there are some occasions where you will have trouble
to decide whether a setup looks good or not. You won’t be
sure if you should trade or rather stay out for the time
being.
Now, to boost your confidence and knowledge in this
matter, I will give you many chart exercises that will help
you to practice your skills in the following chapter.
You will be able to distinguish between great, good, fair
and bad trading setups. You will learn to compare
aggressive and conservative trades, when to stay out of
trades and when to take action.
You will learn how to trail your stop, how to maximize
your profits and how to manage your trade in case it
moves against your expectations.
Before you start with the exercises, make sure you print
out all the charts and use a pencil to draw your trend lines
and write your comments.
Practice on each and every chart more than just once and
make sure you really understood everything on a
particular example before your switch to the next one.
Take your time and repeat!
If you are tired, take a break and come back later with a
clear mind to continue practicing
50
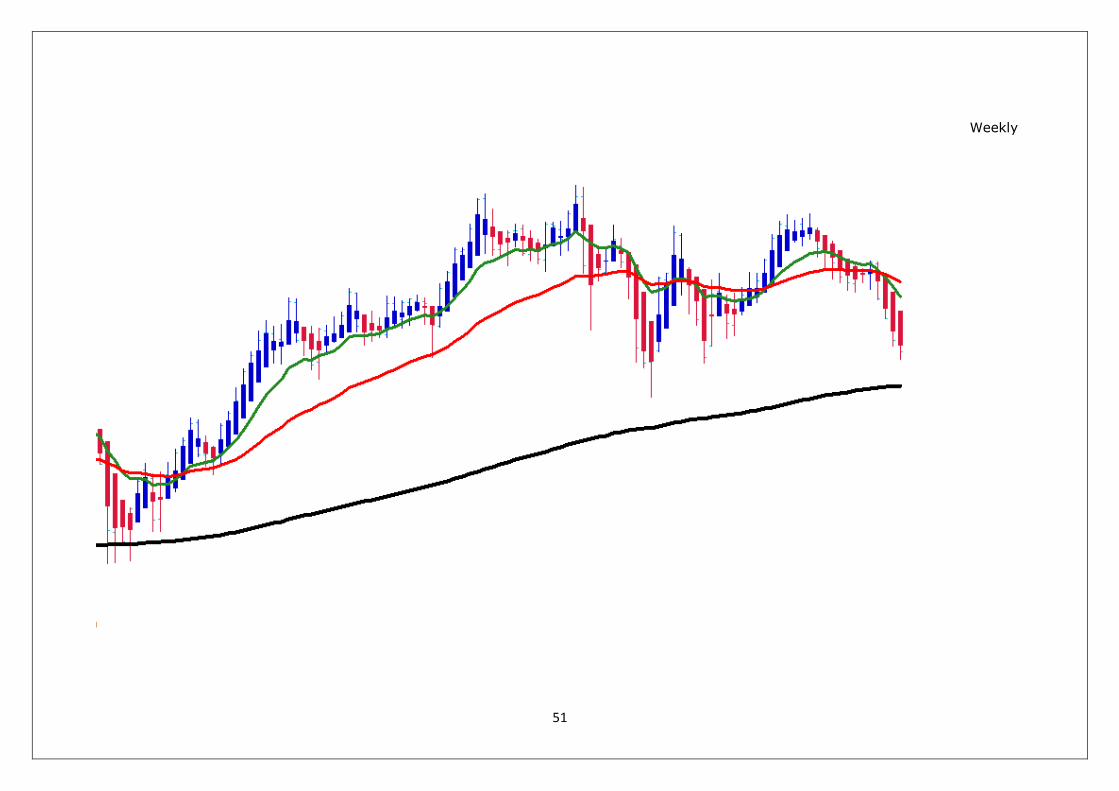
Practice on the charts!
Start with the weekly charts and
afterwards find setups at the daily
charts. Try to manage the trades with
stops, trailing stops and targets!
Have fun!
51
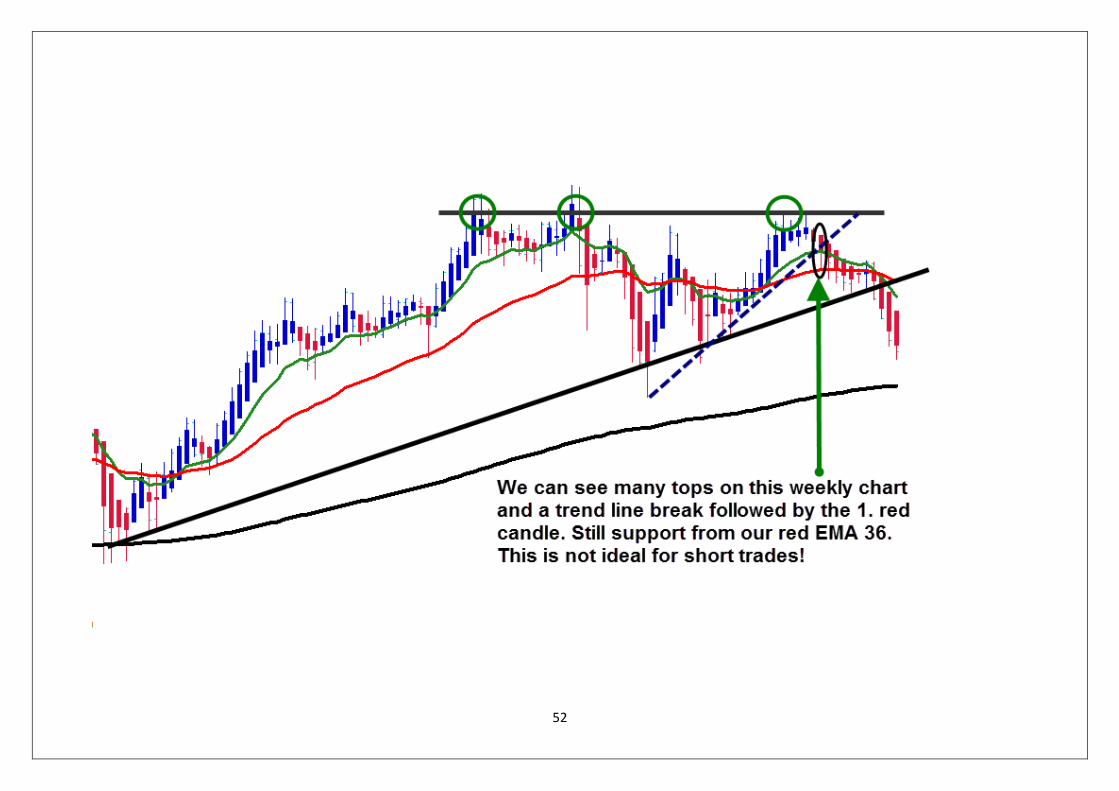
Weekly
52
53
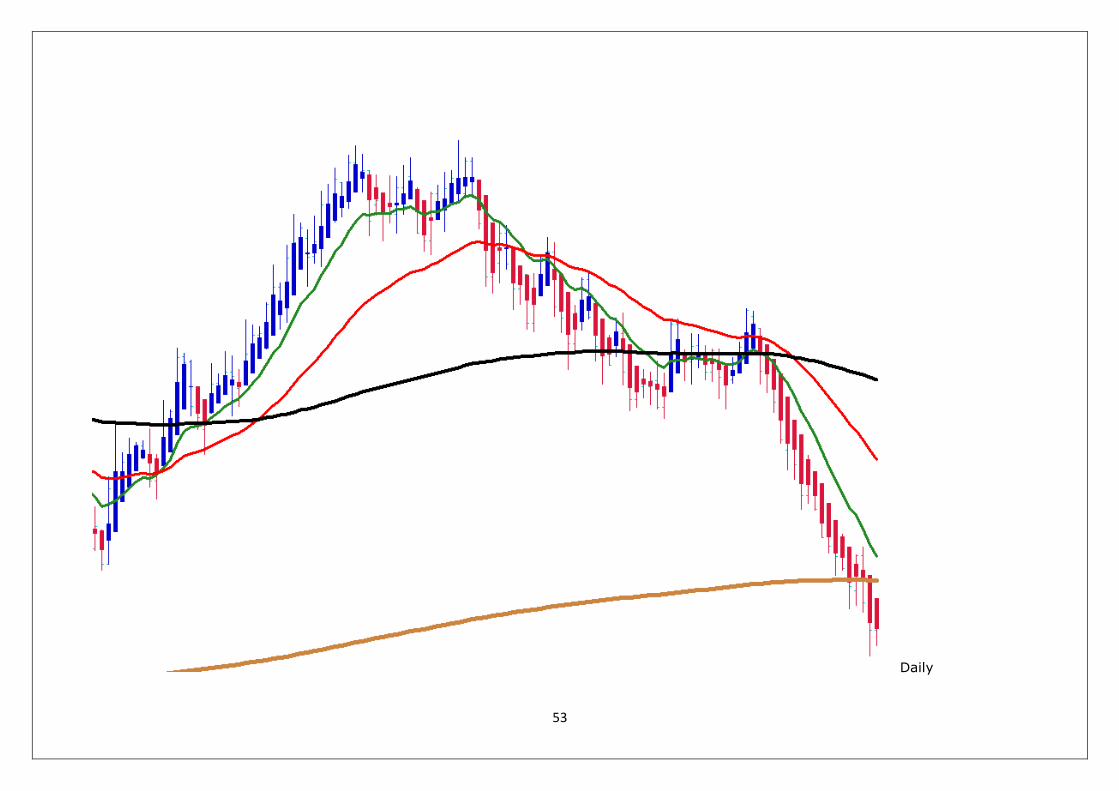
Daily
54
55
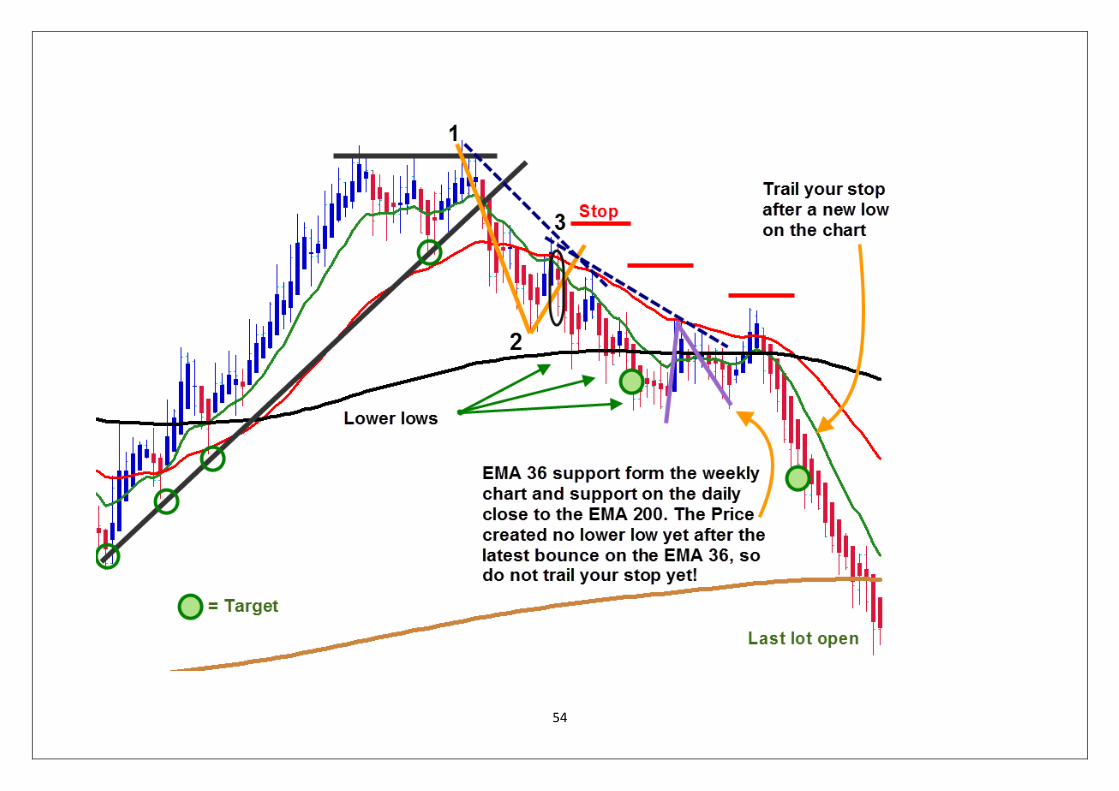
The previous example on the Aud/Usd was not that easy to start with, but you should be able to
understand the importance of lower lows, lower highs and trades close to support areas now. Let
us continue with the next example on Silver now.
56
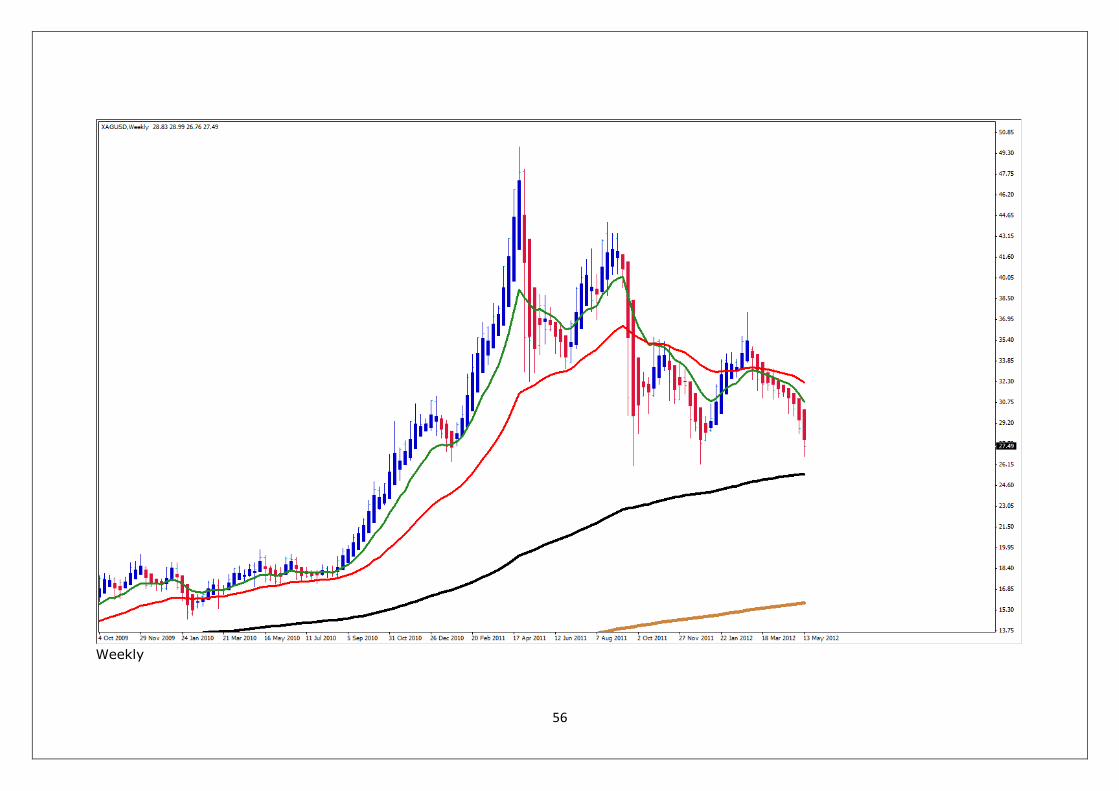
Weekly
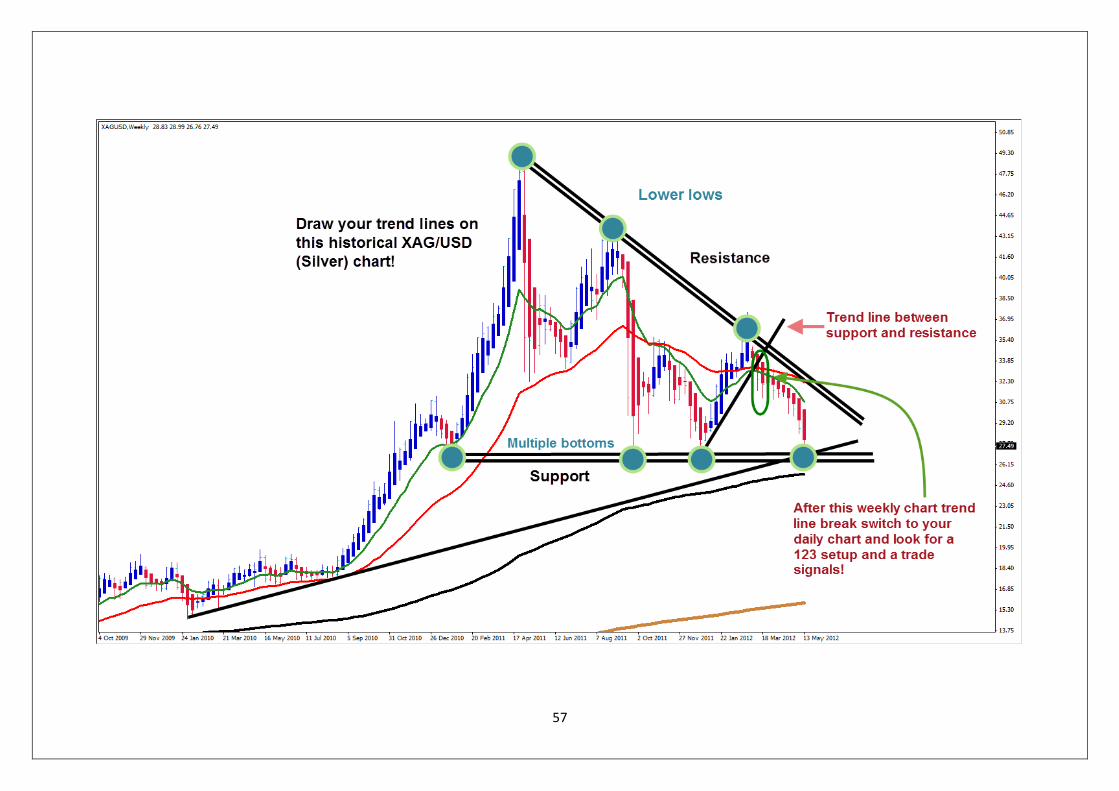
57
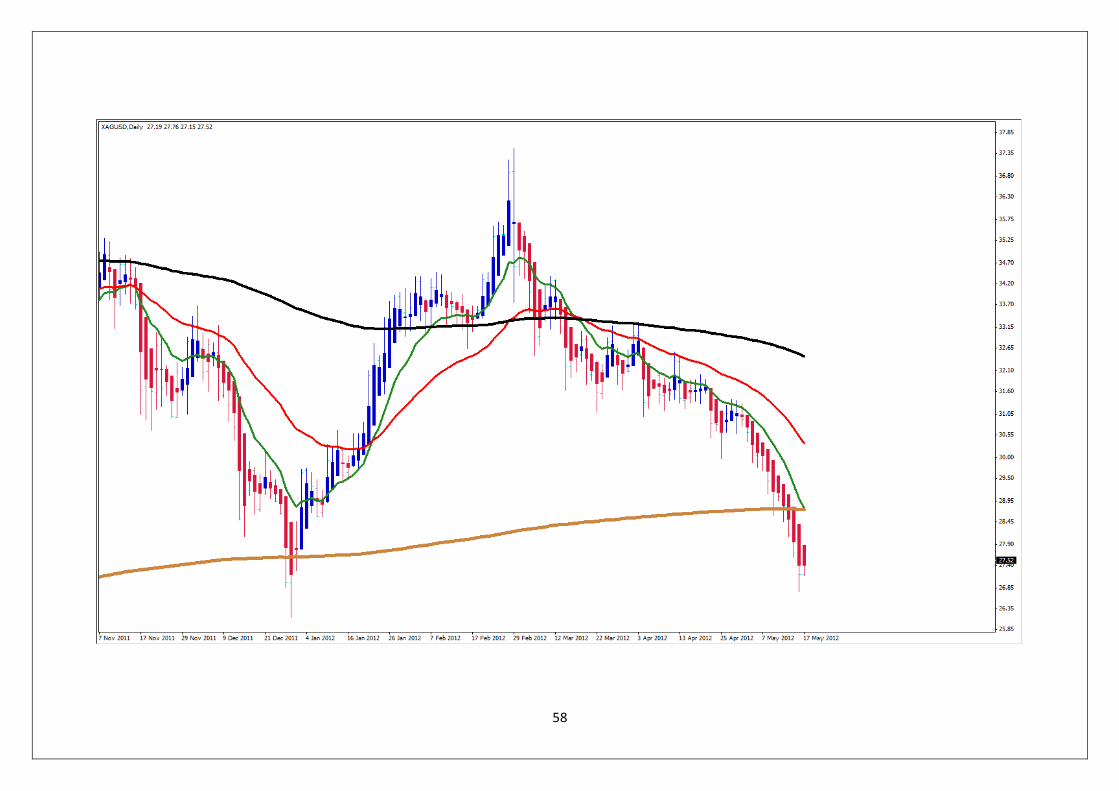
58
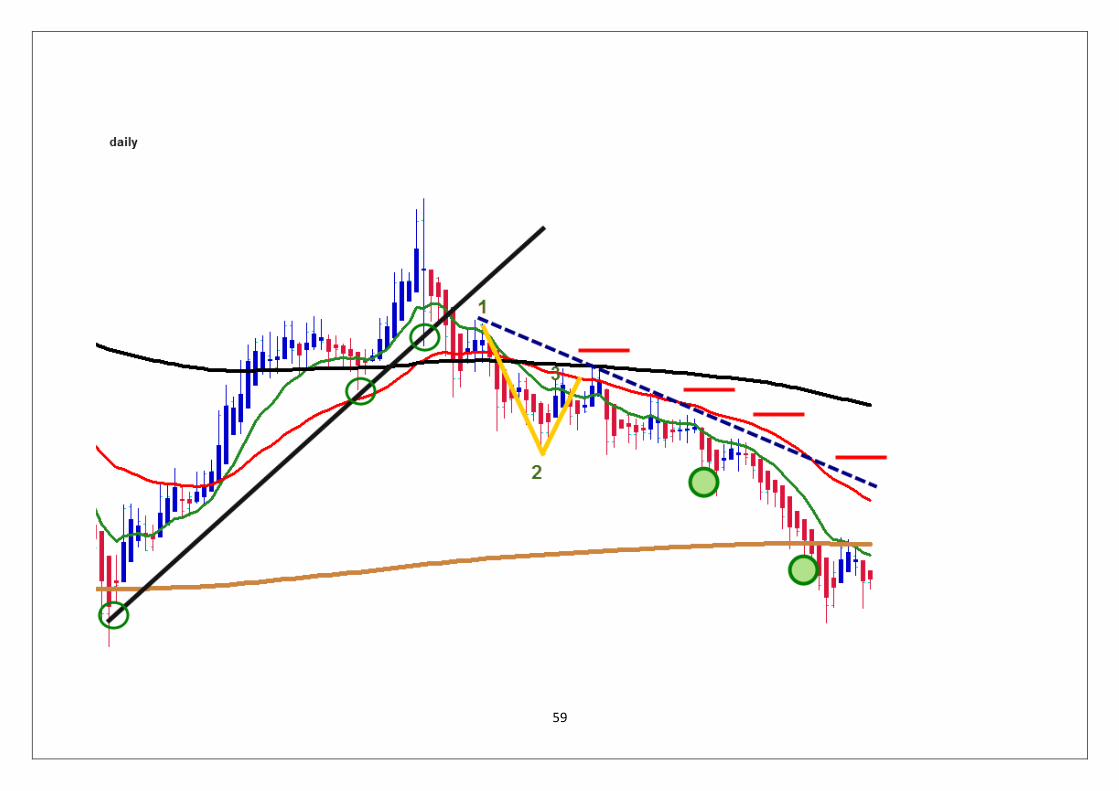
59
60
61
62
63
64
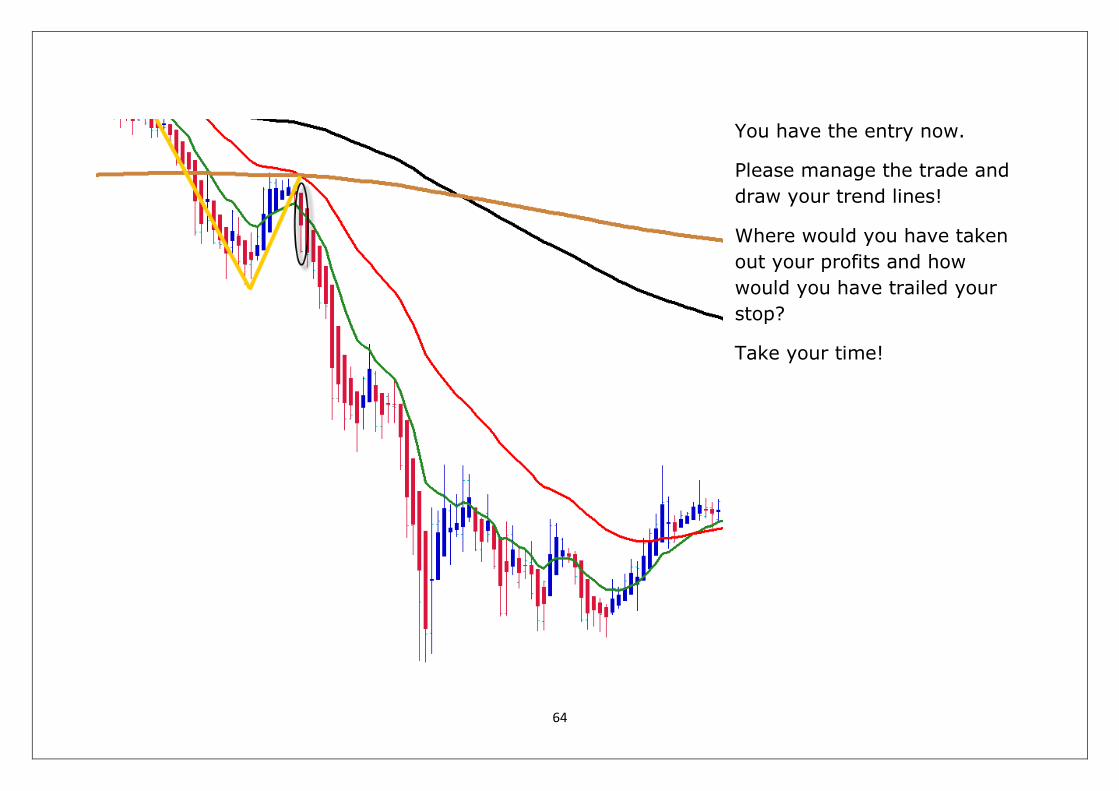
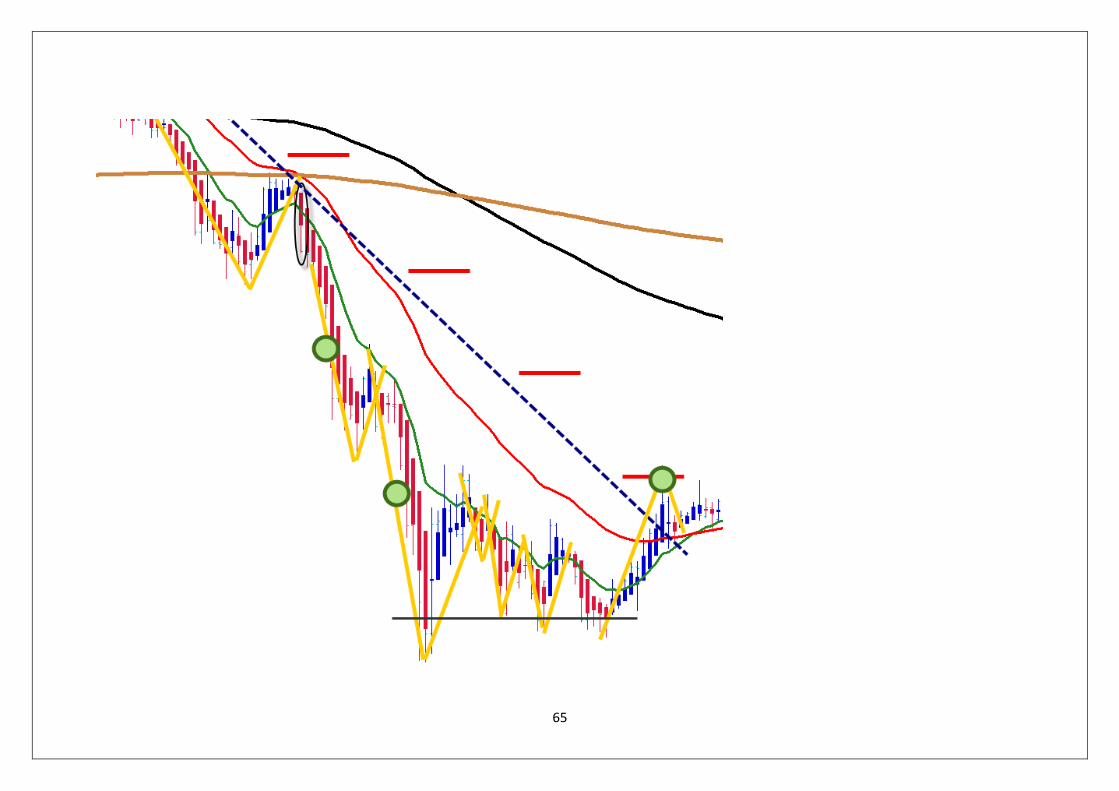
You have the entry now.
Please manage the trade and
draw your trend lines!
Where would you have taken
out your profits and how
would you have trailed your
stop?
Take your time!
65
66
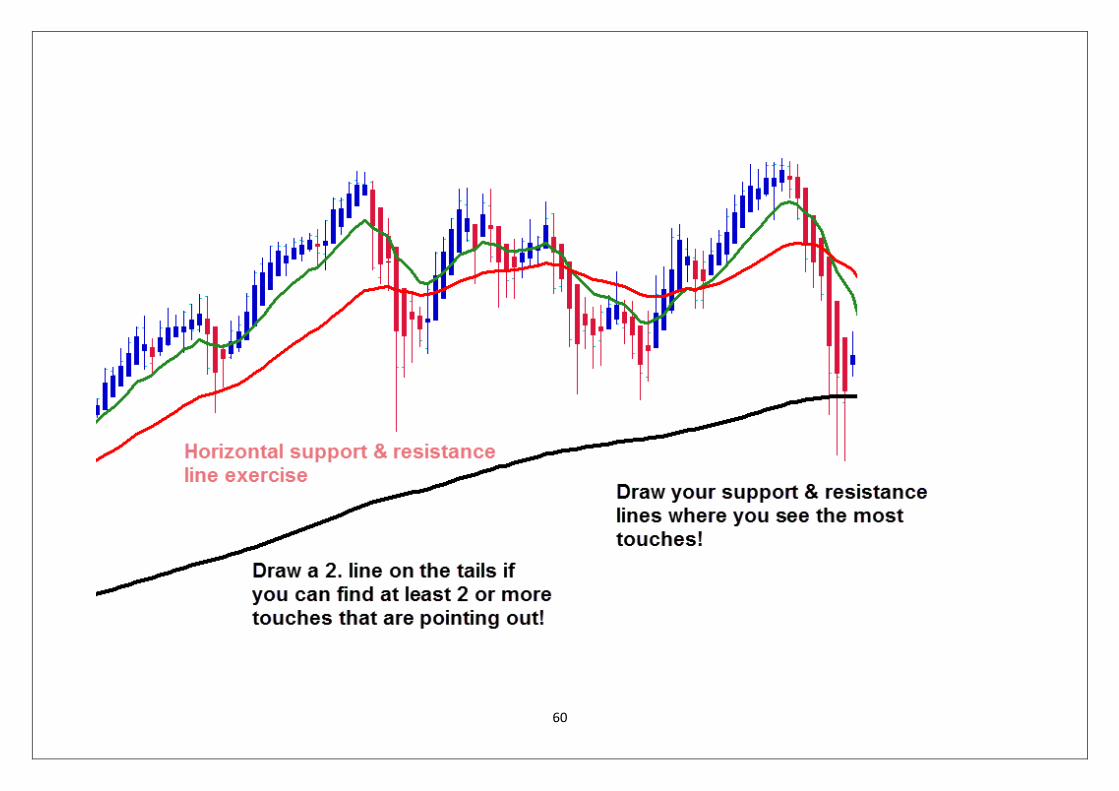
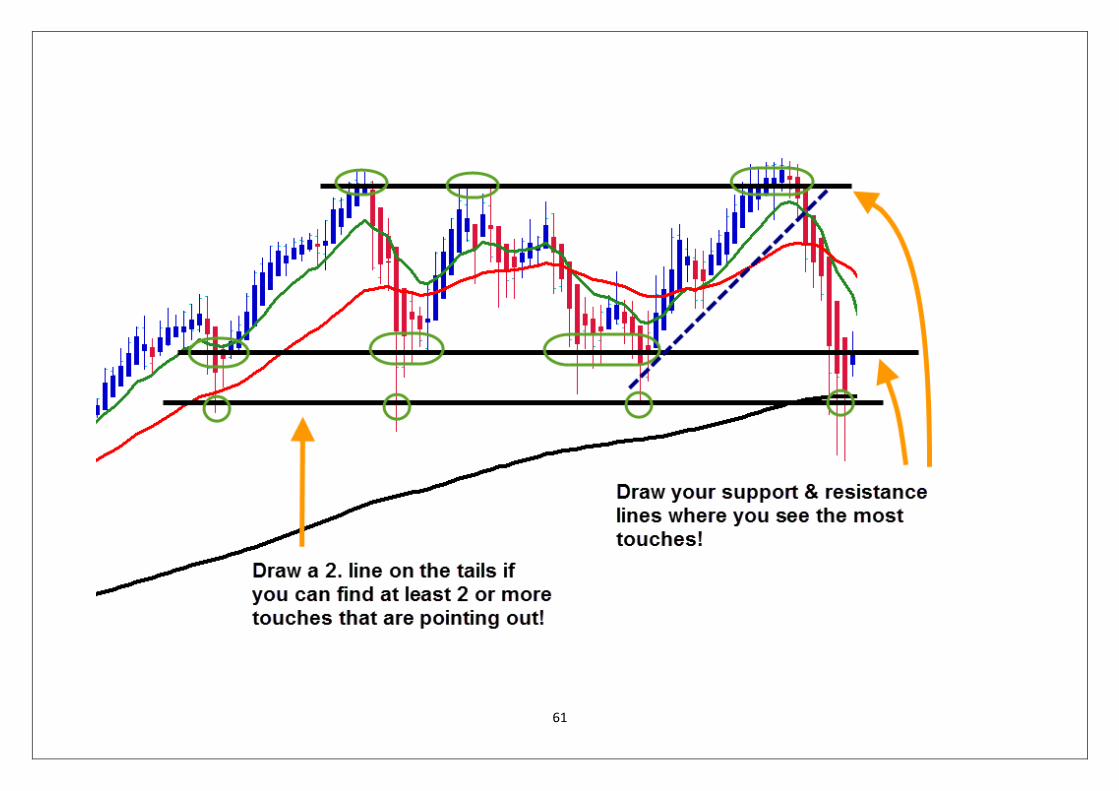
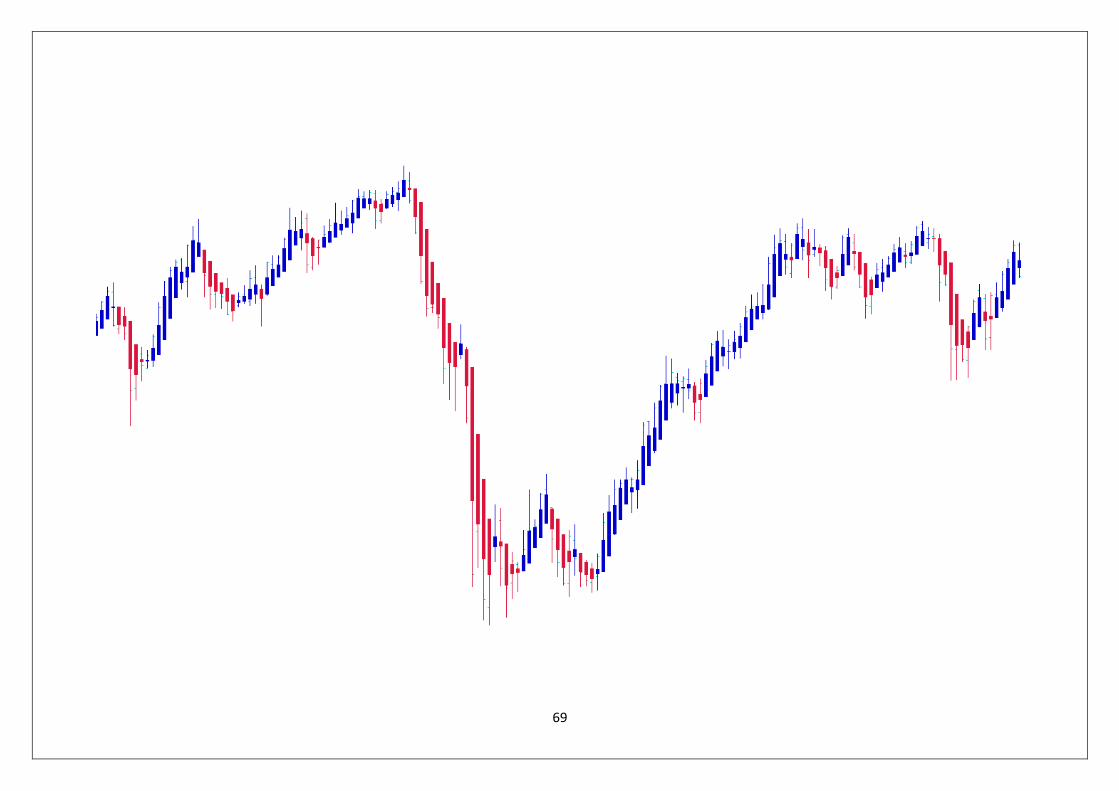
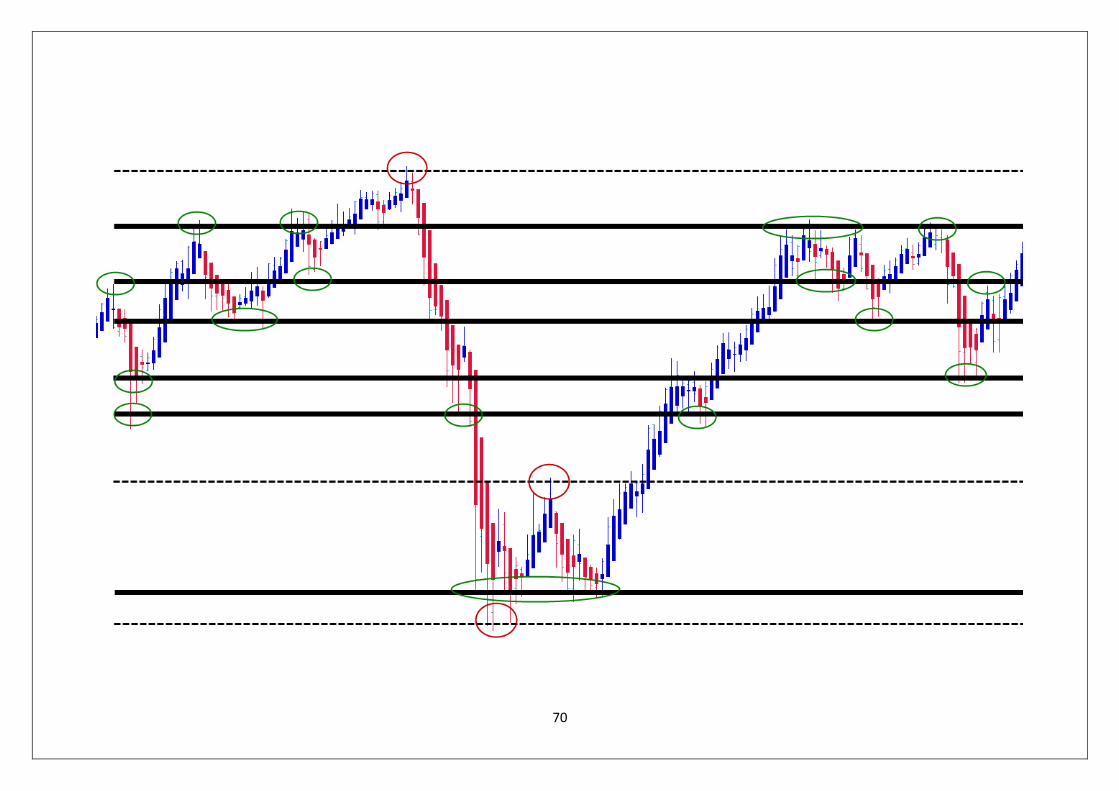
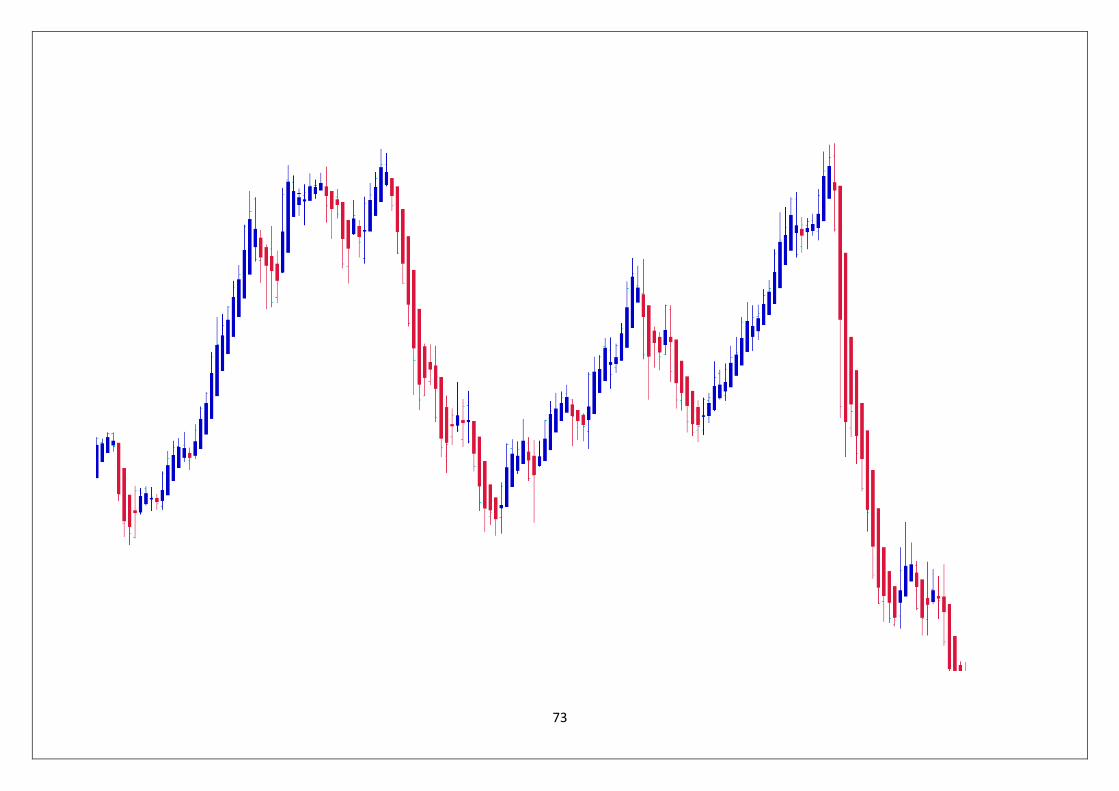
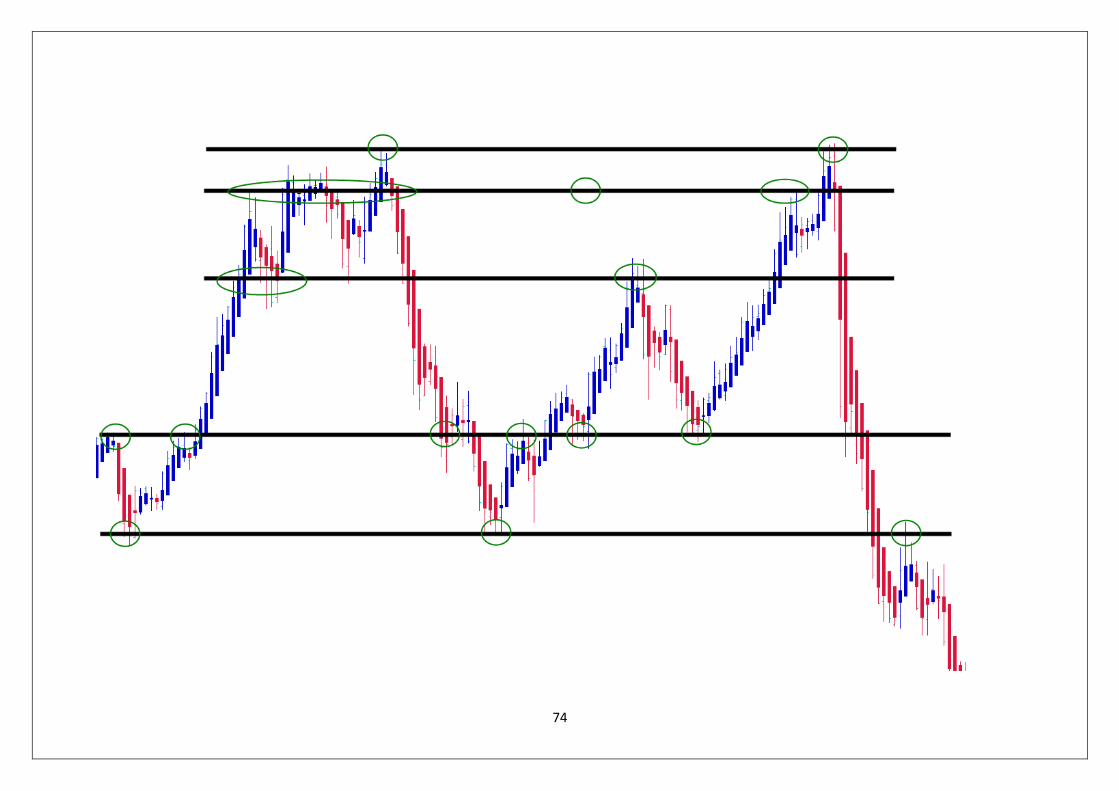
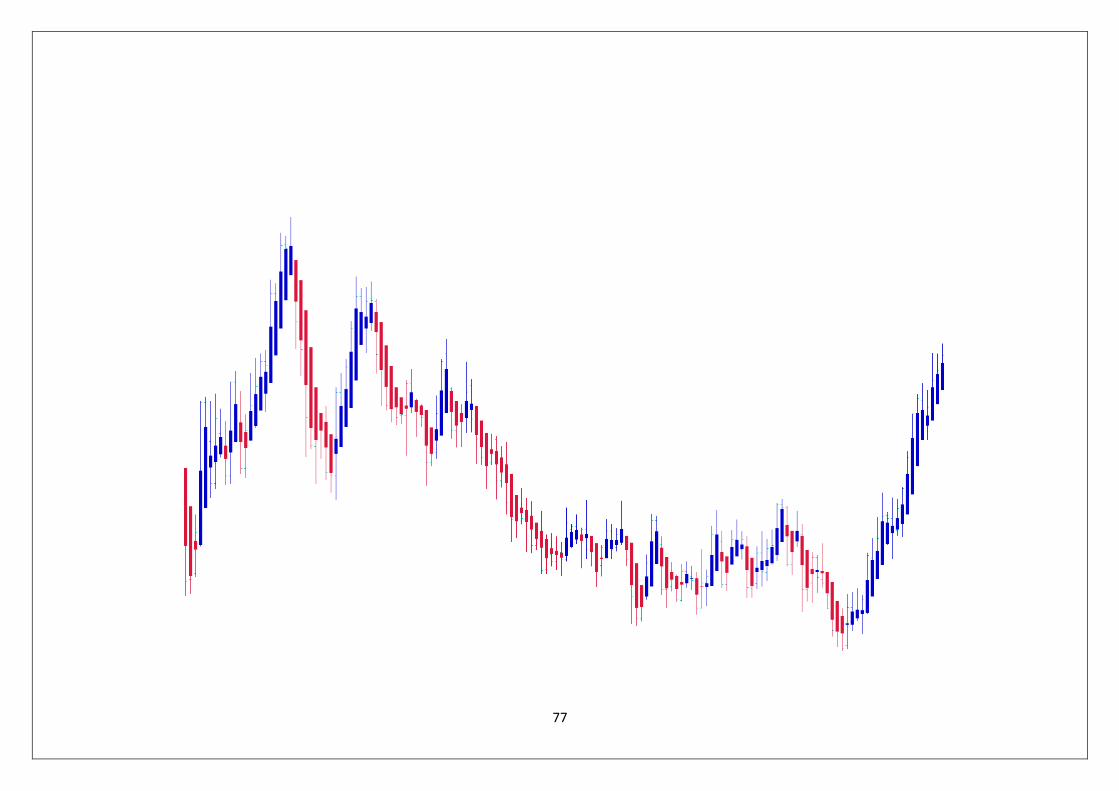
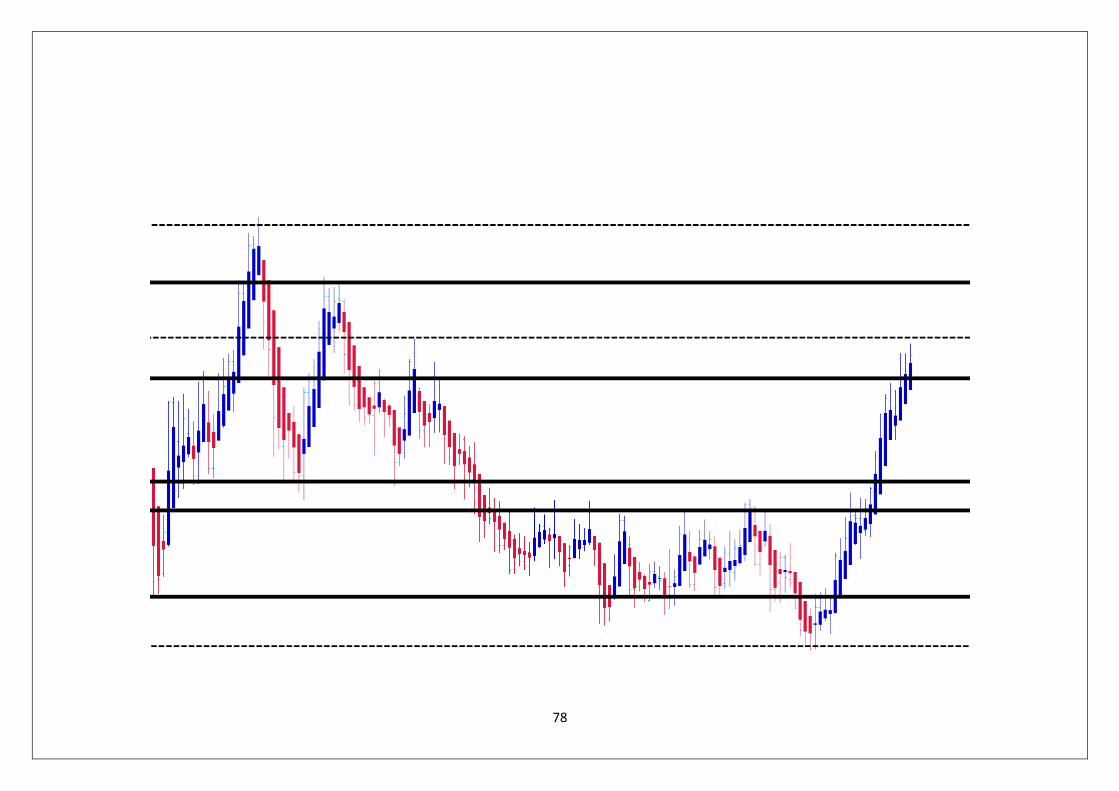
Practice Horizontal support and resistance Lines
67
68
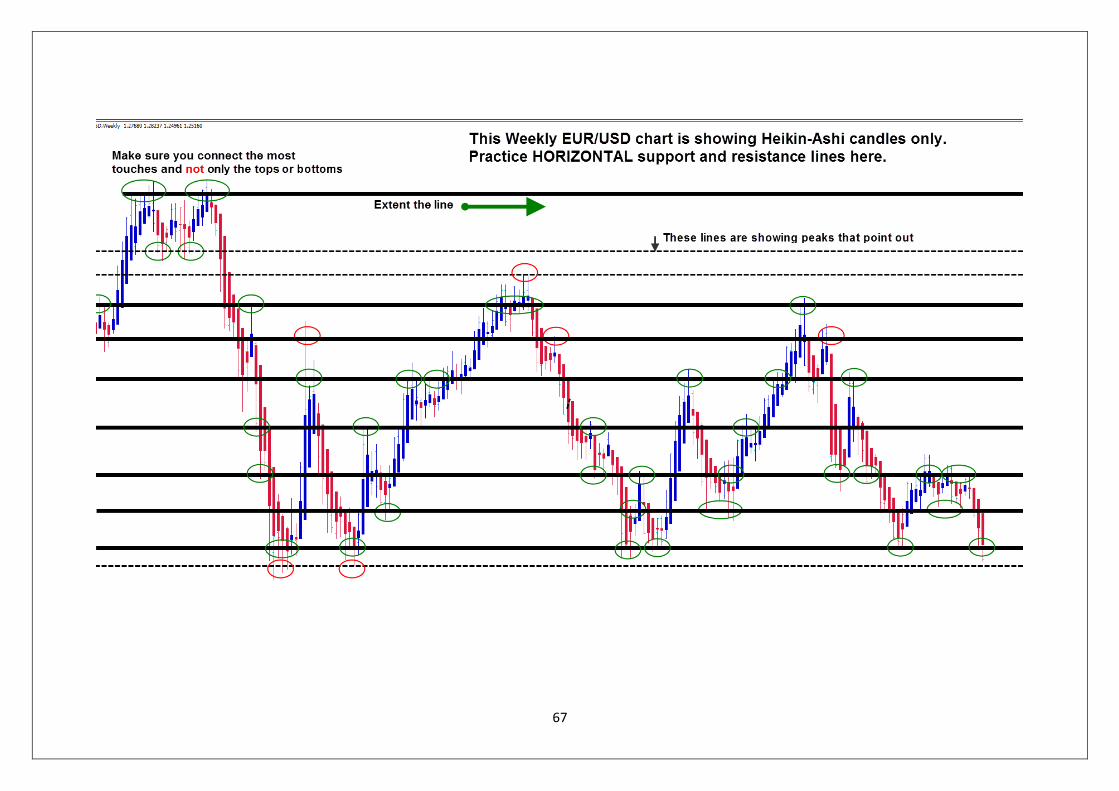
I draw all important horizontal support and resistance lines on the previous chart to demonstrate
how it is done. Remember that this was a weekly chart and after you have done this on one pair
correctly, you probably won’t have to do this again for weeks to come. Just don’t delete the lines
on your charting software, so you can always come back and check.
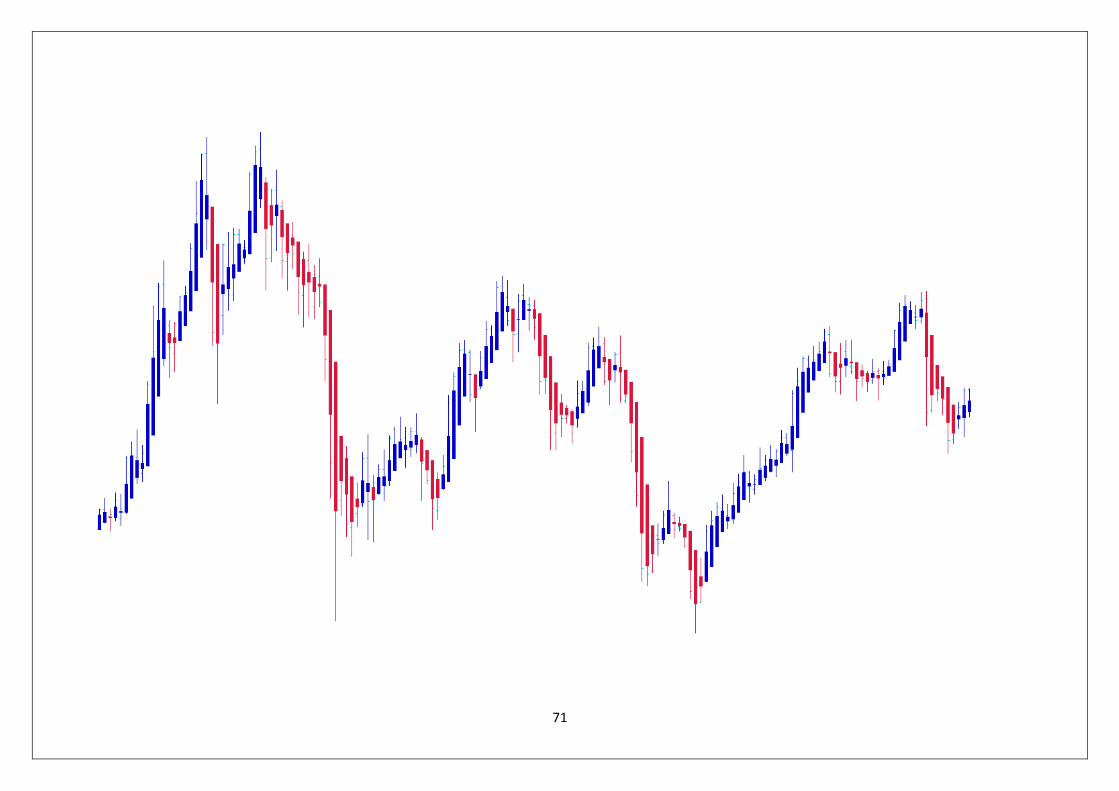
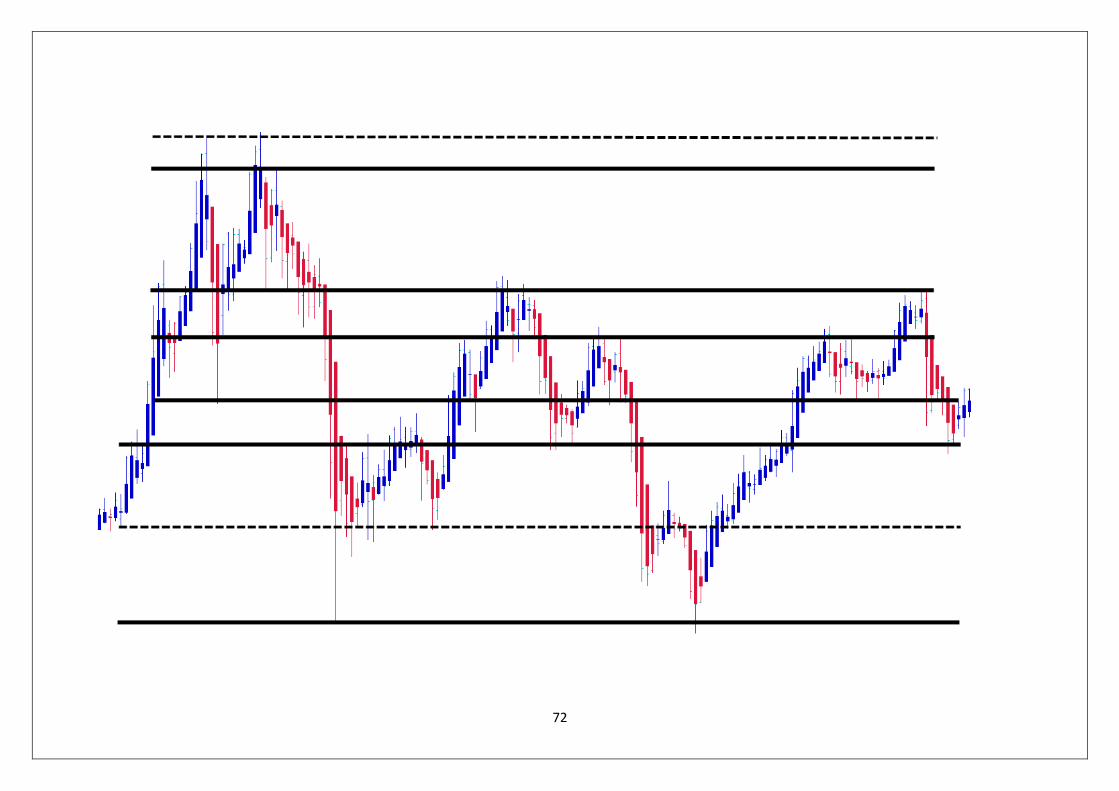
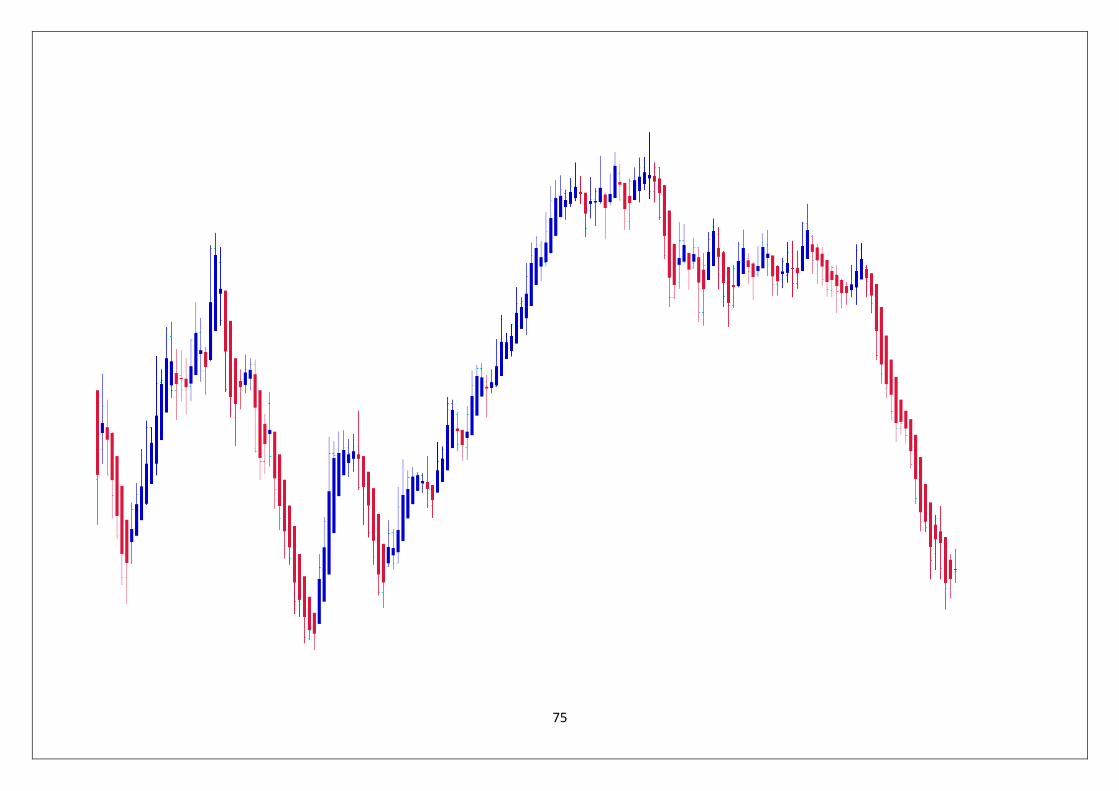
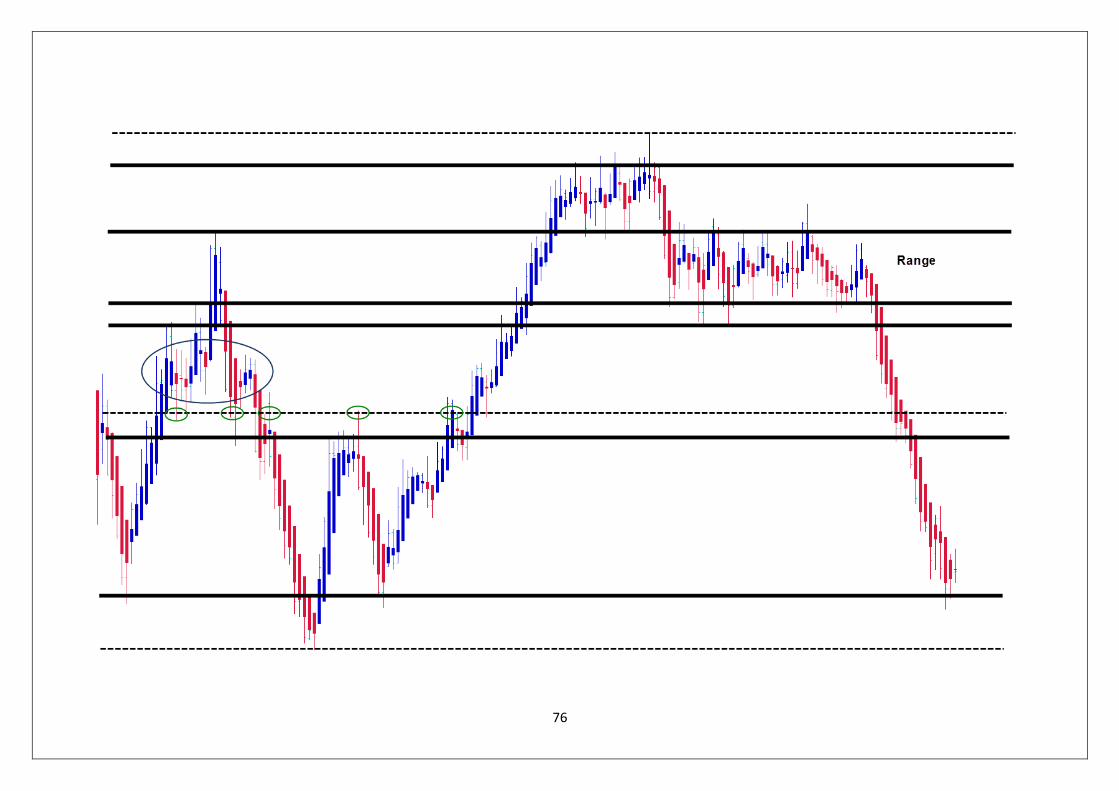
Please practice yourself on the following 5 weekly and daily chart examples.
The first chart of each exercise will be pure without any lines, so you can draw them yourself. The
second chart will show you the solutions. Make sure you don’t look at the solutions before drawing
your own lines first.
Have fun!
69
70
71
72
73
74
75
76
77
78
79
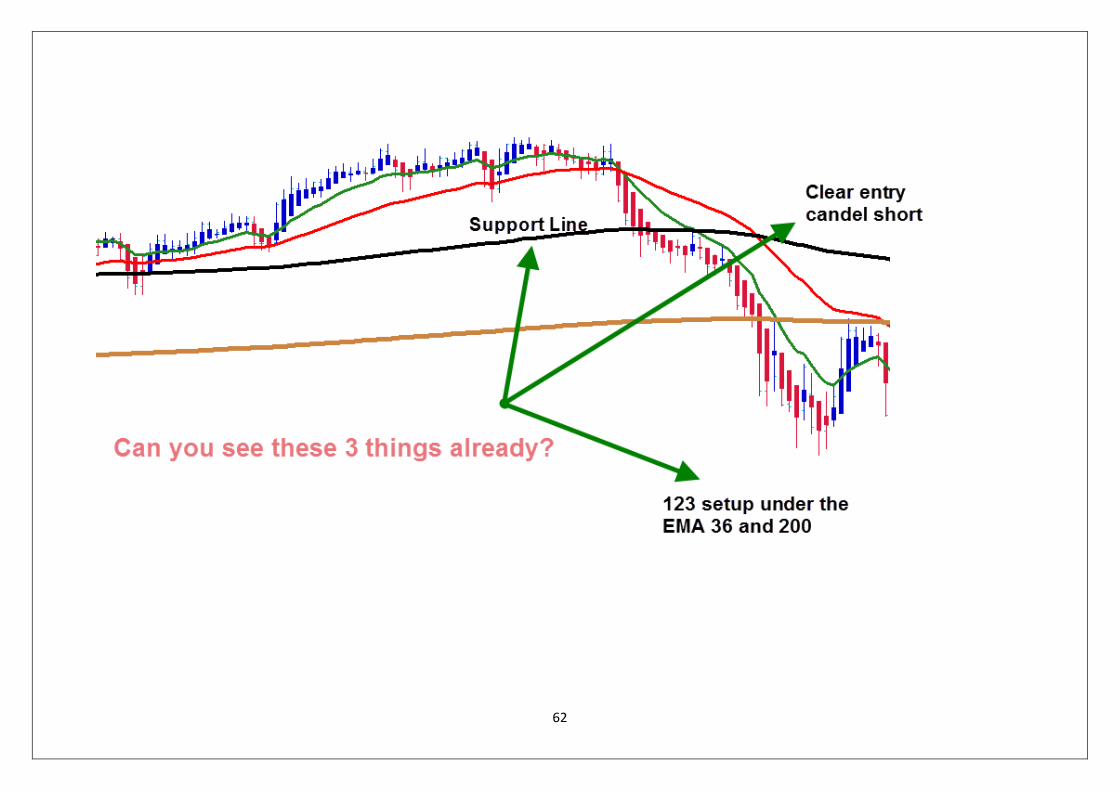
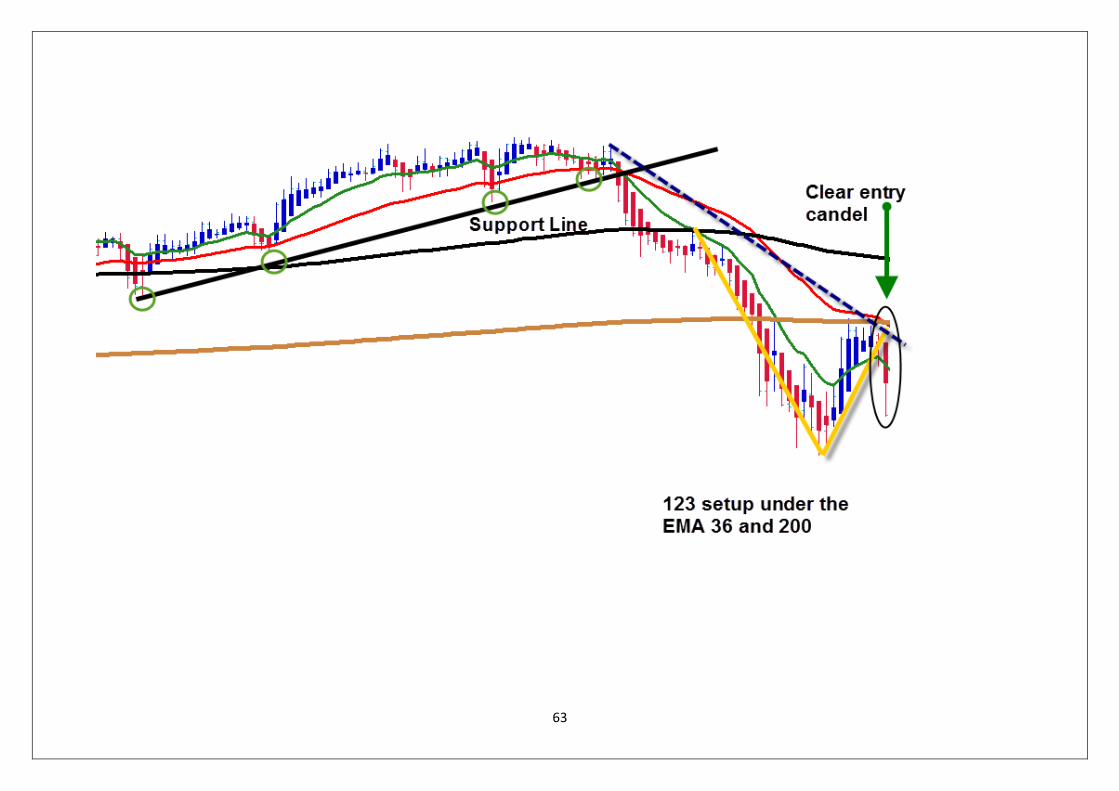
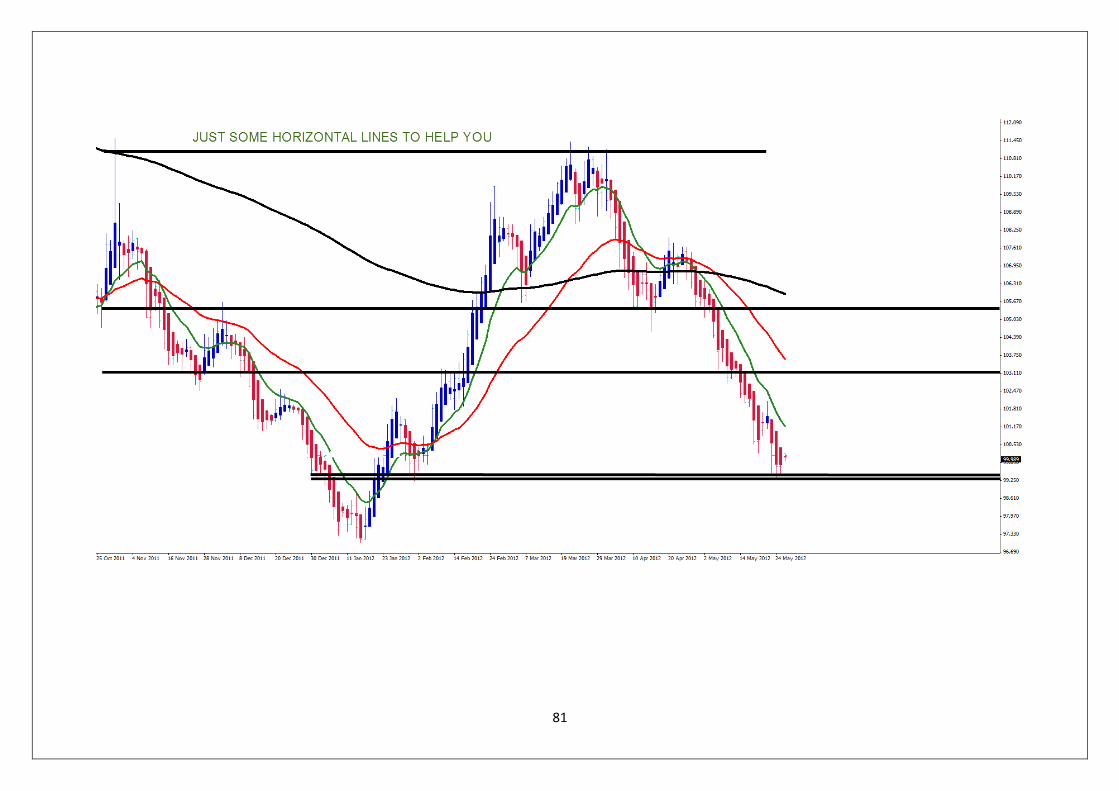
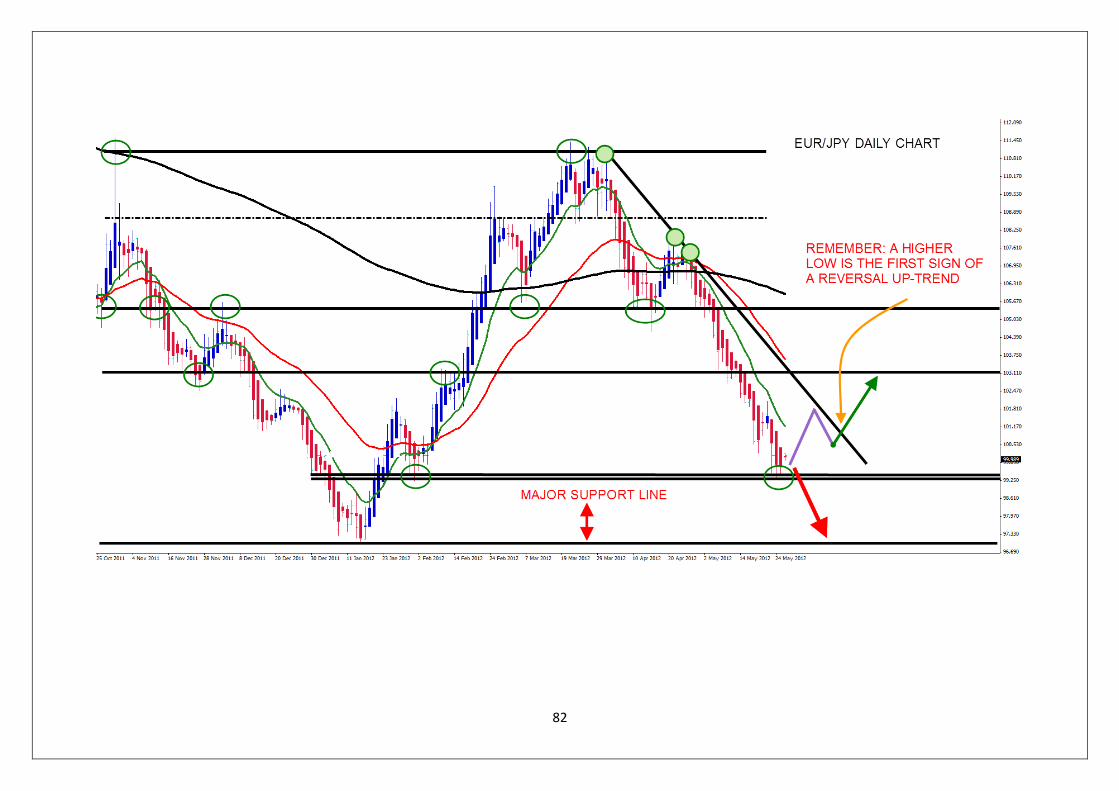
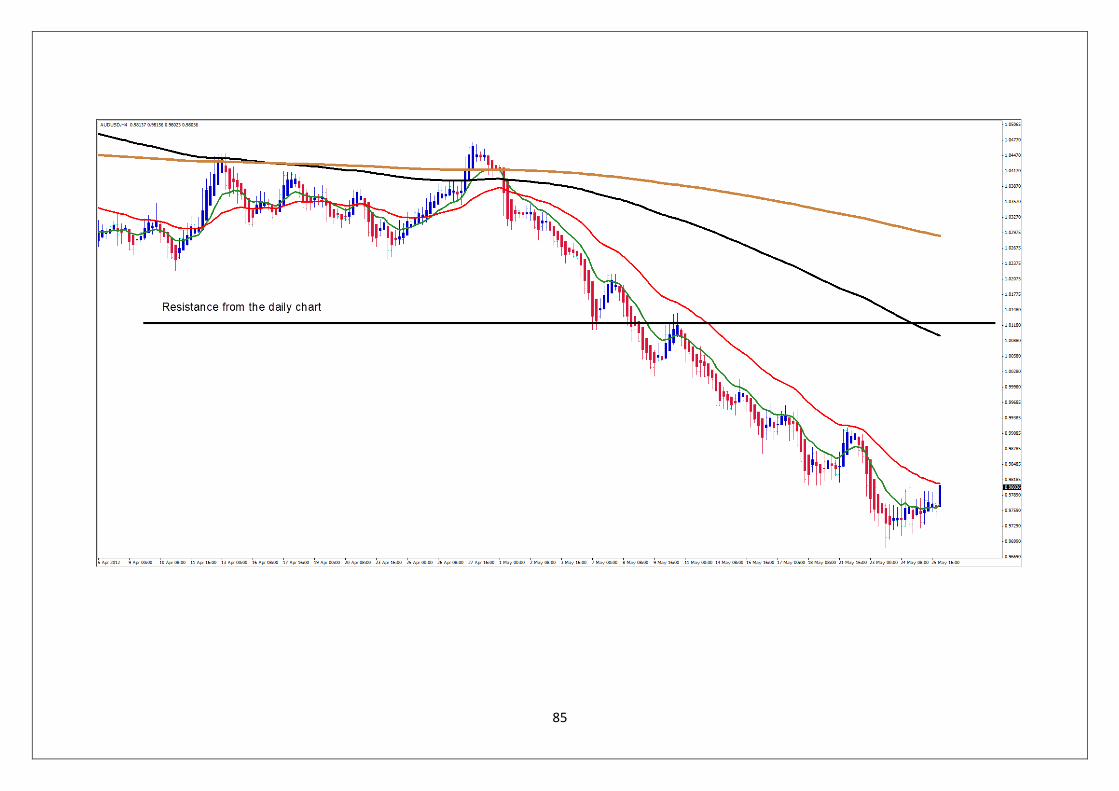
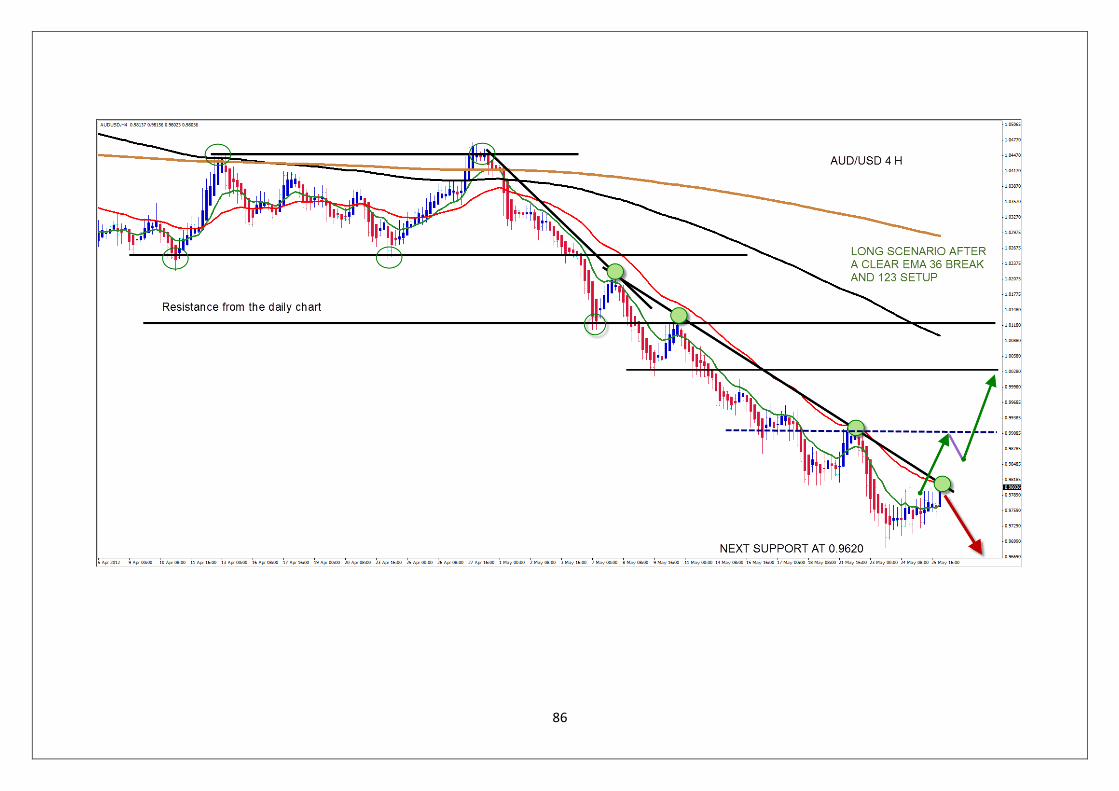
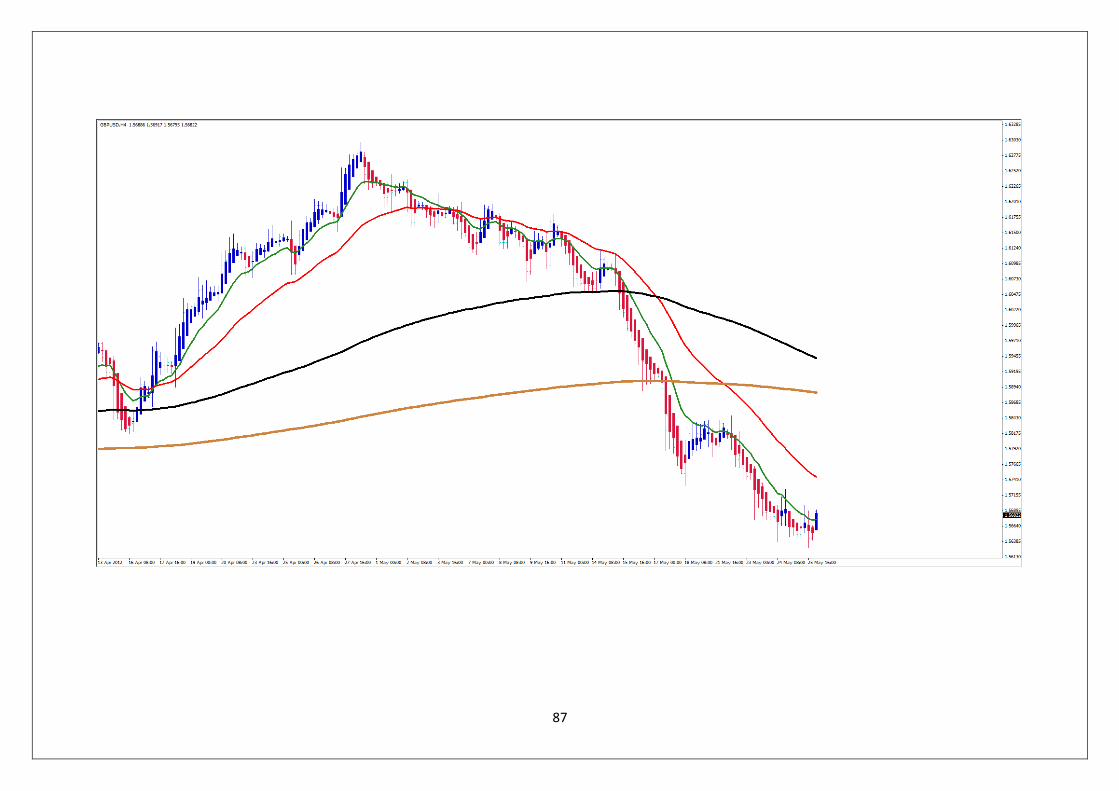
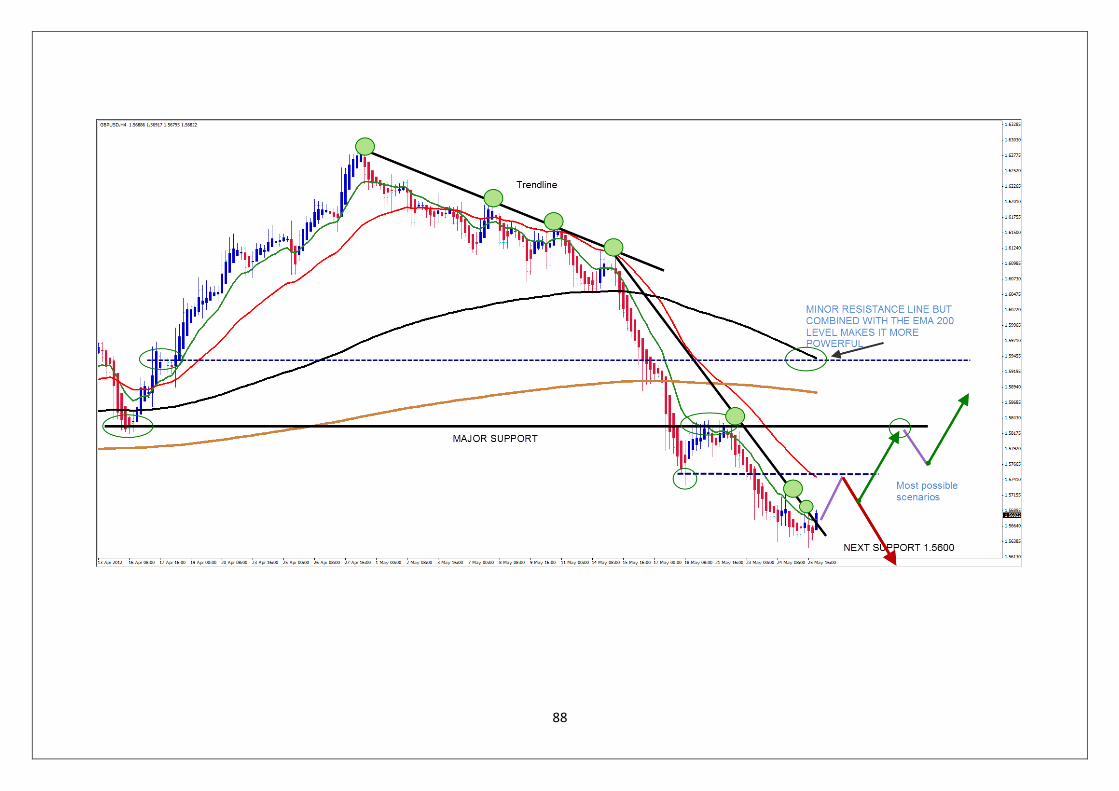
Ok. Let’s move a step further now. Imagine you have done your top-down approach and you look at the daily or 4 h chart
to find trade setups. Now that you have practiced the horizontal trend lines, combine all your knowledge and try to draw
support & resistance levels, trend lines, targets, entry and exit points, stops, trailing stops and possible reversal scenarios!
Try to do your own market outlook. You should not try to predict anything, but take what you see on the chart and use it
for your analysis.
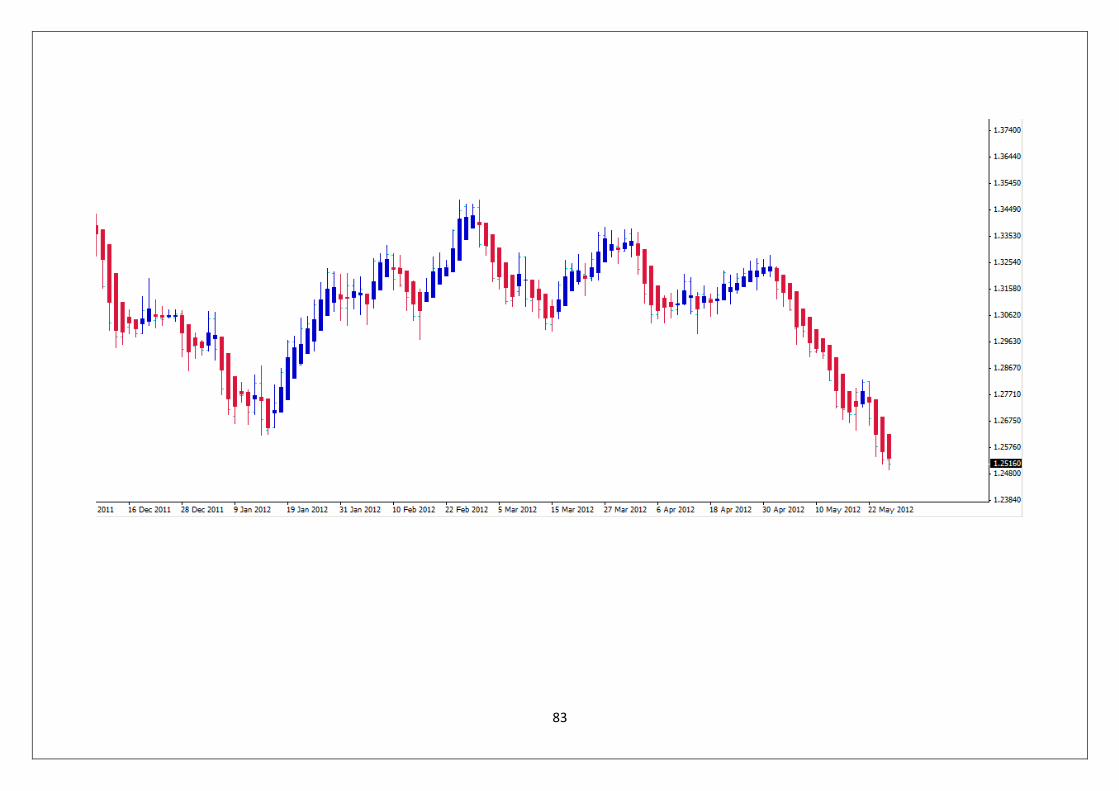
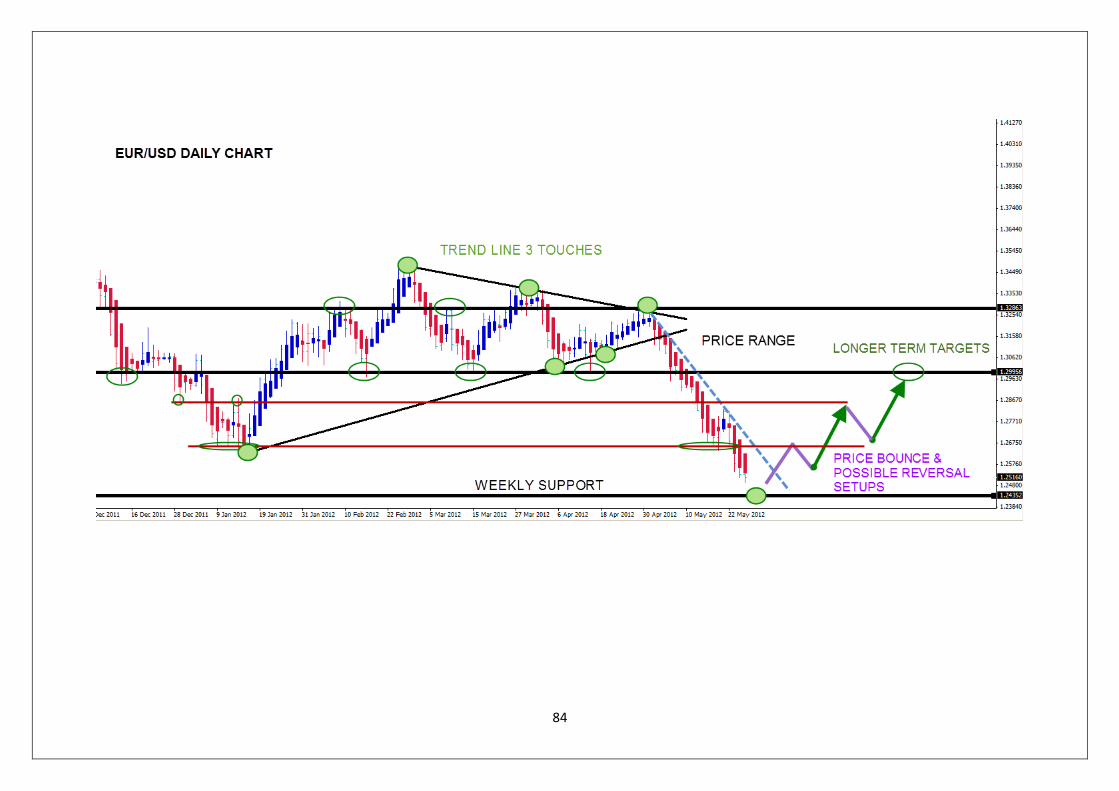
I will give you an example on the EUR/USD daily chart to help you. Practice again alone on the following charts, before you
switch to the solutions.
Enjoy!
80
Full Chart Analysis
81
82
83
84
85
86
87
88
89
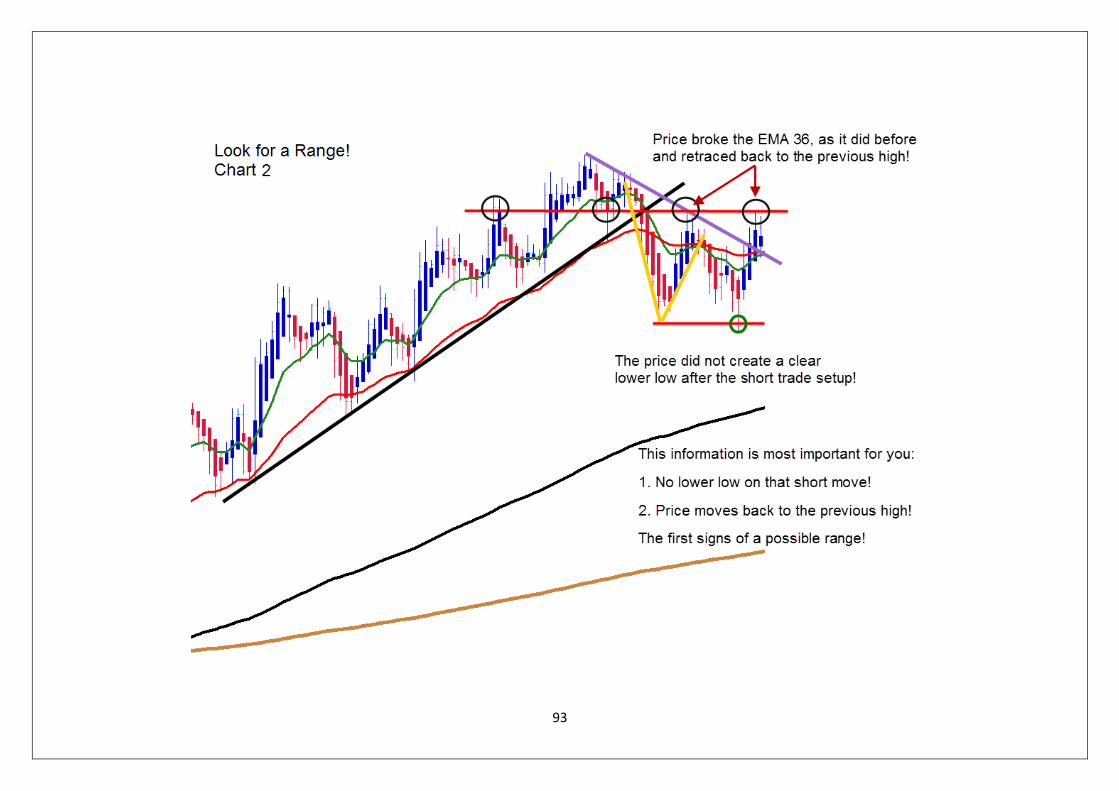
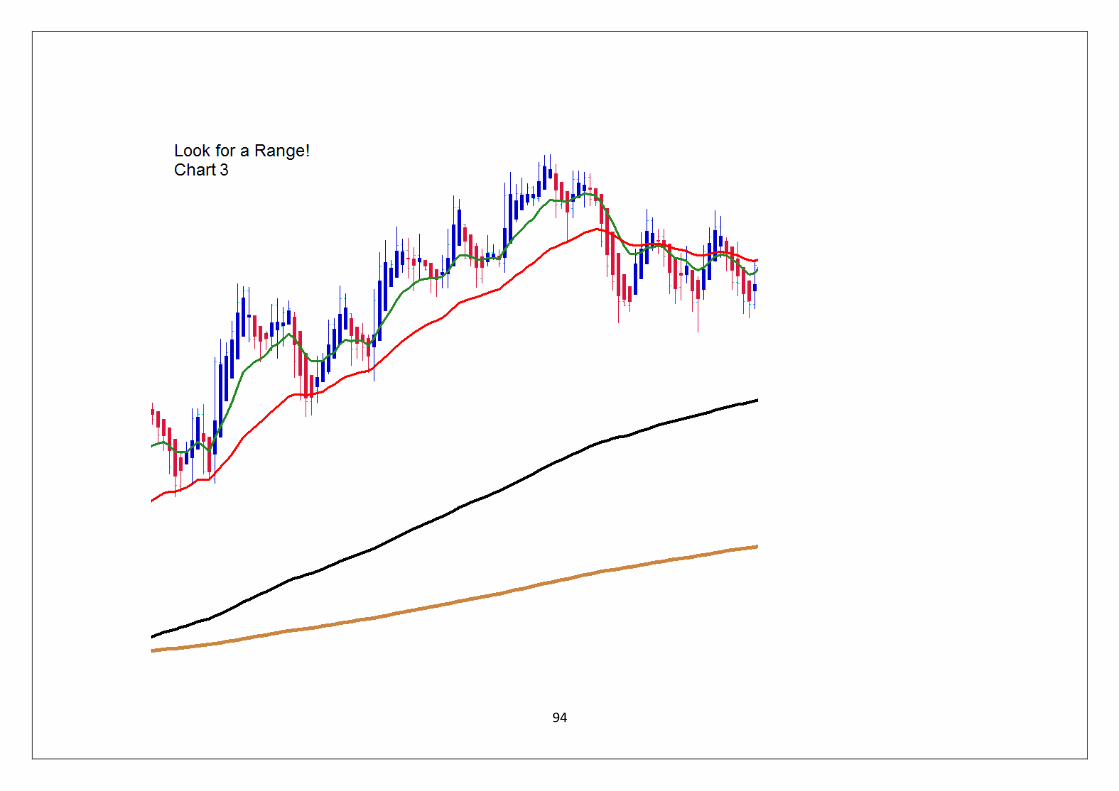
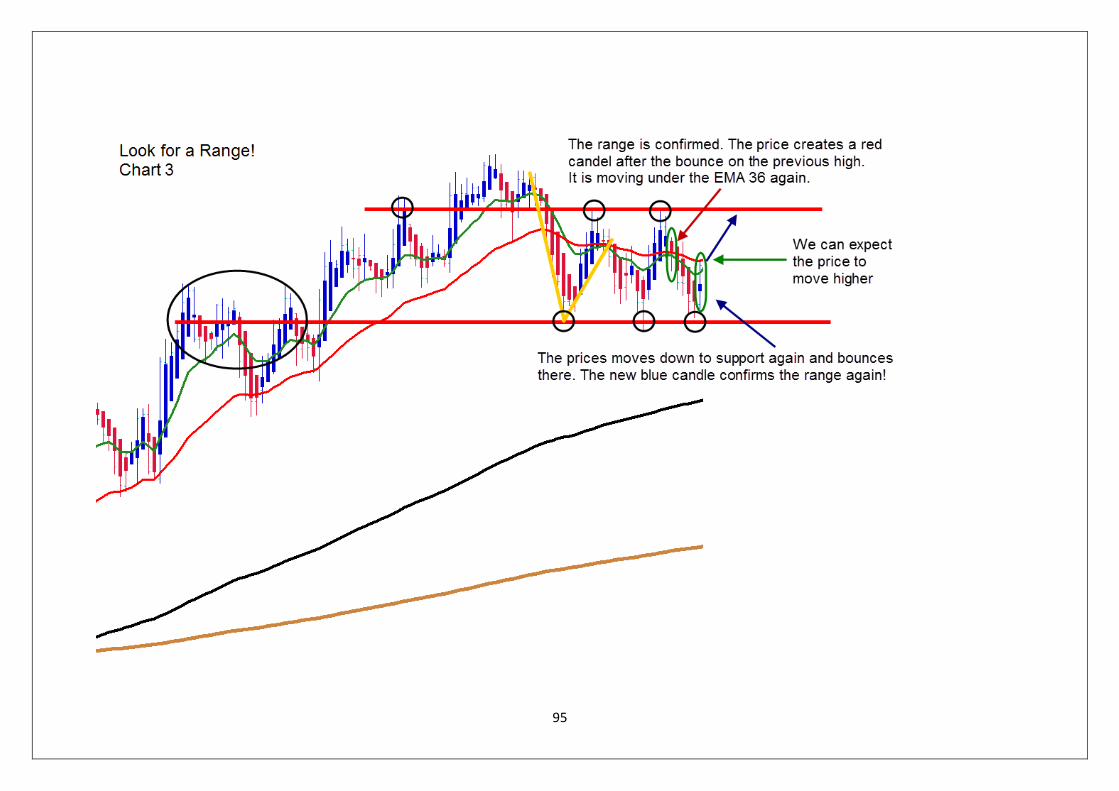
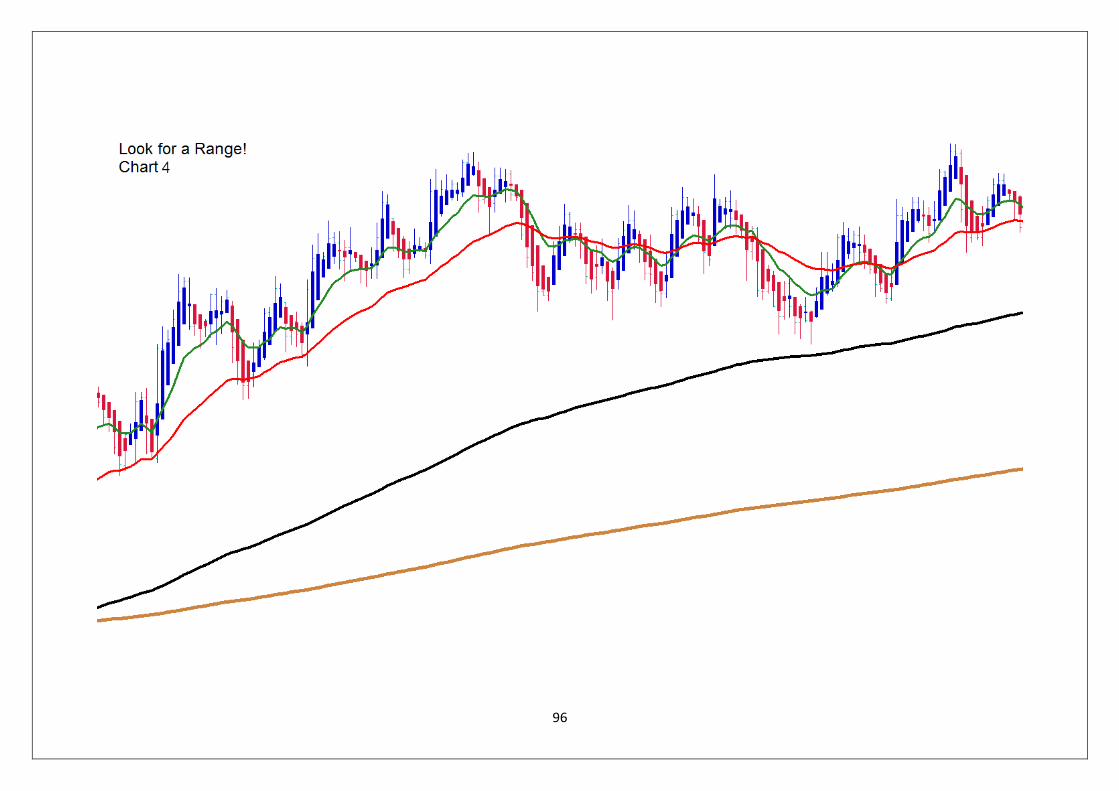
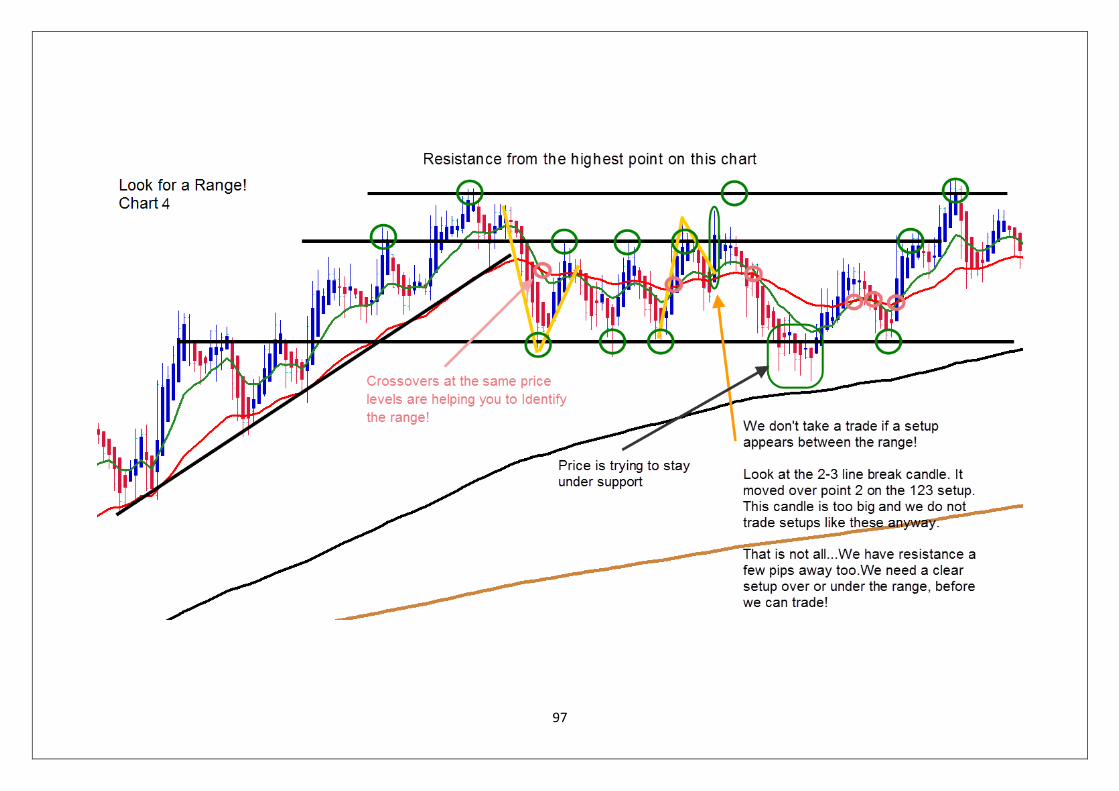
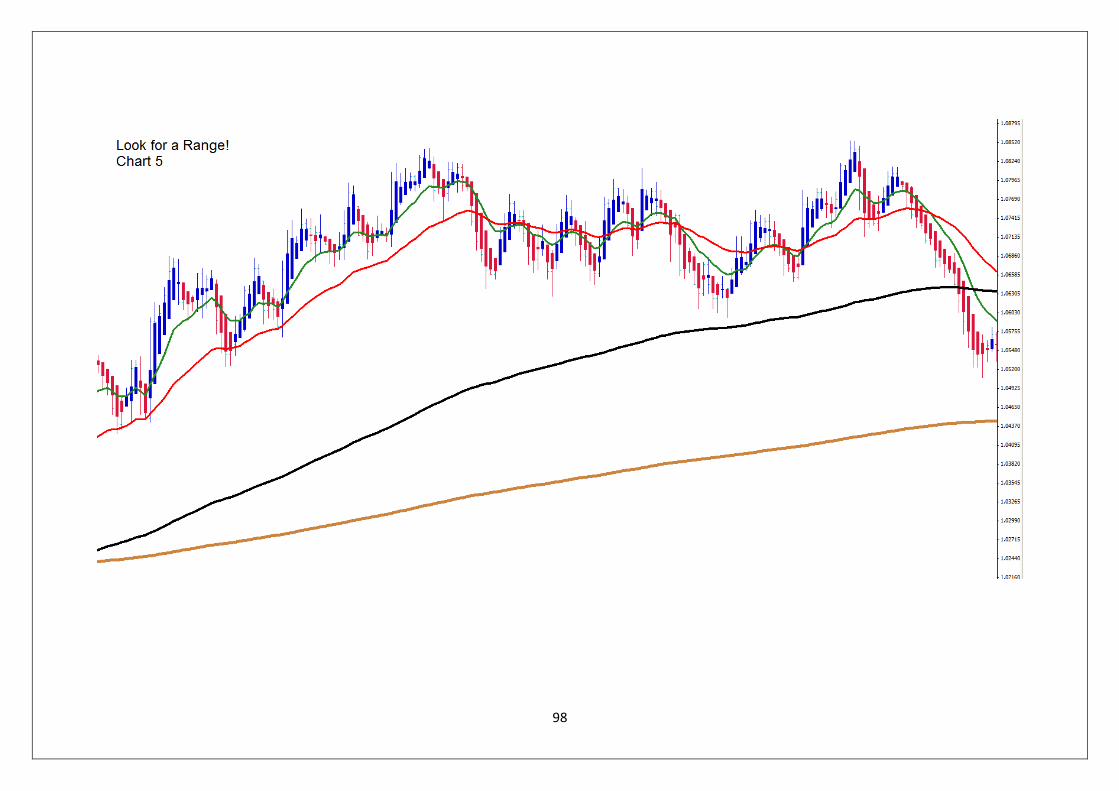
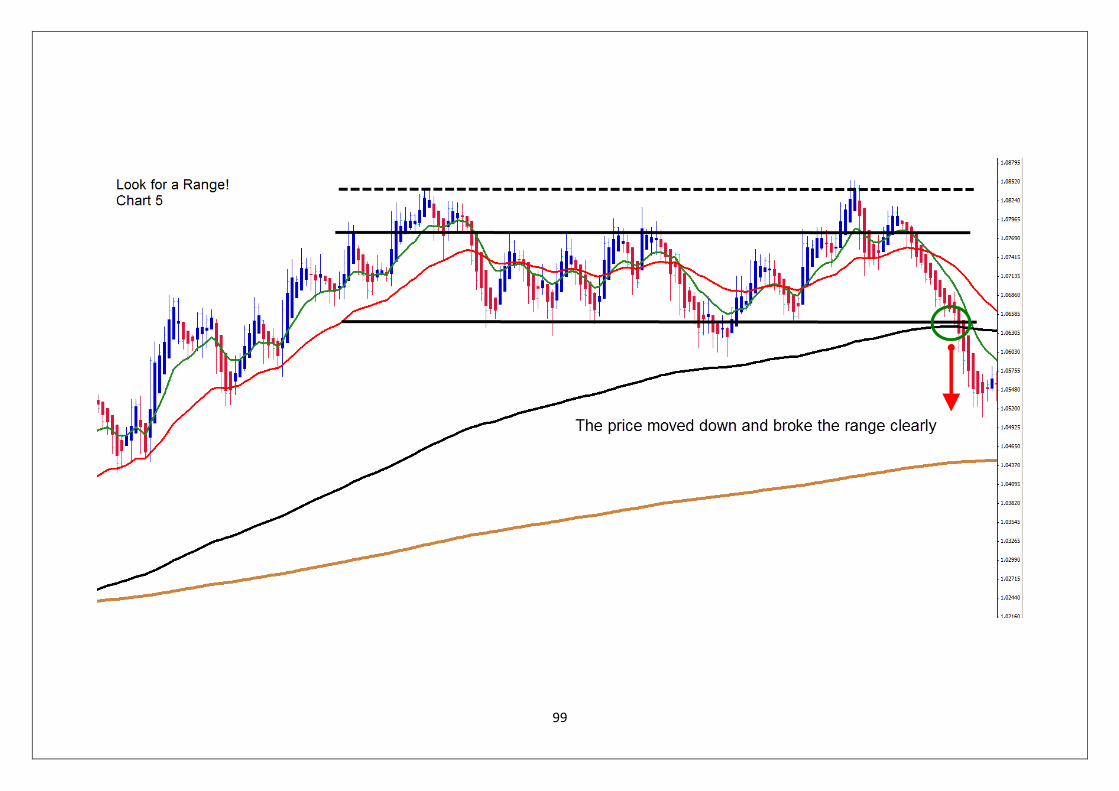
How to Trade and Manage Trades in a Ranging Market
Please study the following charts very carefully. They will help you to identify and manage
positions in ranging markets!
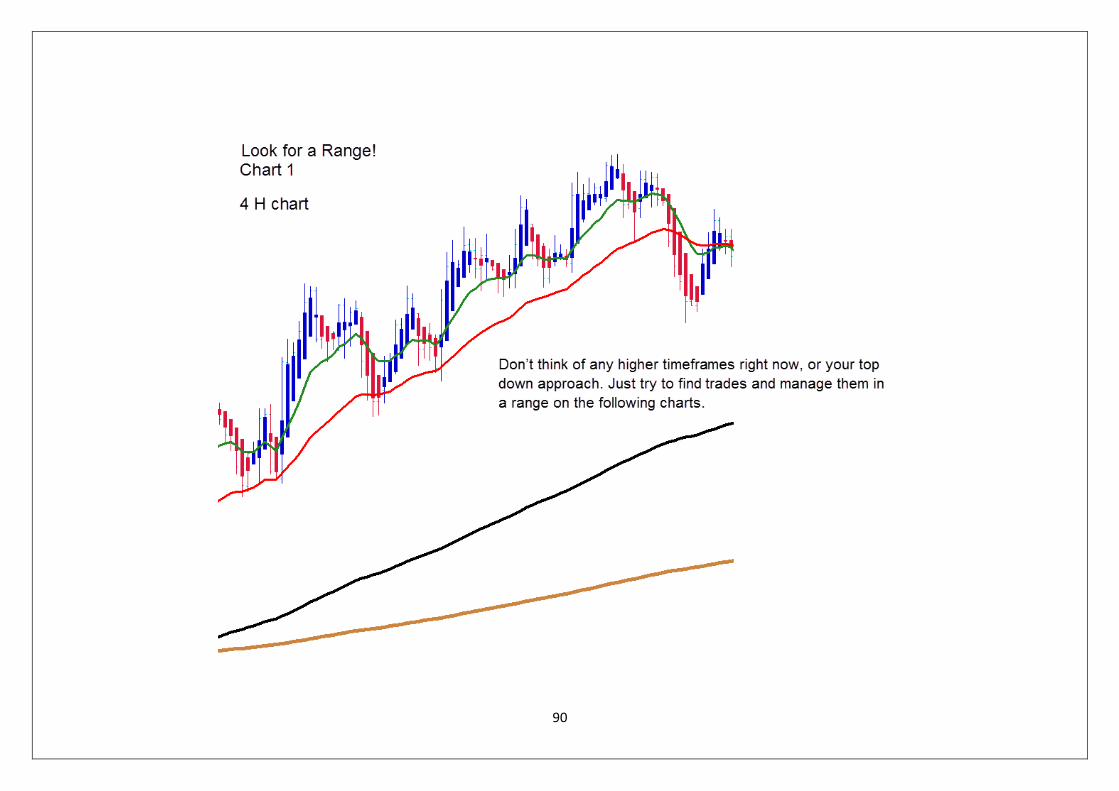
90
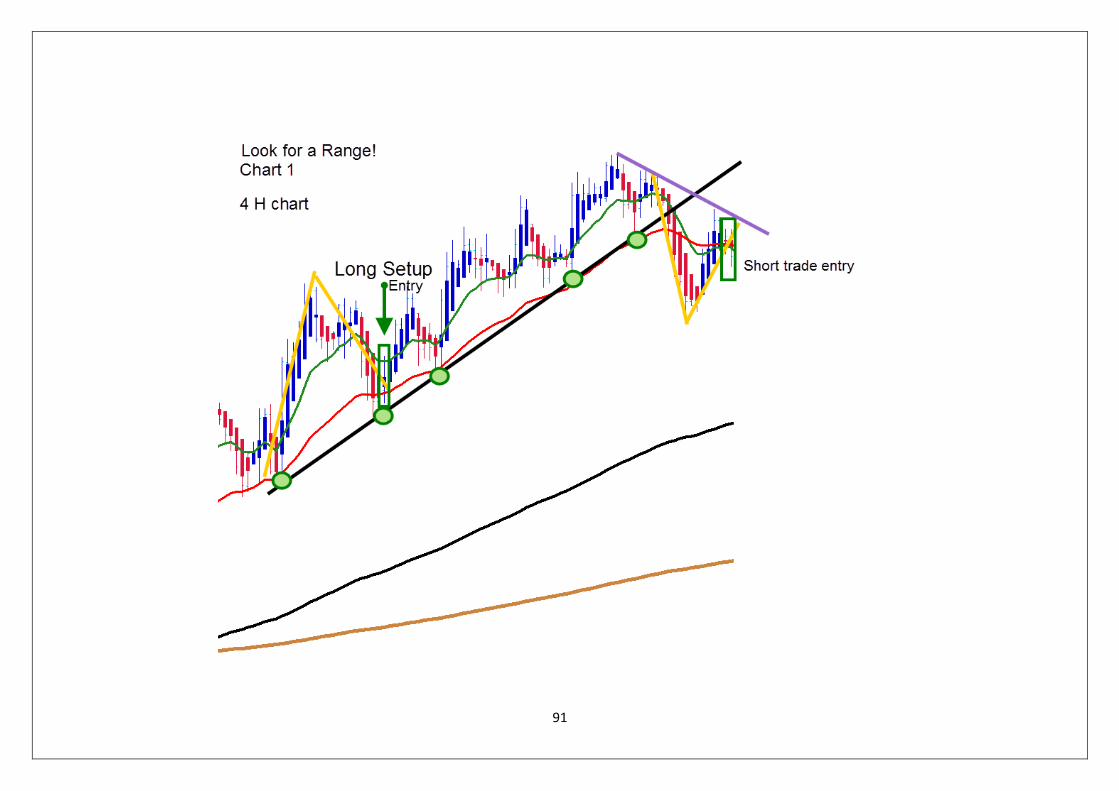
91
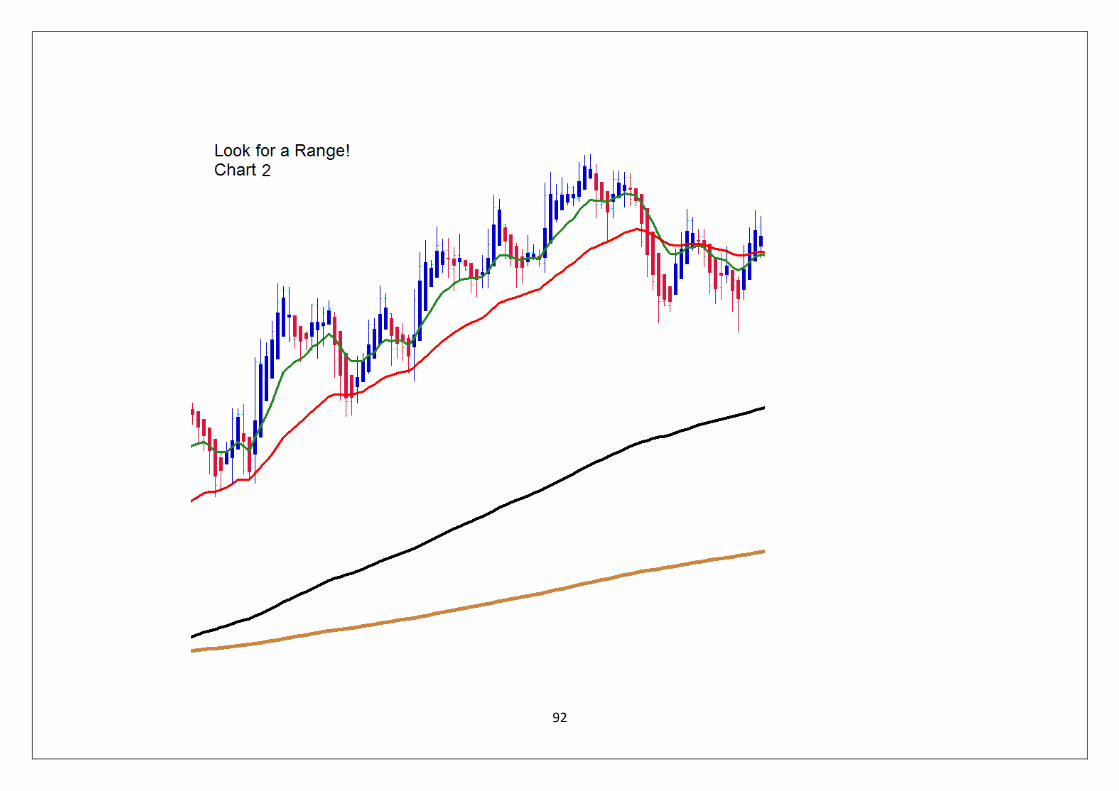
92
93
94
95
96
97
98
99
100
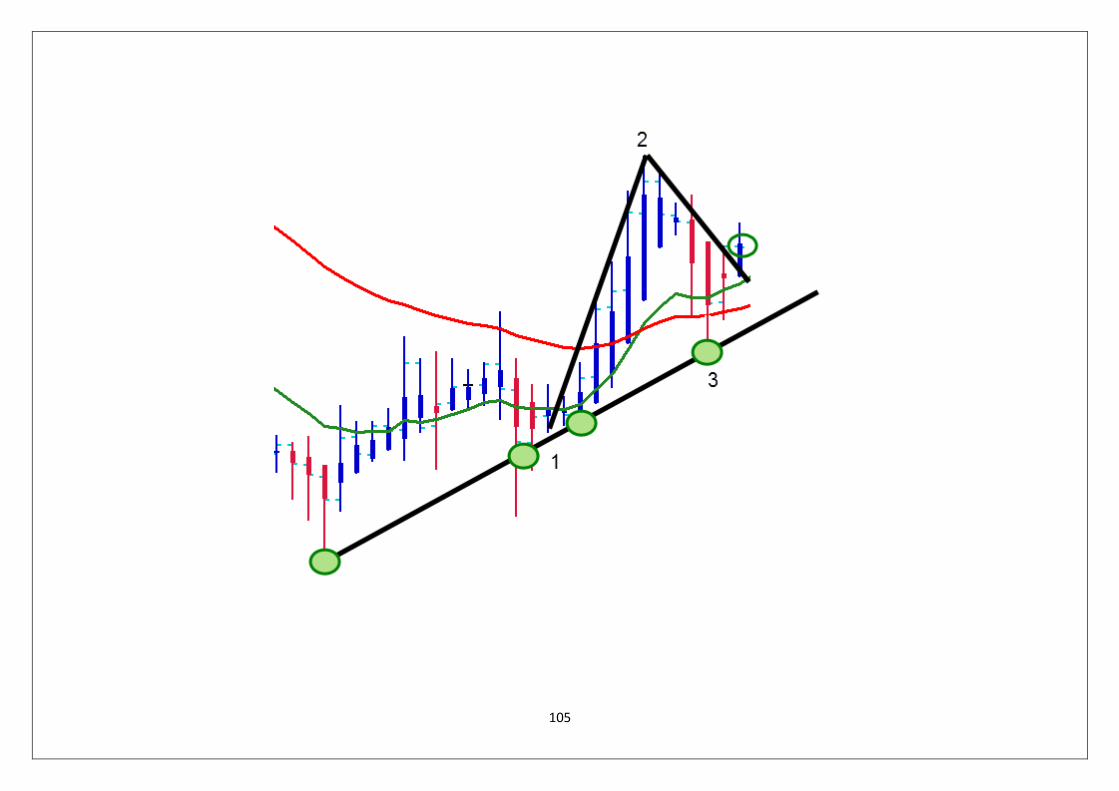
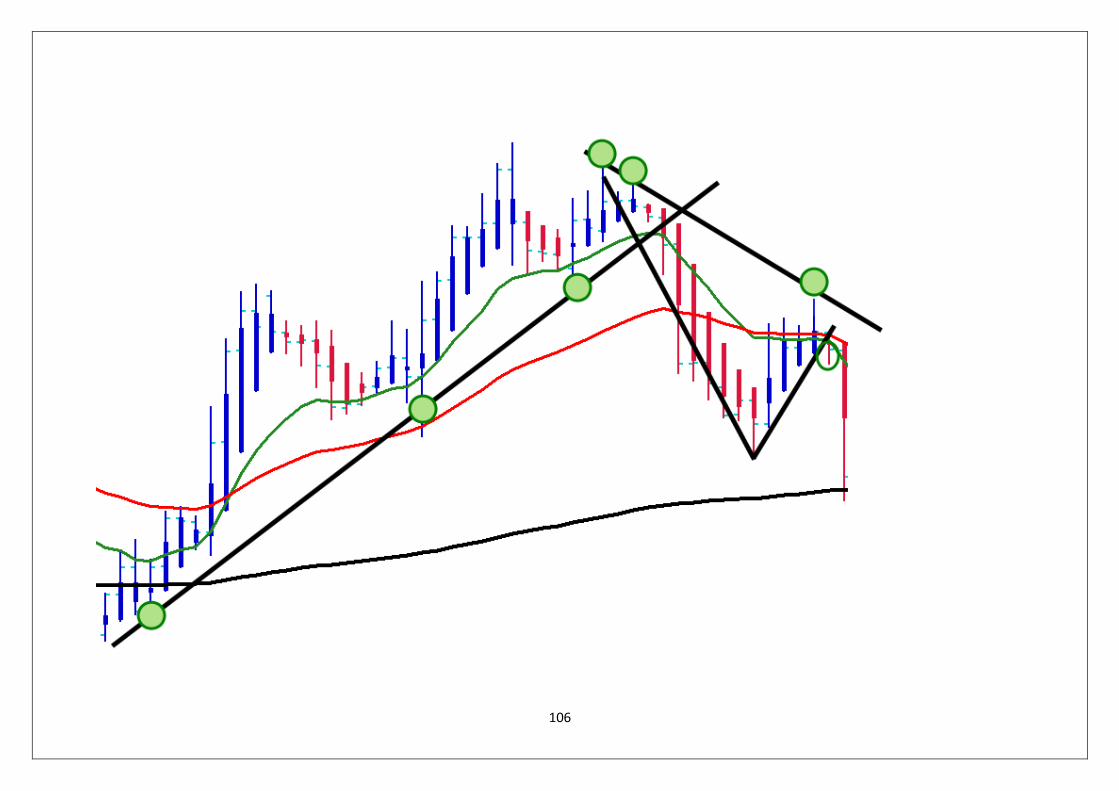
A good 123 setup
Not every 123 setup is worth trading. The following explanation and charts will help you separate
the good and bad 123 setups!
What we need is a…
101
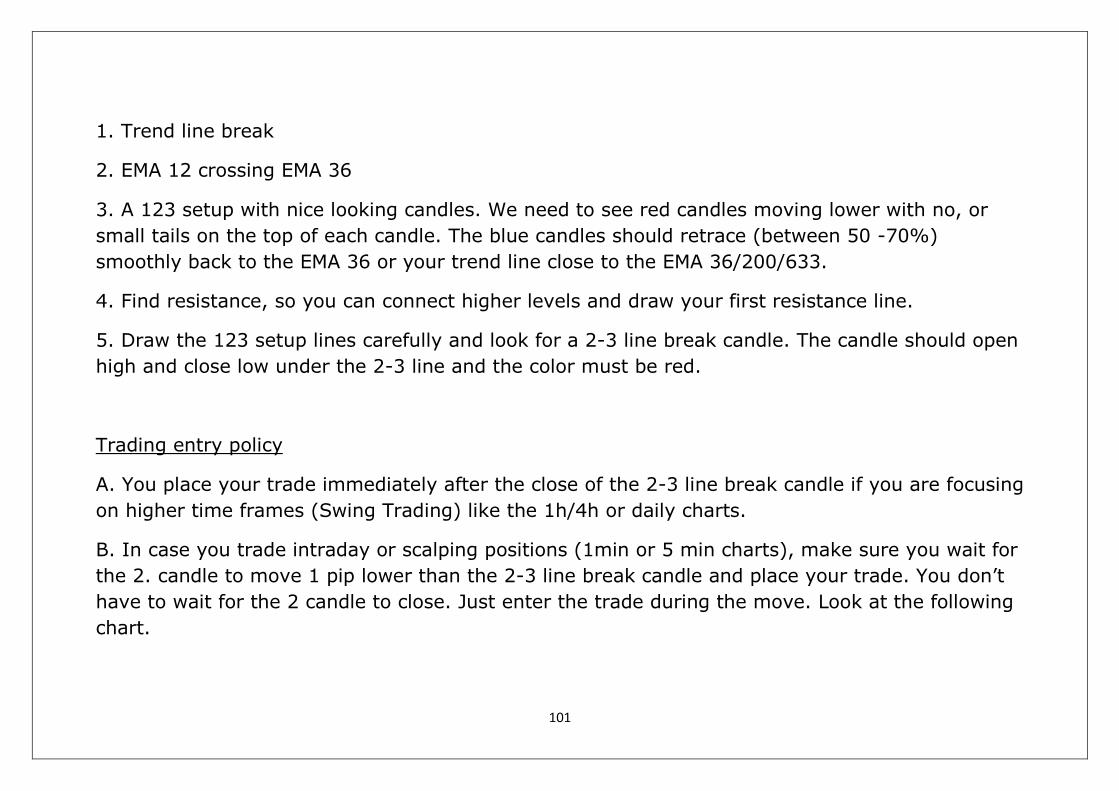
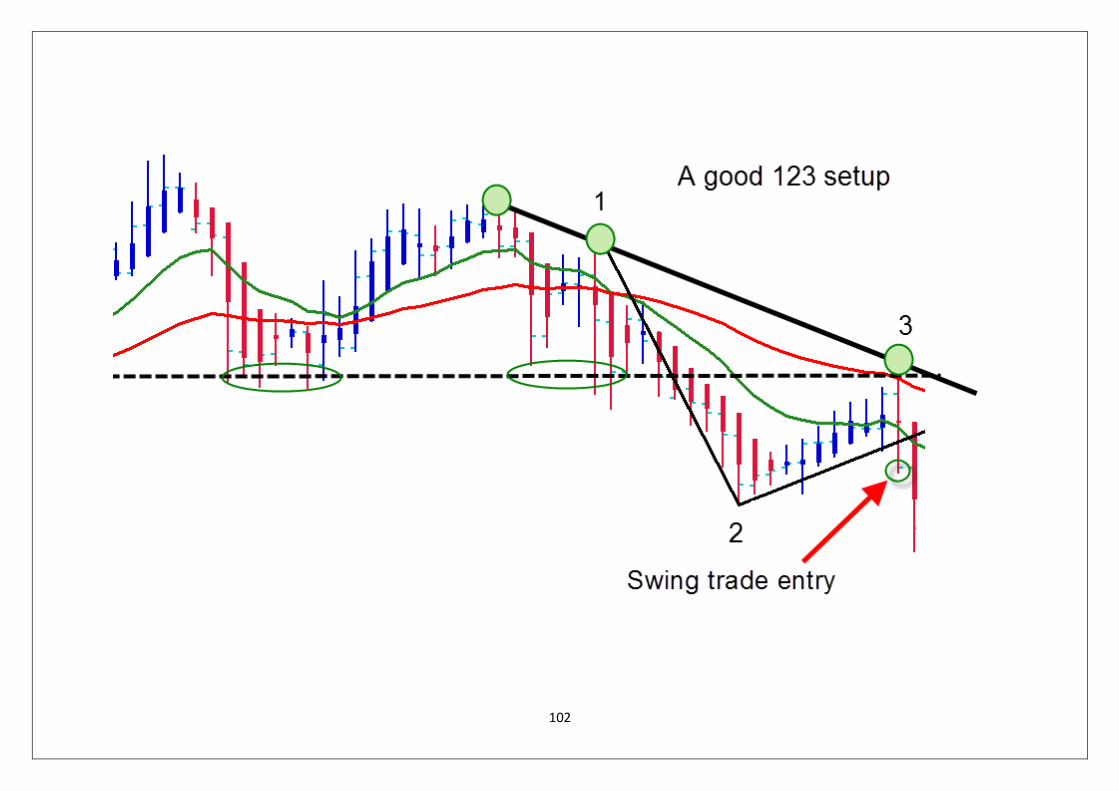
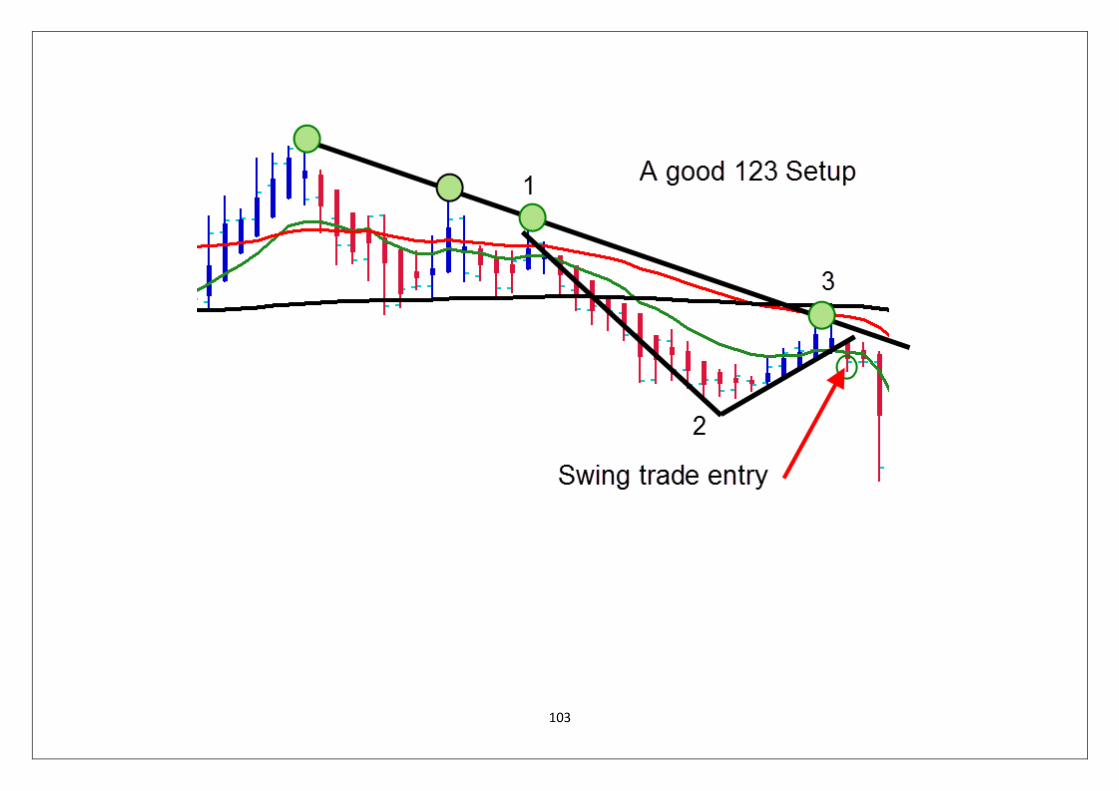
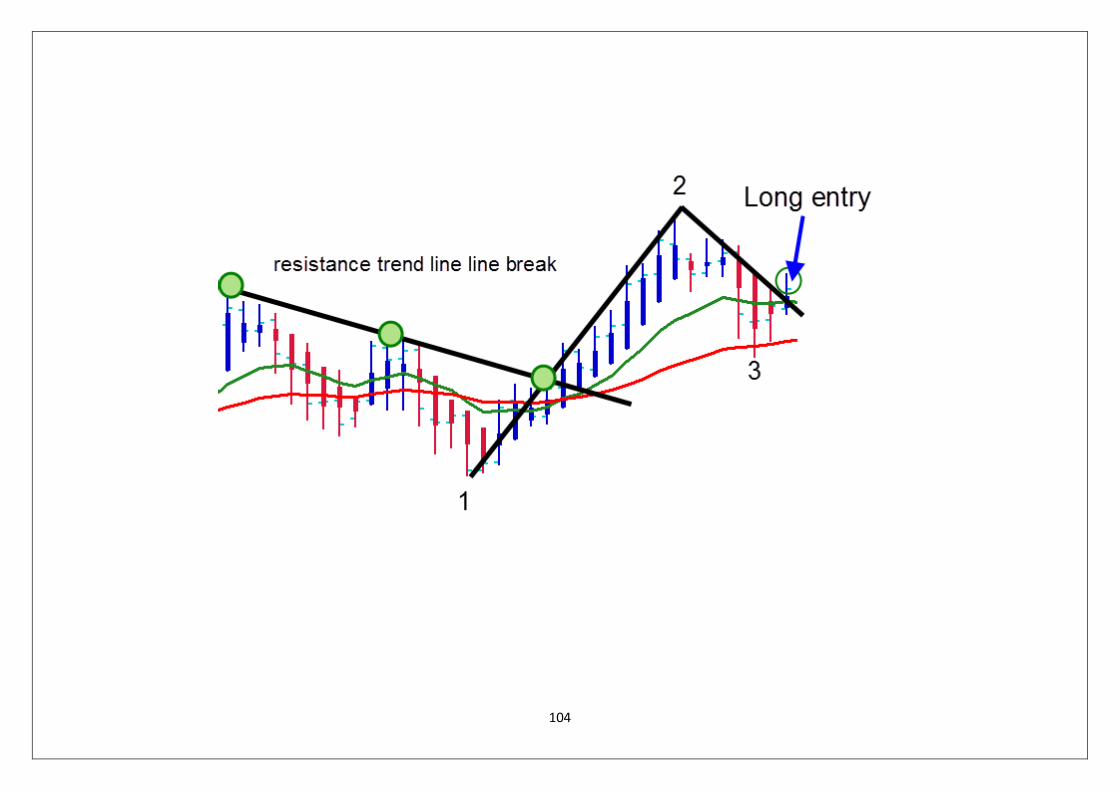
1. Trend line break
2. EMA 12 crossing EMA 36
3. A 123 setup with nice looking candles. We need to see red candles moving lower with no, or
small tails on the top of each candle. The blue candles should retrace (between 50 -70%)
smoothly back to the EMA 36 or your trend line close to the EMA 36/200/633.
4. Find resistance, so you can connect higher levels and draw your first resistance line.
5. Draw the 123 setup lines carefully and look for a 2-3 line break candle. The candle should open
high and close low under the 2-3 line and the color must be red.
Trading entry policy
A. You place your trade immediately after the close of the 2-3 line break candle if you are focusing
on higher time frames (Swing Trading) like the 1h/4h or daily charts.
B. In case you trade intraday or scalping positions (1min or 5 min charts), make sure you wait for
the 2. candle to move 1 pip lower than the 2-3 line break candle and place your trade. You don’t
have to wait for the 2 candle to close. Just enter the trade during the move. Look at the following
chart.
102
103
104
105
106
107
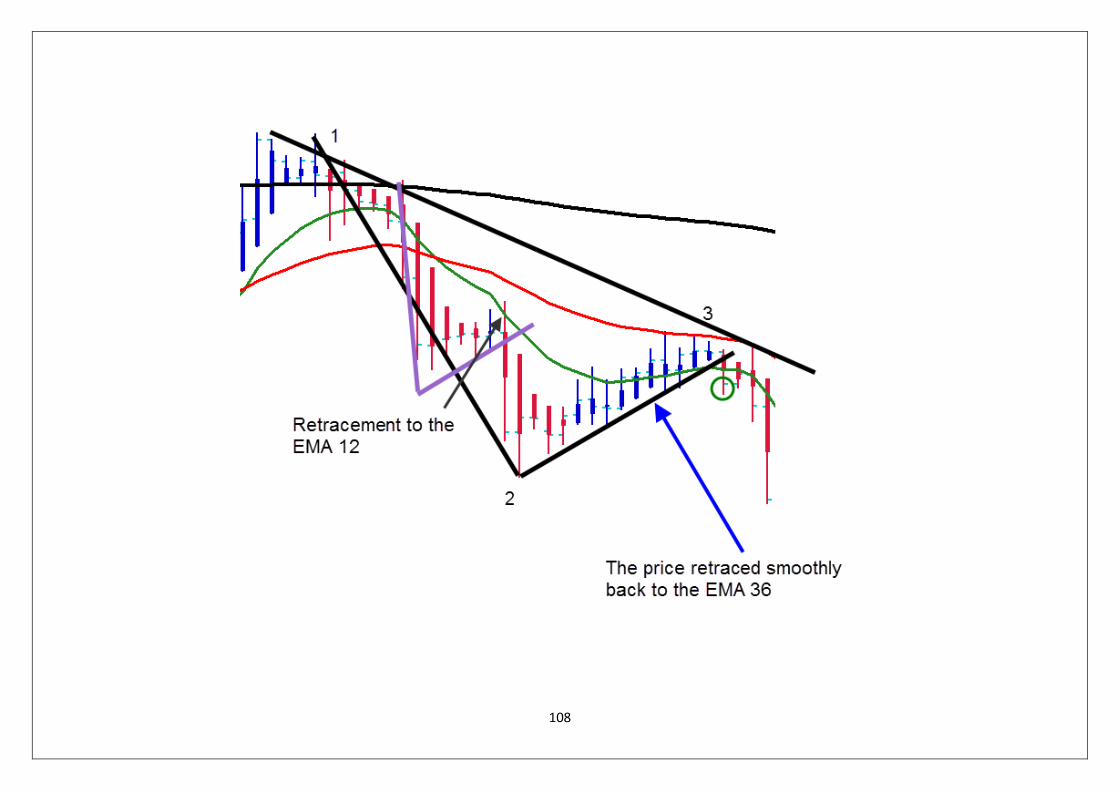
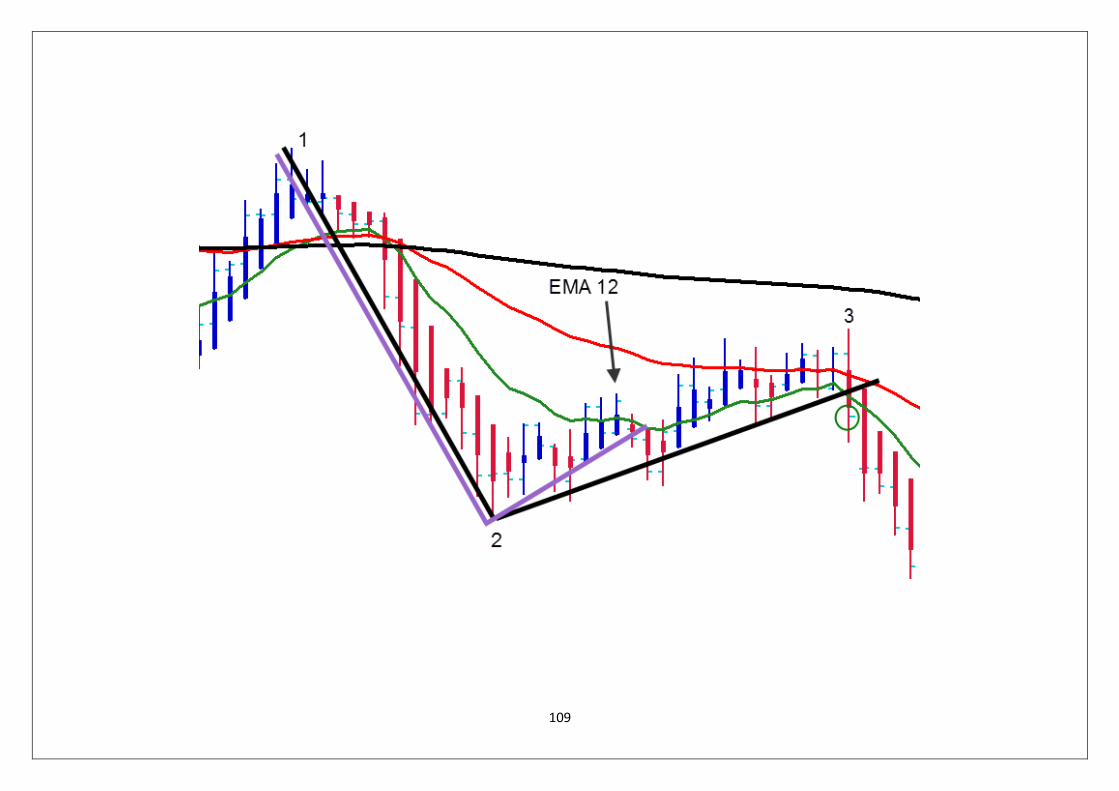
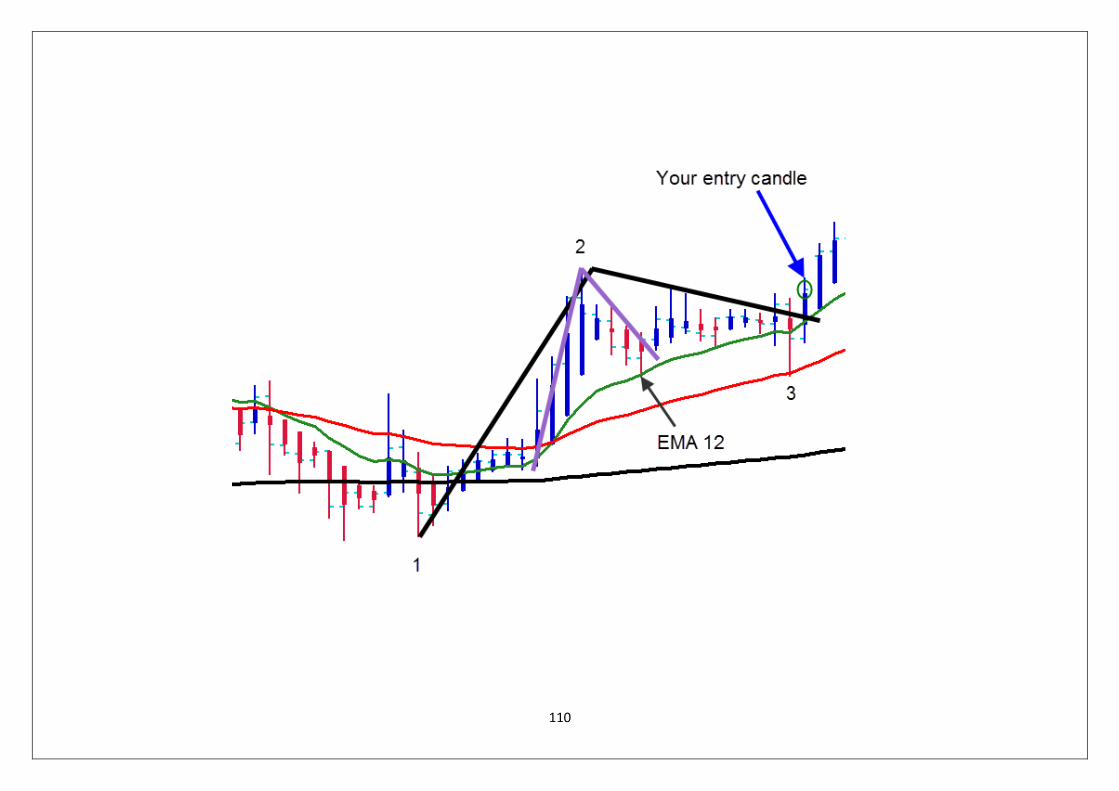
Good, but not perfect setups
There are some setups, which are not what we call “text book” setups, but they are still nice to
trade. You just need to identify them. That is why we are going to practice it right away.
The difference here is that instead of seeing a clear retracement back to the EMA 36/200 or 633,
the price stops at the EMA 12 first. It could rest of a while, move a little bit lower and then retrace
back to the EMA 36. If the move is smooth and you spot this on your chart, combine it as always
with your top-down approach, take the trade and follow the rules.
Here are some examples…
108
109
110

111
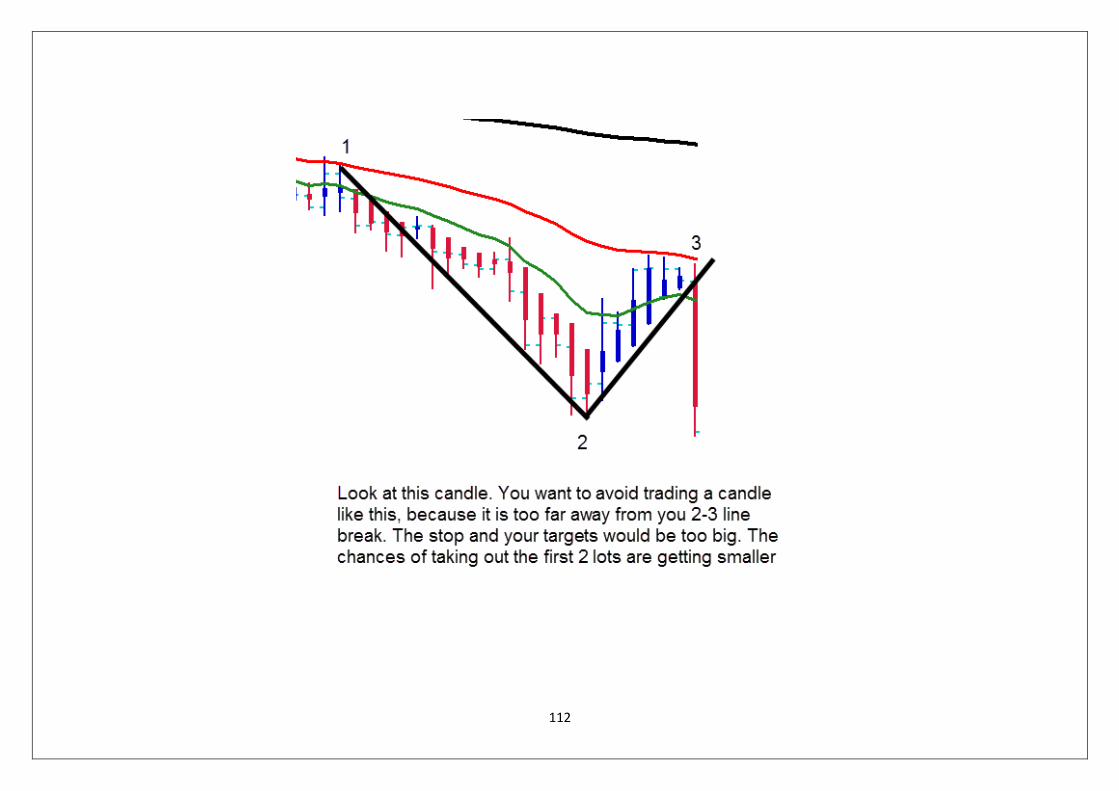
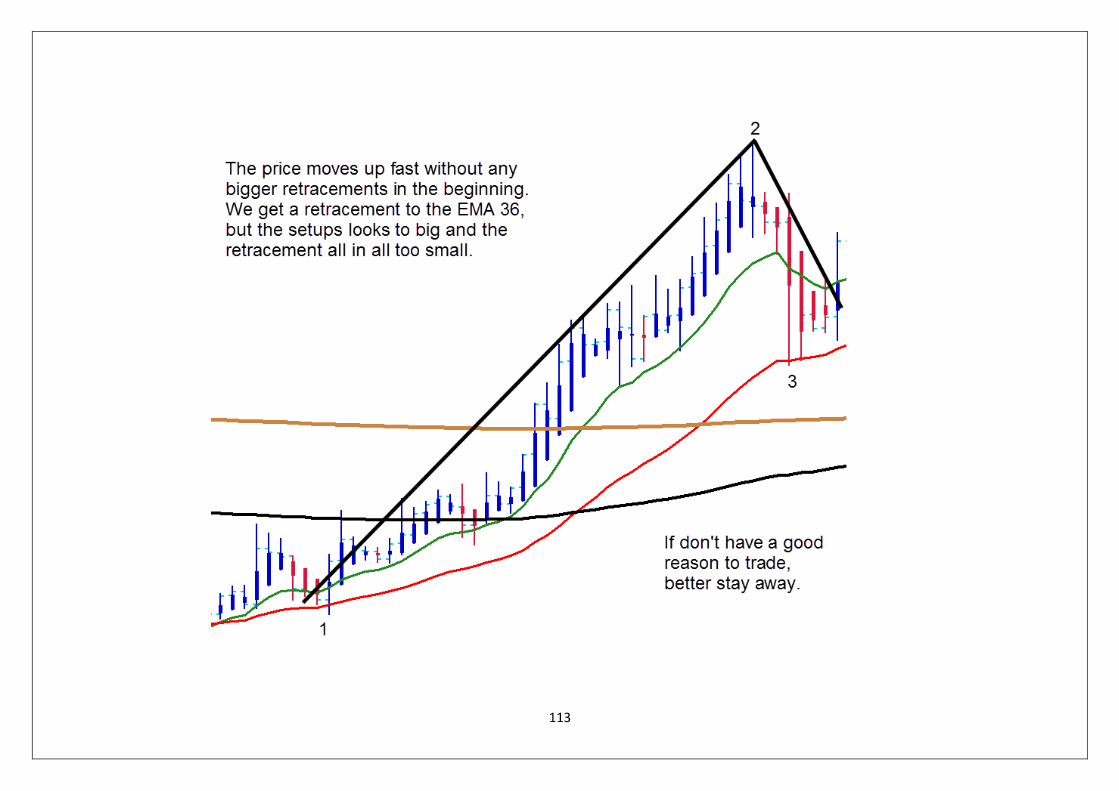
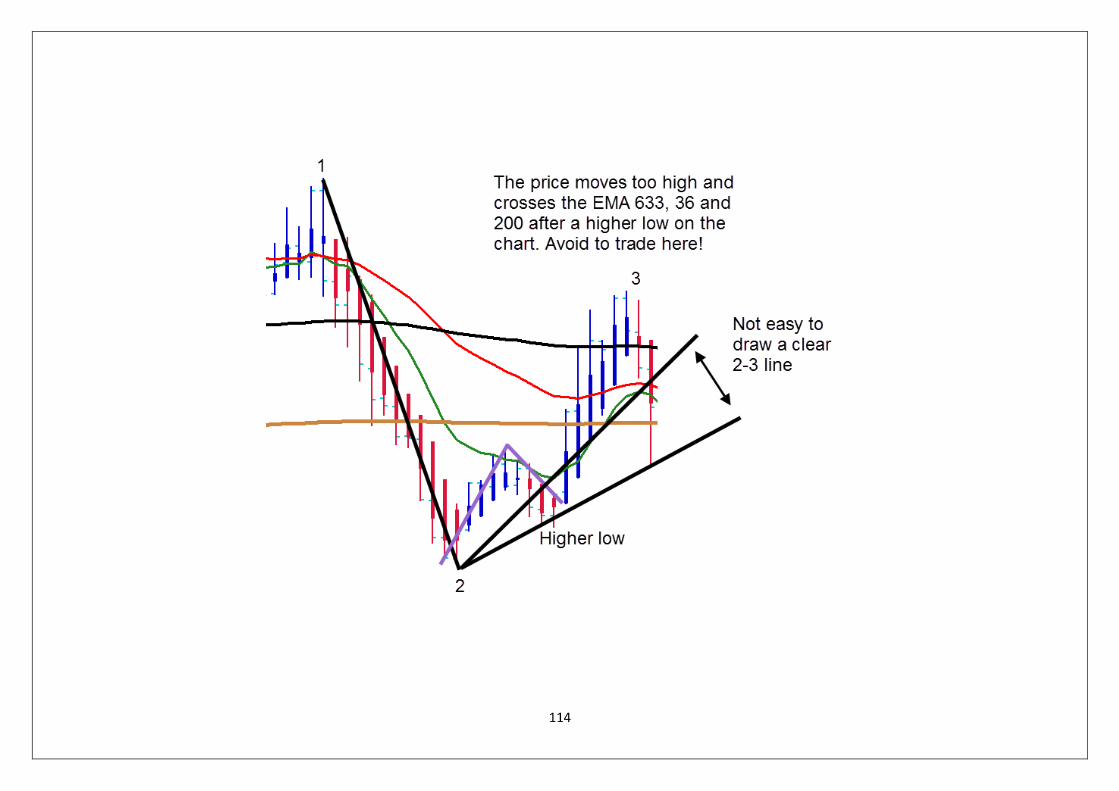
Setups to avoid
There are some setups you should avoid. Not only because they look “bad” on the chart, but the
chances to make profits with these setups are much smaller than the setups you studied before.
High volatility is mostly the reason for these setups.
It is not forbidden to trade here, but please notice; these setups are a bit aggressive to trade.
Let’s start…
112
113
114
115
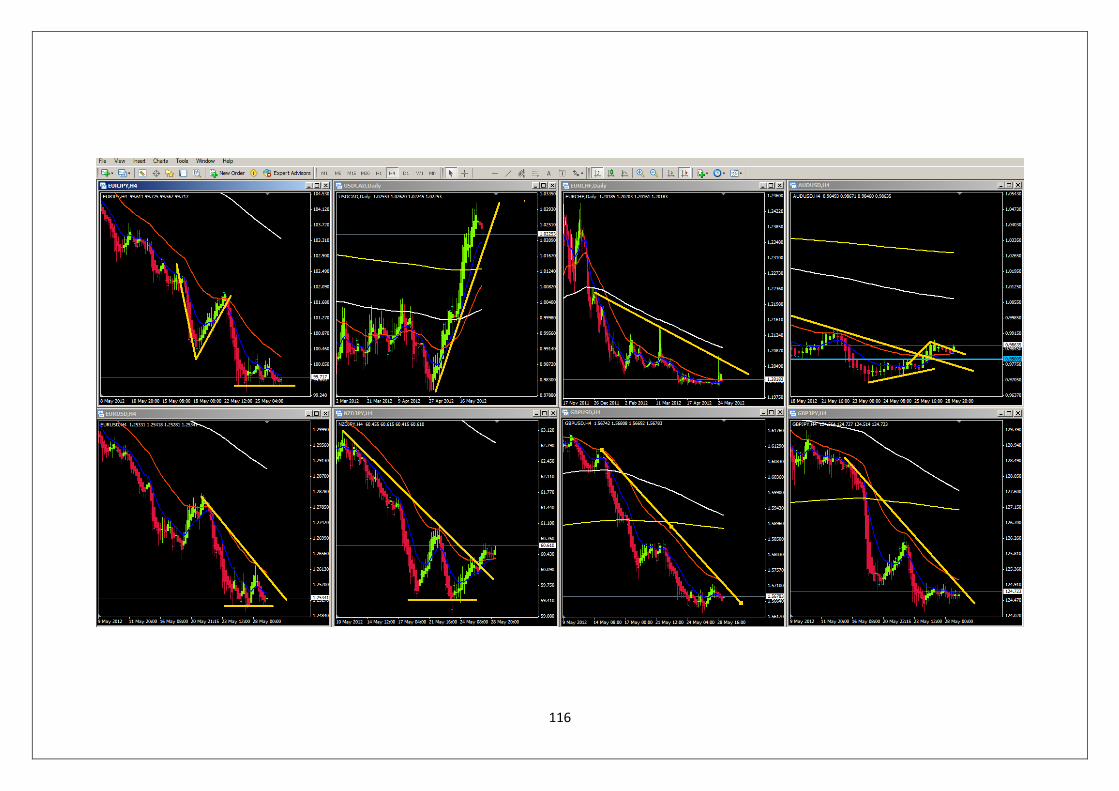
Organize the charts on your screen
In order you make your trading easier, make sure that your charts are organized well. That is
easy to do. I choose 8 pairs on each screen, so I am able to compare all at once and look for the
best setups. You also see the difference in volatility by having 8 pairs on the screen on the daily,
weekly or 4 H chart. You can switch the timeframes easily on one pair, without losing sight of
another and you can see your trend lines, bounces and breaks for all pairs at once.
Take a look at the following chart and do the same with your trading software…
116
117
Trade & Money management rules
We don’t need to discuss the trade and money
management issue a lot. This is really simple and you
should stick to these rules a 100%!
1. Always trade good setups after you have down your
detailed top down approach.
2. Don’t be afraid of placing a trade if the trade looks
promising, because nothing bad can happen on your
trading account on long term if you…
3. Never expose your account to more than 2%.
4. Make sure you split your trade into 3 parts and place
your stop immediately after you entered a trade.
5. Take incremental profits according to the rules and
always…
6. Let the last lot run as long as possible to ensure
maximum profits.
7. Create a trading plan to learn from your mistakes
and empower your good trading habits.
8. Always have nice and achievable trading goals.
9. Spend every 2 months at least 20% of your earned
money with family and friends to enjoy your
achievements.
10. Spend 10 % of you winning to charity
118
I know that the information in this eBooks will help you!
If you are following the trading system step by step and
stick to the rules, you will have fun with your trading for
years to come.
I wish you all the best and great trading success. Please
practice on a demo account first, make sure you gain a lot
of profits and then start with a live account.
Trading is not only a job, but a way of life.
I am sure that if you put your whole heart into it, you will
succeed…no doubt about that!
I wish you all the best!
Nikos Mermigas
www.spartantraderfx.com

119


![[Trading ebook] Gann, W.D. - How to make profits in commodities.pdf](https://img.pdfslide.us/doc/110x75/55cf8cf55503462b1390b67a/trading-ebook-gann-wd-how-to-make-profits-in-commoditiespdf.jpg)