Embed Size (px)
Citation preview

achieve.org
1
Graduation Requirements
HOW THE STATES GOT THEIR RATES
Even as graduation rates rise, policymakers and families wonder: Does a high school diploma mean that students are ready for what comes next? Graduates wonder: Did I take the right classes and have the experiences I need to pursue the future I envision for myself? State leaders should be reflecting too: Do our state policies set the right expectations so that all students graduate college and career ready? Do we tell parents and students what they need to know so that families can make choices about their children’s futures?
To try to understand these questions, Achieve analyzed the 93 diploma options available across all 50 states and the District of Columbia for the class of 2014.
The analysis looked at how many diplomas1 a state offered, whether a state offered a diploma that met college- and career-ready (CCR) expectations in English language arts (ELA)/literacy and mathematics course requirements, assessment requirements associated with earning a diploma, and if or how student outcomes were reported by diploma type.
The analysis reveals that while many states have multiple diploma options for students, many of these states do not publicly report how many students earn which diploma. The lack of transparency means that in
most states there are more questions than answers about the true value of a high school diploma, including:
• How many andwhich studentscomplete whichdiplomas andhow are thosestudents faring inlife beyond highschool?
• How different arethe course requirements between diploma options in the state?
• Are students from different subgroups (income, race, gender,etc.) being held to different expectations?
• Can a student complete the state’s minimum graduationrequirements, complete the state’s assessment requirementsand/or GPA requirements, receive a diploma, and still not beready for a two-year or technical school, an apprenticeship,the military, or a four-year institution?
• Do students and families fully understand the implications ofselecting courses and, in some states, certain diplomas andwhat those choices mean for their options after high school?
1 States define diplomas and graduation requirements differently, including offering only one diploma, multiple diplomas, or multiple courses of study (course requirements) leading to one diploma. For the purposes of this analysis, we use diploma as an umbrella term, recognizing that some states would not identify their graduation offerings as discrete diploma options, but rather, courses of study or course sequences leading to a diploma. Additionally, this analysis does not include any performance acknowledgements or endorsements that a state may offer nor any certificates of achievement or other offerings for students with disabilities. It is also important to note that districts can set more rigorous graduation requirements than the state; however, few states track district graduation requirements.
Achieve’s Definition of College and Career ReadinessReadiness for college and careers depends on more than the mastery of ELA/literacy and mathematics content and skills, but these two content areas serve as a foundation for the study of other academic disciplines and contextualized learning. To be prepared for postsecondary opportunities, students need to take at least three years of mathematics (through the content generally found in an Algebra II or an integrated third year math course) and four years of rigorous, grade-level English.
October 2015

achieve.org
2
Graduation Requirements
Key Findings: Analysis of Class of 2014 Diplomas
When students walk across the graduation stage and are handed a high school diploma, they (and their parents) believe they’ve earned a passport to further learning. Yet in too many states, for too many students, the diploma is not an indication of college and career readiness — a fact that students may not know until they try to pursue their next steps.
• In 20 states, the state does not offer a diploma that requires students to complete CCR requirements in ELA and mathematics (Minimum diploma).
• In 26 states, students have multiple diploma options, but in all of these states, at least one option falls short of CCR expectations in ELA and mathematics (CCR default with minimum or personal modification opt out, or CCR opt in).
• In 4 states and the District of Columbia, the state sets the expectation that all students will earn a diploma that includes CCR requirements in ELA and mathematics (CCR mandatory). In these states, the graduation rate is the same as the percentage of students who graduate having earned the CCR diploma option.
• Only 10 states who offer multiple diplomas currently publicly report the percentage of students earning the CCR-level diploma.
What do these findings suggest?
• For students, and their parents, this variety of diploma offerings can lead to misunderstanding and misinformation about the difference between diploma options and how different diplomas support different postsecondary plans.
• For policymakers, a state’s reported graduation rate may mask which students earned which diploma options in the state. Without transparency and public reporting of the percentage of graduates earning each diploma option, the state cannot obtain useful information about who earns which diploma option and how those students fare after high school — information that is critical for parents, students, teachers, and counselors.
States should have graduation requirements that reflect their college- and career-ready standards.
• All states have CCR standards in mathematics and ELA but not all states require that ALL students take courses aligned to those standards before graduation — until they do, too many students will be underprepared for postsecondary success.
States should be more transparent.
States can take steps to improve the value of the high school diploma — starting with increasing transparency around diplomas and course sequences so that students, families, educators, and policymakers can make better-informed decisions. States should:
• Communicate clearly to students and parents about various diploma options, their course requirements, and how these options align with postsecondary opportunities.
• Publish accessible and clear information about the percentage of students completing each diploma, and disaggregate this data by student subgroup.

achieve.org
3
Graduation Requirements
STATES’ APPROACHES TO DIPLOMA OFFERINGS AND PREPARING STUDENTS FOR COLLEGE (2014 GRADUATES)Currently, states take several approaches to diploma offerings. In some states, the expectations are set that all students can and should complete a CCR course of study in ELA/literacy and mathematics* while in other states, the state sets lower expectations, putting the burden on students and districts to know what, and advocate for, courses students need to complete in order to be prepared for college. To see your state’s current graduation requirements, click here.
CCR DiplomaCCR default, personal mod.
or min., and opt in
State offers >1 diploma, students start with CCR
expectations, students canopt out of or opt in above
CCR expectations
CCR DiplomaCCR default, personal
mod. or min.State offers >1 diploma,students start with CCR
expectations, must opt outto diploma below CCR
expectations
CCR DiplomaCCR Mandatory
State offers only onediploma, set at CCR
expectations
DiplomaMinimum
State offers >1 diploma, students must opt in to and/or above CCR expectations
DiplomaMinimum
State offers only one diploma,set below CCR expectations
DiplomaMinimum
State offers >1 diploma, students must opt in to
CCR expectations
CCR DiplomaCCR Opt in
State offers >1 diploma, students must opt in to
CCR expectations
CCR DiplomaCCR Opt in
State offers >1 diploma, students must opt in to
and/or above CCR expectations
DiplomaOpt out to Minimum
DiplomaOpt out to Minimum
AK, CO, CT, ID, IL, IA, KS, ME,MN**, NE**, NH, NJ, ND, OR,
PA,RI, SC, VT, WV, WICA, FL, HI, MD, MA,
MO, MT, NV, NY, VA, WY
DE, DC, GA, KY, TN AZ, AR, MI, MS, NM, NC, OK, SD, UT, WA AL, IN, OH, TX
LA
State offers >1 diploma,students start with CCR
expectations, must opt outto diploma below CCR
expectations
State offers mult. diplomas, students start with CCR
expectations, students canopt out of or opt in above
CCR expectations
CCR DiplomaCCR Opt in
Advanced OptionsAvailable to ExceedCCR Expectations
CCR DiplomaCCR Opt in
Advanced OptionsAvailable to ExceedCCR Expectations
Meeting or Exceeding CCR Expectations: Students complete 4 years of rigorous, grade-level ELA/ literacy courses and at least 3 years of math, through Algebra II.
CCR Expectations
Below CCR Expectations
Expectations Start Here
Expectations Start Here
Burden placed on students and/or districts to ensure access to CCR courses in ELA and math for all students.
All students expected to complete CCR course requirements in ELA and math.
*Readiness for college depends on more than the mastery of ELA/literacy and mathematics content and skills, but these two content areas serve as a foundation for the study of other academic disciplines, a well-roundededucation, and contextualized learning.**Minnesota and Nebraska raised their states’ graduation requirements to the CCR level for all students beginning with the graduating class of 2015.

achieve.org
4
Graduation Requirements
Column Definitions and Methodology
Graduation RatePercentage: State four-year adjusted cohort graduation rate (ACGR) for 2013-14 as reported by states. Links to the state data are provided in the table. Some states have yet to release 2013-14 ACGR and the U.S. Department of Education (USED) has not released state data either.
Diploma options for 2014
graduates
The diplomas listed were reported by states to Achieve through annual surveys. Diplomas also refer to courses of study, course sequences and/or pathways available to students. This chart does not include any performance acknowledgements or endorsements that a state may offer nor any certificates of achievement or other offerings for students with disabilities. Some states have made changes to their graduation requirements since the class of 2014, including raising requirements to the college- and career-ready level. To view the most current graduation requirements in each state, click here.
All diplomas included in this table are used to calculate the ACGR as defined by the USED. Details are available here. The table does not include graduation options available only to students with disabilities.
States with an asterisk (*) listed after the diploma required students to achieve a passing score on an assessment to graduate, and/or factor student scores on end-of-course (EOC) assessment(s) into course grades. Note: Most states transitioned to new assessments in 2014-15 and have changed student stakes. To view the most current student stakes for assessment, click here. Too, all states that require students to achieve a passing score on an assessment offer alternate routes to meeting the requirement.
Diploma classification:
either minimum (not CCR) or
CCR mandatory, default (M) or (P),
or opt in.
Achieve considers states’ mathematics and ELA/literacy high school graduation requirements to be at the CCR level if students are expected to complete a course of study aligned with state-adopted CCR standards, which typically includes at least three years of mathematics (through the content generally found in an Algebra II or an integrated third-year math course) and four years of rigorous, grade-level English. Achieve has classified states’ CCR diploma offerings into the following categories:
• CCR mandatory ( ): state has established graduation requirements that specify a CCR course of study that all students must complete. Students earn a high school diploma only if they complete the required courses or content.
• CCR default ( ): state requires all students to be automatically enrolled into a “default” CCR diploma, which students can opt out of if their parents sign a waiver. There are generally two approaches to establishing a default diploma:
• Minimum (M): States offer a separate minimum diploma for students who opt out of the default CCR course of study.
• Personal Modification (P): States allow students to opt out of individual courses – typically advanced mathematics or science courses – but award students the same diploma as those who complete the full set of CCR requirements.
• CCR voluntary ( ) diploma: state has a college-preparatory curriculum or course sequence aligned with postsecondary admissions requirements that are at the CCR level, but students must individually choose to opt into them.
A state’s diploma offering(s) are considered Minimum ( ) if the diploma requirements do not meet CCR expectations as defined above.
Percentage of students earning a CCR diploma in
2014
Percentage: If available, the percentage of students earning CCR diplomas in the state in 2014.
NR (Not Reported): If the diploma was CCR but the state did not report the percentage of students earning that diploma. Additionally, states that have CCR default diplomas with personal modification opt out are classified as a “Not Reported” because none publicly report the percentage of students personally modifying the requirements.
N/A (Not Applicable): If the diploma was not at the CCR level the state received an N/A.
Note: Generally the percentage reported in this column is of the graduates, not of the cohort that started four years prior. The denominators are provided in the chart to clarify whether states are reporting against graduates or the cohort.
Student subgroup data reported
YES: State reports data against all or most of the federal indicators.
NO: State does not report subgroup data. States with CCR default diplomas with personal modification opt out are classified as a “NO” because they do not publicly report the percentage of students personally modifying the requirements.
achieve.org
5
Graduation Requirements
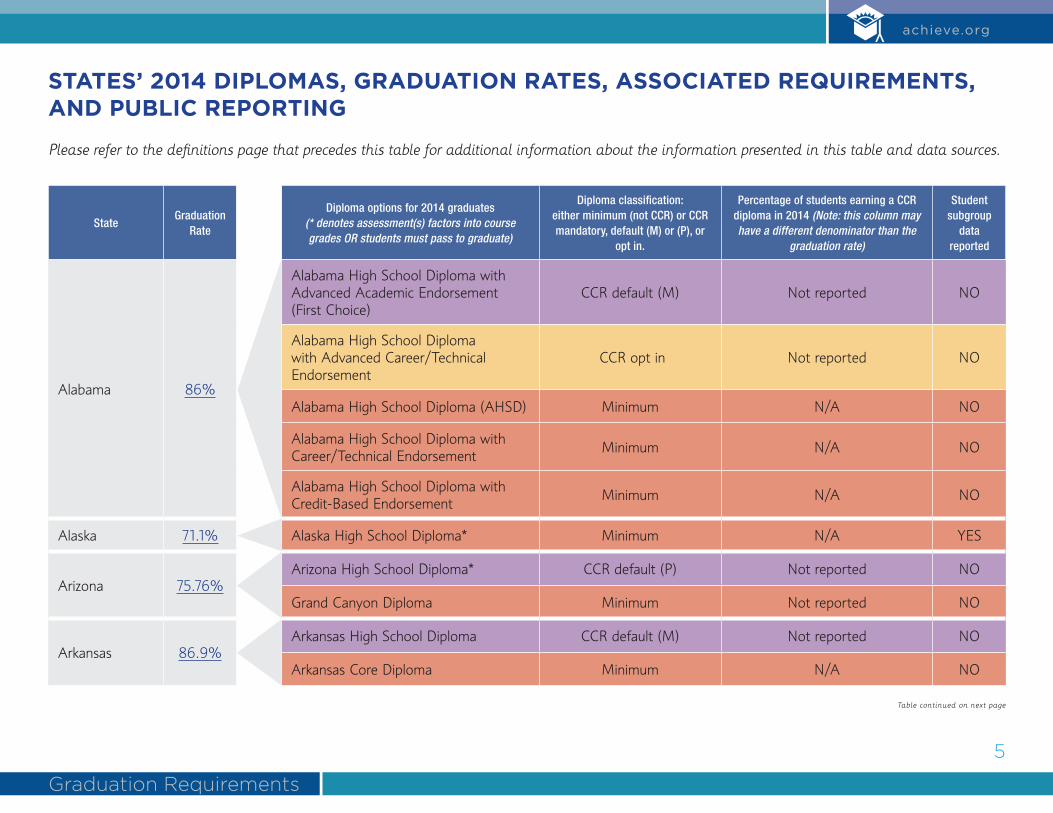
STATES’ 2014 DIPLOMAS, GRADUATION RATES, ASSOCIATED REQUIREMENTS, AND PUBLIC REPORTING
Please refer to the definitions page that precedes this table for additional information about the information presented in this table and data sources.
Table continued on next page
StateGraduation
Rate
Diploma options for 2014 graduates (* denotes assessment(s) factors into course grades OR students must pass to graduate)
Diploma classification: either minimum (not CCR) or CCR mandatory, default (M) or (P), or
opt in.
Percentage of students earning a CCR diploma in 2014 (Note: this column may have a different denominator than the
graduation rate)
Student subgroup
data reported
Alabama 86%
Alabama High School Diploma with Advanced Academic Endorsement (First Choice)
CCR default (M) Not reported NO
Alabama High School Diploma with Advanced Career/Technical Endorsement
CCR opt in Not reported NO
Alabama High School Diploma (AHSD) Minimum N/A NO
Alabama High School Diploma with Career/Technical Endorsement Minimum N/A NO
Alabama High School Diploma with Credit-Based Endorsement Minimum N/A NO
Alaska 71.1% Alaska High School Diploma* Minimum N/A YES
Arizona 75.76%Arizona High School Diploma* CCR default (P) Not reported NO
Grand Canyon Diploma Minimum Not reported NO
Arkansas 86.9%Arkansas High School Diploma CCR default (M) Not reported NO
Arkansas Core Diploma Minimum N/A NO
achieve.org
6
Graduation Requirements
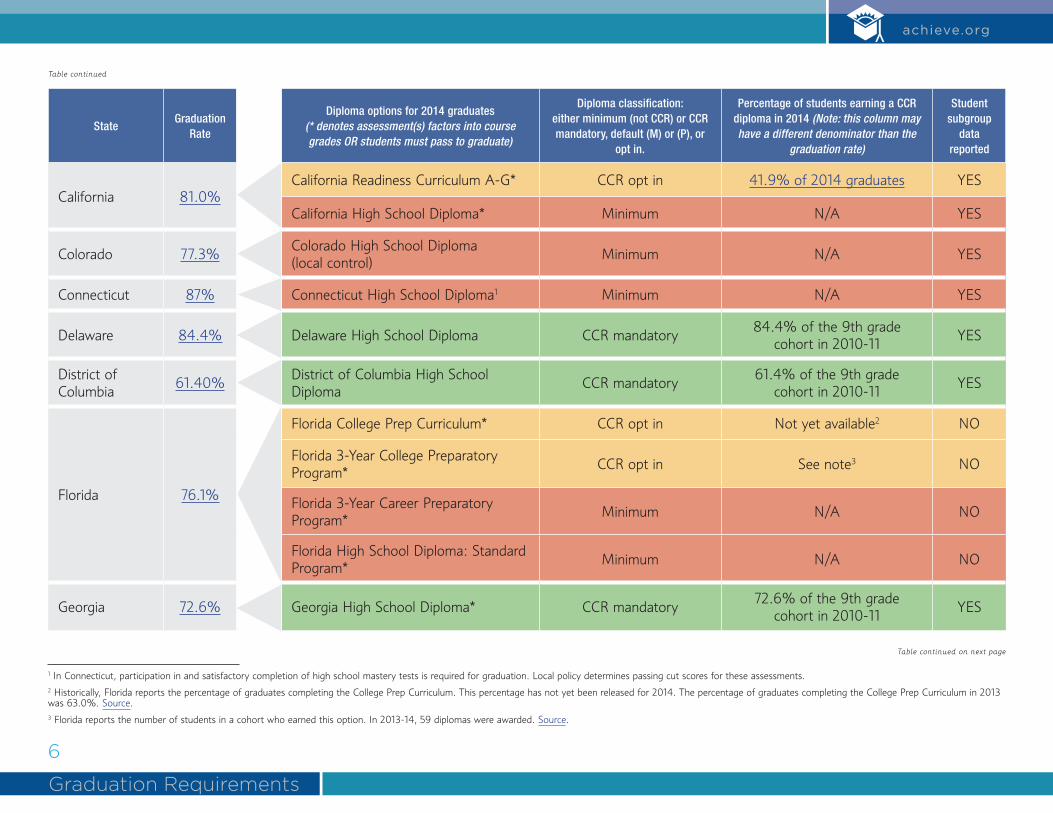
Table continued
1 In Connecticut, participation in and satisfactory completion of high school mastery tests is required for graduation. Local policy determines passing cut scores for these assessments.2 Historically, Florida reports the percentage of graduates completing the College Prep Curriculum. This percentage has not yet been released for 2014. The percentage of graduates completing the College Prep Curriculum in 2013 was 63.0%. Source.3 Florida reports the number of students in a cohort who earned this option. In 2013-14, 59 diplomas were awarded. Source.
Table continued on next page
StateGraduation
Rate
Diploma options for 2014 graduates (* denotes assessment(s) factors into course grades OR students must pass to graduate)
Diploma classification: either minimum (not CCR) or CCR mandatory, default (M) or (P), or
opt in.
Percentage of students earning a CCR diploma in 2014 (Note: this column may have a different denominator than the
graduation rate)
Student subgroup
data reported
California 81.0%California Readiness Curriculum A-G* CCR opt in 41.9% of 2014 graduates YES
California High School Diploma* Minimum N/A YES
Colorado 77.3% Colorado High School Diploma (local control) Minimum N/A YES
Connecticut 87% Connecticut High School Diploma1 Minimum N/A YES
Delaware 84.4% Delaware High School Diploma CCR mandatory 84.4% of the 9th grade cohort in 2010-11 YES
District of Columbia 61.40% District of Columbia High School
Diploma CCR mandatory 61.4% of the 9th grade cohort in 2010-11 YES
Florida 76.1%
Florida College Prep Curriculum* CCR opt in Not yet available2 NO
Florida 3-Year College Preparatory Program* CCR opt in See note3 NO
Florida 3-Year Career Preparatory Program* Minimum N/A NO
Florida High School Diploma: Standard Program* Minimum N/A NO
Georgia 72.6% Georgia High School Diploma* CCR mandatory 72.6% of the 9th grade cohort in 2010-11 YES
achieve.org
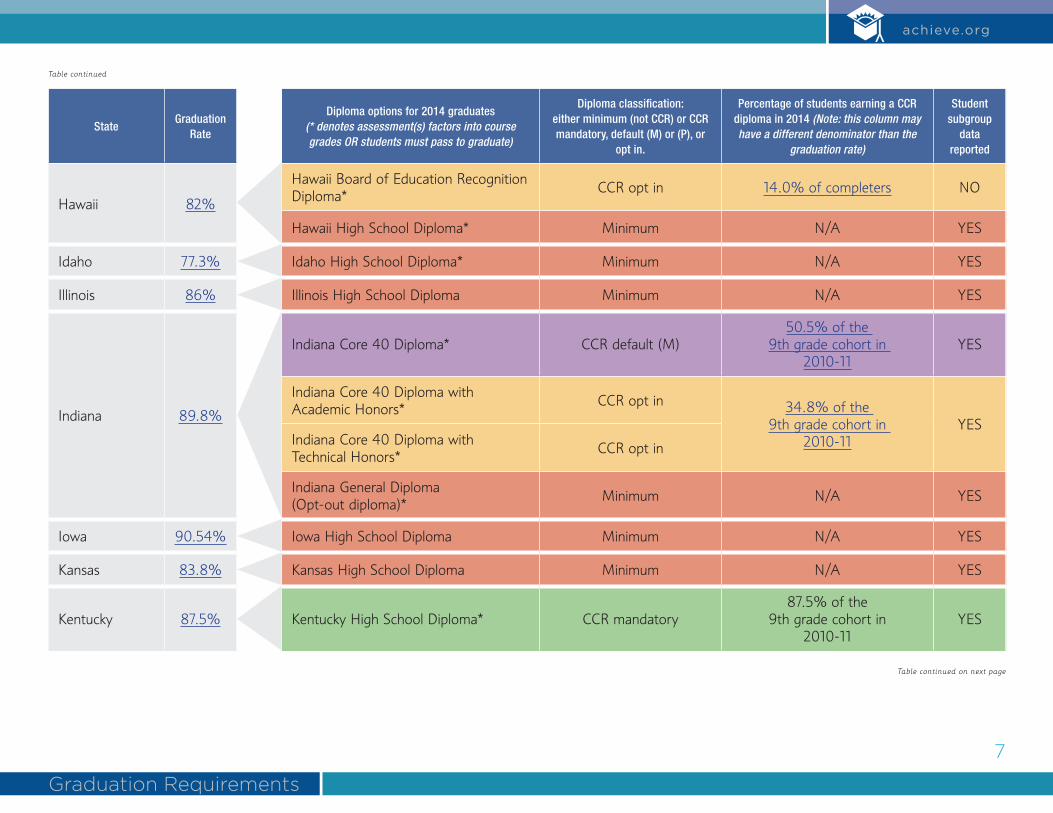
7
Graduation Requirements
Table continued
Table continued on next page
StateGraduation
Rate
Diploma options for 2014 graduates (* denotes assessment(s) factors into course grades OR students must pass to graduate)
Diploma classification: either minimum (not CCR) or CCR mandatory, default (M) or (P), or
opt in.
Percentage of students earning a CCR diploma in 2014 (Note: this column may have a different denominator than the
graduation rate)
Student subgroup
data reported
Hawaii 82%
Hawaii Board of Education Recognition Diploma* CCR opt in 14.0% of completers NO
Hawaii High School Diploma* Minimum N/A YES
Idaho 77.3% Idaho High School Diploma* Minimum N/A YES
Illinois 86% Illinois High School Diploma Minimum N/A YES
Indiana 89.8%
Indiana Core 40 Diploma* CCR default (M)50.5% of the
9th grade cohort in 2010-11
YES
Indiana Core 40 Diploma with Academic Honors* CCR opt in 34.8% of the
9th grade cohort in 2010-11
YESIndiana Core 40 Diploma with Technical Honors* CCR opt in
Indiana General Diploma (Opt-out diploma)* Minimum N/A YES
Iowa 90.54% Iowa High School Diploma Minimum N/A YES
Kansas 83.8% Kansas High School Diploma Minimum N/A YES
Kentucky 87.5% Kentucky High School Diploma* CCR mandatory87.5% of the
9th grade cohort in 2010-11
YES

achieve.org
8
Graduation Requirements
Table continued
Table continued on next page
1 In 2006, Minnesota passed a policy to raise its graduation requirements to the CCR level for all students beginning with the graduating class of 2015.
StateGraduation
Rate
Diploma options for 2014 graduates (* denotes assessment(s) factors into course grades OR students must pass to graduate)
Diploma classification: either minimum (not CCR) or CCR mandatory, default (M) or (P), or
opt in.
Percentage of students earning a CCR diploma in 2014 (Note: this column may have a different denominator than the
graduation rate)
Student subgroup
data reported
Louisiana 74.6%
Louisiana High School Diploma (Core 4 Curriculum)* CCR opt in Not reported NO
Louisiana High School Diploma with Academic Endorsement* CCR opt in Not reported NO
Louisiana High School Diploma with Career/Technical Endorsement* CCR opt in Not reported NO
Louisiana Career Diploma* Minimum N/A NO
Louisiana Basic Core Diploma* Minimum N/A NO
Maine 86.5% Maine High School Diploma Minimum N/A YES
Maryland 86.4%
University System of Maryland Course Requirements* CCR opt in 60% of 2014 graduates YES
Maryland High School Diploma* Minimum N/A YES
Massachusetts 86.1%MassCore* CCR opt in 72.4% of 2014 graduates YES
Local Control* Minimum N/A YES
Michigan 78.58% Michigan Merit Curriculum CCR default (P) Not reported NO
Minnesota 81.2% Minnesota High School Diploma* Minimum1 N/A YES

achieve.org
9
Graduation Requirements
Table continued
Table continued on next page
1 In 2010, Nebraska passed a policy to raise its graduation requirements to the CCR level for all students beginning with the graduating class of 2015. 2 While the Advanced Diploma does not meet Achieve’s criteria for CCR ELA/literacy and mathematics graduation requirements, a student may submit this diploma as qualification for admission to public institutions within the Nevada System of Higher Education.
StateGraduation
Rate
Diploma options for 2014 graduates (* denotes assessment(s) factors into course grades OR students must pass to graduate)
Diploma classification: either minimum (not CCR) or CCR mandatory, default (M) or (P), or
opt in.
Percentage of students earning a CCR diploma in 2014 (Note: this column may have a different denominator than the
graduation rate)
Student subgroup
data reported
Mississippi Not yet available
Mississippi High School Diploma* CCR default (P) Not reported NO
Mississippi Career Pathway Option* Minimum N/A NO
Mississippi District Option Diploma* Minimum N/A NO
Mississippi Early Exit Diploma Option* Minimum N/A NO
Missouri 87.4%
Missouri Coordinating Board for Higher Education (CBHE) Recommended High School Core Curriculum
CCR opt in Not reported NO
Missouri High School Diploma Minimum N/A YES
Montana 85.4%
Minimum Core College Preparatory Program CCR opt in Not reported NO
Rigorous Core College Preparatory Program CCR opt in Not reported NO
Montana High School Diploma Minimum N/A YES
Nebraska 89.68% Local Control Minimum1 N/A YES
Nevada 70.0%Nevada Advanced Diploma* CCR opt in 28%2 NO
Nevada High School Diploma* Minimum N/A NO
New Hampshire 88.65% New Hampshire High School Diploma Minimum N/A YES

achieve.org
10
Graduation Requirements
Table continued
3 Ohio does not publicly report at the state level the percentage of students completing the honors diploma options; however, Ohio made this data available to Achieve for the 2014 Closing the Expectations Gap report — 14.0% of 2013 graduates earned an honors diploma. Historically, the state does report at the school level the percentage of students earning the honors diploma options through the state’s school report cards, available here, but report cards reflecting 2014 graduates are not yet available.
Table continued on next page
StateGraduation
Rate
Diploma options for 2014 graduates (* denotes assessment(s) factors into course grades OR students must pass to graduate)
Diploma classification: either minimum (not CCR) or CCR mandatory, default (M) or (P), or
opt in.
Percentage of students earning a CCR diploma in 2014 (Note: this column may have a different denominator than the
graduation rate)
Student subgroup
data reported
New Jersey 88.60% New Jersey High School Diploma* Minimum N/A YES
New Mexico 69.3% New Mexico Diploma of Excellence* CCR default (P) Not reported NO
New York 76.40%
New York Diploma with Advanced Designation* CCR opt in 31% of the 9th grade
cohort in 2010-11 YES
New York Regents Diploma* Minimum N/A YES
New York State Local Diploma* Minimum N/A YES
North Carolina 83.9% North Carolina High School Diploma (Future-Ready Core) CCR default (P) Not reported NO
North Dakota 86.93% North Dakota High School Diploma Minimum N/A YES
Ohio Not yet available
Ohio High School Diploma* CCR default (M) Not reported NO
Ohio Academic Diploma with Honors* CCR opt in
Not yet available3 NOOhio Career-Technical Diploma with Honors* CCR opt in
Ohio International Baccalaureate Diploma with Honors* CCR opt in
Oklahoma Not yet available
Oklahoma College-Prep/Work-Ready Curriculum* CCR default (M) 83.7% of 2014 graduates NO
Oklahoma Core Curriculum Standards Diploma* Minimum N/A NO

achieve.org
11
Graduation Requirements
Table continued
4 In 2013, the Texas Legislature passed HB 5, which replaces the CCR-level Recommended High School Program with the Foundation High School Program as the defaul course of student, which is not at the CCR level. The Distinguished Aciehevement Program, which sets the bar even higher than the CCR level, is being replaced with the Distinguished Level of Achievement. Students completing their fourth or final year of high school in 2013-14 had the option of graduating under the Foundation High School Program. Of the 294,240 class of 2014 graduates, 3,312 (1.1%) graduated under the Foundation High School Program. Source.
Table continued on next page
StateGraduation
Rate
Diploma options for 2014 graduates (* denotes assessment(s) factors into course grades OR students must pass to graduate)
Diploma classification: either minimum (not CCR) or CCR mandatory, default (M) or (P), or
opt in.
Percentage of students earning a CCR diploma in 2014 (Note: this column may have a different denominator than the
graduation rate)
Student subgroup
data reported
Oregon 71.98% The Oregon Diploma* Minimum N/A YES
Pennsylvania 85% Pennsylvania High School Diploma (local control) Minimum N/A YES
Rhode Island 81% Rhode Island High School Diploma Minimum N/A YES
South Carolina 80% South Carolina High School Diploma* Minimum N/A YES
South Dakota 82.74% South Dakota High School Diploma CCR default (P) Not reported NO
Tennessee 87.2% Tennessee High School Diploma* CCR mandatory 87.2% of the 9th grade cohort in 2010-11 YES
Texas 88.3%
Texas Distinguished Achievement Program* CCR opt in 15.6% of the 9th grade
cohort in 2010-11 YES
Texas Recommended High School Program* CCR default (M) 69.9% of the 9th grade
cohort in 2010-11 YES
Texas Minimum High School Program* Minimum4 N/A YES
Utah 83% Utah Standard Diploma CCR default (P) Not reported NO
Vermont 87.8% Vermont High School Diploma Minimum N/A YES
Virginia 86.1%
Virginia Advanced Studies Program* CCR opt in 50.7% of the 9th grade cohort in 2010-11 YES
Virginia Standard High School Diploma* Minimum N/A YES

achieve.org
Graduation Requirements
StateGraduation
Rate
Diploma options for 2014 graduates (* denotes assessment(s) factors into course grades OR students must pass to graduate)
Diploma classification: either minimum (not CCR) or CCR mandatory, default (M) or (P), or
opt in.
Percentage of students earning a CCR diploma in 2014 (Note: this column may have a different denominator than the
graduation rate)
Student subgroup
data reported
Washington 77.2% Washington High School Diploma* CCR default (P) Not reported NO
West Virginia 84.46%
West Virginia Core Plus Skilled Pathway Diploma Minimum N/A NO
West Virginia Core Plus Professional Pathway Diploma Minimum N/A NO
Wisconsin 88.6%
Wisconsin High School Diploma Minimum N/A NO
Wisconsin Technical High School Diploma Minimum N/A NO
Wyoming 78.61%
Wyoming Hathaway Scholarship Honors Level* CCR opt in Not reported NO
Wyoming Hathaway Scholarship Performance Level* CCR opt in Not reported NO
Wyoming Hathaway Scholarship Opportunity Level* CCR opt in Not reported NO
Wyoming High School Diploma Minimum N/A YES
Wyoming Hathaway Scholarship Provisional Opportunity Level* Minimum N/A NO
Table continued
1400 16th Street, NW, Suite 510 Washington, DC 20036
202.419.1540
www.achieve.org


![[KEYADE CASE STUDY] PhotoBox optimizes its landing pages to achieve better conversion rates](https://img.pdfslide.us/doc/110x75/559673d01a28ab3f618b4783/keyade-case-study-photobox-optimizes-its-landing-pages-to-achieve-better-conversion-rates.jpg)