Embed Size (px)
Citation preview
Regular paper
How the RNA isolation method can affect microRNA microarray resultsAgnieszka Podolska1, Bogumil Kaczkowski 2, Thomas Litman3, Merete Fredholm1
and Susanna Cirera1*
1Department of Basic Animal and Veterinary Sciences, Section of Genetics and Bioinformatics, Faculty of Life Sciences, University of Copenha-gen, Copenhagen, Denmark; 2Bioinformatics Centre, Department of Biology and Biotech Research and Innovation Centre, University of Copen-hagen, Copenhagen, Denmark; 3LEO Pharma A/S, Ballerup, Denmark
The quality of RNA is crucial in gene expression ex-periments. RNA degradation interferes in the measure-ment of gene expression, and in this context, microRNA quantification can lead to an incorrect estimation. In the present study, two different RNA isolation methods were used to perform microRNA microarray analysis on porcine brain tissue. One method is a phenol-guanidine isothiocyanate-based procedure that permits isolation of total RNA. The second method, miRVana™ microRNA isolation, is column based and recovers the small RNA fraction alone. We found that microarray analyses give different results that depend on the RNA fraction used, in particular because some microRNAs appear very sensi-tive to the RNA isolation method. We conclude that pre-cautions need to be taken when comparing microarray studies based on RNA isolated with different methods.
Keywords: microRNA, microRNA isolation method, small RNA frac-tion, microarray, pig
Received: 12 April, 2011; revised: 09 November, 2011; accepted: 03 December, 2011; available on-line: 06 December, 2011
INTROducTION
MicroRNAs (miRNAs) are recently discovered, small non-coding RNAs (around 22 nucleotides long) that act as post-transcriptional regulators by binding to the 3’UTR of multiple target mRNAs. This binding results in inhibition of translation and/or mRNA degradation. More than 60 % of human protein-coding genes are targeted by microRNAs (Friedman & Kai-How Farh, 2009). The study of miRNAs is a rapidly developing re-search area due to the growing interest in microRNAs as regulators of multiple biological processes.. Currently, several technologies are used for conducting gene ex-pression profiling. For microRNA analysis, microarrays, RT-qPCR and next-generation sequencing are the most commonly used techniques. In particular, microarray technology has been extensively used for high-through-put microRNA expression profiling in many different biological scenarios. While evaluation of various miRNA microarray platforms has received considerable attention (Maouche et al., 2008; Sato et al., 2009), fewer studies are devoted to the RNA isolation method (Ibberson et al., 2009; Liu et al., 2009). Nevertheless, for all the profil-ing technologies the reliable detection of the transcrip-tional differences between relevant samples depends on the quality of the isolated RNA. RNA integrity is critical for successful quantification of gene expression since the
short fragments arising from RNA degradation can easily interfere with the assay, resulting in an over- or underes-timation of microRNA expression. In this study we eval-uated two different RNA isolation methods, a guanidine isothiocyanate method which isolates total RNA and a silica-gel column based method which only isolates the small RNA fraction (up to 200 nt). The isolated RNA was used for microRNA expression profiling by applying the miRCURY LNA™ microRNA Array platform from Exiqon.
MATeRIAls ANd MeThOds
Biological material. The piglets and adult pigs used in this study were Landrace/Yorkshire/Duroc crosses. Two tissues, cortex and cerebellum, were sampled at three different developmental stages: fetus gestation day 50 (F50), fetus gestation day 100 (F100) and three-months-old pigs (named Adult). Tissues were immedi-ately snap frozen in liquid nitrogen after sampling, and stored at –80 °C until used. Two technical replicates rep-resented by two pieces of tissue from the same biologi-cal subject (one for small RNA and one for total RNA isolation) for each developmental stage/tissue were used for the microarray study. The pigs included in this study were raised under production conditions according to Danish standards for animal husbandry. The pigs were euthanized by a licensed veterinarian.
RNA isolation methods. The small and total RNA fractions were isolated using the miRVana™ microRNA Isolation Kit (Applied Biosystems/Ambion, Austin, TX, USA) and Tri Reagent® (Molecular Research Center, Inc., USA), respectively. Both procedures were followed ac-cording to the manufacturer’s recommendations. The same biological material was subjected to both isolation procedures. For the small RNA fraction isolation, 100-180 mg of the tissue was processed per sample. For total RNA isolation 20–90 mg of the tissue was used.
*e-mail: [email protected]: ANOVA, analyzes of variance; F100, fetus gestation day 100; F50, fetus gestation day 50; FFPE, formalin fixed paraffin embedded; hsa, Homo Sapiens; LIMMA, linear models for microar-ray data; LMW, low molecular weight; LNA, locked nucleic acid; MI-AME, minimum information about a microarray experiment; miR-BAse, microRNA database; miRNA, microRNA; mRNA, messenger RNA; NA, not-available value; NGS, next generation sequencing; nt, nucleotide; RIN, RNA Integrity Number; RQI, RNA Quality Indicator; rRNA, rybosomal RNA; RT-qPCR, real time quantitative PCR; S.D., standard deviation; ssc, Sus scrofa; TIFF, tagged image file format; tRNA, transfer RNA; UTR, untranslated region.
Paper in Press, No. 14883 Vol. 58, 2011
on-line at: www.actabp.pl
2 2011A. Podolska and others
RNA quantity was determined on a Nanodrop 1000 (Peqlab Biotechnologie, Germany). The RNA concentra-tions assessed by Nanodrop as well as the 260/280 nm ratios are provided in the supplementary files. Addition-ally, the integrity of the small and total RNA samples was measured by Small RNA Assay and Experion RNA StdSens Analysis Kit using a 2100 Bioanalyzer (Agilent Technologies, Santa Clara, CA, USA) and Experion (Bio-Rad Laboratories, Inc., Hercules, CA, USA), respectively. The quality assessment of small and total RNA samples is provided in supplementary files1 and 2.
MicroRNA microarray. A total of 200 ng of the small RNA fraction and 1 µg of the total RNA fraction was used for the microarray analysis. miRCURY LNA™ microRNA Power labeling Kit was applied to label the RNA with two different fluorophores (Hy3 and Hy5). Spike-in microRNAs (used as controls for RNA label-ing and hybridization, as well as for data normalization) were added in equal amounts to each reaction prior to the labeling.
The miRCURY LNA™ microRNA Microarray, ver-sion 9.2 (containing over 2000 probes corresponding to microRNAs annotated in miRBase 9.2, across all spe-cies) was used for the array studies. All hybridizations were performed according to the miRCURY™ LNA ar-ray manual (Exiqon, Vedbaek, Denmark), in a Tecan HS Pro 4800 hybridization station (Tecan Group Ltd., Män-nedorf, Switzerland) for 16 hours followed by stringent washes to remove unhybridized or unspecifically hybrid-ized molecules. After hybridization, the microarray slides were scanned and stored in an ozone-free environment (ozone level below 2.0 ppb), in order to minimize bleach-ing of the fluorescent dyes. Scanning was performed in an Agilent DNA microarray scanner (Agilent Technolo-gies, Santa Clara, CA, USA) to generate Tagged Image File Format (TIFF) images. The intensities recorded in the TIFF images were converted to digital values using Imagene version 7.0 software. The quality control of the spots was performed by the software and curated manu-ally. Spots of unsatisfactory quality, e.g. caused by spot-ting or hybridization artifacts, were flagged accordingly.
The text files generated by Imagene v.7.0 were im-ported into the R environment (R Development Core Team (2007)). The importing and pre-processing of data was performed using the Linear Models for Microar-ray Data (LIMMA) package (Smyth et al., 2005). Poor quality (flagged) spots were excluded from the analysis. The “normexp” background correction method (Smyth et al., 2005) was applied. The intensities were then log2-transformed and normalized, using the LIMMA imple-mentation in quantile normalization. The intensities of four intra slide replicates were used to calculate aver-age intensities of each hybridization signal. The data were filtered, first to include only human and porcine microRNA (hsa and ssc microRNAs, respectively) and secondly, to exclude probes which: a) showed little or no variation across all experiments (variance filter, vari-ance ≤ 0.1); b) had intensities that in all cases were close to the background, meaning no indication of true signal (the background was set at the probe log2-intensity value of 6) c) had more than five not-available values (NAs). The final, filtered data set consists of intensity values for 240 probes (see supplementary data). Data is MIAME compliant and has been deposited in the GEO data-base (http://www.ncbi.nlm.nih.gov/geo/) with accession number GSE20893.
Unsupervised, hierarchical clustering was performed in the dChip software, which is freely available at www.
dchip.org. Expression values were standardized by sub-tracting the mean of the values and dividing by S.D. The 1- Pearson correlation coefficient was used as a distance metric.
ResulTs ANd dIscussION
Different purification methods may significantly af-fect the recovery of miRNA species in the isolated RNA fraction. Therefore, the focus of this study was to evalu-ate how two different RNA extraction methods could affect the resulting microRNA microarray expression profiles.
It has been noted that RNA quality influences the outcome of microRNA expression studies. (Wang et al., 2008). Both the RNA extraction protocol and the sub-sequent downstream processing have an impact on the RNA quality and integrity, consequently affecting the quantitative gene expression analysis (Hammerle-Fick-inger et al., 2010). Ibberson et al. (2009) argue that mi-croRNA degradation is a random process affecting the microarray signal intensities in a non-specific manner. Another study suggests that regardless of the degradation in RNA samples, microRNA expression profiles are very comparable to those based on samples with intact RNA (Liu et al., 2008). Additionally, observations from a study performed on formalin-fixed paraffin embedded (FFPE) tissues indicate that due to their small size microRNAs might be less susceptible to degradation in comparison with mRNAs (Doleshal et al., 2008). Also, a high cor-relation was found between matched RNA samples, of which one was intact and the other degraded (Zhang et al., 2008). Notably, the isolation method can influence the composition of microRNA species included in the final sample, which can bias the expression analysis (Ac-cerbi et al., 2010). Moreover, Hammerle-Fickinger (2010) showed that two commercially available, column-based kits did not yield reproducible results, possibly because of sub-optimal filter membrane conditions.
comparison of the two RNA extraction procedures
The two methods evaluated in this study are widely applied for RNA isolation, but employ different bio-chemical principles; the first method applies phenol-gua-nidine isothiocyanate isolation of total RNA, while the second method is a column-based enrichment procedure that includes only RNA molecules of about 200 nt and less.
Although we used the same biological material for both isolation techniques, we noticed that the amount of lipids that could interfere with total RNA (and small RNA, to a certain extent) isolation increased with the age of the sampled tissues. Thus, adult samples had a significant amount of lipids separating on the top of the three phases during phenol-chloroform extraction. The first steps of column-based miRVana microRNA isola-tion protocol similarly to total RNA isolation, involves phenol-chloroform extraction. However, after the phase separation, the aqueous phase is transferred to a column and processed with different reagents than the aqueous fraction in the total RNA procedure. Brain is a lipid rich organ and for studies where preservation of the small RNA fraction is not important, a Qiagen kit (Hilden, Germany) intended for lipid-rich tissue isolation is avail-able for isolation of high quality total RNA. However, this kit depletes the sample of RNA species smaller than 200 nt. Therefore, in our case, a method that preserves
Vol. 58 3Effect of RNA isolation method on miRNA microarray results
small RNA species was used. Variations in the lipid con-tent could cause slight degradation in the samples from Fetus gestation day 100 and Adult samples. This notion is supported by decreasing RNA Quality Indicator (RQI) numbers obtained by Experion electrophoresis, which is highest in F50 samples and gradually decreases with age. The small RNA enrichment procedure, apart from the phenomenon mentioned above, encounters a rather dif-ferent issue: small RNA species can bind to larger RNA molecules, and therefore may be washed away from the column. This will result in loss of small RNAs and may introduce sample to sample variation in the composition and abundance of small RNA species. The 2100 Bioana-lyzer results confirm slight, progressing degradation of the RNA samples with age, reflected in the increasing percentage of microRNA fraction (Supplementary file 1 at www.actabp.pl). This is in agreement with Becker et al. (2010) who observed degradation of larger RNA frag-ments (rRNAs, tRNAs and mRNAs) resulting in accu-mulation of small fragments which leads to overestima-tion of microRNA fraction. One could expect that any isolation method-dependent differences in RNA compo-sition would be reflected in the downstream analysis. An earlier study reports significant differences in the mean RNA Integrity Number and the mean A260/280 ratios between different RNA isolation methods (Hammerle-Fickinger et al., 2010). In the same study, two out of five total RNA prep methods showed uniform electrophero-gram profiles, whereas a small RNA enrichment method failed to prove its reproducibility. Interestingly, another research group found that out of three RNA isolation methods, phenol-guanidine isothiocyanate isolation of to-tal RNA allowed the highest low molecular weight (LMW) RNA recovery: 22–34 % of total RNA. miRVana™ mi-croRNA Isolation Kit placed second giving satisfactory yield of 16–19 % (Masotti et al., 2009).
RNA quality and integrity assessment
We observed that both methods produced fractions containing RNA of high quality as assessed by several assays: automated capillary electrophoresis performed on total RNA samples using the Experion RNA StdSens Analysis Kit resulted in electropherograms showing in-tact RNA. Moreover, RNA Quality Indicator number (RQI) calculated for each sample ranged from 6.2 to 9.8 (10 being the most intact profile, 1.0 being the most degraded profile). In addition, small RNA Assay was performed on an Agilent 2100 Bioanalyzer to asses the integrity of the small RNA fractions. Because the RNA Integrity Number (RIN) only applies to total RNA, we visually inspected each of the electrophoretic profiles of the small RNA fractions to asses their integrity and qual-ity. We found that all the electropherograms were highly similar to each other and represented high quality, intact small RNA fractions.
In the case of total RNA, and possibly the small RNA extraction, the fraction isolated from fetal tissues from gestation day 50 appeared slightly more intact than those isolated from fetus 100 and three-months-old animals, respectively.
miRNA gene expression study
After the above-mentioned quality controls, the sam-ples were profiled on the miRCURY LNA™ microRNA Microarray version 9.2 platform (Exiqon, Vedbæk, Den-mark). Probes spotted on the array benefit from the LNA technology that enhances sensitivity and specificity
of the hybridization. The Exiqon microRNA microarray is designed to capture mature microRNA species. How-ever, the possibility of capturing longer precursor miR-NAs does exist. In the total RNA fraction all RNA sizes are present. Therefore, in principle, pre-miRNA and ma-ture RNA species are available for hybridization to the microarray probes. In contrast, the small RNA fraction only includes RNA species < 200 nt. Therefore, both mature and pre-miRNAs may be present in this fraction, while larger RNA molecules are excluded. This differ-ence in RNA size composition could possibly contribute to some of the observed variation in the microarray re-sults.
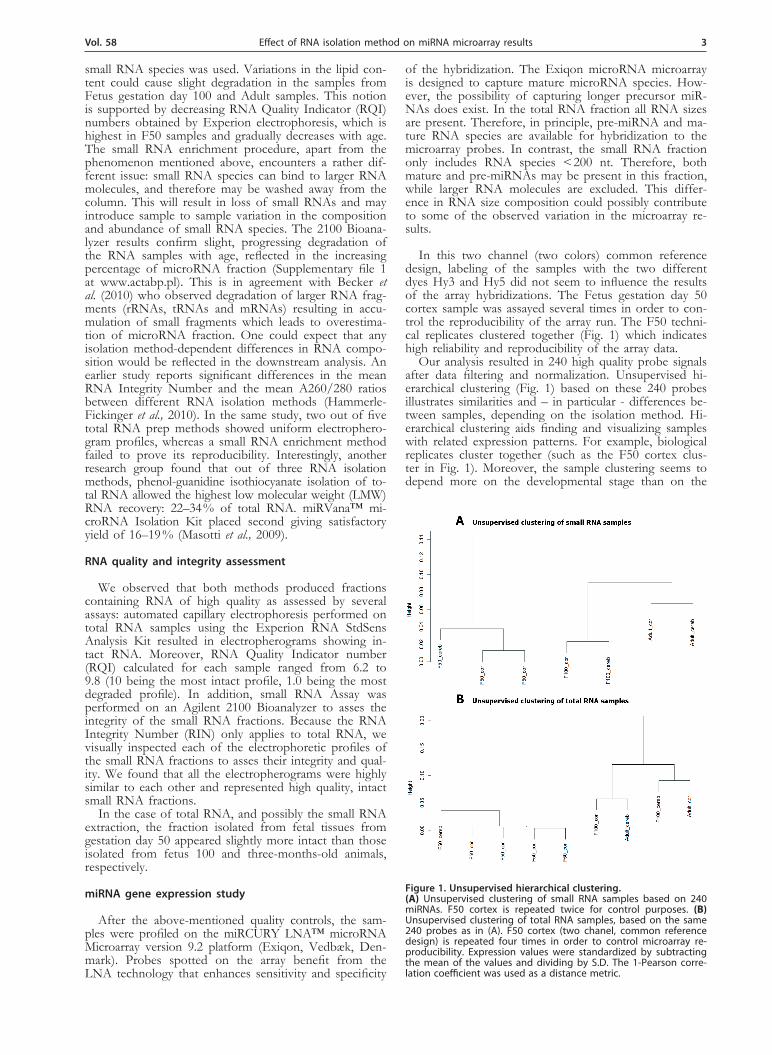
In this two channel (two colors) common reference design, labeling of the samples with the two different dyes Hy3 and Hy5 did not seem to influence the results of the array hybridizations. The Fetus gestation day 50 cortex sample was assayed several times in order to con-trol the reproducibility of the array run. The F50 techni-cal replicates clustered together (Fig. 1) which indicates high reliability and reproducibility of the array data.
Our analysis resulted in 240 high quality probe signals after data filtering and normalization. Unsupervised hi-erarchical clustering (Fig. 1) based on these 240 probes illustrates similarities and – in particular - differences be-tween samples, depending on the isolation method. Hi-erarchical clustering aids finding and visualizing samples with related expression patterns. For example, biological replicates cluster together (such as the F50 cortex clus-ter in Fig. 1). Moreover, the sample clustering seems to depend more on the developmental stage than on the
Figure 1. unsupervised hierarchical clustering.(A) Unsupervised clustering of small RNA samples based on 240 miRNAs. F50 cortex is repeated twice for control purposes. (B) Unsupervised clustering of total RNA samples, based on the same 240 probes as in (A). F50 cortex (two chanel, common reference design) is repeated four times in order to control microarray re-producibility. Expression values were standardized by subtracting the mean of the values and dividing by S.D. The 1-Pearson corre-lation coefficient was used as a distance metric.

4 2011A. Podolska and others
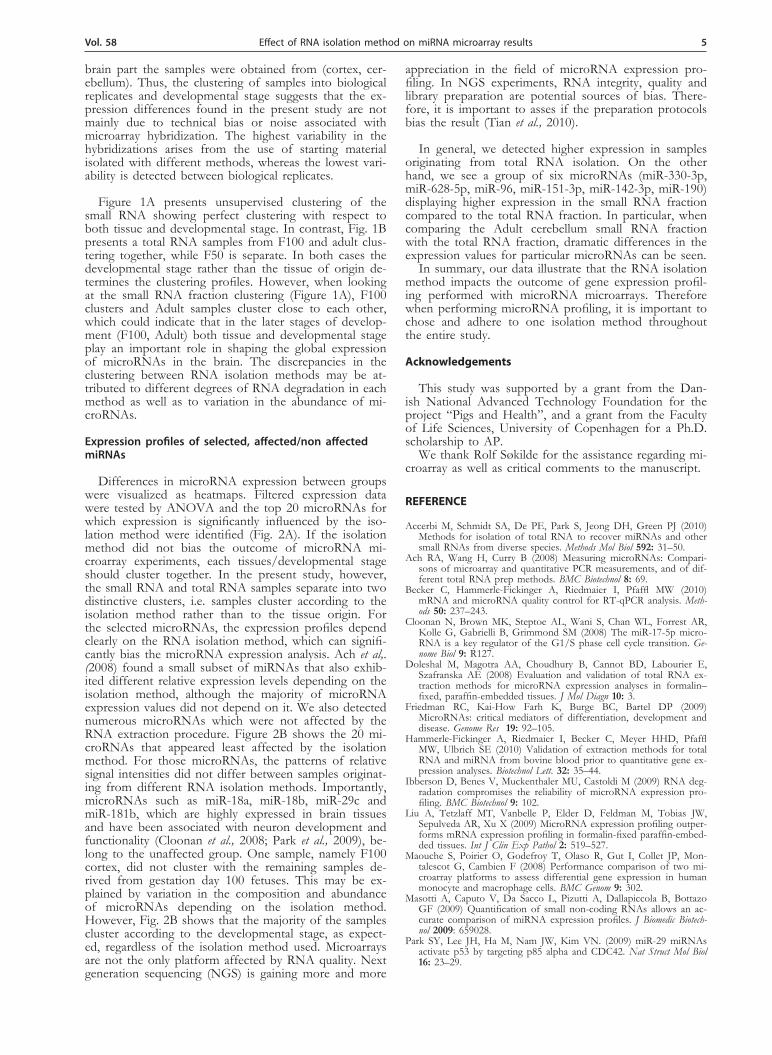
Figure 2. hierarchically clustered heat map representing differences in microRNA expression depending on RNA isolation method. Filtered expression data was tested by ANOVA and the top 20 microRNAs for which expression is not influenced or significantly influ-enced by the isolation method have been identified, respectively. (A) Heatmap showing the 20 candidates for which expression is most influenced by the isolation method. (B) Heat map illustrating similarities in microRNA expression for the two RNA isolation methods. For all samples, similar expression profiles of the chosen candidates are seen, regardless of the isolation method. Green color indicates low and red color indicates high expression. Black bars just above the heatmap indicate total RNA samples; light grey bars indicate small RNA fraction samples.
Vol. 58 5Effect of RNA isolation method on miRNA microarray results
brain part the samples were obtained from (cortex, cer-ebellum). Thus, the clustering of samples into biological replicates and developmental stage suggests that the ex-pression differences found in the present study are not mainly due to technical bias or noise associated with microarray hybridization. The highest variability in the hybridizations arises from the use of starting material isolated with different methods, whereas the lowest vari-ability is detected between biological replicates.
Figure 1A presents unsupervised clustering of the small RNA showing perfect clustering with respect to both tissue and developmental stage. In contrast, Fig. 1B presents a total RNA samples from F100 and adult clus-tering together, while F50 is separate. In both cases the developmental stage rather than the tissue of origin de-termines the clustering profiles. However, when looking at the small RNA fraction clustering (Figure 1A), F100 clusters and Adult samples cluster close to each other, which could indicate that in the later stages of develop-ment (F100, Adult) both tissue and developmental stage play an important role in shaping the global expression of microRNAs in the brain. The discrepancies in the clustering between RNA isolation methods may be at-tributed to different degrees of RNA degradation in each method as well as to variation in the abundance of mi-croRNAs.
expression profiles of selected, affected/non affected miRNAs
Differences in microRNA expression between groups were visualized as heatmaps. Filtered expression data were tested by ANOVA and the top 20 microRNAs for which expression is significantly influenced by the iso-lation method were identified (Fig. 2A). If the isolation method did not bias the outcome of microRNA mi-croarray experiments, each tissues/developmental stage should cluster together. In the present study, however, the small RNA and total RNA samples separate into two distinctive clusters, i.e. samples cluster according to the isolation method rather than to the tissue origin. For the selected microRNAs, the expression profiles depend clearly on the RNA isolation method, which can signifi-cantly bias the microRNA expression analysis. Ach et al,. (2008) found a small subset of miRNAs that also exhib-ited different relative expression levels depending on the isolation method, although the majority of microRNA expression values did not depend on it. We also detected numerous microRNAs which were not affected by the RNA extraction procedure. Figure 2B shows the 20 mi-croRNAs that appeared least affected by the isolation method. For those microRNAs, the patterns of relative signal intensities did not differ between samples originat-ing from different RNA isolation methods. Importantly, microRNAs such as miR-18a, miR-18b, miR-29c and miR-181b, which are highly expressed in brain tissues and have been associated with neuron development and functionality (Cloonan et al., 2008; Park et al., 2009), be-long to the unaffected group. One sample, namely F100 cortex, did not cluster with the remaining samples de-rived from gestation day 100 fetuses. This may be ex-plained by variation in the composition and abundance of microRNAs depending on the isolation method. However, Fig. 2B shows that the majority of the samples cluster according to the developmental stage, as expect-ed, regardless of the isolation method used. Microarrays are not the only platform affected by RNA quality. Next generation sequencing (NGS) is gaining more and more
appreciation in the field of microRNA expression pro-filing. In NGS experiments, RNA integrity, quality and library preparation are potential sources of bias. There-fore, it is important to asses if the preparation protocols bias the result (Tian et al., 2010).
In general, we detected higher expression in samples originating from total RNA isolation. On the other hand, we see a group of six microRNAs (miR-330-3p, miR-628-5p, miR-96, miR-151-3p, miR-142-3p, miR-190) displaying higher expression in the small RNA fraction compared to the total RNA fraction. In particular, when comparing the Adult cerebellum small RNA fraction with the total RNA fraction, dramatic differences in the expression values for particular microRNAs can be seen.
In summary, our data illustrate that the RNA isolation method impacts the outcome of gene expression profil-ing performed with microRNA microarrays. Therefore when performing microRNA profiling, it is important to chose and adhere to one isolation method throughout the entire study.
Acknowledgements
This study was supported by a grant from the Dan-ish National Advanced Technology Foundation for the project “Pigs and Health”, and a grant from the Faculty of Life Sciences, University of Copenhagen for a Ph.D. scholarship to AP.
We thank Rolf Søkilde for the assistance regarding mi-croarray as well as critical comments to the manuscript.
RefeReNce
Accerbi M, Schmidt SA, De PE, Park S, Jeong DH, Green PJ (2010) Methods for isolation of total RNA to recover miRNAs and other small RNAs from diverse species. Methods Mol Biol 592: 31–50.
Ach RA, Wang H, Curry B (2008) Measuring microRNAs: Compari-sons of microarray and quantitative PCR measurements, and of dif-ferent total RNA prep methods. BMC Biotechnol 8: 69.
Becker C, Hammerle-Fickinger A, Riedmaier I, Pfaffl MW (2010) mRNA and microRNA quality control for RT-qPCR analysis. Meth-ods 50: 237–243.
Cloonan N, Brown MK, Steptoe AL, Wani S, Chan WL, Forrest AR, Kolle G, Gabrielli B, Grimmond SM (2008) The miR-17-5p micro-RNA is a key regulator of the G1/S phase cell cycle transition. Ge-nome Biol 9: R127.
Doleshal M, Magotra AA, Choudhury B, Cannot BD, Labourier E, Szafranska AE (2008) Evaluation and validation of total RNA ex-traction methods for microRNA expression analyses in formalin–fixed, paraffin-embedded tissues. J Mol Diagn 10: 3.
Friedman RC, Kai-How Farh K, Burge BC, Bartel DP (2009) MicroRNAs: critical mediators of differentiation, development and disease. Genome Res 19: 92–105.
Hammerle-Fickinger A, Riedmaier I, Becker C, Meyer HHD, Pfaffl MW, Ulbrich SE (2010) Validation of extraction methods for total RNA and miRNA from bovine blood prior to quantitative gene ex-pression analyses. Biotechnol Lett. 32: 35–44.
Ibberson D, Benes V, Muckenthaler MU, Castoldi M (2009) RNA deg-radation compromises the reliability of microRNA expression pro-filing. BMC Biotechnol 9: 102.
Liu A, Tetzlaff MT, Vanbelle P, Elder D, Feldman M, Tobias JW, Sepulveda AR, Xu X (2009) MicroRNA expression profiling outper-forms mRNA expression profiling in formalin-fixed paraffin-embed-ded tissues. Int J Clin Exp Pathol 2: 519–527.
Maouche S, Poirier O, Godefroy T, Olaso R, Gut I, Collet JP, Mon-talescot G, Cambien F (2008) Performance comparison of two mi-croarray platforms to assess differential gene expression in human monocyte and macrophage cells. BMC Genom 9: 302.
Masotti A, Caputo V, Da Sacco L, Pizutti A, Dallapiccola B, Bottazo GF (2009) Quantification of small non-coding RNAs allows an ac-curate comparison of miRNA expression profiles. J Biomedic Biotech-nol 2009: 659028.
Park SY, Lee JH, Ha M, Nam JW, Kim VN. (2009) miR-29 miRNAs activate p53 by targeting p85 alpha and CDC42. Nat Struct Mol Biol 16: 23–29.

6 2011A. Podolska and others
Sato F, Tsuchiya S, Terasawa K, Tsujimoto G (2009) Intra-platform repeatability and inter-platform comparability of microRNA micro-array technology. PLoS One 4: e5540.
Smyth GK, Michaud J, Scott HS (2005) Use of within-array replicate spots for assessing differential expression in microarray experi-ments. Bioinform 21: 2067–2075.
Tian G, Yin XY, Luo H, Xu XH, Bolund L, Zhang XQ (2010) Se-quencing bias: comparison of different protocols of MicroRNA li-brary construction. BMC Biotechnol 10: 64.
Wang WX, Wilfred BR, Baldwin DA, Isett RB, Ren N, Stromberg A, Nelson PT (2008) Focus on RNA isolation: obtaining RNA for microRNA (miRNA) expression profiling analyses of neural tissue. Biochim Biophys Acta 1779: 749–757.
Zhang X, Chen J, Radcliffe T, Lebrun DP, Tron VA, Feilotter H (2008) An array-based analysis of microRNA expression comparing matched frozen and formalin-fixed paraffin-embedded human tissue samples. J Mol Diagn 10: 513–519.