Embed Size (px)
Citation preview
1
How the measure of proven reoffending
has changed and the effect of these
changes
26th October 2017

2
How the measure of proven reoffending has changed
Background
In “Transforming Rehabilitation: A Strategy for Reform”, published in 2013, plans were set out to introduce
a new system for the management and rehabilitation of offenders in the community across England and
Wales.
In February 2015, various reforms were implemented. These included:
• opening up the market to a diverse range of rehabilitation providers from the private, voluntary
and social sectors through 21 Community Rehabilitation Companies (CRCs);
• using a ‘payment by results’ approach to develop and implement effective ways of rehabilitating
offenders and rewarding providers that devise and deliver the most effective rehabilitation
programmes;
• extending statutory rehabilitation to short-sentenced offenders released from prison, who have
the highest reoffending rates and yet previously received no supervision after release;
• reorganising the prisons to resettle offenders ‘through the gate’, with continuous support from
custody to community; and
• creating a new public sector National Probation Service (NPS) to manage high risk offenders.
Following implementation of these reforms, a public consultation was run in summer 2015, proposing
several changes to the Proven Reoffending National Statistics in order to support the reforms to the system
and ensure the Ministry of Justice continued to meet its commitment of statistical best practice by giving a
coherent overview of all statistics relating to reoffending.
Users’ views were invited to the proposed changes, and 19 responses were received to the consultation. A
response to the consultation was published in April 2016 and set out the changes:
www.gov.uk/government/uploads/system/uploads/attachment_data/file/519644/proven-reoffending-
consultation-response.pdf
The main changes to the methodology are:
- Moving to a three month cohort. The latest publication reports on offenders who are released from
custody, received a non-custodial conviction at court, or received a caution within a three month period, for all measures of reoffending, including for juveniles. Previously, a 12 month cohort was used.
- Production of adjusted reoffending rates for adults (alongside the raw rates). The Offender Group
Reconviction Score (OGRS) has been used to adjust the raw reoffending rates for adults, to take account of the influence that differences in offender mix can have on the binary reoffending rates.
- A change from calendar year to financial year, for annual figures. Previously, the annual publication
was in October each year, and based on a calendar year. The annual reoffending publication will now be published in January each year and will be based on a financial year. Annual figures will be formed by taking a weighted average of the four preceding 3 month offender cohorts. 2015 annual figures will be published on the 25th January 2018.

3
In addition, there is a change in the data source for compiling MoJ’s proven reoffending statistics to better reflect the way in which offenders are now managed by the probation services. The data source is called national Delius (nDelius) and is the established case management system for use by probation services. nDelius has already been used to compile the published interim Payment by Result (PbR) figures for CRCs and the NPS since October 2016. The first set of proven reoffending statistics being published using the new methodology and data source are for the October to December 2015 cohort. They are being published alongside the first set of final results for the Community Rehabilitation Companies (CRCs) and the National Probation Service (NPS). These are the results by which CRCs’ performance will be assessed for PbR. The new approach creates one consistent measure of proven reoffending and allows users to relate the performance of the CRCs in reducing reoffending with the overall figure for England and Wales.
4
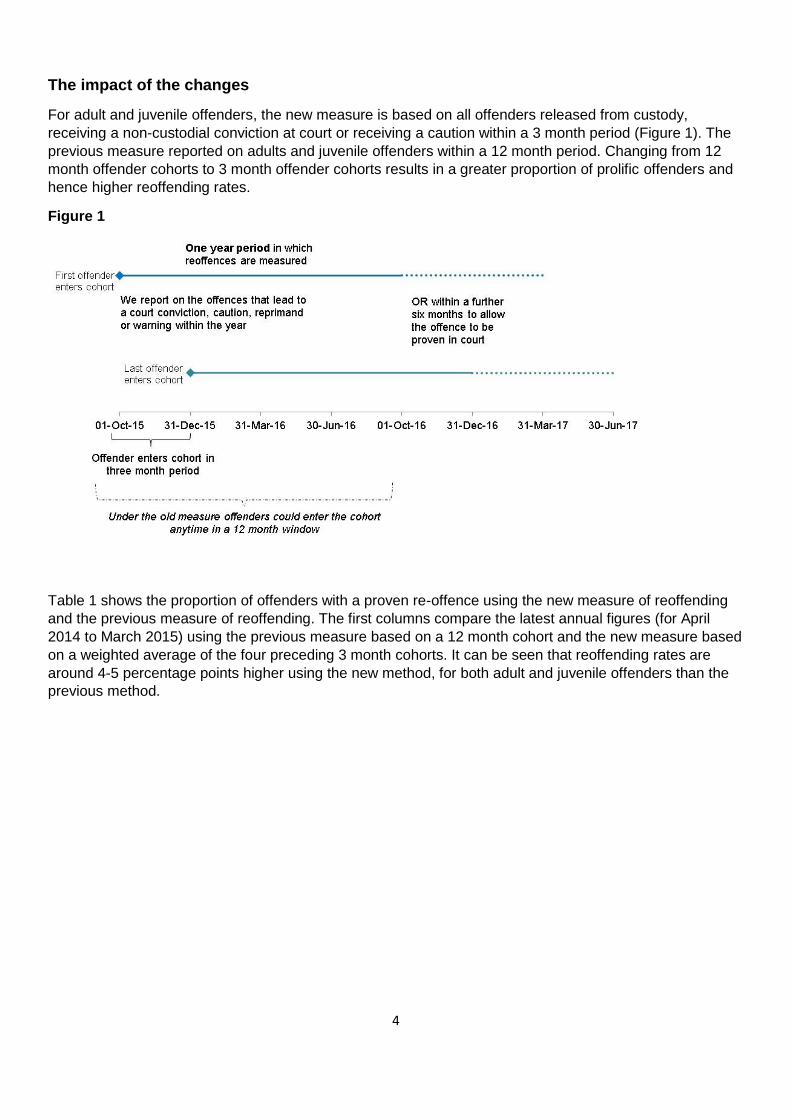
The impact of the changes
For adult and juvenile offenders, the new measure is based on all offenders released from custody,
receiving a non-custodial conviction at court or receiving a caution within a 3 month period (Figure 1). The
previous measure reported on adults and juvenile offenders within a 12 month period. Changing from 12
month offender cohorts to 3 month offender cohorts results in a greater proportion of prolific offenders and
hence higher reoffending rates.
Figure 1
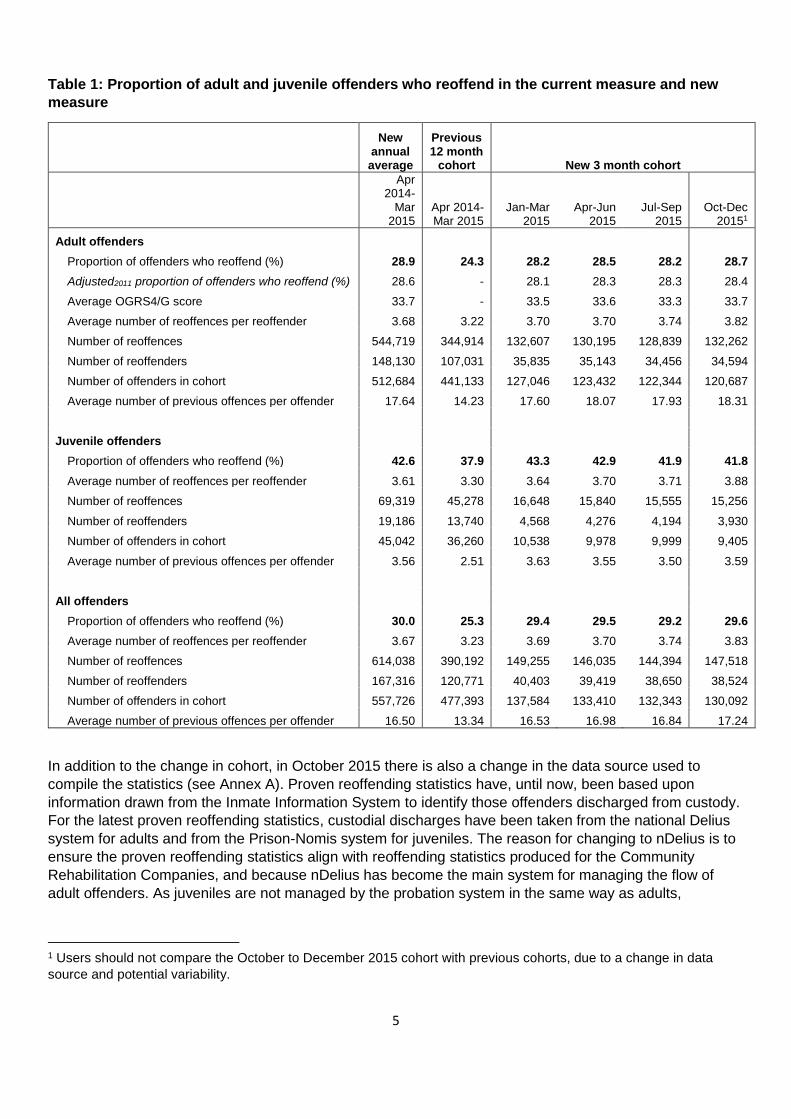
Table 1 shows the proportion of offenders with a proven re-offence using the new measure of reoffending
and the previous measure of reoffending. The first columns compare the latest annual figures (for April
2014 to March 2015) using the previous measure based on a 12 month cohort and the new measure based
on a weighted average of the four preceding 3 month cohorts. It can be seen that reoffending rates are
around 4-5 percentage points higher using the new method, for both adult and juvenile offenders than the
previous method.
5
Table 1: Proportion of adult and juvenile offenders who reoffend in the current measure and new
measure
New annual average
Previous 12 month
cohort New 3 month cohort
Apr 2014-
Mar 2015
Apr 2014-Mar 2015
Jan-Mar 2015
Apr-Jun 2015
Jul-Sep 2015
Oct-Dec 20151
Adult offenders
Proportion of offenders who reoffend (%) 28.9 24.3 28.2 28.5 28.2 28.7
Adjusted2011 proportion of offenders who reoffend (%) 28.6 - 28.1 28.3 28.3 28.4
Average OGRS4/G score 33.7 - 33.5 33.6 33.3 33.7
Average number of reoffences per reoffender 3.68 3.22 3.70 3.70 3.74 3.82
Number of reoffences 544,719 344,914 132,607 130,195 128,839 132,262
Number of reoffenders 148,130 107,031 35,835 35,143 34,456 34,594
Number of offenders in cohort 512,684 441,133 127,046 123,432 122,344 120,687
Average number of previous offences per offender 17.64 14.23 17.60 18.07 17.93 18.31
Juvenile offenders
Proportion of offenders who reoffend (%) 42.6 37.9 43.3 42.9 41.9 41.8
Average number of reoffences per reoffender 3.61 3.30 3.64 3.70 3.71 3.88
Number of reoffences 69,319 45,278 16,648 15,840 15,555 15,256
Number of reoffenders 19,186 13,740 4,568 4,276 4,194 3,930
Number of offenders in cohort 45,042 36,260 10,538 9,978 9,999 9,405
Average number of previous offences per offender 3.56 2.51 3.63 3.55 3.50 3.59
All offenders
Proportion of offenders who reoffend (%) 30.0 25.3 29.4 29.5 29.2 29.6
Average number of reoffences per reoffender 3.67 3.23 3.69 3.70 3.74 3.83
Number of reoffences 614,038 390,192 149,255 146,035 144,394 147,518
Number of reoffenders 167,316 120,771 40,403 39,419 38,650 38,524
Number of offenders in cohort 557,726 477,393 137,584 133,410 132,343 130,092
Average number of previous offences per offender 16.50 13.34 16.53 16.98 16.84 17.24
In addition to the change in cohort, in October 2015 there is also a change in the data source used to
compile the statistics (see Annex A). Proven reoffending statistics have, until now, been based upon
information drawn from the Inmate Information System to identify those offenders discharged from custody.
For the latest proven reoffending statistics, custodial discharges have been taken from the national Delius
system for adults and from the Prison-Nomis system for juveniles. The reason for changing to nDelius is to
ensure the proven reoffending statistics align with reoffending statistics produced for the Community
Rehabilitation Companies, and because nDelius has become the main system for managing the flow of
adult offenders. As juveniles are not managed by the probation system in the same way as adults,
1 Users should not compare the October to December 2015 cohort with previous cohorts, due to a change in data
source and potential variability.
6
offenders discharged from Youth Offender Institutions are now taken from the Prison-Nomis system. The
change for juveniles also reflects the availability of a more accurate data source.
This change in October 2015 introduces potential variability and therefore users should be cautious when
making any comparison with the October to December 2015 cohort and earlier cohorts. It is estimated the
impact of changing data source is an increase in the reoffending rate of around 0.5 percentage points. The
driver for this increase appears to be among offenders discharged from custody after serving less than 12
month sentences, and might be connected to the introduction of statutory supervision for this group. Further
investigation is ongoing. The impact of changing data source for juveniles discharged from Youth Offenders
Institutions is marginal.
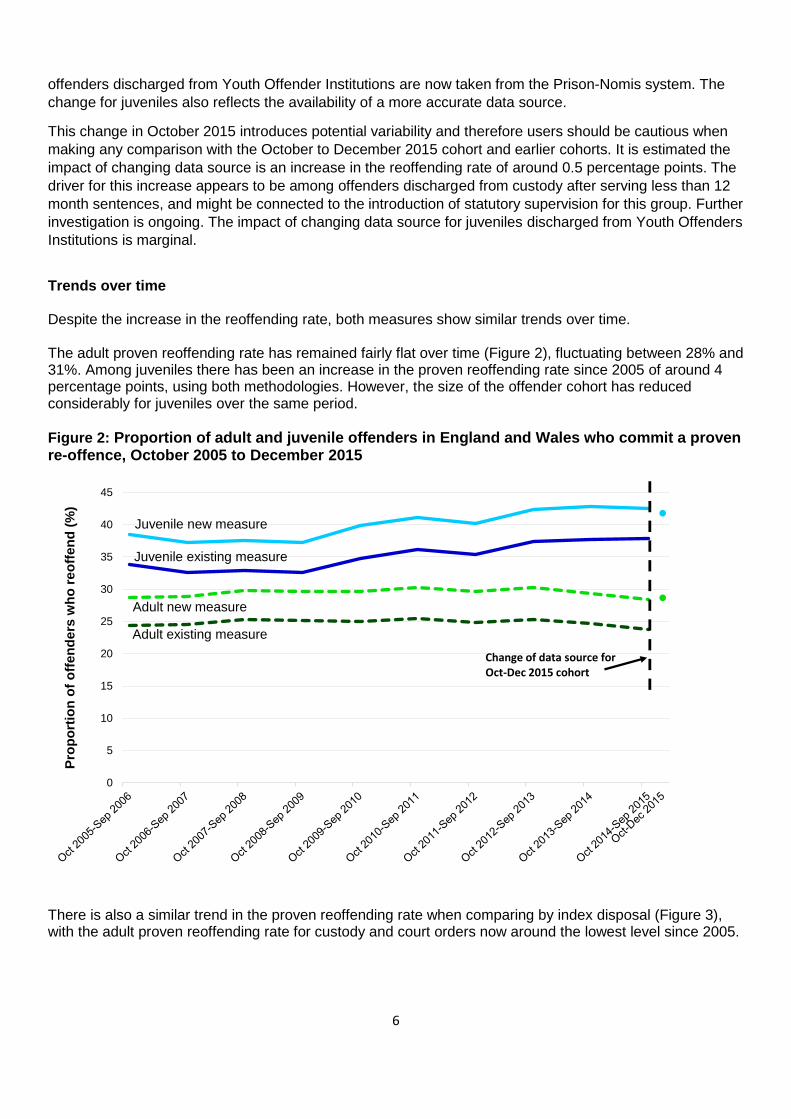
Trends over time Despite the increase in the reoffending rate, both measures show similar trends over time. The adult proven reoffending rate has remained fairly flat over time (Figure 2), fluctuating between 28% and 31%. Among juveniles there has been an increase in the proven reoffending rate since 2005 of around 4 percentage points, using both methodologies. However, the size of the offender cohort has reduced considerably for juveniles over the same period.
Figure 2: Proportion of adult and juvenile offenders in England and Wales who commit a proven re-offence, October 2005 to December 2015
0
5
10
15
20
25
30
35
40
45
Pro
po
rtio
n o
f o
ffe
nd
ers
wh
o r
eo
ffe
nd
(%
)
Change of data source forOct-Dec 2015 cohort
Adult existing measure
Adult new measure
Juvenile existing measure
Juvenile new measure
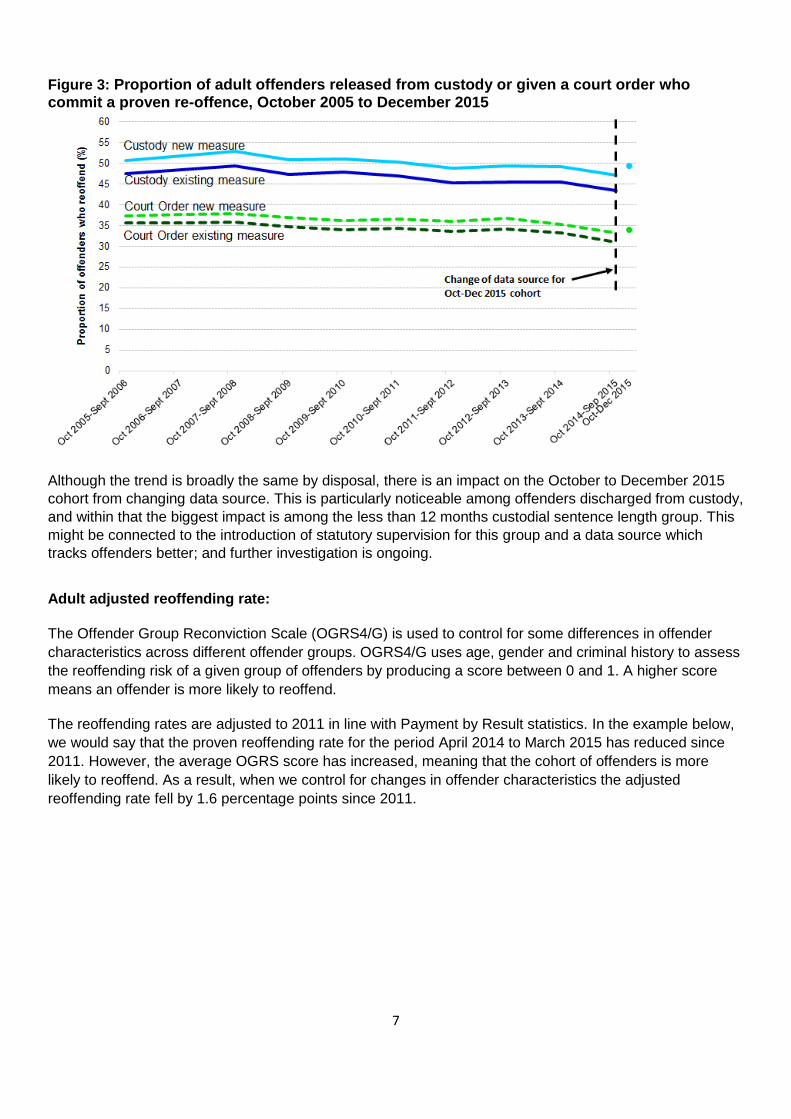
There is also a similar trend in the proven reoffending rate when comparing by index disposal (Figure 3), with the adult proven reoffending rate for custody and court orders now around the lowest level since 2005.
7
Figure 3: Proportion of adult offenders released from custody or given a court order who commit a proven re-offence, October 2005 to December 2015
Although the trend is broadly the same by disposal, there is an impact on the October to December 2015
cohort from changing data source. This is particularly noticeable among offenders discharged from custody,
and within that the biggest impact is among the less than 12 months custodial sentence length group. This
might be connected to the introduction of statutory supervision for this group and a data source which
tracks offenders better; and further investigation is ongoing.
Adult adjusted reoffending rate:
The Offender Group Reconviction Scale (OGRS4/G) is used to control for some differences in offender
characteristics across different offender groups. OGRS4/G uses age, gender and criminal history to assess
the reoffending risk of a given group of offenders by producing a score between 0 and 1. A higher score
means an offender is more likely to reoffend.
The reoffending rates are adjusted to 2011 in line with Payment by Result statistics. In the example below,
we would say that the proven reoffending rate for the period April 2014 to March 2015 has reduced since
2011. However, the average OGRS score has increased, meaning that the cohort of offenders is more
likely to reoffend. As a result, when we control for changes in offender characteristics the adjusted
reoffending rate fell by 1.6 percentage points since 2011.
8
0
5
10
15
20
25
30
35
40
0
5
10
15
20
25
30
35
40
Ad
juste
d p
rop
ort
ion
of
off
en
ders
wh
o r
eo
ffen
d
(%)
Av
era
ge O
GR
S4/G
sco
re
Average OGRS4/G score Adjusted 2011 proven reoffending rate Raw reoffending rate
Change of data source forOct-Dec 2015 cohort
OGRS4/G adjusted reoffending rate for adults example
England and Wales 2011 comparison year Cohort period (April
to March 2015)
Difference
Average OGRS4/G
score
33.4 33.7 +0.3
Proportion of
offenders who
reoffend (%)
30.2 28.9 -1.3pp
OGRS4/G adjusted
reoffending rate (%)
30.2 28.6 -1.6pp
In the latest publication, the raw reoffending rates have been adjusted using OGRS4 to take account of the
influence that differences in offender mix have on the binary reoffending rate.
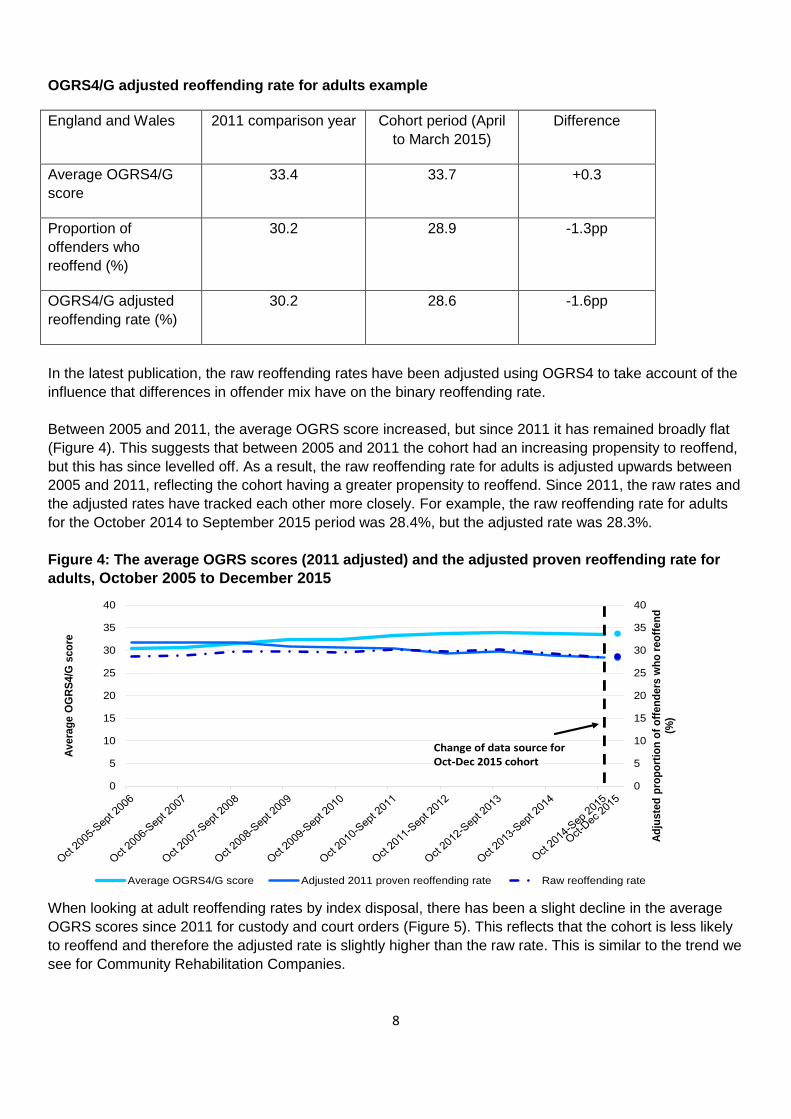
Between 2005 and 2011, the average OGRS score increased, but since 2011 it has remained broadly flat
(Figure 4). This suggests that between 2005 and 2011 the cohort had an increasing propensity to reoffend,
but this has since levelled off. As a result, the raw reoffending rate for adults is adjusted upwards between
2005 and 2011, reflecting the cohort having a greater propensity to reoffend. Since 2011, the raw rates and
the adjusted rates have tracked each other more closely. For example, the raw reoffending rate for adults
for the October 2014 to September 2015 period was 28.4%, but the adjusted rate was 28.3%.
Figure 4: The average OGRS scores (2011 adjusted) and the adjusted proven reoffending rate for
adults, October 2005 to December 2015
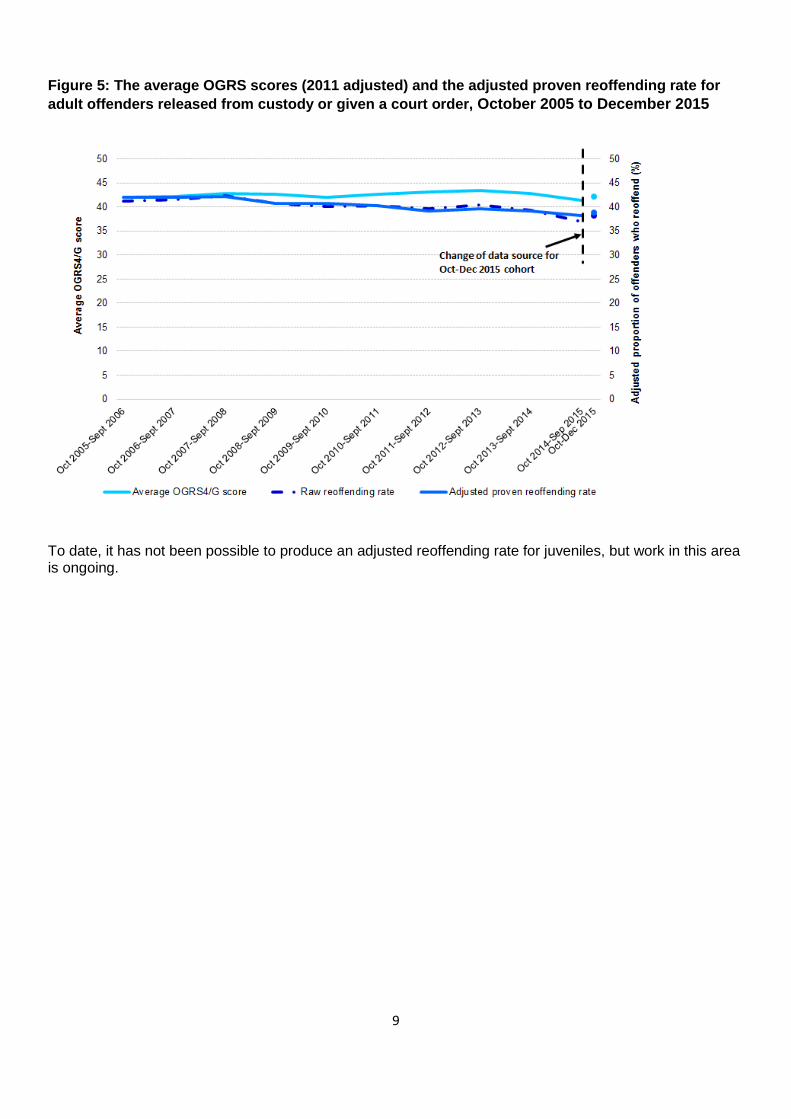
When looking at adult reoffending rates by index disposal, there has been a slight decline in the average
OGRS scores since 2011 for custody and court orders (Figure 5). This reflects that the cohort is less likely
to reoffend and therefore the adjusted rate is slightly higher than the raw rate. This is similar to the trend we
see for Community Rehabilitation Companies.
9
Figure 5: The average OGRS scores (2011 adjusted) and the adjusted proven reoffending rate for
adult offenders released from custody or given a court order, October 2005 to December 2015
To date, it has not been possible to produce an adjusted reoffending rate for juveniles, but work in this area is ongoing.
10
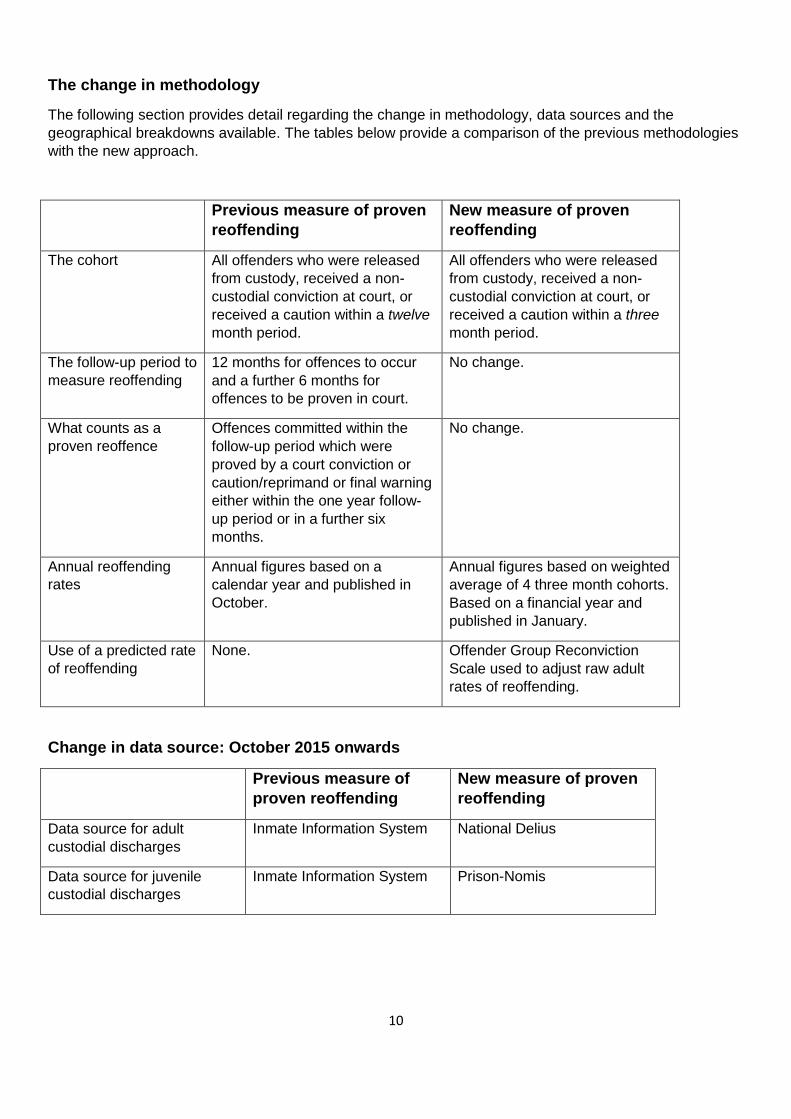
The change in methodology
The following section provides detail regarding the change in methodology, data sources and the
geographical breakdowns available. The tables below provide a comparison of the previous methodologies
with the new approach.
Previous measure of proven
reoffending
New measure of proven
reoffending
The cohort All offenders who were released
from custody, received a non-
custodial conviction at court, or
received a caution within a twelve
month period.
All offenders who were released
from custody, received a non-
custodial conviction at court, or
received a caution within a three
month period.
The follow-up period to
measure reoffending
12 months for offences to occur
and a further 6 months for
offences to be proven in court.
No change.
What counts as a
proven reoffence
Offences committed within the
follow-up period which were
proved by a court conviction or
caution/reprimand or final warning
either within the one year follow-
up period or in a further six
months.
No change.
Annual reoffending
rates
Annual figures based on a
calendar year and published in
October.
Annual figures based on weighted
average of 4 three month cohorts.
Based on a financial year and
published in January.
Use of a predicted rate
of reoffending
None. Offender Group Reconviction
Scale used to adjust raw adult
rates of reoffending.
Change in data source: October 2015 onwards
Previous measure of
proven reoffending
New measure of proven
reoffending
Data source for adult
custodial discharges
Inmate Information System National Delius
Data source for juvenile
custodial discharges
Inmate Information System Prison-Nomis
11
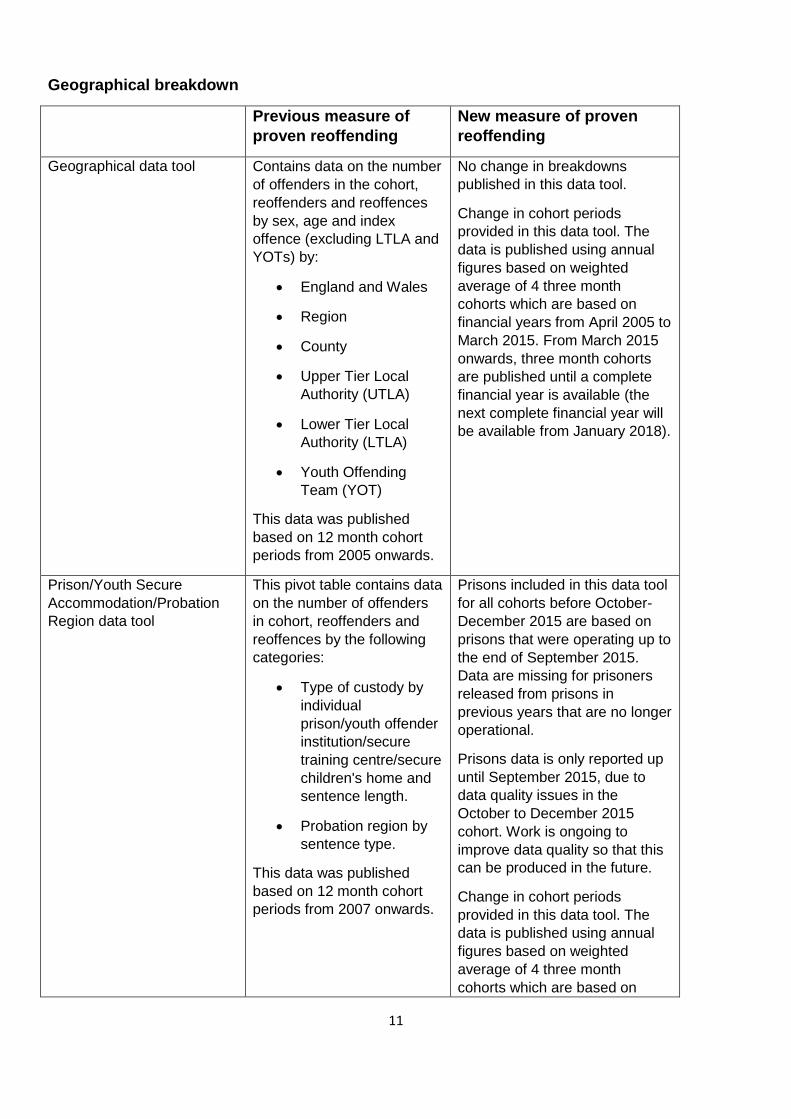
Geographical breakdown
Previous measure of
proven reoffending
New measure of proven
reoffending
Geographical data tool Contains data on the number
of offenders in the cohort,
reoffenders and reoffences
by sex, age and index
offence (excluding LTLA and
YOTs) by:
• England and Wales
• Region
• County
• Upper Tier Local
Authority (UTLA)
• Lower Tier Local
Authority (LTLA)
• Youth Offending
Team (YOT)
This data was published
based on 12 month cohort
periods from 2005 onwards.
No change in breakdowns
published in this data tool.
Change in cohort periods
provided in this data tool. The
data is published using annual
figures based on weighted
average of 4 three month
cohorts which are based on
financial years from April 2005 to
March 2015. From March 2015
onwards, three month cohorts
are published until a complete
financial year is available (the
next complete financial year will
be available from January 2018).
Prison/Youth Secure
Accommodation/Probation
Region data tool
This pivot table contains data
on the number of offenders
in cohort, reoffenders and
reoffences by the following
categories:
• Type of custody by
individual
prison/youth offender
institution/secure
training centre/secure
children's home and
sentence length.
• Probation region by
sentence type.
This data was published
based on 12 month cohort
periods from 2007 onwards.
Prisons included in this data tool
for all cohorts before October-
December 2015 are based on
prisons that were operating up to
the end of September 2015.
Data are missing for prisoners
released from prisons in
previous years that are no longer
operational.
Prisons data is only reported up
until September 2015, due to
data quality issues in the
October to December 2015
cohort. Work is ongoing to
improve data quality so that this
can be produced in the future.
Change in cohort periods
provided in this data tool. The
data is published using annual
figures based on weighted
average of 4 three month
cohorts which are based on

12
financial years from April 2005 to
March 2015. From March 2015
onwards, three month cohorts
are published until a complete
financial year is available (the
next complete financial year will
be available from January 2018).
Contact
Press enquiries should be directed to the Ministry of Justice press office:
Tel: 020 3334 3536 Email: [email protected]
Other enquiries about these statistics should be directed to the Justice Statistics Analytical Services
division of the Ministry of Justice:
Nick Mavron, Head of Prison, Probation, Reoffending and PbR Statistics Ministry of Justice, 7th Floor, 102 Petty France, London, SW1H 9AJ
Email: [email protected]
© Crown copyright
Produced by the Ministry of Justice
Alternative formats are available on request from [email protected]
13
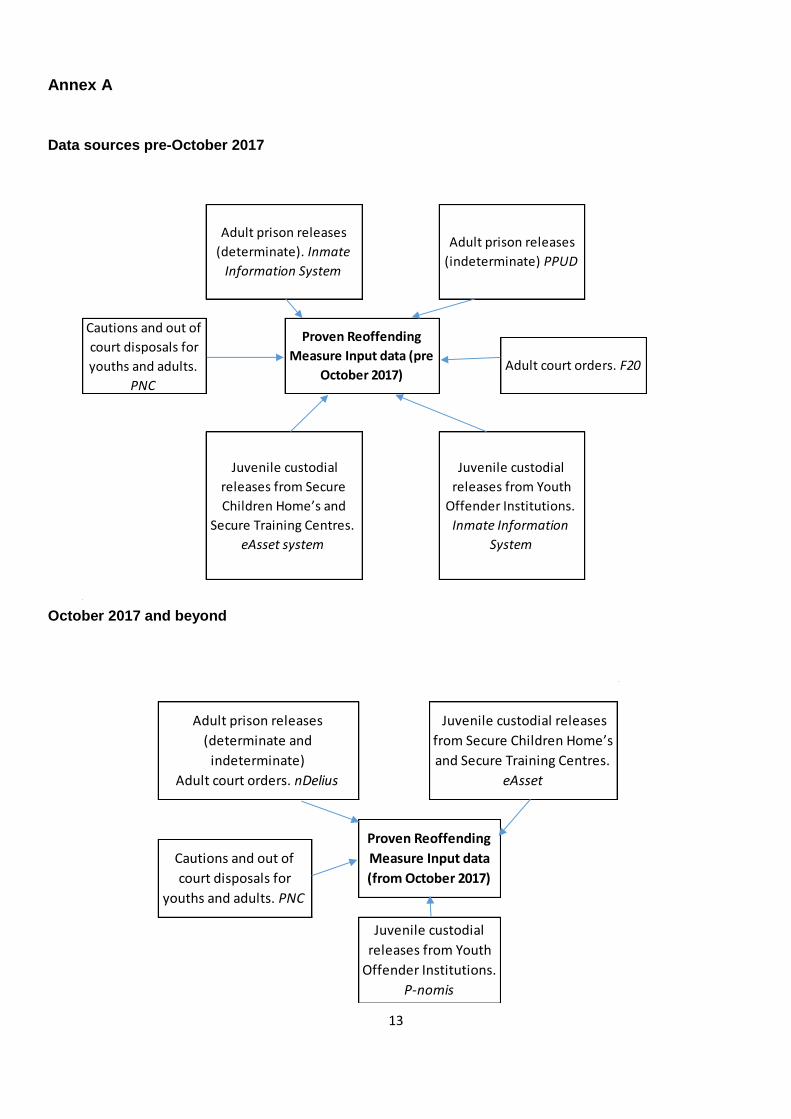
Juvenile custodial
releases from Secure
Children Home’s and
Secure Training Centres.
eAsset system
Juvenile custodial
releases from Youth
Offender Institutions.
Inmate Information
System
Cautions and out of
court disposals for
youths and adults.
PNC
Adult court orders. F20
Proven Reoffending
Measure Input data (pre
October 2017)
Adult prison releases
(determinate). Inmate
Information System
Adult prison releases
(indeterminate) PPUD
Juvenile custodial
releases from Youth
Offender Institutions.
P-nomis
Proven Reoffending
Measure Input data
(from October 2017)
Cautions and out of
court disposals for
youths and adults. PNC
Juvenile custodial releases
from Secure Children Home’s
and Secure Training Centres.
eAsset
Adult prison releases
(determinate and
indeterminate)
Adult court orders. nDelius
Annex A
Data sources pre-October 2017
October 2017 and beyond