Embed Size (px)
Citation preview

HOW MUCH WATER IS IN THE PEDERNALES?Determining the Source of Base Flow to the Pedernales River in
Northern Blanco, Hays and Travis Counties
The Meadows Center for Water and the EnvironmentSeptember 2017
Douglas A. Wierman P.G., Lead Author, FellowJenna Walker, M.A.Geo., Contributor
Ronald Fieseler, P.G., Contributor Jeff Watson, Contributor
Alex Broun, P.G., ContributorStacey Haddad, Contributor
Joshua Schauer, Contributor

This publication was made possible through the generous support of
The Cynthia & George Mitchell Foundation.

HOW MUCH WATER IS IN THE PEDERNALES?Determining the Source of Base Flow to the Pedernales River in
Northern Blanco, Hays and Travis Counties
September 2017
601 University Drive, San Marcos TX 78666512.245.9200 | [email protected] | www.MeadowsWater.org
Performing Agency:
Texas State University, and Meadows Center for Water and the Environment
Douglas A. Wierman, P.G.¹, Lead Author, FellowRonald Fieseler, P.G.², Contributor
Jeff Watson³, ContributorAlex Broun, P.G.³, Contributor
Jenna Walker, M.A.Geo.¹, ContributorStacey Haddad¹, ContributorJoshua Schauer¹, Contributor
Michael Jones¹, GIS and GraphicsDyhanara Rios¹, Graphic Design
¹ The Meadows Center for Water and the Environment, Texas State University² Blanco-Pedernales Groundwater Conservation District³ Hays Trinity Groundwater Conservation District
TABLE OF CONTENTS
List of Figures and Tables 2
List of Acronyms 3
Executive Summary 4
Background and Purpose 4
Study Area 4
Scope of Project 5
Results 6
Conclusions 12
Acknowledgements 13
Selected References 14
Appendix A 17
1 The Meadows Center for Water and the Environment

L I S T O F F I G U R E S A N D TA B L E S
Figures
Figure Description Page
Figure 1 Study Area and Well Locations 5
Figure 2Pedernales River Gain-Loss Studies 1962 and 2016 (from Wierman, et.al., 2017)
6
Figure 3Pedernales River Discharge at State Highway 281 in Johnson City, TX
7
Figure 4Stratigraphic Column – Texas Hill Country (from Wierman, et al, 2010)
8
Figure 5Study Area Geologic Map (from Barnes, 1981)
9
Figure 6Geologic Cross Section (interpreted from Barnes, 1982)
9
Figure 7Study Area Potentiometric Surface Map (October 24-November 1, 2016)
15
Tables
Table Description Page
Table 1Well List and Water Level Measurements - Hammetts Crossing Groundwater Study
15
How Much Water is in the Pedernales? Determining the Source of Base Flow to the Pedernales River 2

LIST OF ACRONYMSBPGCD: Blanco-Pedernales Groundwater Conservation District
BSEAGD: Barton Springs Edwards Aquifer Conservation District
CFS: Cubic Feet per Second
EL: Ellenburger Aquifer
GAT: Geological Atlas of Texas
GIS: Geographic Information Systems
GPS: Global Positioning System
HTGCD: Hays Trinity Groundwater Conservation District
LCRA: Lower Colorado River Authority
MCWE: The Meadows Center for Water and the Environment
KCC: Cow Creek Aquifer
LT: Lower Trinity Aquifer
MT: Middle Trinity Aquifer
NLCD: National Land Cover Database
NHD: National Hydrological Database
PFSP: Pedernales Falls State Park
STH: State Highway
SWR: State Well Report
TNC: The Nature Conservancy
TPWD: Texas Parks and Wildlife Department
TWC: Texas Water Commission
USH: United States Highway
USGS: United States Geological Survery
3 The Meadows Center for Water and the Environment

E X E C U T I V E S U M M A RYThe results of this study confirm that the groundwater from the Paleozoic and Cretaceous Aquifers contribute significant base flow to the Pedernales River and Lake Travis in the study area. Approximately half of the inflow into Lake Travis from the Pedernales River originates in the study area, or approximately 12 percent of the total inflow into Lake Travis. Shallow depths to groundwater and apparently high-modeled recharge rates indicate the Paleozoic strata, primarily on the northern side of the river, contribute the majority of the inflow to the river. Future groundwater management actions in this area need to consider the importance of this area to maintaining adequate water supplies.
BAC K G R O U N D A N D P U R P O S E The Pedernales River is an important source of water to Lake Travis of the Highland Lakes chain of lakes. Lake Travis supplies the City of Austin and many other downstream municipalities along the Colorado River as the sole source of potable water. Approximately 23 percent of the annual inflow to Lake Travis is from the Pedernales River. Maintaining environmental flows down to the Gulf of Mexico from the Colorado River is dependent on inflows from the Pedernales River.
Stream flow gain/loss studies performed in 1962 and 2016 on the Pedernales River have indicated significant gains to base flow in the main channel along the reach from Johnson City to the confluence of the river with Lake Travis. A synoptic groundwater level measuring event was conducted to determine if groundwater inflows played a significant role contributing to the gains. If so, potential river management actions may be identified to maintain the current level of flow into the river.
S T U DY A R E AThe study area included an area roughly bounded by Cypress Mill Road, Hammetts Crossing, County Road 2766 and State Highway (STH) 281 on the north, east, south and west, respectively (Figure 1). The reach encompasses approximately 32 miles of river, primarily in Blanco County. The river from headwaters near Harper to Hammetts Crossing is approximately 102 river miles and 119 miles to the confluence with Lake Travis. The scope of the project was to arrange for access to as many wells in the study area as possible and, within a short period of time, obtain groundwater level measurements. State Well Reports (SWR) were obtained, where available, to aid in determining well depths and completion zones.
How Much Water is in the Pedernales? Determining the Source of Base Flow to the Pedernales River 4

S C O P E O F P R O J E C TForty-three wells were identified by the team from The Meadows Center for Water and the Environment (The Meadows Center), Blanco-Pedernales Groundwater Conservation District (BPGCD) and the Hays Trinity Groundwater Conservation District (HTGCD) as shown on Figure 1. Most of the wells were visited prior to the synoptic event to evaluate access and site logistics. Water levels were obtained at 42 wells during the period of October 24 – November 1, 2016 (Note: one of the wells had a significant wasp infestation of the well house and was not measured). Depth-to-water measurements were collected using either an electric e-line or sonic water level measurement meter. Well locations were determined by hand-held Global Positioning System (GPS). Well surface elevations were obtained from USGS maps or Google Earth®. River and tributary creek elevations were obtained from Google Earth®. Water elevations were hand-contoured to develop a potentiometric surface map of the study area. Geologic maps, SWRs (where available), water levels, well depths and local knowledge were the primary tools for determining into which aquifer a given well was completed. Well coordinates, ground elevations, depth-to-water and groundwater level elevations are shown on Table 1. Available SWRs are included in Appendix A.
Figure 1. Study Area and Well Locations
5 The Meadows Center for Water and the Environment
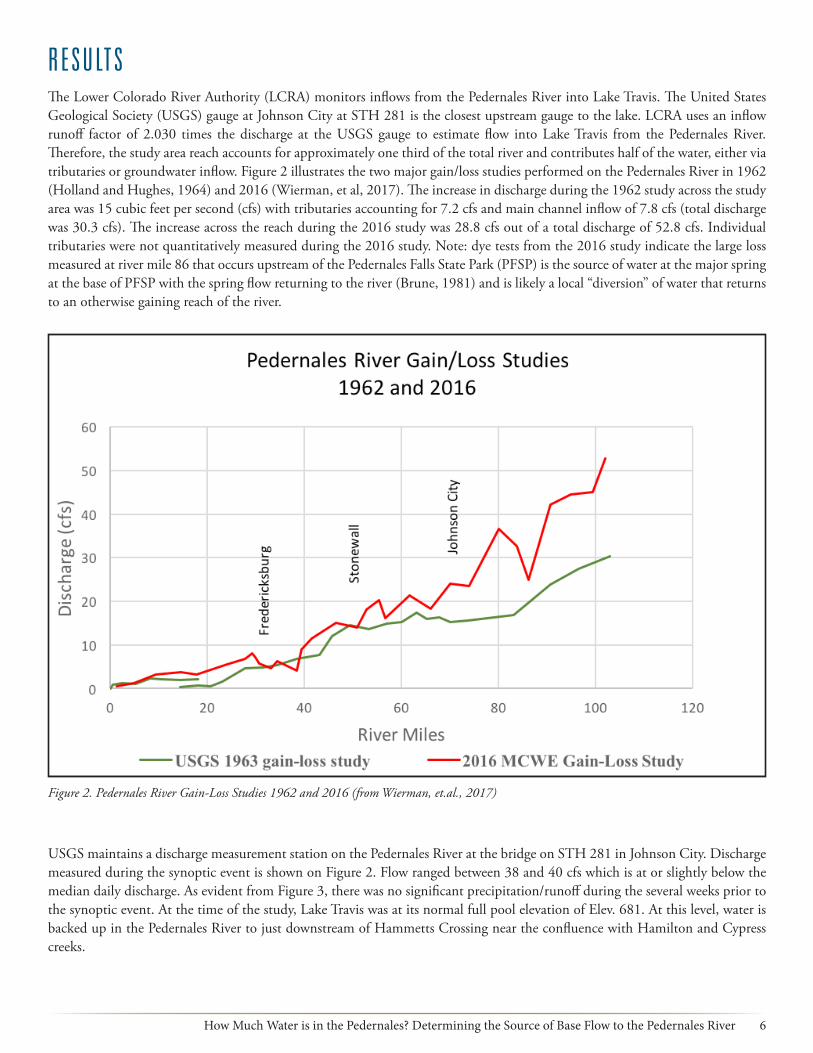
R E S U LT SThe Lower Colorado River Authority (LCRA) monitors inflows from the Pedernales River into Lake Travis. The United States Geological Society (USGS) gauge at Johnson City at STH 281 is the closest upstream gauge to the lake. LCRA uses an inflow runoff factor of 2.030 times the discharge at the USGS gauge to estimate flow into Lake Travis from the Pedernales River. Therefore, the study area reach accounts for approximately one third of the total river and contributes half of the water, either via tributaries or groundwater inflow. Figure 2 illustrates the two major gain/loss studies performed on the Pedernales River in 1962 (Holland and Hughes, 1964) and 2016 (Wierman, et al, 2017). The increase in discharge during the 1962 study across the study area was 15 cubic feet per second (cfs) with tributaries accounting for 7.2 cfs and main channel inflow of 7.8 cfs (total discharge was 30.3 cfs). The increase across the reach during the 2016 study was 28.8 cfs out of a total discharge of 52.8 cfs. Individual tributaries were not quantitatively measured during the 2016 study. Note: dye tests from the 2016 study indicate the large loss measured at river mile 86 that occurs upstream of the Pedernales Falls State Park (PFSP) is the source of water at the major spring at the base of PFSP with the spring flow returning to the river (Brune, 1981) and is likely a local “diversion” of water that returns to an otherwise gaining reach of the river.
Figure 2. Pedernales River Gain-Loss Studies 1962 and 2016 (from Wierman, et.al., 2017)
USGS maintains a discharge measurement station on the Pedernales River at the bridge on STH 281 in Johnson City. Discharge measured during the synoptic event is shown on Figure 2. Flow ranged between 38 and 40 cfs which is at or slightly below the median daily discharge. As evident from Figure 3, there was no significant precipitation/runoff during the several weeks prior to the synoptic event. At the time of the study, Lake Travis was at its normal full pool elevation of Elev. 681. At this level, water is backed up in the Pedernales River to just downstream of Hammetts Crossing near the confluence with Hamilton and Cypress creeks.
How Much Water is in the Pedernales? Determining the Source of Base Flow to the Pedernales River 6

Figure 3. Pedernales River Discharge at State Highway 281 in Johnson City, TX
The geologic units exposed in the study area range in age from Paleozoic to Quaternary (Figures 4 and 5). The reach of the river from Johnson City to PFSP is dominated by the various units of the Ordovician Ellenburger Group. The Ellenburger units are primarily thin to thickly bedded limestones and dolomites. Pennsylvanian Marble Falls limestone crops out along the northern bank of the river upstream of the PFSP and is the geologic unit underlying the falls at the park (Barnes, 1982; Barnes, 1982; and Barnes, 1963). These units generally dip to the southeast at approximately 7 – 10 degrees. Numerous southwest/northeast trending faults have been mapped. The rocks of the Ellenburger, and to a lesser extent the Marble Falls, are the primary sources of groundwater in the area for domestic and agricultural use. The municipal water supply for Johnson City is developed in the Ellenburger.
Along the southern side of the river upstream of PFSP and dominating the entire watershed downstream of the park are the Cretaceous age units of the Trinity Aquifer. The Trinity section, from oldest to youngest, is composed of the Sycamore Sand, Hammett Shale, Cow Creek Limestone, Hensel Sand and the Upper and Lower units of the Glen Rose Limestone (Barnes,1982; Wierman et al, 2010) and lies unconformably on the older Paleozoic strata. The river has deeply incised the entire Trinity section which is exposed in outcrop from PFSP to Hammetts Crossing and in varying degrees in the major tributary valleys. The Lower Glen Rose, Hensel and Cow Creek comprise the Middle Trinity Aquifer. The Cow Creek pinches out in the study area and is not present in the western part of the study area (Figure 6). Similarly, the Sycamore formation, which is exposed in the deeper river and tributary valleys and makes up the Lower Trinity Aquifer, also pinches out against the Paleozoic strata.
7 The Meadows Center for Water and the Environment

Figure 4. Stratigraphic Column – Texas Hill Country (from Wierman, et al, 2010)
How Much Water is in the Pedernales? Determining the Source of Base Flow to the Pedernales River 8

Figure 5. Study Area Geologic Map (from Barnes, 1981)
Figure 6. Geologic Cross Section (interpreted from Barnes, 1982)
9 The Meadows Center for Water and the Environment

Regional groundwater flow directions in the Paleozoic strata have not been determined in detail.
Per Bluntzer (1992):
Adequate amounts of data are not available to determine accurately the direction or rate of movement of water in the Paleozoic aquifers. However, water in those aquifers probably moves southward and southeastward along the dip of the aquifers. In some areas of Gillespie and Blanco Counties, a significant portion of the recharge probably moves into the Middle Trinity Aquifer and discharges into the Pedernales and its tributaries.
Regional flow in the Middle Trinity Aquifer has been shown on a series of regional potentiometric surface maps over time as generally west to east across the study area of Blanco County (Hunt, et al, 2010). The regional maps are not of sufficient detail to determine flow directions in the immediate vicinity of the river.
Figure 7 represents a potentiometric surface map of the study area developed during this study. Groundwater elevations range from 1150 ft. mean sea level (MSL) in Johnson City to a low of 804 ft. MSL at Reimers Ranch near Hammetts Crossing. As the river is a rapidly gaining river in the study area (Wierman, 2017), surface water elevations were contoured along with the groundwater elevations to develop the map. Depth to groundwater in the Ellenburger wells on the north side of the river was generally shallow, typically less than 50 ft. below ground surface (bgs) and often less than 20 ft. The SWR for Well 12 drilled in 1961 indicated the well flowed at the surface at times. In October 2016, the depth to water was 12.8 ft. below the top of the well casing. Depth to groundwater in wells completed in the Middle and Lower Trinity aquifers in the eastern study area is considerably deeper than the wells completed in the Ellenburger. Water depths range from 100 – over 200 ft. bgs in the Trinity wells.
As shown in Figure 7, groundwater flow directions are clearly influenced by the river and are indicative of a gaining river. Groundwater flows towards the river in both the Paleozoic and Cretaceous Aquifers. To the north, Cypress Creek may have a similar influence on shallow groundwater with a shallow groundwater divide present between the two watersheds.
Due to the deep incision of the river and main tributaries down into the Cow Creek and Sycamore formations, the Middle Trinity and Lower Trinity aquifers have been eroded and are no longer present or deeply eroded in the study area. Along the river, these aquifers have been dewatered over time and are not productive. Water levels in the two aquifers tend to come together near the river/tributaries with groundwater discharging into the river. The Cow Creek formation pinches out to the northeast as shown on Figure 5. In areas to the southeast of the pinch out, the Cow Creek is a major water producing aquifer. Near the pinch out where the Cow Creek is thinning or absent, groundwater production appears to be from the underlying Sycamore.
Inflow to the main channel of the river from major tributaries was not measured during this study. Tributary input in the study area is derived from groundwater base flow, similar to inflow into the main channel. Major tributaries (Miller Creek and Flat Creek) are deeply incised into the Upper, Middle, and near the river, the Lower Trinity Aquifer and are dewatering the aquifers and providing base flow to the river.
Based on the potentiometric surface map, there appears to be lateral continuity of groundwater flow across both the Paleozoic and Cretaceous Aquifers. Groundwater flow in the eastern part of the study area is primarily contained in the Paleozoic Ellenburger Aquifer. In the central study area along the river in the Trinity Aquifer, the Lower Trinity Hosston formation is the primary source of groundwater due to the thinning of the Cow Creek and the deeply incised river dewatering the Middle Trinity. In the eastern study area, flow is primarily in the Middle Trinity Aquifer.
The groundwater gradient towards the river is generally greater in the Paleozoic Aquifers than the Trinity Aquifers. This may indicate there is more groundwater being discharged to the river from the Paleozoic Aquifers than the Cretaceous Aquifers. This may be the result of relatively high recharge rates in the Paleozoic Aquifers. Modeled simulated recharge developed in the Numerical Model Report: Minor aquifers of the Llano Uplift of Texas (Shi, et al, 2016) indicate high recharge rates associated with area of surficial Ellenburger strata.
How Much Water is in the Pedernales? Determining the Source of Base Flow to the Pedernales River 10

Figu
re 7
. Stu
dy A
rea
Pote
ntio
met
ric S
urfa
ce M
ap (O
ctobe
r 24-
Nov
embe
r 1, 2
016)
11 The Meadows Center for Water and the Environment

C O N C L U S I O N SThe results of this study confirm that the groundwater from the Paleozoic and Cretaceous Aquifers contribute significant base flow to the Pedernales River and Lake Travis in the study area. Approximately half of the inflow into Lake Travis from the Pedernales River originates in the study area, or approximately 12 percent of the total inflow into Lake Travis. Shallow depths to groundwater and apparently high modeled recharge rates indicate the Paleozoic strata, primarily on the northern side of the river, contribute the majority of the inflow to the river. Future groundwater management actions in this area need to consider the importance of this area to maintaining adequate water supplies.
How Much Water is in the Pedernales? Determining the Source of Base Flow to the Pedernales River 12
AC K N O W L E D G E M E N T SThe Meadows Center for Water and the Environment would like to thank The Cynthia and George Mitchell Foundation for providing funding for the project.
We also thank the Blanco-Pedernales Groundwater Conservation District and the Hays Trinity Groundwater Conservation District for their help in identifying wells and obtaining water level measurements.
We especially thank all of the landowners that allowed us to enter their property and access their wells. Without cooperation of private landowners, opportunities for us to expand our knowledge of the river would not be possible.
13 The Meadows Center for Water and the Environment

S E L E C T E D R E F E R E N C E SBarnes, V.E., (1963), Geologic Map of the Johnson City Quadrangle, Blanco County, TX. Geologic Quadrangle Map No. 25, Bureau of Economic Geology, The University of Texas, Austin, TX.
Barnes, V.E. Project Director (1981 version), Geologic Atlas of Texas (GAT)-Llano Sheet, Bureau of Economic Geology, The University of Texas, Austin, TX.
Barnes, V.E., (1982), Geologic Map of the Pedernales Falls Quadrangle, Blanco County, TX. Geologic Quadrangle Map No. 49, Bureau of Economic Geology, The University of Texas, Austin, TX.
Barnes, V.E., (1982a), Geologic Map of the Hammetts Crossing Quadrangle, Blanco County, TX. Geologic Quadrangle Map No. 51, Bureau of Economic Geology, The University of Texas, Austin, TX.
Bluntzer, R.L., (1992), Report 339 Evaluation of the Groundwater Resources of the Paleozoic and Cretaceous Aquifers in the Hill Country of Central Texas, Texas Water Development Board.
Brune, G., (1981), Springs of Texas – Volume 1. Texas A&M University Press, 566p.
Holland, P.H. and Hughes, L.S., (1964), Bulletin 6407 Base-Flow Studies Pedernales River, Texas, Texas Water Commission.
Hunt, B.B. and Smith, B.A., (2010), Spring Potentiometric Map of the Middle Trinity Aquifer in Groundwater Management Area 9, Central Texas. BSEACD Report of Investigations 2010-0501.
Shi, J., Boghici, R., Kolhrenken, W and Hutchinson, W. 2016, Numerical Model Report: Minor Aquifers of the Llano Uplift of Texas (Marble Falls, Ellenburger-San-Saba and Hickory). Texas Water Development Board.
Wierman, D.A., Broun, A. S., Hunt, B. B., (2010), Hydrogeologic Atlas of the Hill Country Trinity Aquifer, Blanco, Hays, and Travis Counties, Central Texas. Hays-Trinity Groundwater Conservation District, United States.
Wierman, D.A., Walker, J., Butler, W., Zapetello, S., and Warren, E., (2017) Occurrence of Flowing Water and Water Quality during Base Flow Conditions in the Pedernales River Basin, Meadows Center for Water and the Environment, Texas State University, San Marcos, TX.
How Much Water is in the Pedernales? Determining the Source of Base Flow to the Pedernales River 14

Table 1. Well List and Water Level Measurements - Hammetts Crossing Groundwater Study
Well # Latitude Longitude Elevation State Well #
Total Depth
Aquifer Depth to Water 10/24 -
11/1, 2016
Groundwater Elevation
1 30.29587 -98.29375 1083 MT 171 912
2 30.29278 -98.36588 1105 EL 45.1 1060
3 30.28604 -98.36858 1118 EL 49.1 1069
4 30.28083 -98.33382 1012 128646 180 EL 33.5 979
5 30.30437 -98.17496 1068 427541 265 Kho 209.7 858
6 30.33324 -98.34005 1168 EL 72.1 1096
7 30.33766 -98.14301 840 5747305 110 Kho 43.7 796
8 30.31640 -98.27324 982 34922 not
measured
9 30.34755 -98.27647 1045 78018 320 EL 35.5 1010
10 30.34946 -98.26647 1000 78014 320 EL 23.9 976
11 30.35244 -98.27033 1015 86465 280 EL 26 989
12 30.33894 -98.27705 983 5746301 1000 EL 12.8 970
13 30.34269 -98.28262 1000 20 EL 18.1 982
14 30.36700 -98.11417 834 Kho 30.3 804
15 30.34690 -98.16956 1008 95023 360 MT 178 830
16 30.30726 -98.12220 1075 392395 320 Kcc 227 848
17 30.33827 -98.14889 856 190 Kho 49.1 807
18 30.34151 -98.15745 944 240 Kho 113.2 831
19 30.28695 -98.06761 1242 415430 580 Kcc 423 819
20 30.31578 -98.15964 1082 421894 330 Kcc 238.6 843
21 30.30646 -98.12707 1075 5747602 320 Kcc 225.7 849
22 30.32468 -98.15386 974 416399 205 Kgrl 144.2 830
23 30.29958 -98.14725 1084 378324 340 Kcc 229.9 854
15 The Meadows Center for Water and the Environment

Well # Latitude Longitude Elevation State Well #
Total Depth
Aquifer Depth to Water 10/24 -
11/1, 2016
Groundwater Elevation
24 30.31430 -98.17994 887 5747503 81 LT 19.1 868
25 30.31509 -98.17932 885 LT 23.7 861
26 30.26435 -98.17110 1208 358527 360 MT 205.3 1003
27 30.28300 -98.10340 1260 5748705 600 476 784
28 30.31926 -98.13424 1090 5832 350 MT 260.2 830
29 30.30567 -98.06542 1220 503 77.6 1142
30 30.29654 -98.07206 1150 443 93.2 1057
31 30.26682 -98.33137 1092 1092 EL 85.36 1007
32 30.34030 -98.22046 951 5747107 951 MT 38.80 912
33 30.33268 -98.20771 885 885 LT 99.55 785
34 30.31997 -98.21365 916 5747403 916 LT 140.9 775
35 30.31801 -98.21634 945 19431? 945 LT 169.2 776
36 30.31329 -98.38582 1188 1188 EL 63.1 1125
37 30.32218 -98.34384 1065 1065 EL 12.6 1052
38 30.34023 -98.33276 1184 1184 EL 50.2 1134
39 30.32272 -98.34389 1074 48239 1074 EL 14.1 1060
40 30.32361 -98.34483 1080 1080 EL 16.25 1064
41 30.33386 -98.33607 1154 282282 1154 EL 55.2 1099
42 30.28925 -98.40412 1165 1165 EL 15.35 1150
43 30.28926 -98.38206 1122 1122 EL 45.1 1077
AquiferEL Ellenburger LT Lower Trinity MT Middle Trinity
How Much Water is in the Pedernales? Determining the Source of Base Flow to the Pedernales River 16

APPENDIX A State Well Reports
View online at: http://bit.ly/BaseflowReportAppendixA
17 The Meadows Center for Water and the Environment