Embed Size (px)
Citation preview

How Long Can the Party Last For the New
Hampshire Economy?
Exeter Area Chamber of Commerce
January 10, 2017
Brian Gottlob
PolEcon Research

Yr.-Over-Yr. Private Sector Job Growth
0.5%
1.0%
1.5%
2.0%
2.5%
3.0%
2012 2013 2014 2015 2016 2017
�H MA U.S.
After Lagging for Much of the Recovery, Private Sector Job Growth
in NH Has Accelerated Over the Past 2 Years
3 Mos. Moving Average

NH Once Again Leads New England in Private Sector Job Growth
and is Near the Top Among all States
�ovember 2015 to August 2016 Private Sector Job Growth
-5.0%
-4.0%
-3.0%
-2.0%
-1.0%
0.0%
1.0%
2.0%
3.0%
4.0%
Wyom
ing
North D
akota
Alask
a
Oklahom
aK
ansa
s
Mississ
ippi
Ver
mont
New
Mex
ico
Louisiana
Connec
ticu
tW
est V
irgin
ia
Maine
New
Jer
sey
Illinois
Ohio
Pen
nsy
lvan
iaA
labam
a
Ark
ansa
sIo
wa
Wisco
nsin
Mar
yland
Virgin
iaN
ebra
ska
Ken
tuck
yRhode Island
Min
nes
ota
New
York
Indiana
Arizo
na
Montana
District of Colu
mbia
Delaw
are
Tex
asM
assa
chuse
tts
Michig
anN
orth C
arolina
Ten
nes
see
Californ
ia
Colo
rado
Misso
uri
Haw
aii
Geo
rgia
South
Dak
ota
South
Car
olina
Idah
oN
ew H
ampsh
ire
Nev
ada
Ore
gon
Was
hin
gto
nFlo
rida
Utah
�H
MA
VT
ME
CT
RI

14
16
18
20
22
24
26
28
30
32
09 10 11 12 13 14 15 16 17
-7.0%
-5.0%
-3.0%
-1.0%
1.0%
3.0%
5.0%
7.0%
Help Wanted Ads in �H (000s)
Year-Over-Year Private Sector JobGrowth in �H (%)
Help Wanted Ads Have Declined During the Same Time – More and
Faster Hiring Reduced Repeat Ads?
3 Mos. Moving Average

Annual Rate of Labor Force Growth
-2%
-1%
0%
1%
2%
3%
4%
5%
6%
81 82 83 84 85 86 87 88 89 90 91 92 93 94 95 96 97 98 99 00 01 02 03 04 05 06 07 08 09 10 11 12 13 14 15 16
�H Labor Force Growth
U.S. Labor Force Growth
After Years of Stagnation NH’s Labor Force Growth Supported
Greater Job Growth

95
100
105
110
115
120
00 01 02 03 04 05 06 07 08 09 10 11 12 13 14 15 16
NH Rock. County "Seacoast"
In-Migration and Population Growth Have Allowed the Seacoast Region’s Labor Force to Grow More and Support Higher Rates of
Job Growth

Private Sector Jobs Have Grown Faster in the Exeter Araea Chamber
Region Since the End of the Recession
Private Sector Emp. Growth 2010-QII2016
14.1%
7.6%
3.8%
2.8%
1.8%
10.7%
0%
2%
4%
6%
8%
10%
12%
14%
16%
18%
20%
Exeter Chamber
Communities
Rockingham County State of �H
2015-QII2016
2010-15

$22.0
$22.5
$23.0
$23.5
$24.0
$24.5
$25.0
$25.5
$26.0
$26.5
12 13 14 15 16 17
0.0%
0.5%
1.0%
1.5%
2.0%
2.5%
3.0%
Avg. Hourly Wages in Private Sector(3 Mos Moving Avg.)
Yr.-Over-Yr. % Growth Private Emp.In %H
R = .80
R2 = .66
Markets Work! As Hiring Has Accelerated So Too Have
Private Sector Wages

$20.0
$21.0
$22.0
$23.0
$24.0
$25.0
$26.0
$27.0
08 09 10 11 12 13 14 15 16 17
-8.00
-7.00
-6.00
-5.00
-4.00
-3.00
-2.00
Avg. Hourly Wages in Private Sector (3 Mos Moving Avg.)
%H Unemployment Rate (Inverted)
Average Wages Also Track NH’s Unemployment Rate

NH is Second Only to Utah in Personal Income Growth
Since 2015
(2.00)
0.00
2.00
4.00
6.00
8.00
10.00
North Dakota
Wyoming
Alaska*
Oklahoma
West Virginia
Louisiana
New Mexico
Montana
South Dakota
Iowa
Texas
Kansas
Minnesota
Nebraska
Vermont
Pennsylvania
Alabama
Kentucky
Rhode Island
Delaware
Mississippi
Wisconsin
Arkansas
Idaho
Ohio
Connecticut
Illinois
New Jersey
Missouri
Colorado
Maryland
Virginia
Arizona
Michigan
Tennessee
New York
Indiana
North Carolina
Hawaii*
Maine
Massachusetts
Florida
Georgia
Washington
South Carolina
California
Nevada
Oregon
New Hampshire
Utah
% Growth in Personal Income 2015 to QIII 2016 �H
MA
VT
ME
CT
RI

Alternative Measures of Labor Underutiliation
2.83.4 3.6 3.8
6.46.0
5.4 5.65.2
4.23.4
2.9
0.7
0.6 0.60.8
1.2
0.9
1.1 1.11.0
1.0
0.8
0.8
2.42.1
2.3
3.2
4.9
4.94.8 4.5
4.7
4.5
3.8
3.2
0.0
2.0
4.0
6.0
8.0
10.0
12.0
14.0
2005 2006 2007 2008 2009 2010 2011 2012 2013 2014 2015 Q3-
2016Part-Time (Not by Choice)
Discouraged & Marginally Attached
Basic Unemp Rate
All is Not Perfect - Labor Utilization is Still Not Back to
Pre-Recession Levels
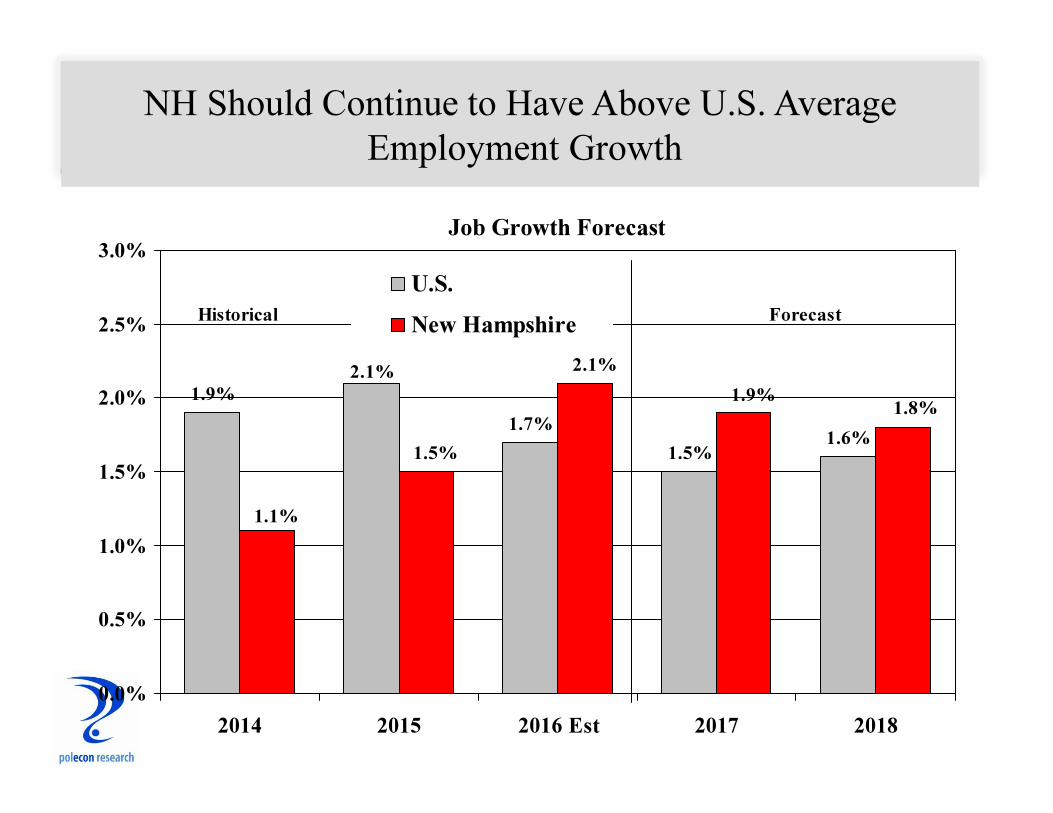
NH Should Continue to Have Above U.S. Average
Employment Growth
Job Growth Forecast
1.9%
1.7%
1.5%1.6%
2.1%2.1%
1.9%1.8%
1.5%
1.1%
0.0%
0.5%
1.0%
1.5%
2.0%
2.5%
3.0%
2014 2015 2016 Est 2017 2018
U.S.
�ew HampshireHistorical Forecast

Key Factors Affecting NH’s
Growth
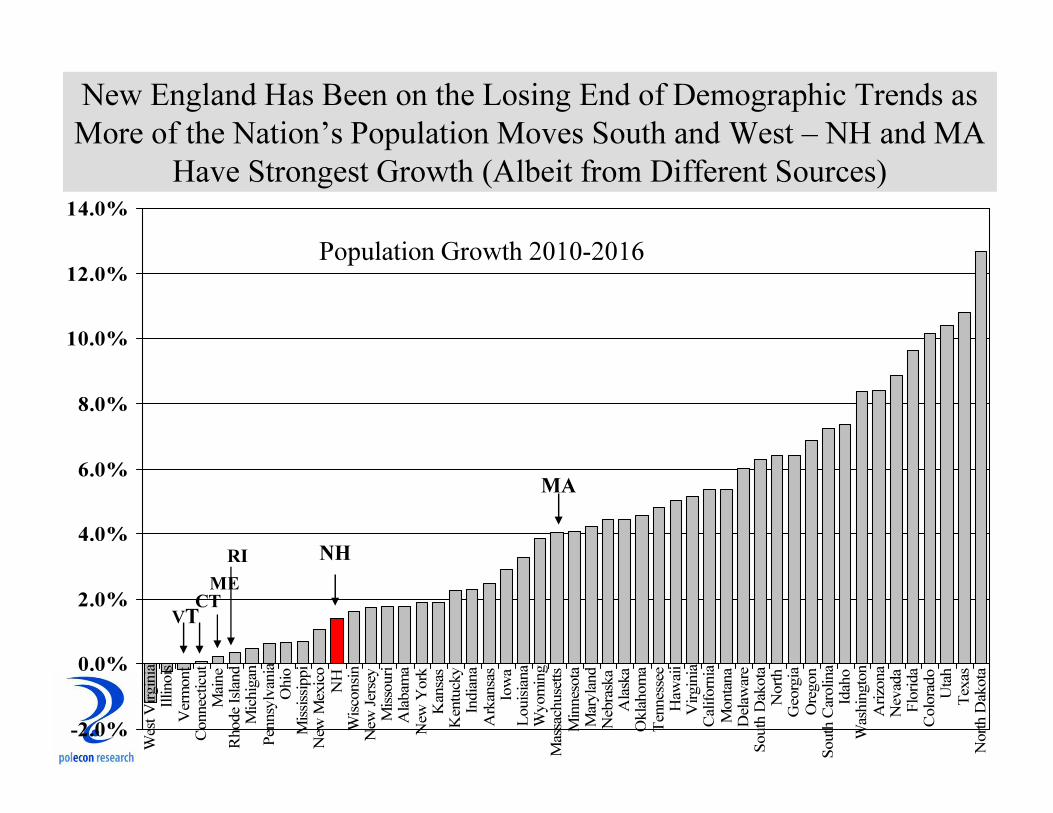
New England Has Been on the Losing End of Demographic Trends as
More of the Nation’s Population Moves South and West – NH and MA
Have Strongest Growth (Albeit from Different Sources)
-2.0%
0.0%
2.0%
4.0%
6.0%
8.0%
10.0%
12.0%
14.0%
West Virginia
Illinois
Vermont
Connecticut
Maine
Rhode Island
Michigan
Pennsylvania
Ohio
Mississippi
New Mexico
NH
Wisconsin
New Jersey
Missouri
Alabama
New York
Kansas
Kentucky
Indiana
Arkansas
Iowa
Louisiana
Wyoming
Massachusetts
Minnesota
Maryland
Nebraska
Alaska
Oklahoma
Tennessee
Hawaii
Virginia
California
Montana
Delaware
South Dakota
North
Georgia
Oregon
South Carolina
Idaho
Washington
Arizona
Nevada
Florida
Colorado
Utah
Texas
North Dakota
�H
MA
VT
ME
CT
RI
Population Growth 2010-2016

Population Growth From Migration
100,910
236,088
25,406
(72,605)
(28,565)
5,19612,5879,715
(9,272)(2,783)(1,962)
(135,684)
(200,000)
(150,000)
(100,000)
(50,000)
0
50,000
100,000
150,000
200,000
250,000
300,000
CT ME MA �H RI VT
Domestic
International
All of New England Lost Population Due to Net Out-Migration to
Other States but Gained From Net In-Migration From Other
Countries Between 2010 and 2016

Net Migration to NH
12,132
9,170
6,472
3,117
4,600
2,170
(2,389)(2,473)(2,602)
(773) (938)
(2,337)
2,854
(1,570)
2,187
(2,206)
-4,000
-2,000
0
2,000
4,000
6,000
8,000
10,000
12,000
14,000
01 02 03 04 05 06 07 08 09 10 11 12 13 14 15 16
�et State-to-State Migration
�et International Migration
Net State-to-State Migration to NH is Resuming and is the Most
Important Factor in Determining How Much We Grow

The Seacoast Has Accounted for Almost all of NH’s Net State-to-
State Migration Since the End of the Recession
(Providing Clues to What it Takes to Attract Individuals)
Net Domestic Migration 2010-2015
(6,685)
104
556
1,157
3,389
(93)
(667)
(1,360)
(1,038)
(887)
-8,000 -6,000 -4,000 -2,000 0 2,000 4,000
Hillsborough County
Cheshire County
Coos County
Grafton County
Sullivan County
Merrimack County
Carroll County
Belknap County
Strafford County
Rockingham County

Rockingham County Attracts a Range of Demographics But Higher
Rates of Early and Mid-Career Individuals Than Does NH Overall
Age Distribution of Out-of-State Movers to NH (2011-2015)
14.7%
12.7%
13.5%
23.0%
11.7%
9.9%
7.3%
7.1%
17.5%
3.1%
13.7%
25.0%
14.0%
10.6%
8.2%
8.0%
0.0% 5.0% 10.0% 15.0% 20.0% 25.0% 30.0%
Under 18
18 to 19
20 to 24
25 to 34
35 to 44
45 to 54
55 to 64
65 +

The Impact of Baby Boom Retirements Will Make Net In-Migration Even More
Important to Labor Force Growth: The Gap Between The Number Who Will be
Entering vs. Exiting The Labor Force Over the Next 15 Years is Greatest in
Many Northeastern States
Pop.Age 5-19 Minus Pop. 50-64 as % of Working Age Population
-10%
-8%
-6%
-4%
-2%
0%
2%
4%
6%
8%
10%
Maine
Vermont
West Virginia
NH
Montana
Florida
Pennsylvania
Oregon
Rhode Island
Hawaii
Massachusetts
Connecticut
Wyoming
Delaware
New York
Wisconsin
Michigan
Ohio
New Jersey
Washington
Maryland
Kentucky
ND
South
Tennessee
Virginia
Missouri
Alabama
Minnesota
Iowa
Colorado
North
South Dakota
Louisiana
Illinois
New Mexico
Nevada
Alaska
Arkansas
Indiana
Oklahoma
Nebraska
Kansas
Mississippi
California
Arizona
Georgia
Idaho
Texas
MAME
VTNH RI
CT
Utah 17%

Industries With a Lower Ratio of Younger Workers Relative to Workers
Near Retirement Will Have Worker Replacement Needs But Tend to
Attract Fewer Younger Workers
27.6%
53.4%
59.4%
62.2%
63.0%
66.8%
67.7%
72.8%
73.7%
80.3%
81.7%
83.3%
91.9%
106.5%
120.1%
138.3%
151.7%
156.6%
36.3%
0% 20% 40% 60% 80% 100% 120% 140% 160% 180%
Real Estate
Art, Ent., & Rec.
Durable Goods Manuf.
�on-Durable Manuf.
Educational Services
Utilities
Transp. & Warehousing
Health Care & Soc. Asst.
Prof., Sci., & Tech. Srvcs.
Public Administration
Wholesale trade
�H Total
Other Services
Construction
Mgmt, Admin. & Supprt Srvcs
Finance and Insurance
Information
Retail Trade
Accom. & Food Srvcs.
Ratio of Workers Age 25-34 to Workers 55-64 By Industry in NH

Combining The Age Composition of an Industry’s Workforce With Projected
Employment Growth Highlights Those Industries Most Likely to Face the Greatest
Labor Shortages (Some Occupations Will be in Short Supply in all Industries)
12.5%
9.3%
7.0%
1.6%
-7.1%
-7.2%
-8.1%
-11.0%
-13.3%
-14.8%
-3.2%
-0.4%
-0.6%
5.8%
3.9%
2.9%
10.0%
-20% -15% -10% -5% 0% 5% 10% 15%
Utilities
Information
Retail Trade
Manufacturing
Accom. & Food Srvcs.
Transp. & Warehousing
Public Administration
Finance and Insurance
Other Services
Educational Services
Wholesale trade
Art, Ent., & Rec.
Construction
Real Estate
Admin. & Supprt Srvcs
Prof., Sci., & Tech. Srvcs.
Health Care & Soc. Asst.
Projected Supply/Demand Balance of Labor by Industry in NH

NH is Not Monolithic When it Comes to Aging – Community’s are
Aging Differently and the Decisions They Make Will Have More
Impact Than State Policies
Median Age of Population
35.0
39.2
39.6
40.4
40.5
40.9
41.1
41.6
41.8
43.4
43.3
0.8
3.3
2.2
2.6
1.5
0.5
3.1
3.6
1.1
2.5
0.443.9
-2.1
(5) 5 15 25 35 45 55
�ewmarket
�ewfields
�H
Raymond
Rockingham Cnty
Brentwood
Epping
Stratham
Kingston
East Kingston
Kensington
Exeter
2005-2009
2010-2014
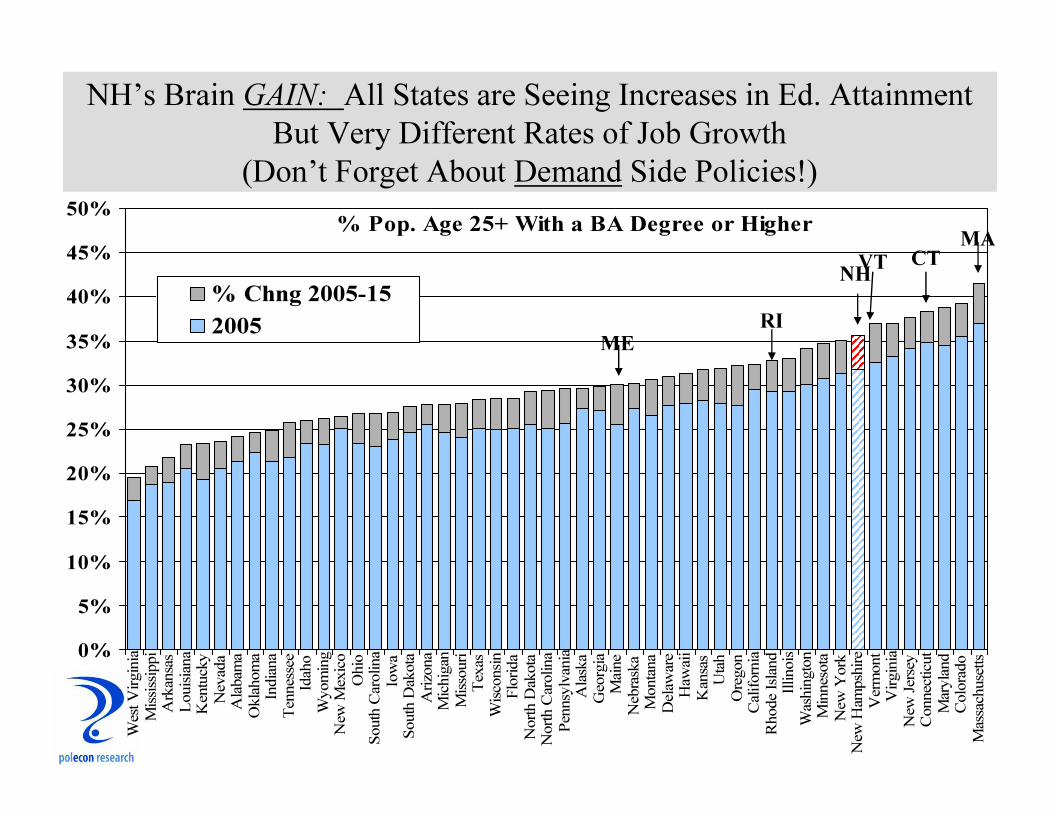
NH’s Brain GAI�: All States are Seeing Increases in Ed. Attainment
But Very Different Rates of Job Growth
(Don’t Forget About Demand Side Policies!)
% Pop. Age 25+ With a BA Degree or Higher
0%
5%
10%
15%
20%
25%
30%
35%
40%
45%
50%
West Virginia
Mississippi
Arkansas
Louisiana
Kentucky
Nevada
Alabama
Oklahoma
Indiana
Tennessee
Idaho
Wyoming
New Mexico
Ohio
South Carolina
Iowa
South Dakota
Arizona
Michigan
Missouri
Texas
Wisconsin
Florida
North Dakota
North Carolina
Pennsylvania
Alaska
Georgia
Maine
Nebraska
Montana
Delaware
Hawaii
Kansas
Utah
Oregon
California
Rhode Island
Illinois
Washington
Minnesota
New York
New Hampshire
Vermont
Virginia
New Jersey
Connecticut
Maryland
Colorado
Massachusetts
% Chng 2005-15
2005
�H
MA
VT
ME
CT
RI

Over 50 Percent of the Individuals (Age 25+) Who Moved to Rockingham County
From Another State Have a Bachelor’s Degree or Higher
(Ed. Attainment of Individuals Age 25+ Who Moved to NH Between 2011 and 2015)
5.3%
21.1%
25.9%
29.2%
18.4%
4.9%
18.0%
24.6%
34.1%
18.3%
0.0% 5.0% 10.0% 15.0% 20.0% 25.0% 30.0% 35.0% 40.0%
Less Than HS Grad.
HS Grad.
Some College or
Associate's Degree
Bachelor's
Grad. Or Prof.
�H Rock. County

We AREAdding Educated Labor But We are Adding More Than is
Being Employed by NH Businesses (Demand Side Matters! And
Maybe Associate’s and Certificate Degrees are a Better Indicator)
31.8%
35.7%
31.6% 30.9%
10%
15%
20%
25%
30%
35%
40%
45%
50%
2005 2015
% of �H Pop Age 25+ With at BA Degree or Higher
% of �H Jobs Held by Someone Age 25+ With a BA Degree or Higher

The Region is Gaining “Brains” at a Much Faster Rate Than is
NH Overall
% Pop. Age 25+ With a Bachelor's Degree or Higher
13.2
15.4
24.4
25.9
28.2
18.3
32
41.3
(0.2)
(0.9)
4.3
4.7
9.2
6.0
8.3
11.2
13
5.6
11
16.9
9.9
9.4
5.8 6.3
(5) 5 15 25 35 45 55 65
Raymond
Epping
�H
Rockingham Cnty
�ewmarket
Brentwood
Exeter
Stratham
1990
2000
2010-2014

Corporate Taxes as a % of Private Sector Gross State Product
0.0%
0.2%
0.4%
0.6%
0.8%
1.0%
1.2%
1.4%
92 93 94 95 96 97 98 99 00 01 02 03 04 05 06 07 08 09 10 11 12 13 14 15
�H MA
A Key Policy is Tax Rates. Business Taxes as a Pct. of Private Sector
Gross State Product is a Better Relative Measure of Than Burden Than
is the Tax Rate – They are High in NH

Avg. NH Electricity Prices as a % of U.S. Average Prices
75%
95%
115%
135%
155%
175%
195%
215%
01 02 03 04 05 06 07 08 09 10 11 12 13 14 15
Industrial Commercial Residential
Electricity Prices in NH are Especially Hard on Manufacturers.
Industrial Customers Pay About 80% More for Electricity in NH
Than the U.S. Avg..
Source: U.S. Energy Information Agency, PolEcon

First Year Energy Cost Savings in NH From NED ($Million)
$17.7
$24.1$20.9
$40.7
$40.9
$21.2
$0
$10
$20
$30
$40
$50
$60
$70
Residential Sector Commercial Sector Industrial Sector
Millions
Electricity
atural Gas
$58.4
(3.4% Reduction)
$65.0
(6.5% Reduction)
$42.1
(8.9% Reduction)
One Pipeline Project’s (NED) Impact on Natural Gas Prices in New England
Would Have Resulted in an Annual $165.5 Million in Energy Cost Savings in the
Residential, Commercial, and Industrial Sectors in NH

Annual Energy Savings in NH by Sector
$64.9 $69.7 $74.5 $79.3 $84.1 $88.9 $93.8 $98.7 $103.6 $108.5
$42.1$45.0
$48.0$51.1
$54.1$57.0
$60.0$62.9
$65.7$68.4
$58.4$62.4
$66.7$71.1
$75.6$80.0
$84.4$88.8
$93.2$97.7
$0
$50
$100
$150
$200
$250
$300
2019 2020 2021 2022 2023 2024 2025 2026 2027 2028
Millions
Commercial Industrial Residential
I Estimated Energy Savings to NH Consumers to be About
$2.2 Billion in the First 10 Years of NED Operation

Strong and Committed Local Banks are Key to the Strength of the Regional
Economy: Optima Bank and Trust Has Bucked the National Trend of Declining
Small Business Loans by Community Banks Following Passage of New Regulations
% Change Between 2010 and QIII2016
2.2%-25.0%
102.7%
-40%
-20%
0%
20%
40%
60%
80%
100%
120%
Optima Bank and
Trust
All Community
Banks �ationally
<$1 Billion
All Banks �ationally
>$1 Billion