Embed Size (px)
Citation preview

How Healthy is Moreton How Healthy is Moreton Bay,Bay,
and its Rivers and Creeks?and its Rivers and Creeks?Angela Grice, Francis Pantus, Dan Wruck & Bill DennisonAngela Grice, Francis Pantus, Dan Wruck & Bill Dennison
M O N I T O R I N G P R O G R A M M O N I T O R I N G P R O G R A M
CRC for Coastal ZoneCRC for Coastal ZoneEstuary & Waterway ManagementEstuary & Waterway Management
Adrian Jones & Ivan HollandAdrian Jones & Ivan Holland

OutlineOutline
• BackgroundBackground• PressuresPressures• ImpactsImpacts• ResponseResponse• Ecosystem Health MonitoringEcosystem Health Monitoring• Oxley CreekOxley Creek• Health of the riversHealth of the rivers• Health of Moreton BayHealth of Moreton Bay

NorthNorthStradbrokeStradbroke
IslandIsland
RedcliffeRedcliffe
Bribie Bribie IslandIsland
Moreton Moreton IslandIsland
BrisbaneBrisbaneRiverRiver
LoganLoganRiverRiver
PinePineRiverRiver
CabooltureCabooltureRiverRiver
Moreton BayMoreton Bay
• Moreton region has 2 million Moreton region has 2 million people and is the fastest people and is the fastest growing region in the growing region in the countrycountry
• Moreton Bay receives inputMoreton Bay receives input from Brisbane, Logan, from Brisbane, Logan, Caboolture and PineCaboolture and Pine Rivers Rivers
• The Brisbane River has the The Brisbane River has the - largest catchmentlargest catchment of all of all
regionsregions- highest population highest population
densitydensity- hhighest sewage inputsighest sewage inputs
OxleyOxleyCreekCreek

Rivers and Bay are important to us …Rivers and Bay are important to us …
TrawlingTrawling
WaterskiingWaterskiing SwimmingSwimmingPort of BrisbanePort of Brisbane
Fishing at Luggage Pt OutfallFishing at Luggage Pt Outfall

… … and everyone else!and everyone else!

Population expansion in the region over the past half century is Population expansion in the region over the past half century is one of the most rapid in the world and provides one of the one of the most rapid in the world and provides one of the major pressures to ecosystem healthmajor pressures to ecosystem health
Population Growth is a major Population Growth is a major pressurepressure

Sewage discharges concentrated in Brisbane Sewage discharges concentrated in Brisbane River & Bramble Bay River & Bramble Bay
• Largest sewage Largest sewage discharge = Luggage Pt. discharge = Luggage Pt. at mouth of Brisbane R.at mouth of Brisbane R.
• Oxley Creek = second Oxley Creek = second largestlargest
• 3 significant discharges 3 significant discharges into into Bramble BayBramble Bay and and Hayes Inlet from Pine Hayes Inlet from Pine Rivers, Redcliffe and Rivers, Redcliffe and Brisbane CityBrisbane City
• Multiple minor discharges Multiple minor discharges scattered throughout scattered throughout tidal reachestidal reaches

18601860 19001900 19401940 19801980
100100
300300
200200
Land
are
a 00
0’s
haLa
nd a
rea
000’
s ha
IncreasinIncreasin
g land-g land-
useuse
Sown pastureCropped land
and fertilizer and fertilizer
applicationapplication
19101910 19501950 19901990
55
1010
1515
2020
Fer
tiliz
er 0
00’s
t yr
Fer
tiliz
er 0
00’s
t yr
-1-1 NPK

Urban areas are the largest Urban areas are the largest source of source of TurbidityTurbidity
Und
istu
rbed
Und
istu
rbed
Past
ure
Past
ure
Cul
tivat
ed
Cul
tivat
edR
ural
resi
dent
ial
Rur
al re
side
ntia
lU
rban
per
viou
s
Urb
an p
ervi
ous
Urb
an im
perv
ious
Urb
an im
perv
ious
00
200200
400400
600600
800800
10001000
TS
S (
kg h
aT
SS
(kg
ha-1-1
yr
yr-1-1
))

• Residence times Residence times are highly variable are highly variable
• Rivers have the longest Rivers have the longest residence timeresidence time
• Short residence times Short residence times near inlets near inlets
• Bramble Bay has the Bramble Bay has the longest residence time longest residence time within the baywithin the bay
Residence time Residence time affects dilution of affects dilution of
nutrients & nutrients & sedimentssediments

Rivers receive inputs from a variety of Rivers receive inputs from a variety of point and non point sourcespoint and non point sources
Sewage OutfallSewage Outfall Sewage Treatment PlantSewage Treatment Plant Industry OutfallIndustry Outfall
Golf course fertiliser Golf course fertiliser runoff and gravel runoff and gravel extraction plantextraction plant
Grazing - manureGrazing - manure
AquacultureAquaculture
• Primary inputs are nutrients (nitrogen & phosphorus) Primary inputs are nutrients (nitrogen & phosphorus) and suspended solidsand suspended solids

Degraded waterways stimulates study Degraded waterways stimulates study
• CConcern about oncern about impacts of impacts of expanding expanding populationpopulation
• Moreton Bay studyMoreton Bay study

““Moreton Bay and its waterways will, by Moreton Bay and its waterways will, by 2020, be a healthy ecosystem supporting 2020, be a healthy ecosystem supporting the livelihoods and lifestyles of residents the livelihoods and lifestyles of residents
and visitors”and visitors”

STRATEGY
RESEARCH
MONITORING
RiparianRiparianRehabilitatiRehabilitati
onon
Sewage Sewage TreatmentTreatmentUpgradesUpgrades
Stormwater Quality Stormwater Quality Improvement Improvement
DeviceDevice
To protect and restore waterways -To protect and restore waterways -

MonitoringMonitoring & Research & Research
• Essential tools for effective preservation and remediation of waterways
• Determines ecological outcomes of nutrient removal from sewage, stormwater controls and other management actions

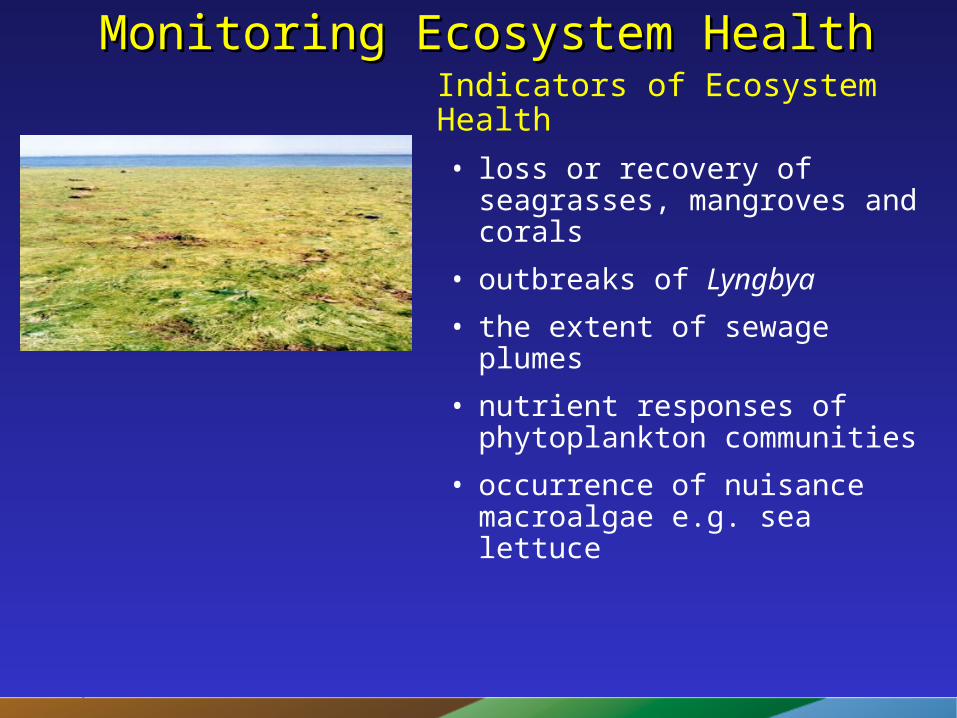
Monitoring Ecosystem HealthMonitoring Ecosystem HealthIndicators of Ecosystem Health• loss or recovery of seagrasses,
mangroves and corals

Monitoring Ecosystem HealthMonitoring Ecosystem HealthIndicators of Ecosystem Health• loss or recovery of seagrasses,
mangroves and corals
• outbreaks of Lyngbya

Monitoring Ecosystem HealthMonitoring Ecosystem HealthIndicators of Ecosystem Health
• loss or recovery of seagrasses, mangroves and corals
• outbreaks of Lyngbya
• the extent of sewage plumes

Monitoring Ecosystem HealthMonitoring Ecosystem HealthIndicators of Ecosystem Health
• loss or recovery of seagrasses, mangroves and corals
• outbreaks of Lyngbya
• the extent of sewage plumes
• nutrient responses of phytoplankton communities
Monitoring Ecosystem HealthMonitoring Ecosystem HealthIndicators of Ecosystem Health
• loss or recovery of seagrasses, mangroves and corals
• outbreaks of Lyngbya
• the extent of sewage plumes
• nutrient responses of phytoplankton communities
• occurrence of nuisance macroalgae e.g. sea lettuce

Monitoring Ecosystem HealthMonitoring Ecosystem HealthIndicators of Ecosystem Health
• loss or recovery of seagrasses, mangroves and corals
• outbreaks of Lyngbya
• the extent of sewage plumes
• nutrient responses of phytoplankton communities
• occurrence of nuisance macroalgae e.g. sea lettuce
• status of turtles and dugongs
• water quality– phytoplankton biomass
– nitrogen and phosphorus
– turbidity

Oxley CreekOxley Creek
• Oxley Creek drains an Oxley Creek drains an area of 260 kmarea of 260 km22
• It originates at Mt Perry It originates at Mt Perry south of Ipswich near south of Ipswich near Flinder’s PeakFlinder’s Peak
• Variety of land usesVariety of land uses• The catchment The catchment
contains the contains the endangered Angle-endangered Angle-stemmed Myrtle stemmed Myrtle ((Austromyrtus Austromyrtus gonocladagonoclada))

Historically, Oxley Creek was cleanerHistorically, Oxley Creek was cleaner• “ …“ …During summer During summer
holidays, as school boys, we holidays, as school boys, we had regularly swum and had regularly swum and fished in the creek.”fished in the creek.”
• “…“….in spawning times…. .in spawning times…. The mullet would jump out The mullet would jump out of the water…”of the water…”
• ““It was always muddy but It was always muddy but not as bad as it is today.”not as bad as it is today.”

Oxley Creek is biologically importantOxley Creek is biologically important
Fruit Bat ColonyFruit Bat Colony
Wading BirdsWading Birds
Wading BirdsWading Birds
DingoDingo

Oxley Creek has recreational valueOxley Creek has recreational value
Boats moored on creekBoats moored on creek
Canoeing on Oxley CreekCanoeing on Oxley Creek
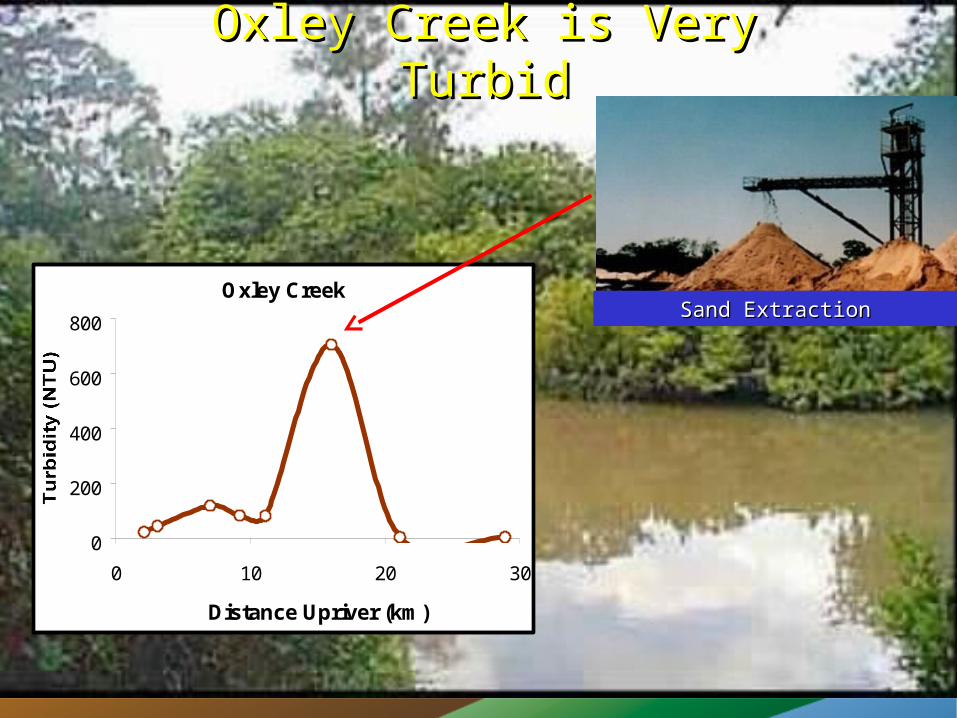
Oxley Creek is Very TurbidOxley Creek is Very Turbid
Sand ExtractionSand ExtractionOxley Creek
0
200
400
600
800
0 10 20 30
Distance Upriver (km)

Oxley Creek is Rich in NutrientsOxley Creek is Rich in Nutrients
Oxley Creek
0
5
10
15
20
0 10 20 30
Distance Upriver (km)
Oxley Creek
0
100
200
300
0 10 20 30
Distance Upriver (km)
Inala STPInala STP
Causing algal bloomsCausing algal bloomsdownstreamdownstream

Oxley Creek is Rich in NutrientsOxley Creek is Rich in Nutrients
Oxley Creek receives Oxley Creek receives nutrients from the nutrients from the
influx of the Brisbane influx of the Brisbane RiverRiver
Oxley Creek
0
50
100
150
200
250
0 10 20 30
Distance Upriver (km)
Oxley CkOxley CkSTPSTP
• 2nd largest STP2nd largest STP

Impacts on Oxley CreekImpacts on Oxley Creek
High faecal coliforms High faecal coliforms indicates indicates
contamination by contamination by faecesfaeces
Oxley Creek
0
1000
2000
3000
4000
5000
0 10 20 30
Distance Upriver (km)
Fa
ec
al
co
lifo
rms
(C
FU
/10
0m
L)
Oxley Creek
0
20
40
60
80
0 10 20 30
Distance Upriver (km)
Dis
solv
ed o
xyg
en (
%)
Low dissolved oxygen Low dissolved oxygen restricts aquatic liferestricts aquatic life
high

Community InvolvementCommunity Involvement
School students School students monitoring water qualitymonitoring water quality
• Wetland restorationWetland restoration• Weed eradicationWeed eradication• Riparian regenerationRiparian regeneration• Water quality monitoringWater quality monitoring
Healthy riparian zone at Healthy riparian zone at upper Oxley Creekupper Oxley Creek

River estuaries: moderately to highly River estuaries: moderately to highly degradeddegraded
Pine RiverPine River
Brisbane RiverBrisbane RiverLogan RiverLogan River Bremer RiverBremer River
Caboolture RiverCaboolture River
ModerateModeratedegradationdegradation
HighHighdegradationdegradation
• Nutrients & sediments from Nutrients & sediments from forestry, agricultural and forestry, agricultural and urban areasurban areas
• Algal booms, high nutrientsAlgal booms, high nutrients• Nutrient uptake means no Nutrient uptake means no
sewage nitrogen impact on sewage nitrogen impact on Deception BayDeception Bay
• Urbanised & Urbanised & industrial industrial catchmentcatchment
• High turbidity High turbidity & nutrients& nutrients
• Urbanised & Urbanised & agricultural agricultural catchmentcatchment
• Aquaculture Aquaculture prominentprominent
• Very turbidVery turbid
• Highly turbidHighly turbid• Extensive Extensive
vegetation vegetation clearedcleared
• 10x more N10x more N
• Extremely Extremely degradeddegraded
• Very high nutrient Very high nutrient loadingsloadings
• Too turbid for Too turbid for phytoplanktonphytoplankton
• Long residence Long residence timetime

Rivers are nutrient over-enrichedRivers are nutrient over-enriched• High concentrations of nutrients often results in High concentrations of nutrients often results in
blooms of single species – reducing diversityblooms of single species – reducing diversity
Benthic microalgal bloom on Benthic microalgal bloom on Brisbane River sedimentBrisbane River sediment
Jellyfish bloom in response to high Jellyfish bloom in response to high plankton biomass in Pine Riverplankton biomass in Pine River
Aquatic weed bloom in upper Aquatic weed bloom in upper Brisbane RiverBrisbane River
Phytoplankton bloom in Phytoplankton bloom in Caboolture RiverCaboolture River

River EstuariesRiver EstuariesReport Card Report Card 20002000
NorthNorthStradbrokeStradbroke
IslandIsland
RedcliffeRedcliffe
Bribie Bribie IslandIsland
Moreton Moreton IslandIsland
BrisbaneBrisbaneRiverRiver
LoganLoganRiverRiver
PinePineRiverRiver
CabooltureCabooltureRiverRiver
Caboolture Caboolture RiverRiver
CC
WorsenedWorsened
UnchangedUnchanged
ImprovedImproved
AA excellent excellent BB good good CC fair fair DD poor poor FF fail fail
Pine RiversPine Rivers DD
Brisbane Brisbane RiverRiver
DD
Bremer Bremer RiverRiver
FFLogan RiverLogan RiverDD

RiverRiver estuariesestuaries
Moreton BayMoreton Bay
Pristine and Pristine and diverse diverse marine marine environmentsenvironments
Highly Highly impactedimpactedriver estuariesriver estuaries

Monitoring has identified zones of Monitoring has identified zones of impactsimpacts
Oxley CkOxley Ck

Historically the Western Bay was Historically the Western Bay was relatively pristinerelatively pristine
Within Moreton Bay, dugongs, sea turtles and Within Moreton Bay, dugongs, sea turtles and extensive seagrass beds were once present on extensive seagrass beds were once present on the urbanised western shores, but are now the urbanised western shores, but are now largely restricted to the well flushed eastern largely restricted to the well flushed eastern regions.regions.

What are the impacts on Moreton Bay?What are the impacts on Moreton Bay?• SedimentsSediments
– 50,000 truck loads of mud into 50,000 truck loads of mud into Brisbane River every yearBrisbane River every year
• NutrientsNutrients– 500 olympic swimming pools of 500 olympic swimming pools of
treated sewage effluent every daytreated sewage effluent every day– 1/3 Brisbane River flow is sewage 1/3 Brisbane River flow is sewage
effluenteffluent
• LyngbyaLyngbya– 3000 football fields of seagrass 3000 football fields of seagrass
covered by covered by LyngbyaLyngbya in Moreton Bay in Moreton Bay

Sewage PlumeSewage Plume Mapping identifies Mapping identifies zones of human impactzones of human impact
• Macroalgae takes up sewage Macroalgae takes up sewage nutrientsnutrients
• Chambers deployed around bay and Chambers deployed around bay and riversrivers
• Allows mapping of extent of sewage Allows mapping of extent of sewage plumeplume
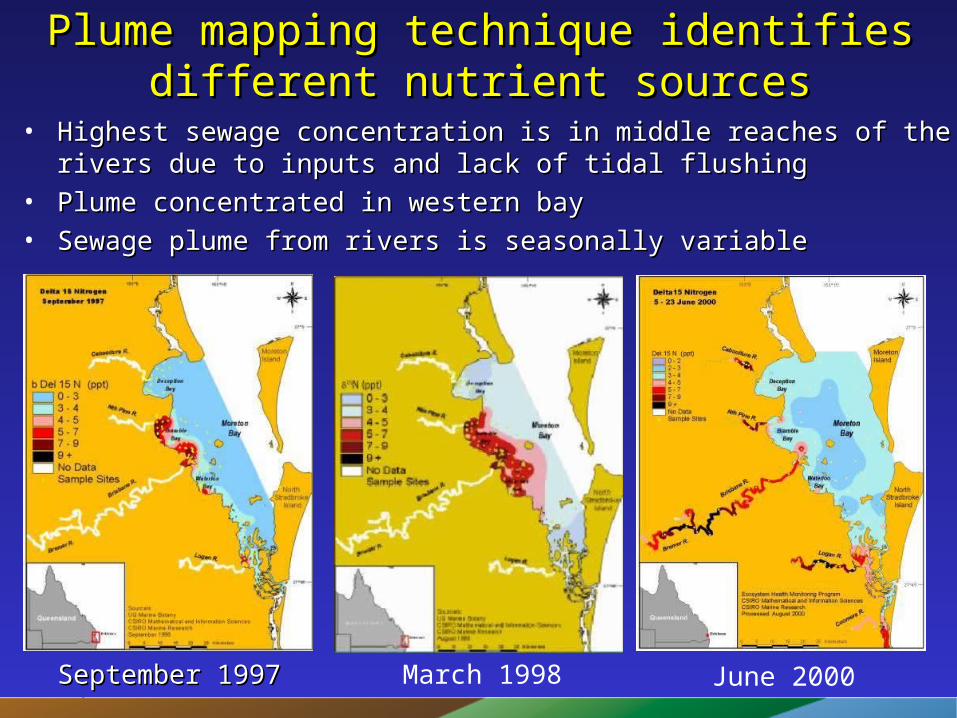
Plume mapping technique identifies Plume mapping technique identifies different nutrient sourcesdifferent nutrient sources
• Highest seHighest sewage concentrationwage concentration is in middle reaches of the rivers is in middle reaches of the rivers due to inputs and lack of tidal flushingdue to inputs and lack of tidal flushing
• Plume concentrated in western bayPlume concentrated in western bay• Sewage plume from rivers is seasonally variableSewage plume from rivers is seasonally variable
September 1997September 1997 March 1998 June 2000

Monitoring affects management Monitoring affects management decisionsdecisions

SedimentSediments impact West Moreton Bays impact West Moreton Bay
model outputmodel output simulating May 96 flood simulating May 96 flood

With sediments come nutrientsWith sediments come nutrients
% Mud Total N (mg L-1)

Sediment re-suspensionSediment re-suspension Bramble BayBramble Bay
Ne
arb
ed
wav
e
Ne
arb
ed
wav
e
velo
citie
s (c
m s
velo
citie
s (c
m s
-1-1))
Wa
ter
dep
th (
m)
Wa
ter
dep
th (
m)
00
2020
3030
4040
1010
5.55.5
6.56.5
7.57.5
8.58.5
TideTide
WindWind
February 3February 3January 27January 27January 20January 20
wind waves and tidal wind waves and tidal currentscurrents

Suspended solidsSuspended solids Seagrass distributionSeagrass distribution
Sediments affect seagrass Sediments affect seagrass distributiondistribution

Sediments affect seagrass Sediments affect seagrass distributiondistribution
• Reduced water clarity Reduced water clarity in Waterloo Bay due to in Waterloo Bay due to river inputs and river inputs and resuspensionresuspension
• Last remaining healthy Last remaining healthy seagrass beds in seagrass beds in Western Moreton BayWestern Moreton Bay
• Sensitive region with Sensitive region with variable water qualityvariable water quality
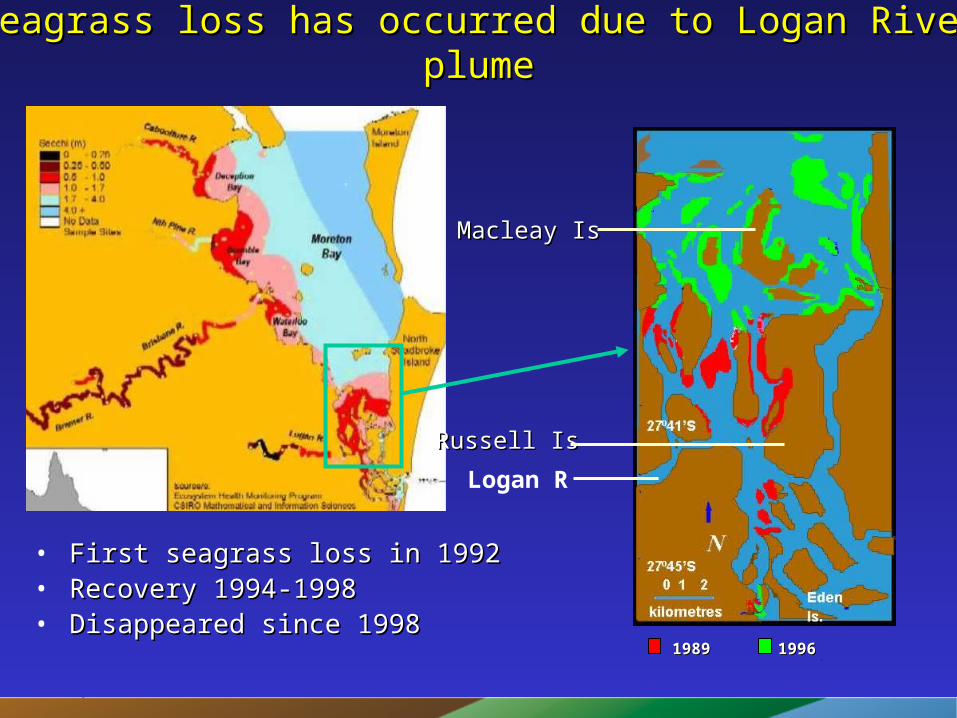
Seagrass Seagrass lossloss has has occurredoccurred due todue to Logan River Logan River plume plume
19891989 19961996
Logan R
• First seagrass loss in 1992First seagrass loss in 1992• RecoveryRecovery 1994-1998 1994-1998• Disappeared since 1998Disappeared since 1998
Russell IsRussell Is
Macleay IsMacleay Is

SSeagrasseagrass loss is ongoing loss is ongoing• Deception Bay (97)Deception Bay (97)• Long Island (92, recover Long Island (92, recover
98)98)• Behm’s Creek (96) Behm’s Creek (96) • Northern Broadwater Northern Broadwater
(00)(00)• Lyngbya majusculaLyngbya majuscula
bloombloom
Loss reduces habitatLoss reduces habitat

Are sediments affecting cAre sediments affecting coralorals too?s too?
• Scoping surveys shown dramatic shift from dead to Scoping surveys shown dramatic shift from dead to live coral cover with distance from mainland in live coral cover with distance from mainland in Waterloo BayWaterloo Bay
• Intensive survey will be conducted each winter Intensive survey will be conducted each winter
Favia speciosaFavia speciosa..Waterloo BayWaterloo Bay

Excessive nutrients cause algal Excessive nutrients cause algal bloomsblooms
Ulva bloom
Algal bloom 1000 ML per day

Bramble Bay is nutrient ladenBramble Bay is nutrient laden
• Phytoplankton blooms
• Mangroves full with nutrients
• Sediments release nutrients
Mangroves
Phytoplankton
Phytoplankton levels
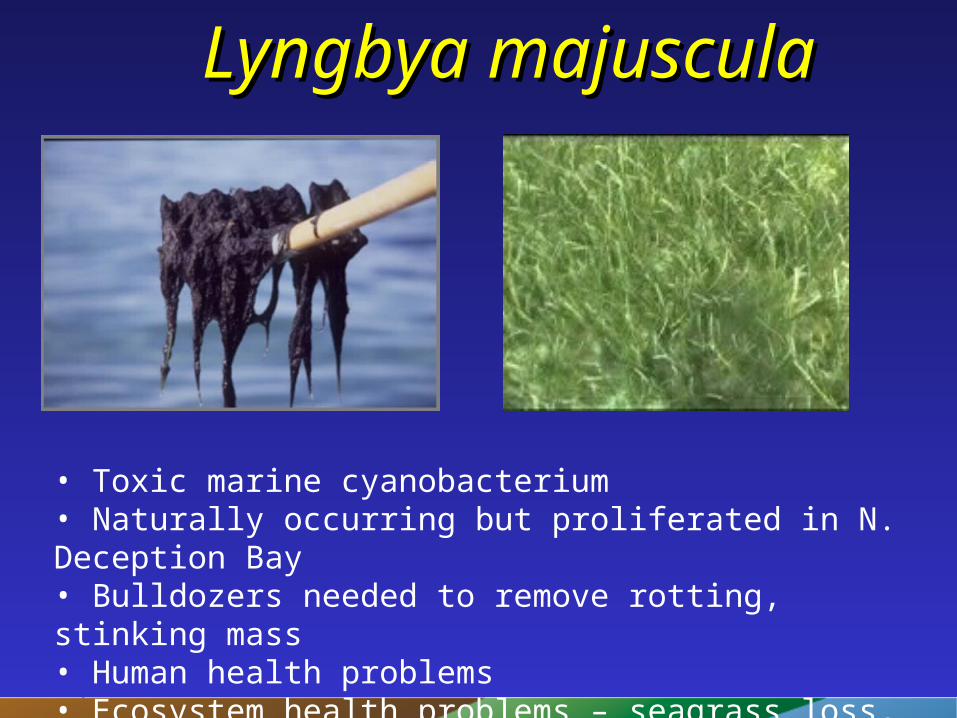
Lyngbya majusculaLyngbya majuscula
• Toxic marine cyanobacterium • Naturally occurring but proliferated in N. Deception Bay• Bulldozers needed to remove rotting, stinking mass• Human health problems• Ecosystem health problems – seagrass loss, repels fish

LyngbyaLyngbya has rapid growth has rapid growth

LyngbyaLyngbya at Amity & Moreton Banksat Amity & Moreton Banks
• Occurs naturally on reefs and seagrass bedsOccurs naturally on reefs and seagrass beds• Large amounts at Large amounts at Moreton / Amity Banks last summerMoreton / Amity Banks last summer• Potential threat to main dugong & turtle grazing areasPotential threat to main dugong & turtle grazing areas• Less toxic than in Deception Bay, oyster impact unknownLess toxic than in Deception Bay, oyster impact unknown

Canal developmentMelaleuca
Intact pine forest
Cleared pine forest
Soils samples collected from various sites in the Pumicestone Passage and Deception
Bay region
Sandstone Point
Shirley Creek
Mangrove
Coffeerock

Clean, clear water
No algal blooms
Best in the BayBest in the BayEastern Eastern & Northern & Northern Moreton BayMoreton Bay

Eastern Eastern & Northern & Northern Moreton BayMoreton Bay B- B-//AA
• Most pristine area of Moreton Bay
• extensive seagrass beds, mangroves, & coral reefs supporting huge diversity of marine life
• dugongs, turtles, whales, dolphins, fish
• Excellent water quality
• Tidal flushing – 1 day

Turtles and dugongsTurtles and dugongs
Dugongs and turtles now concentrated on Eastern side
Dugongs• Population ~ 900• 7 deaths since Jun 99
Turtles• Population > 10,000• Green Turtle Fibropapilloma Disease• 70% affected in S. Bay• 40% affected in Peel Is. & reefs• 20% affected at Moreton Banks

Eastern BanksEastern Banks• Well-flushedWell-flushed
• Extensive seagrass beds Extensive seagrass beds supporting dugongs & turtlessupporting dugongs & turtles
• LyngbyaLyngbya
BB--
Bramble BayBramble Bay• Sewage inputsSewage inputs• High nutrients and turbidityHigh nutrients and turbidity• UlvaUlva blooms blooms• Historical seagrass lossHistorical seagrass loss• High sediment nutrient High sediment nutrient
fluxesfluxes
FF
Waterloo BayWaterloo Bay• Some coralSome coral• Stable seagrass bedsStable seagrass beds• Stormwater controlStormwater control
CC++
Northern DeceptionNorthern DeceptionBayBay• No improvement No improvement
• Declining seagrassDeclining seagrass
• LyngbyaLyngbya outbreak outbreak
DD--
Southern DeceptionSouthern DeceptionBayBay• No seagrass recoveryNo seagrass recovery• High turbidityHigh turbidity
DD
Southern BaySouthern Bay• Extensive mangrove forestsExtensive mangrove forests• Sewage inputsSewage inputs• SeagrassSeagrass losseslosses• Lack of mangrove recovery Lack of mangrove recovery
from hail damagefrom hail damage
CC--
BBCentral BayCentral Bay• High sediment nutrientsHigh sediment nutrients
• Muddy sedimentsMuddy sediments
• Relatively good water qualityRelatively good water quality
Northern BayNorthern Bay• Well-flushed by Well-flushed by
oceanic watersoceanic waters
• Intact denitrificationIntact denitrification
AAMoreton Bay Moreton Bay
Report Card 2000Report Card 2000
WorsenedWorsened UnchangedUnchanged ImprovedImproved
AA excellent excellent BB good good CC fair fair DD poor poor FF fail fail

CommunicationCommunication• Quarterly newslettersQuarterly newsletters• Annual report cardAnnual report card• Healthy Waterways website Healthy Waterways website • Coastal CRC websiteCoastal CRC website• Scientific papersScientific papers• Scientific reportsScientific reports• Monitoring Technique Video Monitoring Technique Video
www.botany.uq.edu.au/marbot/ (research)www.healthywaterways.qld.gov.au (management)www.coastal.crc.org.au/ehmp (monitoring)