Embed Size (px)
Citation preview

Portland State University Portland State University
PDXScholar PDXScholar
University Honors Theses University Honors College
2014
How has India's Rapidly Growing ICT Sector How has India's Rapidly Growing ICT Sector
Impacted its Rural Poor? Impacted its Rural Poor?
Jasmine Bartolome Portland State University
Follow this and additional works at: https://pdxscholar.library.pdx.edu/honorstheses
Let us know how access to this document benefits you.
Recommended Citation Recommended Citation Bartolome, Jasmine, "How has India's Rapidly Growing ICT Sector Impacted its Rural Poor?" (2014). University Honors Theses. Paper 49. https://doi.org/10.15760/honors.68
This Thesis is brought to you for free and open access. It has been accepted for inclusion in University Honors Theses by an authorized administrator of PDXScholar. Please contact us if we can make this document more accessible: [email protected].

How has India’s Rapidly Growing ICT Sector Impacted its Rural Poor?
by
Jasmine Bartolome
An undergraduate honors thesis submitted in partial fulfillment of the
requirements for the degree of
Bachelor of Science
in
University Honors
and
Economics
Thesis Adviser
John Gallup
Portland State University
2014

1
2014
How has India’s Rapidly Growing ICT Sector Impacted
its Rural Poor?
Jasmine Bartolome
Portland State University
Abstract
In this analysis I examine India’s most thriving sector, information and communication
technology (ICT). Over the past two decades, India's ICT sector has grown at a rapid rate
compared to world standards and has become their specialized area of economic interest.
Employment in this sector generally requires highly skilled, educated, English-speaking workers.
The majority of India’s population live in rural areas, with little to no access to education; thus,
they have major boundaries to participating in India’s booming growth.
I inquire into the relationship and correlation between the Indian ICT sector and the
socioeconomic livelihood of rural citizens, as measured by poverty level. Through generalization
of current literature and linear regression analysis of primary data sources from the Indian
government, I conclude that ICT has the potential to greatly benefit the rural impoverished, but it
unfortunately remains untapped. As a result, increasing ICT specialization continues to leave the
rural behind.
Key Words: India, ICT, Poverty, Specialization

2
Acknowledgements
First and foremost, I must thank Professor John Luke Gallup from Portland State University’s
economics department. Professor Gallup taught my first college economics course and intrigued
me further with the economics of developing countries. I aspire to travel the world as he does,
aiding emerging economies. He is a superb teacher and person. I am grateful for the time he
spent helping me work through my thesis.
Dr. Anne Marie Fallon and Nora Quiros have also been instrumental in my logistical and, more
importantly, mental/emotional thesis journey. I am thankful for their time, positive and
compassionate attitudes, and encouragement.
Lastly, but certainly not least, I want to extend my love and thanks to my parents, friends, and
boyfriend for listening to me complain and for helping me through my emotional and writing
struggles. Particularly my mom for spending that one late night helping me research and sort out
my overwhelmed, scattered thoughts and my Alva, for not letting me give up on myself at any
point, for any reason.

3
Table of Contents
Abstract………………………………………………………………………………………... 1
Acknowledgements…………………………………………………………………………… 2
Table of Contents………………………………………………………………....................... 3
Section 1……………………………………………………………………………………….. 4
I. Introduction 4
II. Context and Current Literature 6
Section 2…………………………………………………………………………………..…… 12
I. Background and Methodology 12
Section 3……………………………………………………………………………………….. 15
I. The Data 15
II. Statistical Analysis 20
Regression Expectations 20
Regression Results 21
Section 4……………………………………………………………………………………….. 23
I. Conclusion 23
Bibliography………………………………………………………………............................... 25

4
Section 1
I. Introduction
Over the past two decades, India's information and communication technology industry
(ICT) has been among the fastest growing in the world. From 2000 to 2004, the Indian economy
grew at a staggering rate of 6.2 per cent, and has since grown at an average annual rate of 8 per
cent (Dahlman 2007), becoming “the world’s leading exporter of software services” (Gregory,
Nollen, and Tenev 2009). Developed countries exhibit this growth but lag behind India, still a
developing country, in job creation. The
2013 Global Information Technology
Report cited 1,117,753 jobs created in South
Asia by digitization with India responsible
for the larger portion of that. However,
these substantial monetary and job growth
numbers do not necessarily correlate to
improvements in socioeconomic wellbeing
in India.
This paper attempts to answer the question, how has India’s rapidly growing ICT sector
impacted its rural poor? I hypothesize that as India increases specialization in ICT, its rural poor
are left behind on a socioeconomic level due to human capital and job opportunity limitations.
Those living in poverty and extreme poverty with little to no access to education are left behind
because India has shifted focus away from the primary sector, agriculture and manufacturing.
The implication of being left behind is these families are unemployable by the most thriving

5
sector in their country; thus, they lack income (a means to sustaining a livelihood) so their living
standards deteriorate.
The question I pose is both timely and relevant as research into the socioeconomic impact of
India’s booming growth has just began in the past few years. My analysis of primary data
sources on poverty and ICT is among the first of its kind and could provide a broader state-wise
and country-wide understanding of how ICT has impacted the rural poor. Increasing this
understanding could inform future actions in balancing economic growth and socioeconomic
impact awareness.
In their research, Eichengreen and Gupta (2011) found “the vast majority of Indian labor is
moving into the modern sector and that modern services are a viable destination only for the
highly-skilled few.” Employment in this sector typically requires a college education and English
as a second language. Those who do have access to education and have learned English are
reaping the benefits in the middle and upper classes which are concentrated in urban areas
(Upadhya 2007). Thus, there is an increasing imbalance in job opportunities and human capital
demand.
According to the 2011 Indian Census (Mehta 2013), sixty-nine percent of India’s population
lives in rural areas; meaning, the majority of India functions with substantial barriers to
education attainment and social mobility, and work in an unorganized, casual labor market which
yields very little income. The rural population is at an inherent disadvantage in India as they lack
the pre-requisites to participating in their country’s economic growth in the tertiary, modern
services sector. The rural populations are mainly capable of working in the primary and
secondary sectors, which largely consists of agriculture and manufacturing.
6
Undeveloped economies are typically driven by their primary and secondary sectors as they
gradually build up towards the tertiary, high-skill demanding sector. It seems, for the most part,
India has skipped this intermediary step of emphasis on manufacturing before modernization
resulting in a failure to give the unskilled and uneducated a chance to learn and adapt over time.
Eichengreen and Gupta (2011) confirm that “it is no longer obvious therefore that manufacturing
is the main destination… we conclude that sustaining economic growth and raising living
standards will require shifting labor into both manufacturing and services.” India’s quick shift
after the 1990 reforms into specializing in ICT has excluded the uneducated and unskilled.
Apart from Eichengreen’s proposal that India shift labor into both manufacturing and
services to sustain growth, another long-term solution would be educational intervention -
entering the poverty-stricken areas and creating infrastructure for primary and secondary schools.
In addition, more forms of employment for unskilled workers must be created. There are
programs and projects in place that are attempting to do these things, but they have yet to gain
substantial success.
The paper is organized in four sections. Following the introduction, the next subsection
provides an overview of ICT’s role in rural India through case studies in existing literature. In
Section 2, ICT and my methodologies are defined. Section 3 presents the data findings and
statistical analysis. Lastly, I conclude in Section 4.
II. Context and Current Literature
Much of the research on this subject revolves around India’s growing services sector in
fiscal terms and its proportion of the world industry. These sorts of inquiries are much more
frequent than those of the socioeconomic impacts of this growth which I’ve sought out.

7
Despite growing concern, there remains a relatively small amount of literature available
on the socioeconomic impacts of the ICT sector. It’s apparent that a main inhibitor to
socioeconomic inquiries is a significant lack of necessary and relevant data. Accurate,
representative, and all-inclusive data collection activities have only begun to kick off in recent
years. As a result, the current literature features quite narrow representations and studies of the
impacts of ICT on rural populations. Existing literature has been useful by providing specific
case studies of ICT dissemination in India. From these smaller studies, I can derive some useful,
albeit limited, conclusions. There is hope for the near future though, as collection methods in
India are increasing in quality and abundance.
To begin, India’s ICT industry is comprised of software industry and information
technology-enabled services (ITES), including the business process outsourcing (BPO) industry.
ITES/BPO involve offshoring for financial and administration processes, human resource
functions, call center and customer service activities and accounting and payroll – using “some
form of automation,” hence the IT characterization (sourcingmag.com 2014). Finding useful,
time-wise data on this industry has proven difficult for many researchers.
India’s government Ministry of Statistics and Program Implementation (MOSPI) recently
agreed to run the project on “Statistical Compilation of ICT Sector and Policy Analysis”(“ICT
Sector Statistics in India - Current Status” 2013). The MOSPI also runs the National Sample
Survey Office (NSSO) which surveys the socioeconomic status of India’s population. These are
ongoing efforts to improve data availability and integrity.
The literature I gathered is meant to inform my hypothesis, so I will restate it here: I
hypothesize that as India increases specialization in ICT, its rural poor are left behind on a
socioeconomic level due to human capital and job opportunity limitations. I will discuss the

8
ways in which the available literature informs both sides of my hypothesis. There are a number
of featured instances in which India’s growing ICT industry has benefited rural populations, but
the overarching theme seems to be that this industry is indirectly hurting this population more
than it’s helping.
In the 2005 article “ICT and Rural Societies: Opportunities for Growth,” Mathur and
Ambani provide examples of efforts to create a more inclusive ICT industry to help the rural,
unskilled population. However, these efforts are in their infancy which have yet to yield any
substantial results. The authors concede that the majority of India’s rural population has not
benefited from the growth of the ICT industry and expanding infrastructure, but emphasize the
great potential of it to help, given relevant changes in policy.
With unclear benefits to the rural population and very apparent benefits to the urban
population (some examples shown in the “ICT Sector Statistics in India - Current Status” 2013
report and Gregory Neil's book, "New Industries from New Places") we can start to assume a
growth in the income gap between these two groups. Changes in income are directly related to
changes in socioeconomic conditions. We can see these non-fiscal impacts by observing many
indicators, such as teledensity (fixed and mobile connections). In “Behind the Scenes of the
Telecommunications Miracle,” Sara Biancini (2010) finds that “the gap between urban and rural
teledensity has steadily increased: the benefits of telecommunications growth seem to be mainly
captured by wealthier and urban customers.” This is a common conclusion found throughout the
literature.
With a strong discussion on labor market impacts of ICTs, Ghose (2012) explains that
India has excluded the unskilled, labor-intensive industries while focusing on growing the skilled
labor force since the 1990s. Carl Dahlman (2007) relates to this pattern, noting how it has caused

9
a trend toward increasing the income gap between the skilled, educated workforce and the
unskilled, uneducated force. Neil Gregory’s book (2009) helps pinpoint one of the main reasons
why the skilled are benefitting so much more than the unskilled.
New Industries from New Places (Gregory, Nollen, and Tenev 2009), provides a
comprehensive description, explanation, and comparison of China and India’s software and
hardware industries. One key piece of information the authors share in this book is that China
employs more unskilled workers in its tech industry than India does. The reason is because China
focuses more heavily on hardware production (which can employ more unskilled workers for
manufacturing) while India puts more emphasis on software production (which requires more
skilled workers than unskilled). The end product of India’s industry simply demands more highly
educated human capital as a factor of production. Thus, given the abundant availability of
unskilled, uneducated workers in India, there is a large surplus who must compete in a market
with decreasing demand for such workers.
Approaching this topic from another vantage point, Carol Upadhya’s study in Banagalore
illustrates the social profile of IT workers. Upadhya’s (2007) findings were that IT workers are
largely characterized as urban, middle class, and high or middle caste. In her paper, Upadhya’s
objective was to find who is employed by this thriving industry. According to her study, “it is
primarily the middle class that possesses not only the economic means but the social and cultural
capital necessary to equip their children to enter this profession.” Software companies typically
recruit engineering graduates, thus to get the job one must have already been endowed with a
certain amount of social and financial prestige. 86 per cent of Upadhya’s study respondents came
from upper dominant caste groups. Because of evidence that urban, upper castes are typically the
10
type hired by software companies, Upadhya concludes that the IT profession has yet to benefit
the poor and people from lower castes in rural areas socially or economically.
As noted earlier, Eichengreen and Gupta (2011) also agree the ICT industry uses little
unskilled and semi-skilled labor and the economy will have to shift labor into both
manufacturing and services. Doing so would hopefully help lessen the socioeconomic gap
between the skilled and unskilled. Despite this, they advocate the ICT industry’s growth in
arguing that “the mobile phone has emerged as an important development tool.” They conclude
the spread of this device “has the potential to break the rural-urban developmental gap by
delivering information on a variety of economic and social issues.” Tiwari (2008) also
recognizes this potential claiming that ICTs provide better access for rural people to e-
commerce, e-education, and other services. However, much of this benefit is just seen as
potential.
In “ICT and Rural Societies: Opportunities for Growth”, Mathur and Ambani (2005)
present cases in which ICTs were used effectively to benefit rural societies. However, in India
specifically, they emphasizes potential future gains by ICT growth, but none currently seen.
Mathur and Ambani say the very high potential benefits will be reaped by rural India with “a
combination of regulations and government incentives and support for private initiatives.” So
rural India must overcome social and political barriers to capture the gains of its country’s ICT
industry.
There is a lot of consensus in the literature of the potential for this industry to be more
inclusive and its benefits to cross social barriers. Evidence of this potential lies in current efforts
to accomplish this difficult task. Mathur and Ambani (2005) and Tiwari (2008) discuss the
Gyandoot project which was launched on November 29th, 1999 to take ICT into rural areas of

11
India. This project has been largely successful in providing services in rural populations’ native
languages, overcoming the language barrier and aiding rural citizens in reducing transaction and
transportation costs (Tiwari, 450). Mathur and Ambani also cite technologies specifically created
for rural users at a lower cost and softwares made for use in local languages.
The efforts are apparent. Crucial next steps will be to evaluate these projects over the
upcoming years and analyzing their success in establishing a more inclusive economy. However,
we can already see these efforts will require more than just placement into rural areas. The
Gyandoot study found that villagers aren’t utilizing the kiosks for some of their most beneficial
services such as their provision of advice on agricultural practices and health issues. In addition,
many rural peoples aren’t using the kiosks at all because they prefer face-to-face consultation
and advice (Tiwari, 455). Tiwari (2008) explains that the usage rate of these kiosks are much
lower than the awareness rate; “those with higher levels of literacy and income are accessing the
Gyandoot services more than those with lower literacy and incomes” (p. 454). It seems although
the people are aware of these services, and more and more have them available, they are not
aware of the great benefit the services can provide, socially and economically. Heeks and Arun’s
study of women’s social enterprises in Kerala (2010) also found that rural inhabitants with
slightly more education and/or fiscal endowments make better use of the service opportunities
introduced to them. The underlying issue in this disuse is the villagers must first be educated
before ICT can become a successful implementation.
From the bigger picture, India’s ICT sector growth has not benefited rural India. There
are many potential benefits, but the findings are in the past two decades, the socioeconomic
growth has been exclusive to the middle and upper classes.

12
Section 2
I. Background and Methodology
As discussed earlier, the available ICT data are dramatically lacking in substance and
usefulness. Efforts to collect such specific data have only just begun. As a result, I had to be
creative in my attempts to analyze this sector’s influence on India.
I was able to find sufficient historical data on India’s national accounts, both country-wide
and on a state level. Through careful reading, I determined that ICT industry output is measured
within the category of, “Real Estate, Ownership of Dwellings, Business Services and Legal
Services” within India’s national accounts definitions found on page 56 of the “National
Accounts stats – sources and methods” (Central Statistics Office 2012). Under Computer and
Related Activities in Private Sector, subcategorized under Real Estate, Ownership of Dwellings,
Business Services and Legal Services, it is defined: “The activities covered under this
compilation category are hardware consultancy, software consultancy and supply, data
processing, database activities, maintenance and repair of office/accounting/computing
machinery and other computer related activities” (pg57 section 6.1.54). Additionally, on page
171 section 19.16, it is stated “GVA estimates for organized sector are prepared using
NASSCOM data of output of software services and GVA to output ratio obtained from the
analysis of available annual reports of software companies…” These portions of the Indian
national accounts report ICT output.
The telecommunications piece of ICT can be found within the “Communication”
subcategory of “Transport, Storage and Communication.” As defined in the national accounts on

13
page 161, section 17.30, “The activities covered under this compilation category under private
sector… covers the activities of cellular & basic telecom services…”
To measure ICT’s contribution to GDP on a country and state level, I combine the larger
category of “Real Estate, Ownership of Dwellings, Business Services and Legal Services” with
the subcategory “Communication” of the category “Transport, Storage, and Communication.”
Any measurements in my data analysis of ICT contribution to GDP and SDP (state domestic
product) output and growth rate are derived from this sum.
The remainder of my numerical resources came from the following online databases:
data.gov.in, NASSCOM, the Planning Commission of the Government of India, the Ministry of
Statistics and Programme Implementation (MOSPI), The World Bank, GapMinder.org, and other
miscellaneous sources. The statistical data I attempted to gather pertained to state-wise financial,
health, employment, technological, and educational statuses of rural households. It was simple to
find country wide statistics on these indices, but with very few time series; when, to do the
required analysis, I required state-wise multiple time-series data – a rare finding. I also sought
out data broken down by rural and urban areas in order to differentiate the impacts of ICT.
I used my text/qualitative sources mainly to provide background into this topic, India’s
ICT sector and its place in the world. This type of information was useful for providing case
study comparisons to other countries or states which have undergone a transition to ICT enabled
services and what the anecdotal outcomes were. Texts provided necessary descriptions of what
characterizes the ICT sector, thenceforth what aspects of the sector I should look further into for
numerical and statistical data.
I gathered the literature sources from several online databases, access to which is
provided by the Portland State University library (EconLit, NBER, OECD iLibrary, World

14
Databank, LexisNexis). Google Scholar was also used. I initially chose my resources by reading
their abstracts and/or introductions. I chose articles based off of their relevance to my hypothesis
(either by supporting or negating it) then extracted the main arguments, findings, conclusions,
etc. These literature sources were mainly used to inform the literature review, providing analyses
of the ICT industry in India and other countries and case studies from Indian towns and villages.
Using the statistical data I gathered, I attempt to provide objective conclusions of the
impact ICT has on the socioeconomic statuses of the rural population. I expect my quantitative
findings will tell that the largest contributor to India’s economy is its ICT sector and it is only
growing as such; meaning India is increasing specialization into this industry.

15
Section 3
I. The Data
As discussed, in order to extract ICT output data, I had to be creative in sorting out the national
accounts and concluded that ICT economic contributions can be measured through the sum of
“Real Estate, Ownership of Dwellings, Business Services and Legal Services” and the
subcategory “Communication.” Graph 1 depicts the GDP (gross domestic product) growth rates
of all India compared to that of the ICT sector alone from 1990 to 2008. Both objects’ rates
increase over time, indicating positive growth, but ICT’s growth surpasses the country’s total
average growth and is much more aggressive, illustrated by the steeper slope of the ICT industry
line. This steeper, increasing rate indicates a very robust growth, especially compared to the
country as a whole.
Graph1. Source: Author’s analysis based on data from data.gov.in
0
5
10
15
20
25
Graph1. ICT GDP Growth Rate Compared to Total Country GDP
Growth Rate
ICT Industry India GDP at factor cost Linear (ICT Industry) Linear (India GDP at factor cost)

16
-
1
2
3
4
5
6
7
Gro
ss D
om
est
ic P
rod
uct
(R
s. I
n c
rore
) x 1
00
00
0
Graph 2. Contribution of Sectors to Country GDP
agriculture,
forestry, & fishing
mining & quarrying
manufacturing
elect. Gas & water
supply
construction
trade, hotels &
restaurant
transport,storage,
& comm.
community, social
& personal servces
ICT Industry
Agriculture
ICT
As a part of all sectors of the Indian economy, Graph 2 shows ICT gaining the lead over
agriculture in about 2006, and increasing thereafter at a very steep rate, also depicted in Graph 1.
Illustrated here, the ICT sector has accumulated sectorial dominance within the economy in both
growth rate and as a part of total GDP.
Graph2. Source: Author’s analysis based on data from data.gov.in
The ICT sector clearly holds weight in monetary terms, but the question posed here is, how is it
impacting the lives of rural Indians? Particularly, the impoverished who cannot directly benefit
from this sector.
India’s 28 states differ drastically from one another – some are homes to ICT hubs,
emulating the U.S.’s Silicon Valley while others have barely been introduced to the sector. To
answer my question, I sought out time-wise, state-wise data from the early 1990s to present so I
may analyze ICT’s impact, accounting for the start of the ICT boom and the differences between
states. In my data gathering, I was able to obtain the following indices for half of India’s states:
17
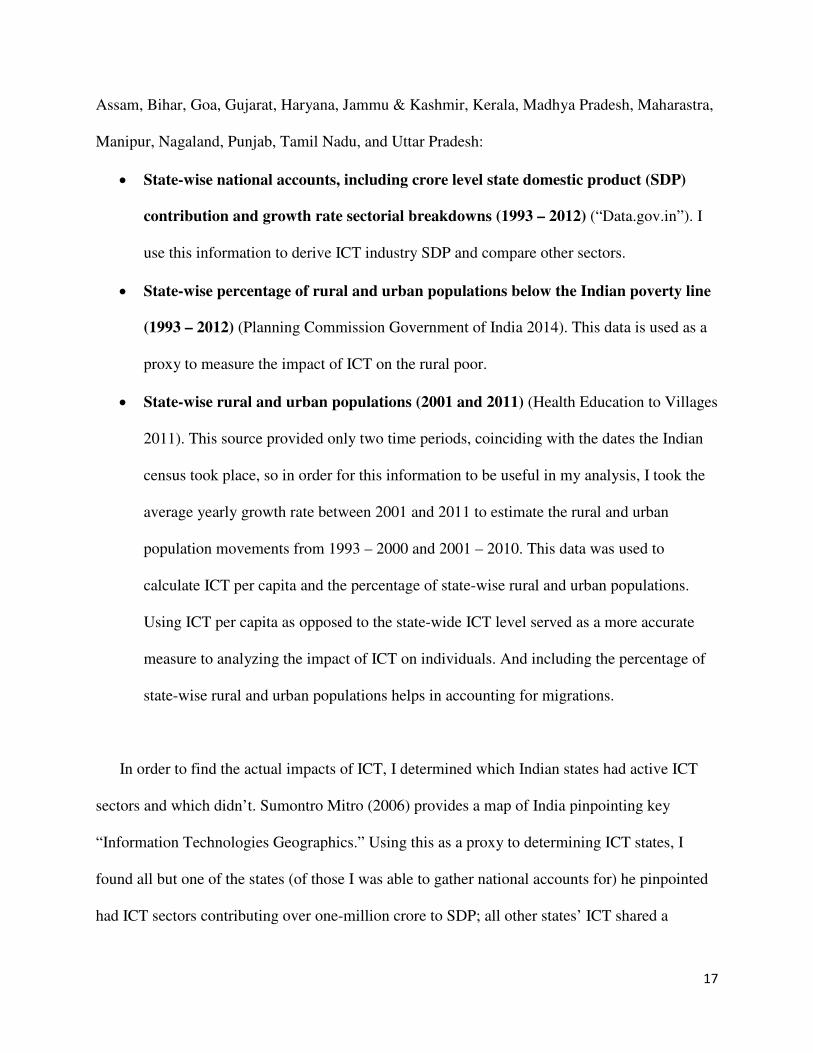
Assam, Bihar, Goa, Gujarat, Haryana, Jammu & Kashmir, Kerala, Madhya Pradesh, Maharastra,
Manipur, Nagaland, Punjab, Tamil Nadu, and Uttar Pradesh:
• State-wise national accounts, including crore level state domestic product (SDP)
contribution and growth rate sectorial breakdowns (1993 – 2012) (“Data.gov.in”). I
use this information to derive ICT industry SDP and compare other sectors.
• State-wise percentage of rural and urban populations below the Indian poverty line
(1993 – 2012) (Planning Commission Government of India 2014). This data is used as a
proxy to measure the impact of ICT on the rural poor.
• State-wise rural and urban populations (2001 and 2011) (Health Education to Villages
2011). This source provided only two time periods, coinciding with the dates the Indian
census took place, so in order for this information to be useful in my analysis, I took the
average yearly growth rate between 2001 and 2011 to estimate the rural and urban
population movements from 1993 – 2000 and 2001 – 2010. This data was used to
calculate ICT per capita and the percentage of state-wise rural and urban populations.
Using ICT per capita as opposed to the state-wide ICT level served as a more accurate
measure to analyzing the impact of ICT on individuals. And including the percentage of
state-wise rural and urban populations helps in accounting for migrations.
In order to find the actual impacts of ICT, I determined which Indian states had active ICT
sectors and which didn’t. Sumontro Mitro (2006) provides a map of India pinpointing key
“Information Technologies Geographics.” Using this as a proxy to determining ICT states, I
found all but one of the states (of those I was able to gather national accounts for) he pinpointed
had ICT sectors contributing over one-million crore to SDP; all other states’ ICT shared a

18
substantially lower portion of SDP. I categorized all states with ICT sectors adding one-million
crore or more as “ICT states;” these include Bihar, Gujarat, Haryana, Kerala, Madhya Pradesh,
Maharastra, Punjab, Tami Nadu, and Uttar Pradesh. And those with less than one-million ICT
SDP as, “non-ICT states;” these include Assam, Goa, Jammu & Kashmir, Manipur, and
Nagaland.
All of the ICT states share an obvious pattern, illustrated in Graph 3: from 1993 to 2000,
the percent rural population below the poverty line in all ICT states decreased from 1993 to
1999, increased from 2000 and peaked at 2004, then generally decreased from 2005 to 2012 with
a slight upward peak in 2009-2010. The 2004-2005 and 2009-2010 peaks in rural poverty
occurred during “the period of states reforming the delivery of public services notably the Public
Distribution System (PDS) for delivery of subsidized food grain... this period is also
characterized by very high inflation, particularly in food which coincided with the worst
droughts in India’s independent history” (Himanshu 2012). It’s important to note here that
poverty patterns (among all other indices) are influenced by many different factors. But it’s an
interesting finding that only the ICT states exhibited this very obvious ebb and flow in their rural
poverty populations.
Graph 4 depicts the percent of non-ICT states’ rural populations below the poverty line
from 1993 to 2012. None of these states share a visible pattern – this illustration differs
drastically from the uniform pattern which all of the ICT states follow. This suggests that ICT
states’ economies (thus the welfare of their people) are, by some significant measure, impacted
by their ICT sectors, but there is not enough data to prove that at this stage.

19
Graph 3. Source: Author’s analysis based on data from the Planning Commission Government of India
Graph 4. Source: Author’s analysis based on data from the Planning Commission Government of India
0.00%
10.00%
20.00%
30.00%
40.00%
50.00%
60.00%
70.00%
Graph 3. ICT States: % Rural Population Below Poverty Line
Bihar Gujarat Haryana
Kerala Madhya Pradesh Maharastra
Punjab Tami Nadu Uttar Pradesh
0.00%
5.00%
10.00%
15.00%
20.00%
25.00%
30.00%
35.00%
40.00%
45.00%
50.00%
Graph 4: Non-ICT States: % Rural Population Below Poverty Line
Assam Goa Jammu & Kashmir Manipur Nagaland
20
II. Statistical Analysis
Regression Expectations
The question at hand asks how India’s ICT sector has impacted the rural poor (measured by
poverty ratios). To answer this, a correlation between ICT and rural poverty must first be
established, to show that ICT actually impacts poverty. I attempt to do this by applying a time-
series and cross-sectional regression analysis of a few relevant and available variables: the
dependent variable, state-wise rural poverty percentages (abbreviated as RPOV); and the
independent variables, ICT SDP per capita (ICT), agriculture SDP level (AGR), manufacturing
SDP level (MAN), percent state population living in rural areas (PCRPOP), percent state
population living in urban areas (PCUPOP), and a dummy variable indicating whether or not a
state is an “ICT state” (ICTS). This analysis will be done on the 14 states for which I have
national accounts from 1993 through 2011. The time series includes the start of Indian reforms
and economic boom and gets as close to present time as I was able to gather data for.
In the regression analysis, I expect that increased agricultural and manufacturing SDP
would decrease rural poverty, given they can and do typically function within the unorganized
sector – thus, more output and jobs in these sectors would positively influence the
socioeconomic status of the rural poor. I also expect increases in ICT per capita would decrease
poverty, because this implies a greater spread/availability of ICT to all citizens (hence, per
capita), thus the socioeconomic benefits are more equally spread per person. On the other hand, I
expect that rural poverty will be higher in ICT states than in non-ICT states. This may seem
conflicting to my expectation for ICT per capita – but the difference between these two variables
is that being an ICT-state (one whose ICT SDP is greater than $1 million crore) implies greater
specialization in ICT and neglect of other sectors – sectors which the impoverished are capable

21
of participating in. The PCRPOP and PCUPOP variables are included to account for rural and
urban state migrations over time.
Variable Expected Sign Acronym Definition
Dependent n/a RPOV The percent of rural population below the poverty line
Independent (-) AGR Agriculture sector SDP level
Independent (-) MAN Manufacturing sector SDP level
Independent (-) ICT ICT SDP per capita
Independent (+) ICTS 1 = is an "ICT state"; 0 = is not an "ICT state"
As mentioned earlier, my analyses are limited due to the lack of data availability in this
subject matter; therefore I expect the general significance of the regression analysis to be low (as
measured by the adjusted R-squared statistic) because I will not be able to include many relevant
variables that impact rural poverty. Another caveat to this analysis is the 2004-2005 rural poverty
spike which was certainly unrelated to ICT. So the regression results are not biased by this, I
separated the data into two regressions, one of the pre-spike period, 1993-2003, and one post,
2004-2011.
Regression Results
As expected, the R-squared values for both regressions are not substantially significant – .3911
for the 1993-2003 regression, and .4917 for 2004-2011 – this is certainly due to the lack of
relevant variables, but it’s not cause for throwing out the data. The findings are still informative.
The regression of the pre-2004-2005 poverty spike yielded insignificant correlations between
rural poverty and independent variables, except for manufacturing. Although manufacturing
shows a very significant correlation to rural poverty, its unexpected positive sign implies that
increased MAN increases RPOV, against my expectations that it would instead decrease RPOV.

However, it is theoretically plausible that an increase in MA
additional jobs and output by MAN does not benefit the impoverished, but instead
slightly or substantially more advantaged populations.
The regression of the post-2004
MAN correlation to RPOV – the possible alternate theory can apply to this situation as well.
Other than the sign of MAN, every other variable
have the expected signs. These correlations increase confidence in my
the agricultural sector and ICT per capita decrease
RPOV.
The negative sign on the ICT per capita coefficient could also be speaking to the potential
benefits of ICT on the impoverished, as discussed in the literature. There are substantial potential
gains from the use of ICT, given
underlying issue is that impoverished villagers in rural
However, it is theoretically plausible that an increase in MAN would increase RPOV, given
additional jobs and output by MAN does not benefit the impoverished, but instead
or substantially more advantaged populations.
2004-2005 poverty spike also displays a positive, significant
the possible alternate theory can apply to this situation as well.
, every other variable shows a significant correlation to RPOV a
have the expected signs. These correlations increase confidence in my theories that increases in
the agricultural sector and ICT per capita decrease RPOV – and being an ICT state increases
The negative sign on the ICT per capita coefficient could also be speaking to the potential
benefits of ICT on the impoverished, as discussed in the literature. There are substantial potential
the population is learned and capable of using it. Again, the
underlying issue is that impoverished villagers in rural areas do not yet conceive of the
22
N would increase RPOV, given the
additional jobs and output by MAN does not benefit the impoverished, but instead benefits
2005 poverty spike also displays a positive, significant
the possible alternate theory can apply to this situation as well.
shows a significant correlation to RPOV and
theories that increases in
and being an ICT state increases
The negative sign on the ICT per capita coefficient could also be speaking to the potential
benefits of ICT on the impoverished, as discussed in the literature. There are substantial potential
the population is learned and capable of using it. Again, the
do not yet conceive of the

23
socioeconomic benefits ICT can bring them – so they must first be taught. Then, the statistical
relationships seen in the regression done here could come to greater significance and life.
Section 4
I. Conclusion
There is strong potential for ICT to advance the socioeconomic wellbeing of India’s rural poor
but this potential has yet to be tapped into, as shown in multiple case studies. The success of ICT
in rural areas will require many changes to the current landscape (e.g. increased availability of
education, training, infrastructure, and affordable ICT capital). The regression analysis shows
that ICT can help decrease rural poverty, given it is better dispersed among the populations.
However, without the dispersion, an ICT state can be harmful to its impoverished as its economy
shifts focus away from the primary sector, causing primary sector job availability and labor
demand to decrease.
ICT over the past two decades has more than likely indirectly, negatively impacted the
rural poor by slowing the growth of the primary sector through ICT specialization. However, the
pertinent question now becomes, how will ICT impact the rural poor?
If India can find effective methods to integrating ICT into rural areas, this sector could
prove tremendously beneficial to decreasing poverty. But if India continues on its current path of
slow primary sector growth and rapid modern sector growth, ICT will only worsen the
socioeconomic gap between the lower and middle-upper classes.
Either direction is plausible, but to more accurately understand the impact of ICT, more
data is needed. The conclusions I’ve made through regression analysis are correlationally

24
significant but are lacking in well-roundedness. Relevant variables were unavoidably left out due
to the young nature of this research. To better understand poverty, I would’ve liked to include
state-wise, time-series data on employment, unemployment, underemployment, wage rates,
access to education, type of job availability, and rural proximity to urban areas. To then draw
stronger relationships to ICT and fully understand the ICT landscape, I would’ve liked data on
the number of ICT companies per state, their individual outputs, concentration, dispersion,
proximity to rural areas, number of employees, the wage rates of ICT employees by state, and
more. As the Indian government continues to advance its data collection span and accuracy,
stronger conclusions can be made. Until then, researchers must make do.

25
Bibliography
Biancini, Sara. 2010. “Behind the Scenes of the Telecommunications Miracle: An Empirical
Analysis of the Indian Market”. Elsevier Ltd.
www.elsevierbusinessandmanagement.com/locate/telpol.
Central Statistics Office. 2012. “National Accounts Statistics: Sources and Methods”. Central
Statistics Office: Ministry of Statistics and Programme Implmentation Government of
India.
Dahlman, Carl. 2007. “Technology, Globalization, and International Competitiveness:
Challenges for Developing Countries.” In Industrial Development for the 21st Century:
Sustainable Development Perspectives, 29–75. United Nations Sustainable Development
Knowledge Platform. sustainabledevelopment.un.org/content/documents/full_report.pdf.
“Data.gov.in.” http://data.gov.in/catalogs.
Eichengreen, Barry, and Poonam Gupta. 2011. “The Service Sector as India’s Road to Economic
Growth”. NBER Working Paper Series. http://www.nber.org/papers/w16757.
Ghose, Ajit K. 2012. “Employment: The Fault Line in India’s Emerging Economy.”
Comparative Economic Studies 54 (4): 765–86.
Gregory, Neil, Stanley Nollen, and Stoyan Tenev. 2009. New Industries from New Places: The
Emergence of the Software and Hardware Industries in China and India. Washington,
DC: Stanford University Press and The World Bank.
Health Education to Villages. 2011. “World - India and States / Union Territories - Rural - Urban
- Urban Distribution of Population.” Hetv.org, August. http://hetv.org/india/india-
population-2012.htm.

26
Heeks, Richard, and Shoba Arun. 2010. “Social Outsourcing as a Development Tool: The Impact
of Outsourcing IT Services to Women’s Social Enterprises in Kerala.” Journal of
International Development 22 (4): 441–54.
Himanshu. 2012. “Walking the Poverty Line.” Ideas For India, July.
http://www.ideasforindia.in/article.aspx?article_id=7.
“ICT Sector Statistics in India - Current Status.” 2013. United Nations Statistics Division.
Accessed November 20. http://unstats.un.org/unsd/economic_stat/ICT-
Korea/Documents/Godavarkar_India.pdf.
Mathur, Akshay, and Dhirubhai Ambani. 2005. “ICT and Rural Societies: Opportunities for
Growth.” The International Information & Library Review 37: 345–51.
Mehta, Belwant Singh. 2013. “Capabilities, Costs, Networks and Innovations: Impact of Mobile
Phones in Rural India”. Institute for Human Development.
Mitro, Sumontro. 2006. “The ICT Landscape in India.”
http://www1.american.edu/initeb/sm1238a/india.shtml.
Planning Commission Government of India. 2014. “Percentage of Population Below Poverty
Line by States & UTs�: 1973-74 to 2004-05 [Combined (Rural + Urban)].” Planning
Commission Government of India, March, 98.
Schwab, Klaus, Borge Brende, and Robert Greenhill. 2013. “Global Information Technology
Report 2013”. Geneva: World Economic Forum.
www3.weforum.org/docs/WEF_GITR_Report_2013.pdf.
sourcingmag.com. 2014. “BPO - What Is Business Process Outsourcing?” Sourcingmag.com.
Accessed March 5. http://www.sourcingmag.com/content/what_is_bpo.asp.

27
Tiwari, Meera. 2008. “ICTs and Poverty Reduction: User Perspective Study of Rural Madhya
Pardesh, India.” The European Journal of Development Research 20 (3): 448–61.
Upadhya, Carol. 2007. “Employment, Exclusion and ‘Merit’ in the Indian IT Industry.”
Economic and Political Weekly 42 (20): 1863–68.