Embed Size (px)
Citation preview
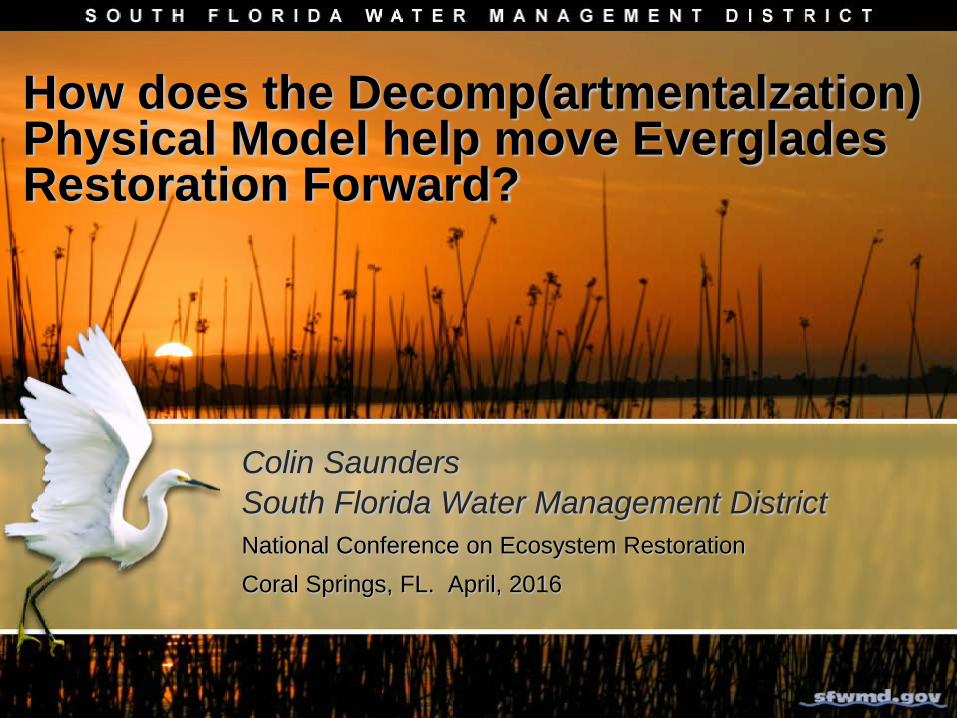
How does the Decomp(artmentalzation) Physical Model help move Everglades Restoration Forward?
Colin SaundersSouth Florida Water Management DistrictNational Conference on Ecosystem RestorationCoral Springs, FL. April, 2016
C. CoronadoS. NewmanF. SklarE. Tate-Boldt
J. HarveyJ. ChoiB. RosenJ. Lewis
D. HoD. Hickman
L. Larsen
Co-authors
C. ZweigE. ClineC. HansenF. Santarmaria
P. RegierR. Jaffe
D. He
F. SklarC. SaundersS. NewmanC. CoronadoC. ZweigS. Hagerthey
J. HarveyB. RosenM. DickmanJ. ChoiJ. Lewis
S. BaisdenS. WilcoxN. GarrattD. CrawfordT. KinseyD. George
J. TrexlerM. Bush
S. BornhoeftM. Ross
P. Ruiz
D. HoD. Hickman
L. LarsenD. Watts
DPM Science Team
A. SwartzJ. GomezK. SkalakL. Soderqvist
E. Tate-BoldtM. MannaE. ClineC. HansenM. BlahaF. Santarmaria
R. JaffeD. He
P. RegierB. JaraJ. Sah
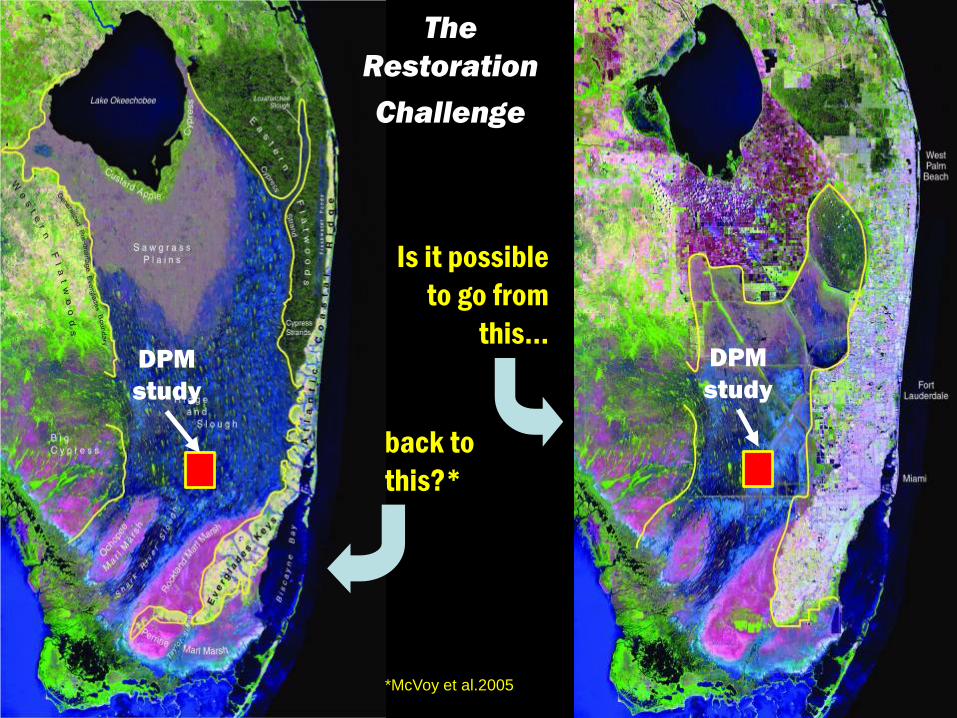
back to this?*
Is it possible to go from
this…
The RestorationChallenge
*McVoy et al.2005
DPM study
DPM study
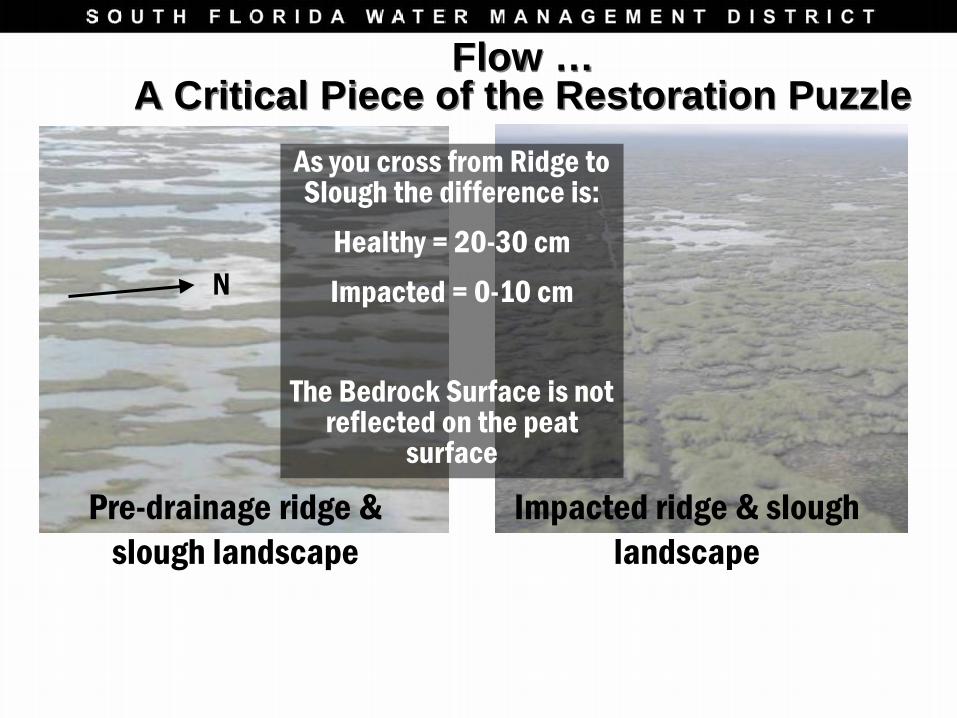
Impacted ridge & slough landscape
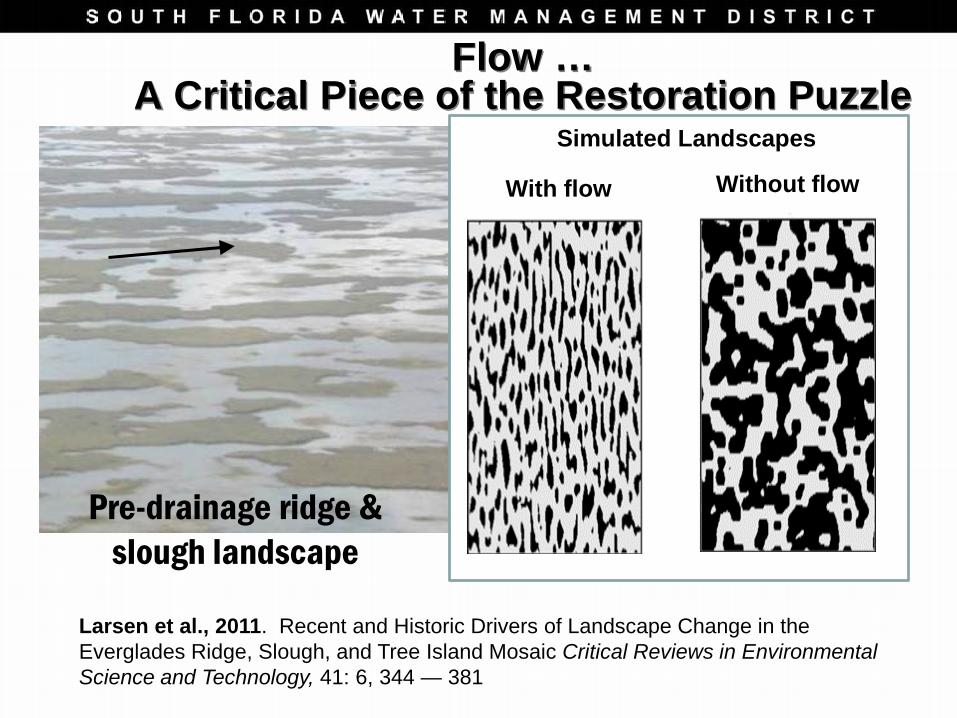
Pre-drainage ridge & slough landscape
Flow …A Critical Piece of the Restoration Puzzle
As you cross from Ridge to Slough the difference is:
Healthy = 20-30 cmImpacted = 0-10 cm
The Bedrock Surface is not reflected on the peat
surface
N
Impacted ridge & slough landscape
Pre-drainage ridge & slough landscape
S
Simulated Landscapes
With flow Without flow
Larsen et al., 2011. Recent and Historic Drivers of Landscape Change in the Everglades Ridge, Slough, and Tree Island Mosaic Critical Reviews in Environmental Science and Technology, 41: 6, 344 — 381
Flow …A Critical Piece of the Restoration Puzzle
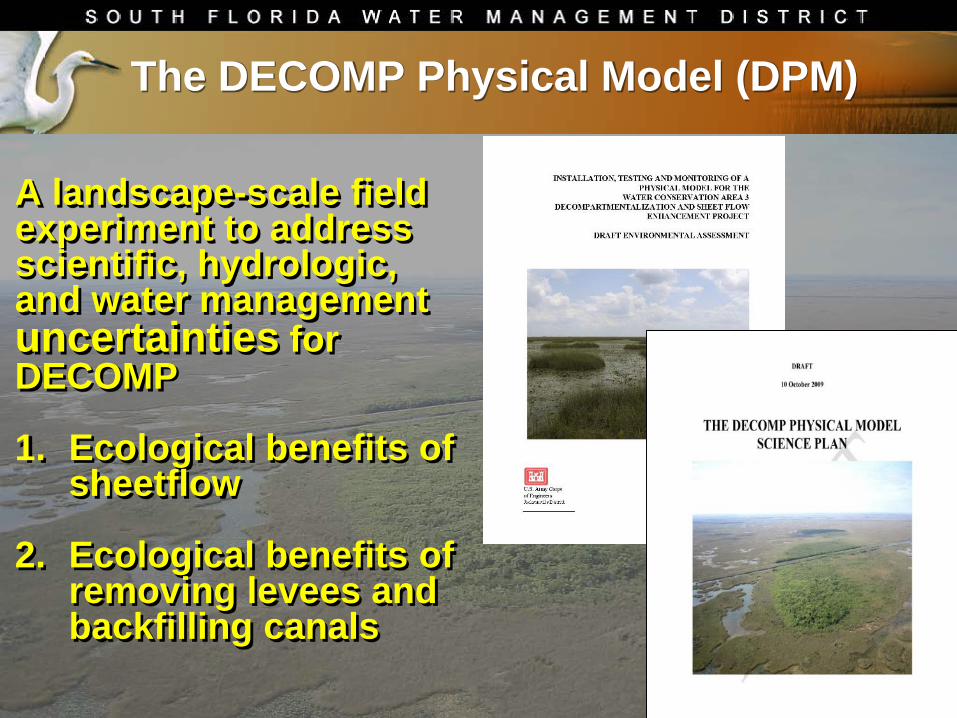
The DECOMP Physical Model (DPM)
A landscape-scale field experiment to address scientific, hydrologic, and water management uncertainties for DECOMP
1. Ecological benefits of sheetflow
2. Ecological benefits of removing levees and backfilling canals
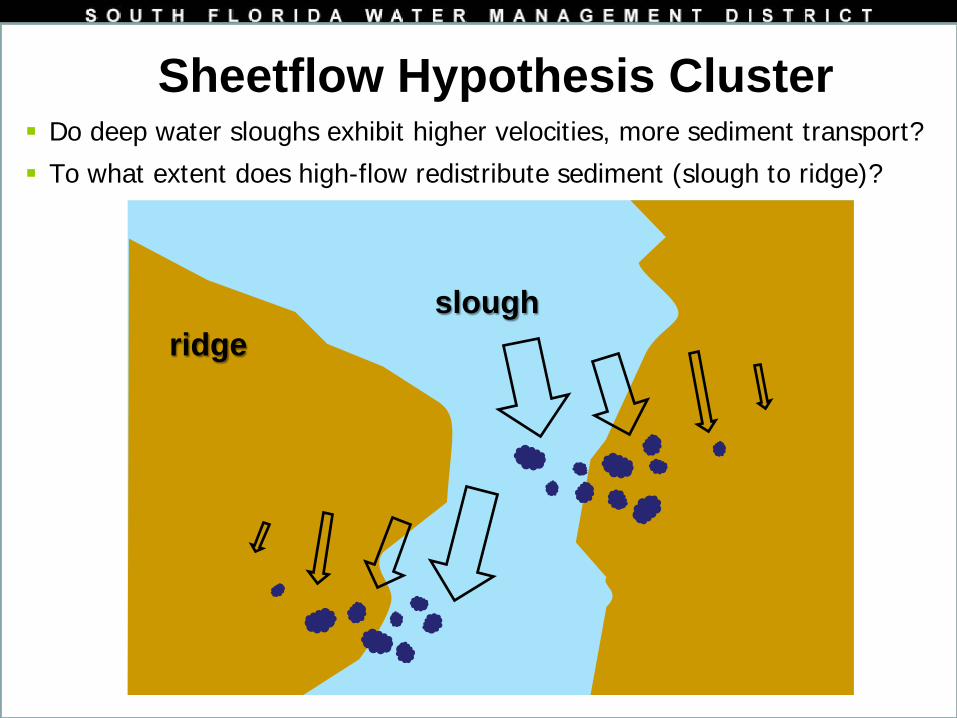
Sheetflow Hypothesis Cluster
sloughridge
Do deep water sloughs exhibit higher velocities, more sediment transport?
To what extent does high-flow redistribute sediment (slough to ridge)?
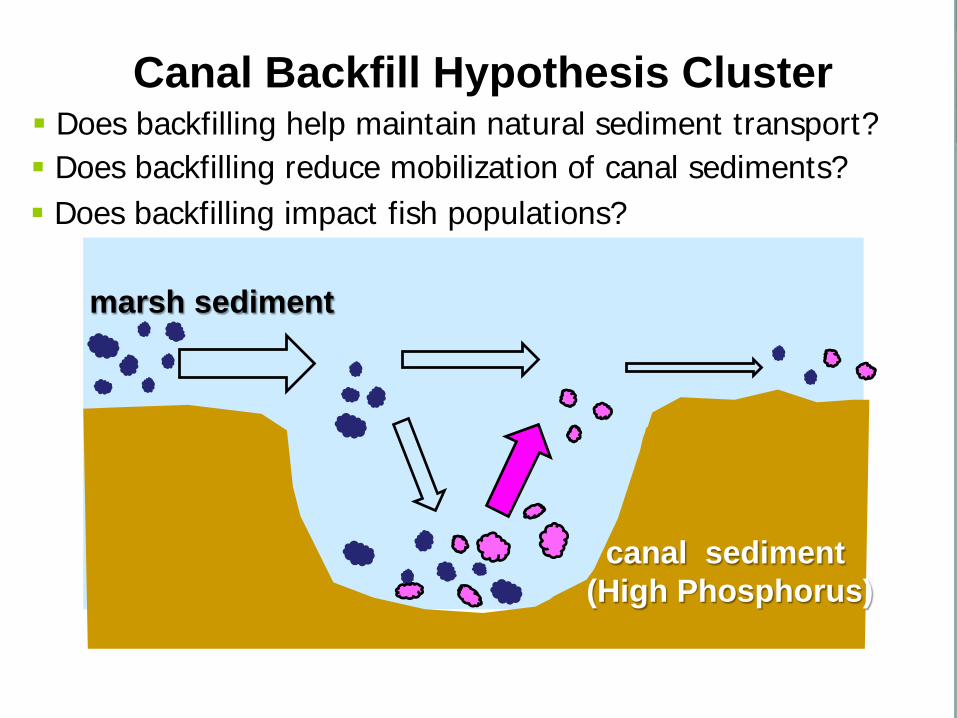
Canal Backfill Hypothesis Cluster
marsh sediment
canal sediment(High Phosphorus)
Does backfilling help maintain natural sediment transport? Does backfilling reduce mobilization of canal sediments? Does backfilling impact fish populations?
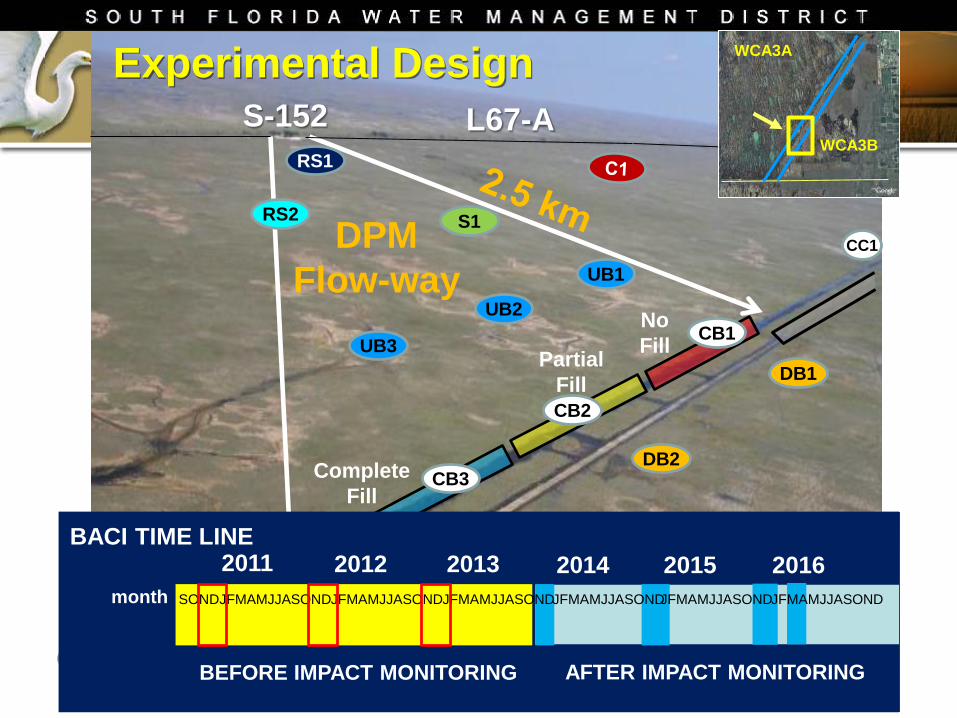
DPMFlow-way
Complete Fill
Partial Fill
No Fill
Experimental DesignL67-AS-152
CB1
CB2
CB3
CC2
CC1
RS1
RS2 S1
UB3
UB1
UB2
DB3
DB2
DB1
WCA3A
WCA3B
BACI TIME LINE
month2014201320122011 20162015
JFMAMJJASONDJFMAMJJASONDJFMAMJJASONDJFMAMJJASONDJFMAMJJASONDSONDJFMAMJJASOND
AFTER IMPACT MONITORINGBEFORE IMPACT MONITORING
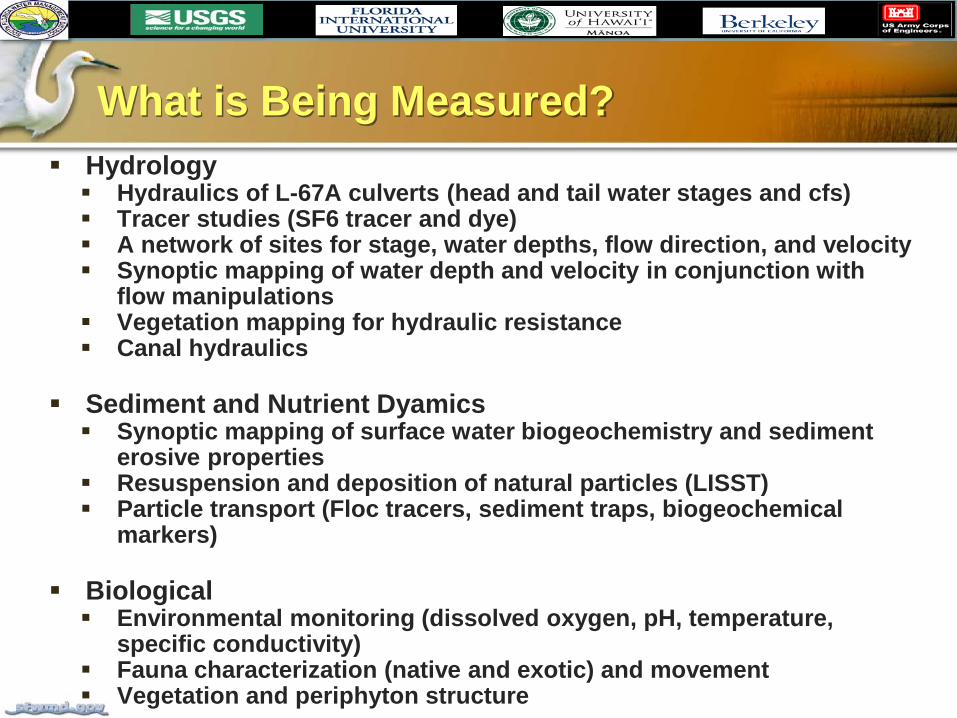
What is Being Measured? Hydrology Hydraulics of L-67A culverts (head and tail water stages and cfs) Tracer studies (SF6 tracer and dye) A network of sites for stage, water depths, flow direction, and velocity Synoptic mapping of water depth and velocity in conjunction with
flow manipulations Vegetation mapping for hydraulic resistance Canal hydraulics
Sediment and Nutrient Dyamics Synoptic mapping of surface water biogeochemistry and sediment
erosive properties Resuspension and deposition of natural particles (LISST) Particle transport (Floc tracers, sediment traps, biogeochemical
markers)
Biological Environmental monitoring (dissolved oxygen, pH, temperature,
specific conductivity) Fauna characterization (native and exotic) and movement Vegetation and periphyton structure
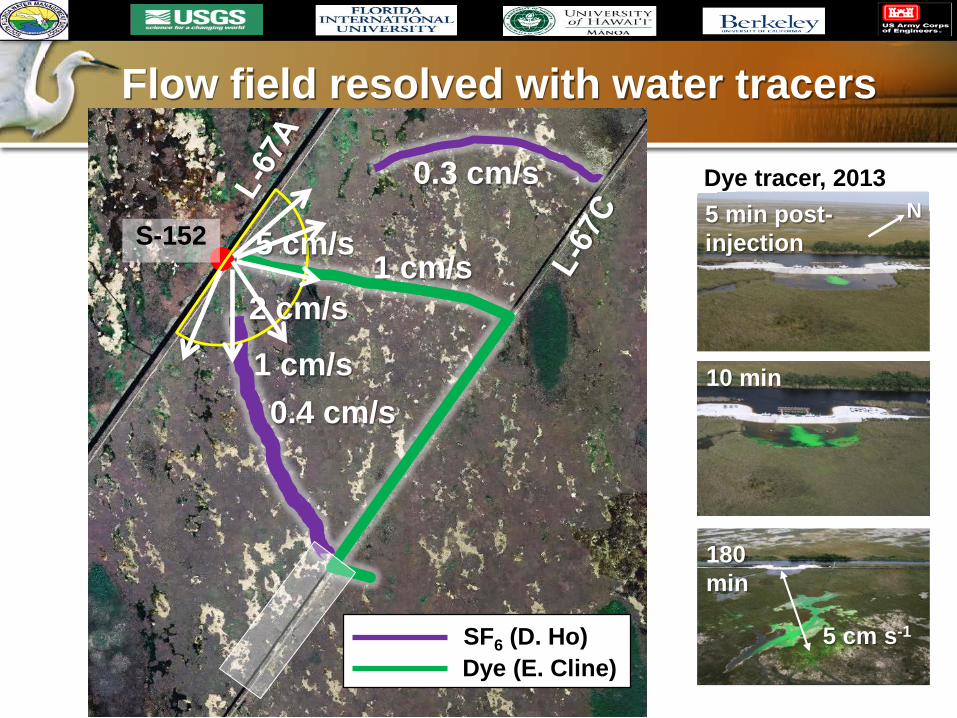
Flow field resolved with water tracers
180 min
5 min post-injection
N
10 min
Dye tracer, 2013
5 cm s-1
Dye (E. Cline)SF6 (D. Ho)
S-152
0.4 cm/s
0.3 cm/s
1 cm/s2 cm/s
5 cm/s
1 cm/s
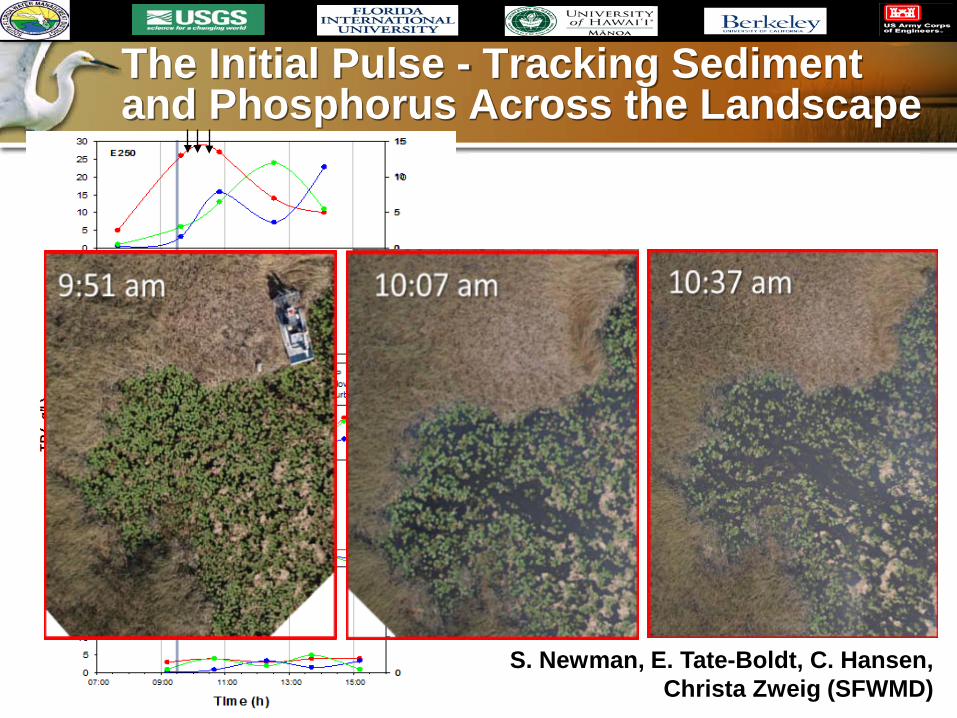
The Initial Pulse - Tracking Sediment and Phosphorus Across the Landscape
N
S. Newman, E. Tate-Boldt, C. Hansen, Christa Zweig (SFWMD)
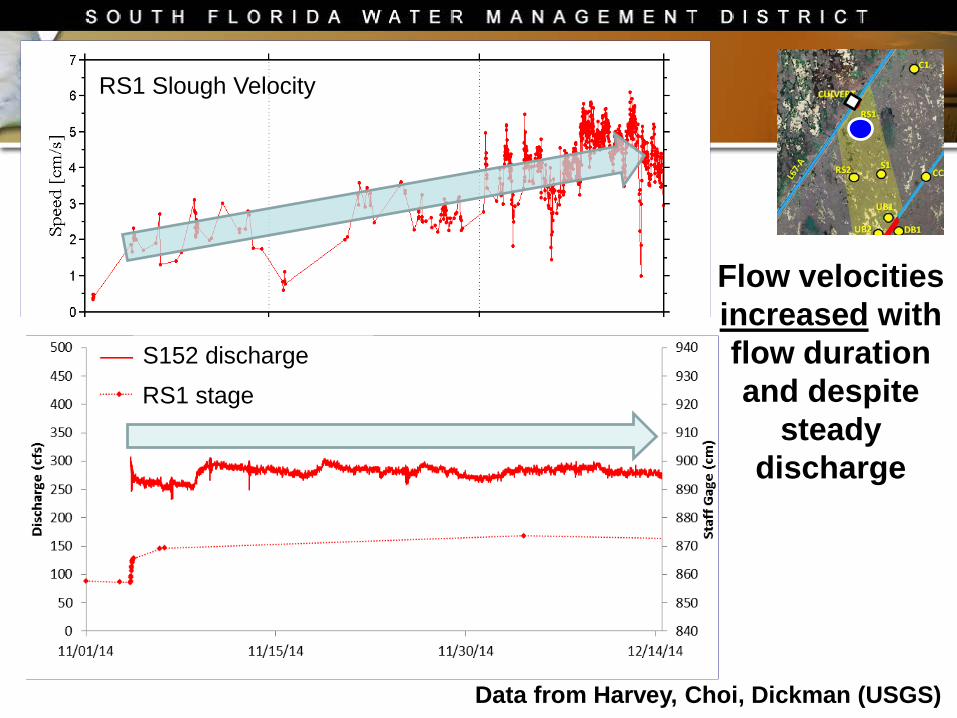
Data from Harvey, Choi, Dickman (USGS)
Flow velocities increased with flow duration and despite
steady discharge
RS1 Slough Velocity
S152 discharge
RS1 stage
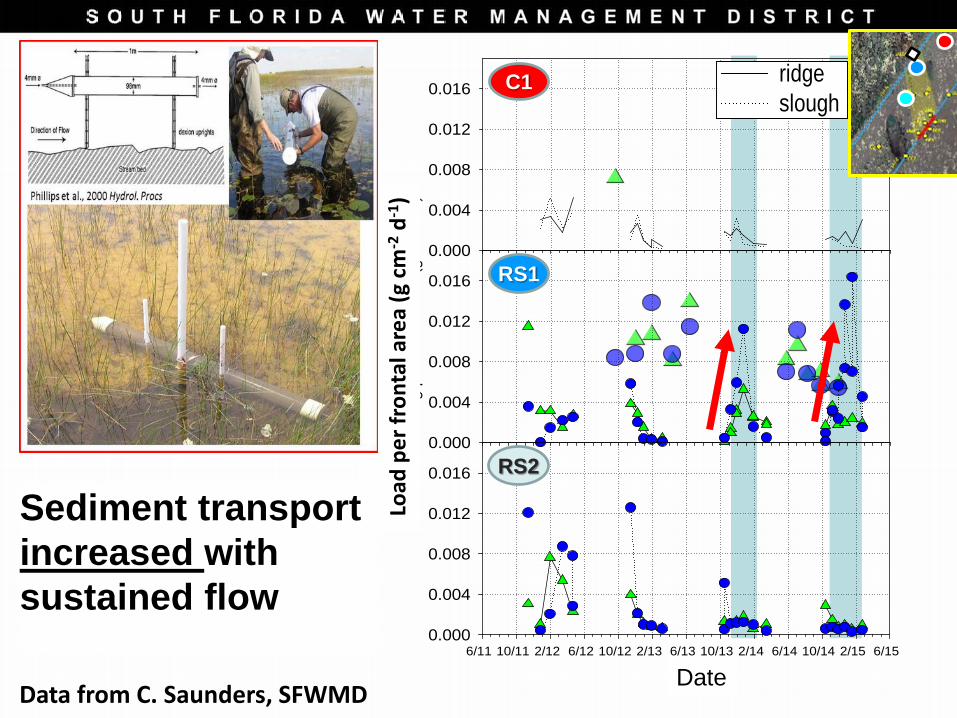
Data from C. Saunders, SFWMD
C1
0.000
0.004
0.008
0.012
0.016 ridgeslough
RS1
mas
s lo
adin
g pe
r fro
ntal
are
a (g
cm
-2 d
-1)
0.000
0.004
0.008
0.012
0.016
RS2
Date6/11 10/11 2/12 6/12 10/12 2/13 6/13 10/13 2/14 6/14 10/14 2/15 6/15
0.000
0.004
0.008
0.012
0.016
C1
RS1
RS2
ridgeslough
Load
per
fron
tal a
rea
(g c
m-2
d-1)
Date
Sediment transport increased with sustained flow
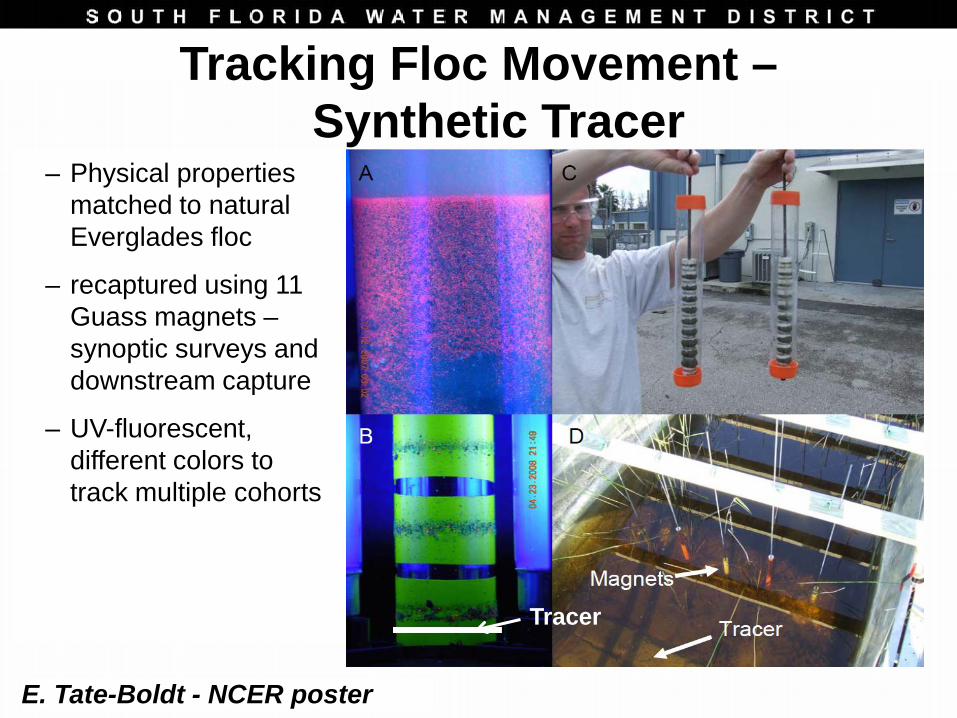
– Physical properties matched to natural Everglades floc
– recaptured using 11 Guass magnets –synoptic surveys and downstream capture
– UV-fluorescent, different colors to track multiple cohorts
Tracer
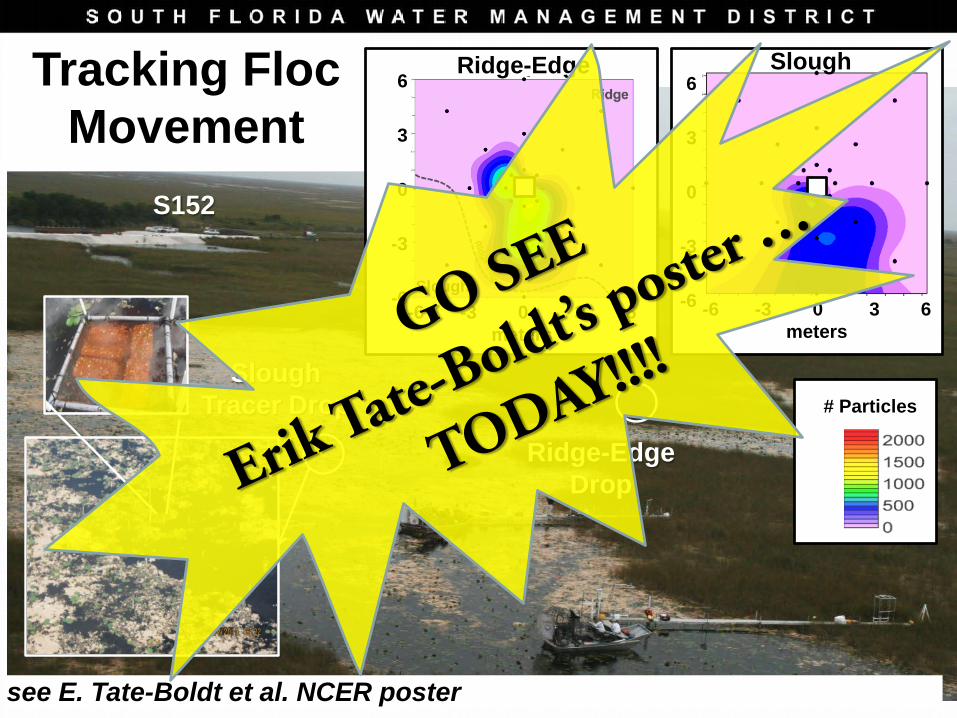
Tracking Floc Movement –Synthetic Tracer
E. Tate-Boldt - NCER poster
S152
Slough Tracer Drop
Tracking Floc Movement
see E. Tate-Boldt et al. NCER poster
Slough
-6 -3 0 3 6meters
6
3
0
-3
-6
# Particles
Ridge-Edge
Slough-6 -3 0 3 6
meters
6
3
0
-3
-6
Ridge-Edge Drop
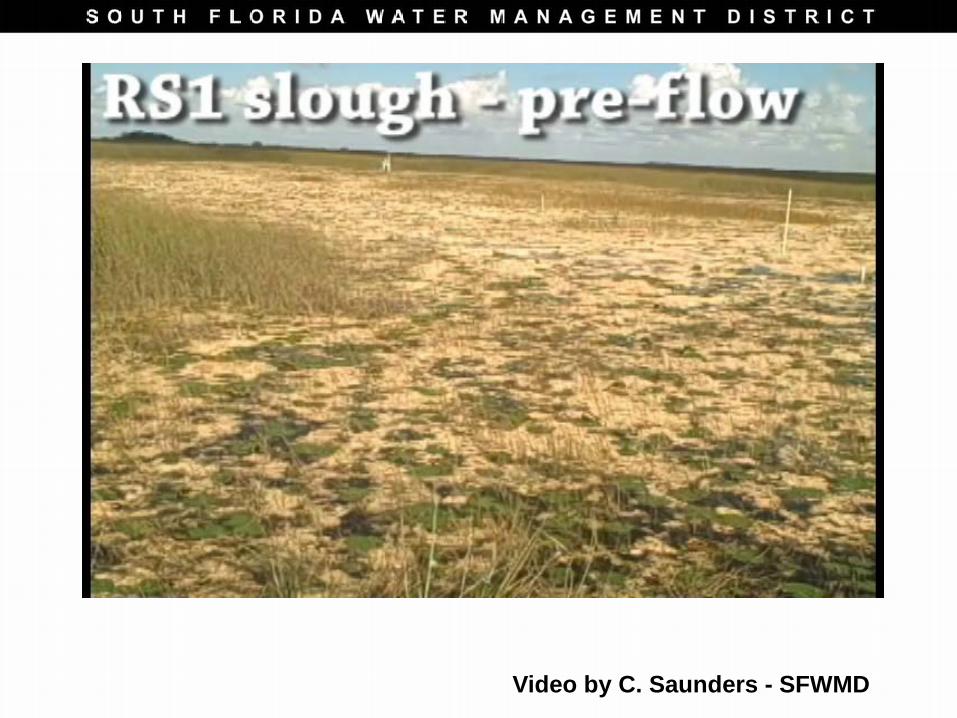
Video by C. Saunders - SFWMD
Distance East (m)0 5 10 15 20
Floc
Hei
ght (
cm)
0
5
10
15
20
25
30
35
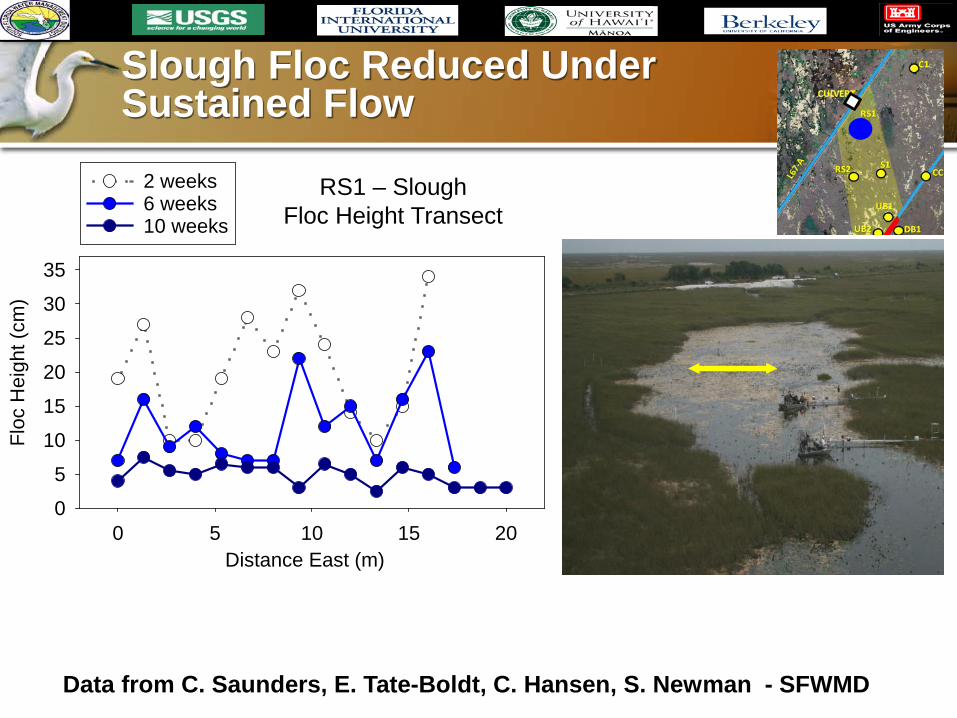
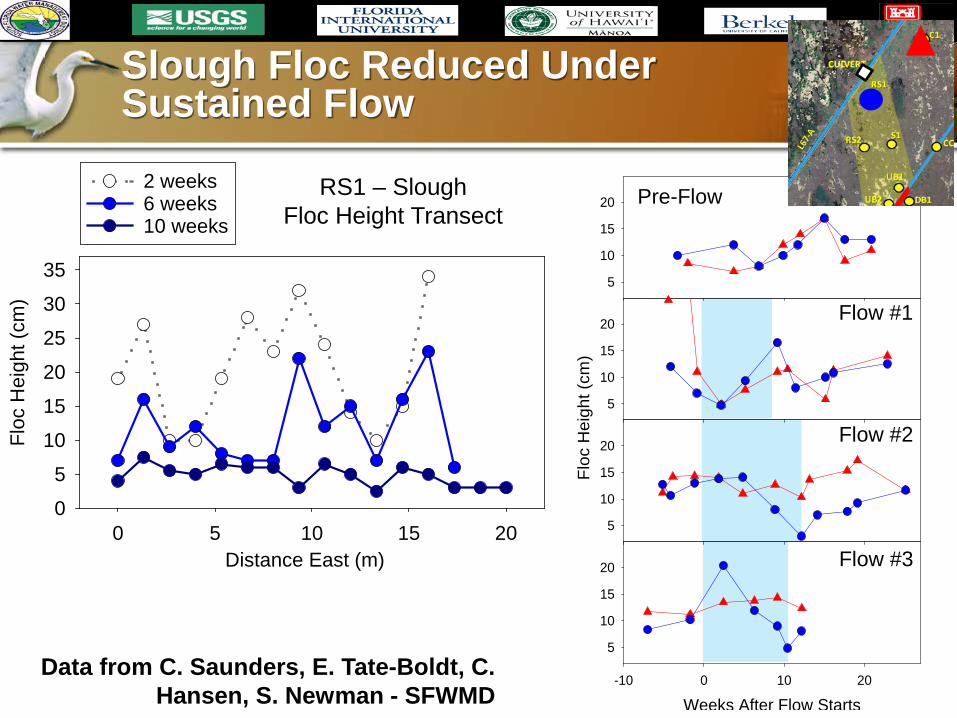
2 weeks6 weeks10 weeks
RS1 – SloughFloc Height Transect
Slough Floc Reduced Under Sustained Flow
Data from C. Saunders, E. Tate-Boldt, C. Hansen, S. Newman - SFWMD
Distance East (m)0 5 10 15 20
Floc
Hei
ght (
cm)
0
5
10
15
20
25
30
35
2 weeks6 weeks10 weeks
Slough Floc Reduced Under Sustained Flow
5
10
15
20
5
10
15
20
Floc
Hei
ght (
cm)
5
10
15
20
Weeks After Flow Starts-10 0 10 20
5
10
15
20
Pre-Flow
Flow #1
Flow #2
Flow #3
RS1 – SloughFloc Height Transect
Data from C. Saunders, E. Tate-Boldt, C. Hansen, S. Newman - SFWMD
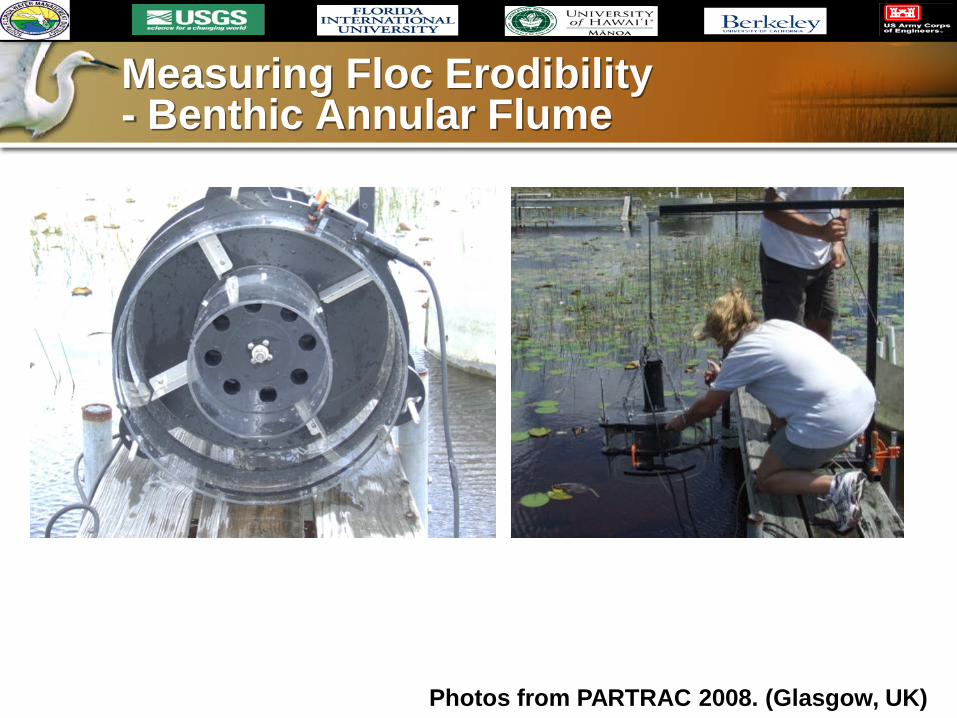
Measuring Floc Erodibility - Benthic Annular Flume
Photos from PARTRAC 2008. (Glasgow, UK)
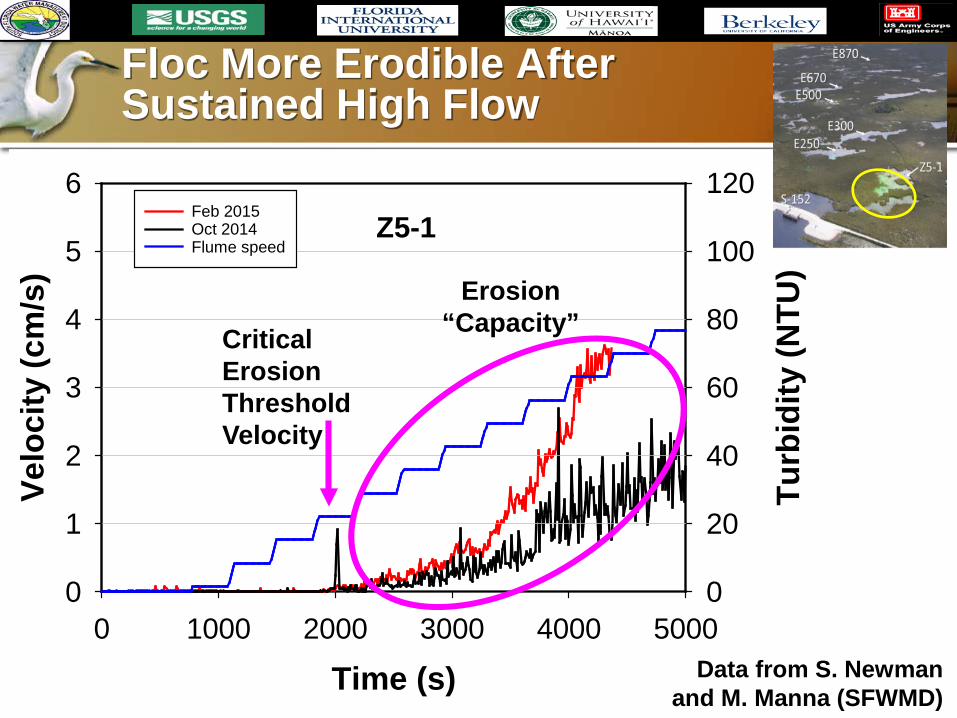
Floc More Erodible After Sustained High Flow
Z5-1
Time (s)0 1000 2000 3000 4000 5000
Turb
idity
(NTU
)
0
20
40
60
80
100
120
Velo
city
(cm
/s)
0
1
2
3
4
5
6Feb 2015Oct 2014 Flume speed
CriticalErosionThresholdVelocity
Erosion“Capacity”
Data from S. Newman and M. Manna (SFWMD)
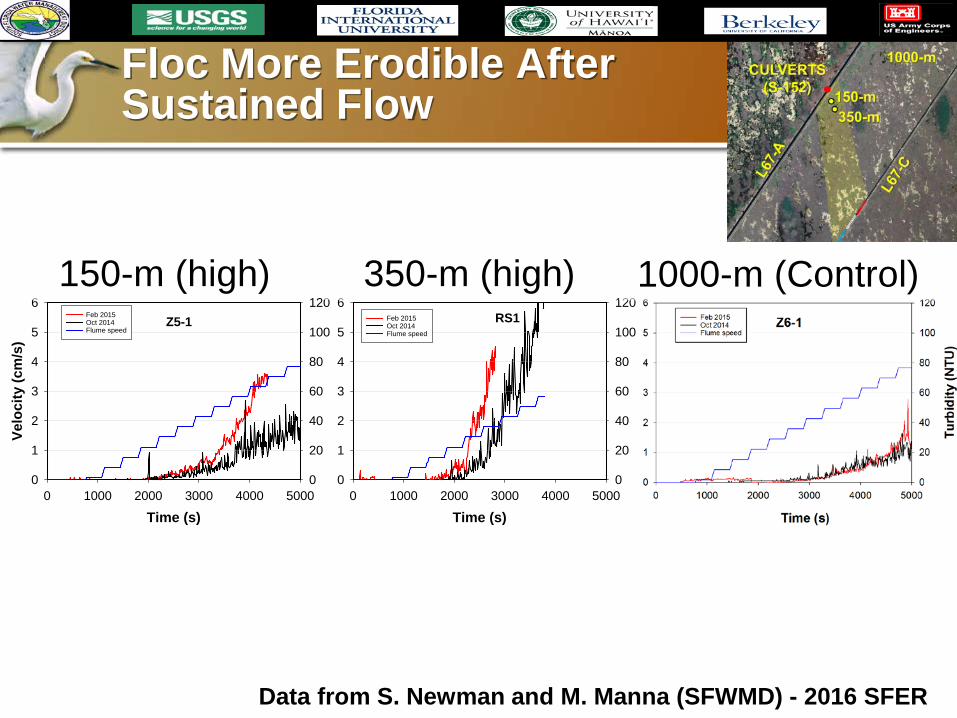
Floc More Erodible After Sustained Flow
Z5-1
Time (s)0 1000 2000 3000 4000 5000
0
20
40
60
80
100
120
Velo
city
(cm
/s)
0
1
2
3
4
5
6Feb 2015Oct 2014 Flume speed
150-m (high)RS1
Time (s)0 1000 2000 3000 4000 5000
0
20
40
60
80
100
120
0
1
2
3
4
5
6Feb 2015Oct 2014Flume speed
350-m (high) 1000-m (Control)
Data from S. Newman and M. Manna (SFWMD) - 2016 SFER
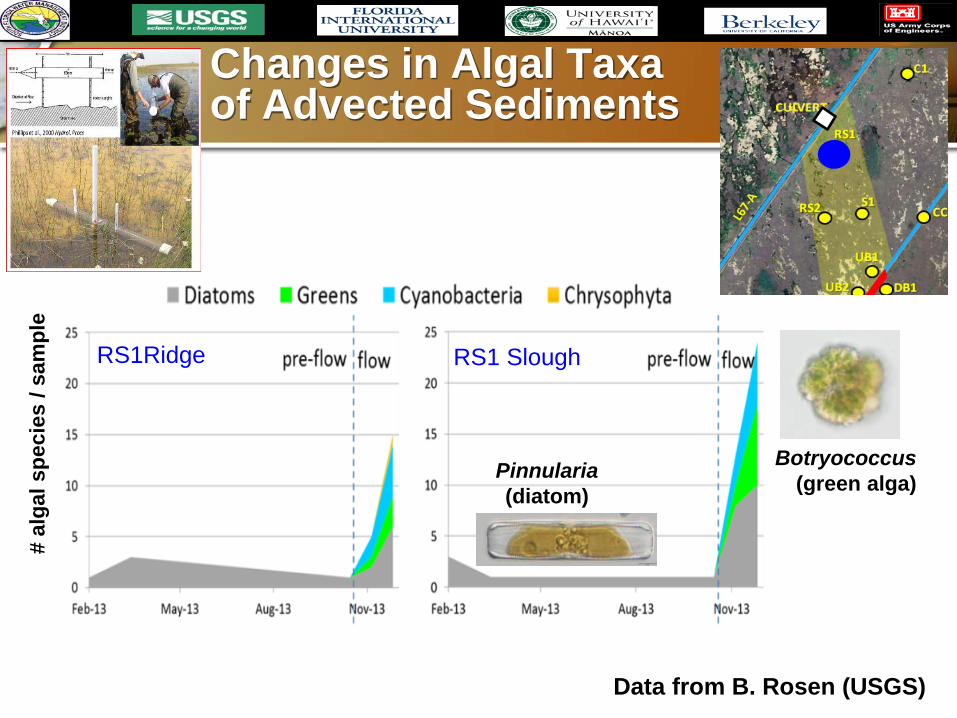
Changes in Algal Taxa of Advected Sediments
Pinnularia(diatom)
Botryococcus(green alga)
Data from B. Rosen (USGS)
RS1Ridge RS1 Slough
# al
gal s
peci
es /
sam
ple
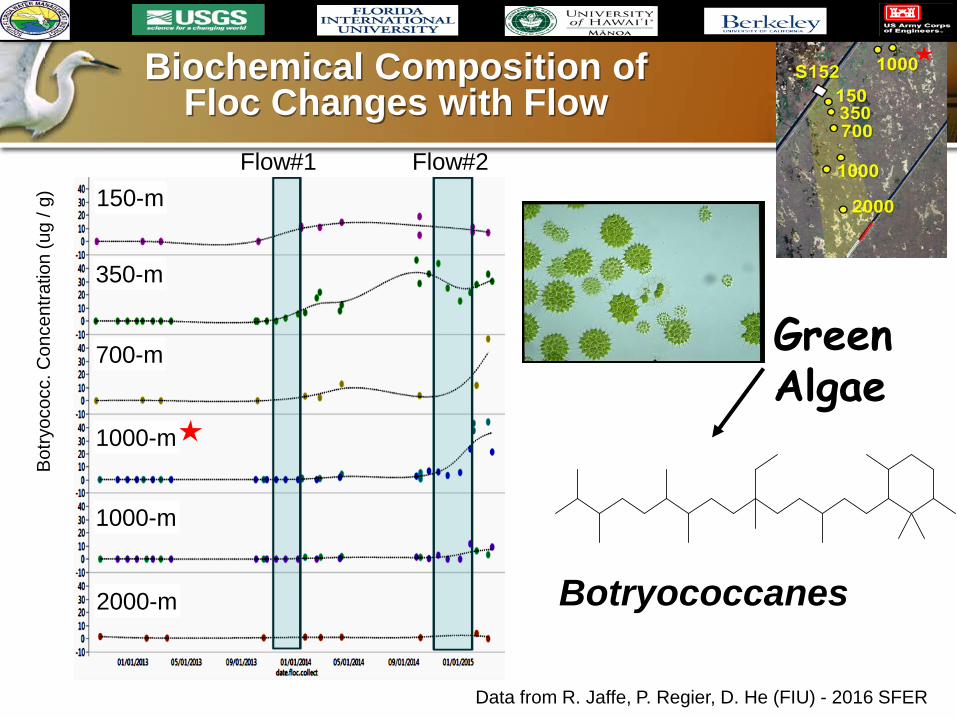
Biochemical Composition of Floc Changes with Flow
Data from R. Jaffe, P. Regier, D. He (FIU) - 2016 SFER
Bot
ryoc
occ.
Con
cent
ratio
n (u
g/ g
) 150-m
350-m
700-m
1000-m
1000-m
2000-m
Green Algae
Botryococcanes
Flow#1 Flow#2
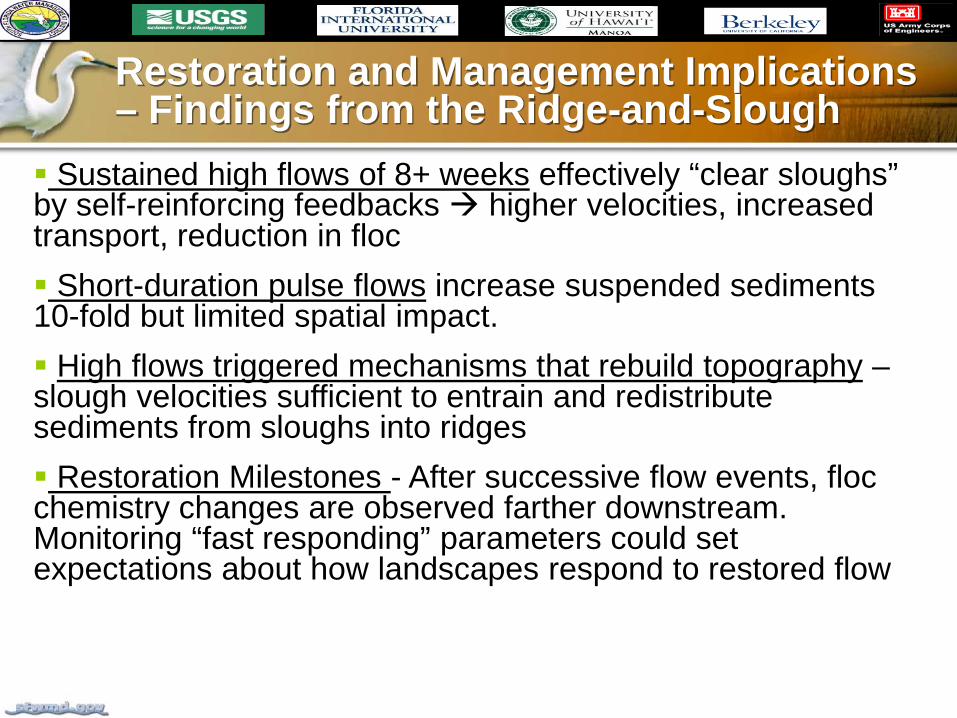
Restoration and Management Implications – Findings from the Ridge-and-Slough
Sustained high flows of 8+ weeks effectively “clear sloughs” by self-reinforcing feedbacks higher velocities, increased transport, reduction in floc Short-duration pulse flows increase suspended sediments 10-fold but limited spatial impact. High flows triggered mechanisms that rebuild topography –slough velocities sufficient to entrain and redistribute sediments from sloughs into ridges Restoration Milestones - After successive flow events, floc chemistry changes are observed farther downstream. Monitoring “fast responding” parameters could set expectations about how landscapes respond to restored flow
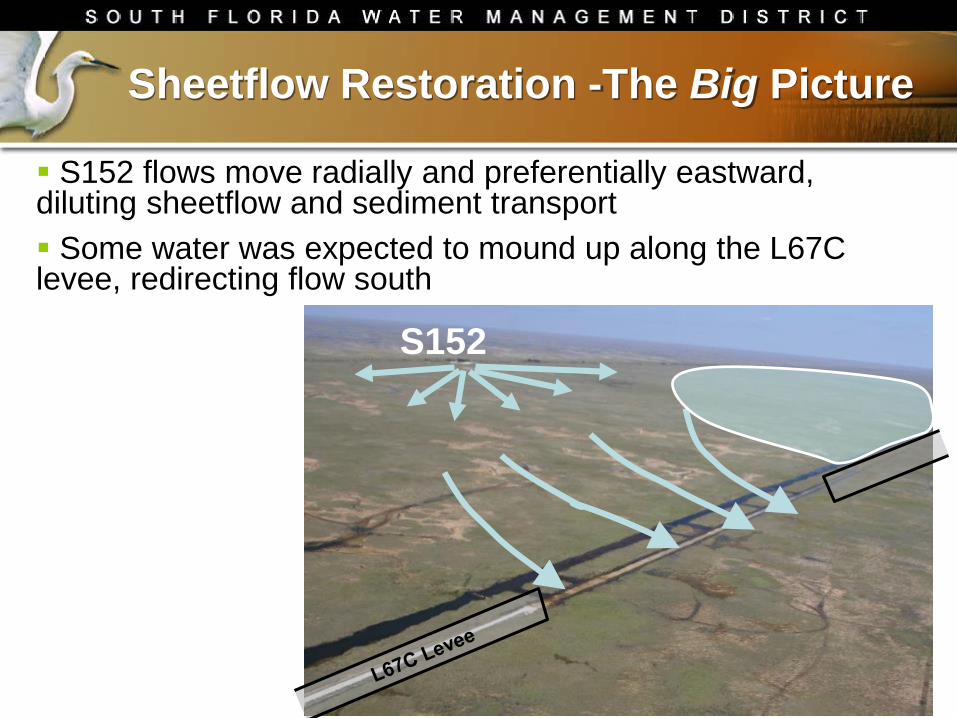
Sheetflow Restoration -The Big Picture
S152
S152 flows move radially and preferentially eastward, diluting sheetflow and sediment transport Some water was expected to mound up along the L67C levee, redirecting flow south
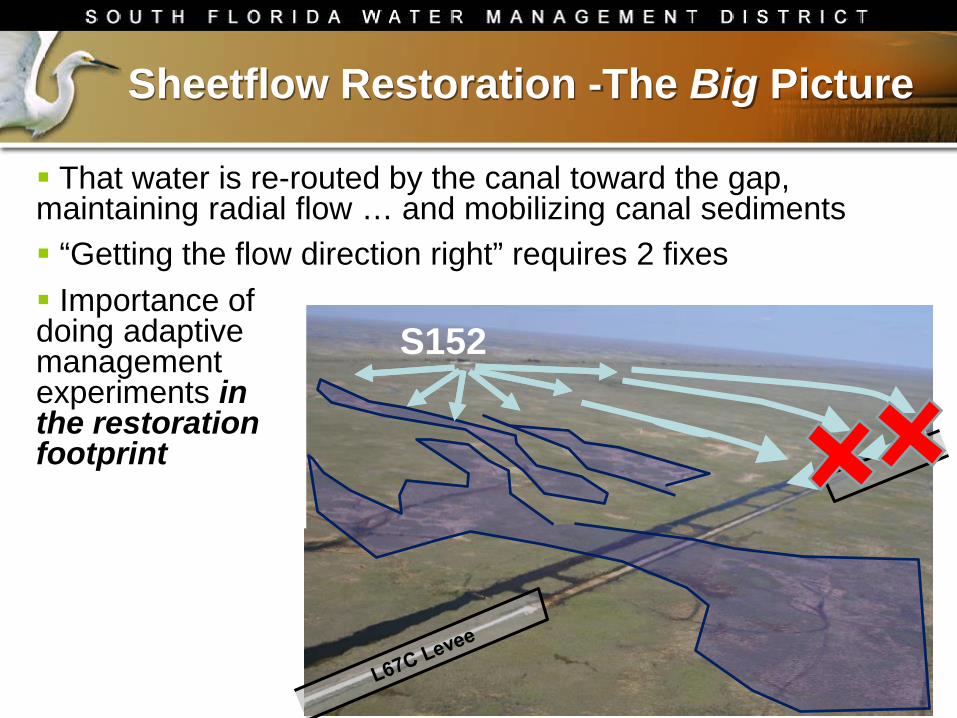
Sheetflow Restoration -The Big Picture
S152
That water is re-routed by the canal toward the gap, maintaining radial flow … and mobilizing canal sediments “Getting the flow direction right” requires 2 fixes Importance of doing adaptive management experiments in the restoration footprint

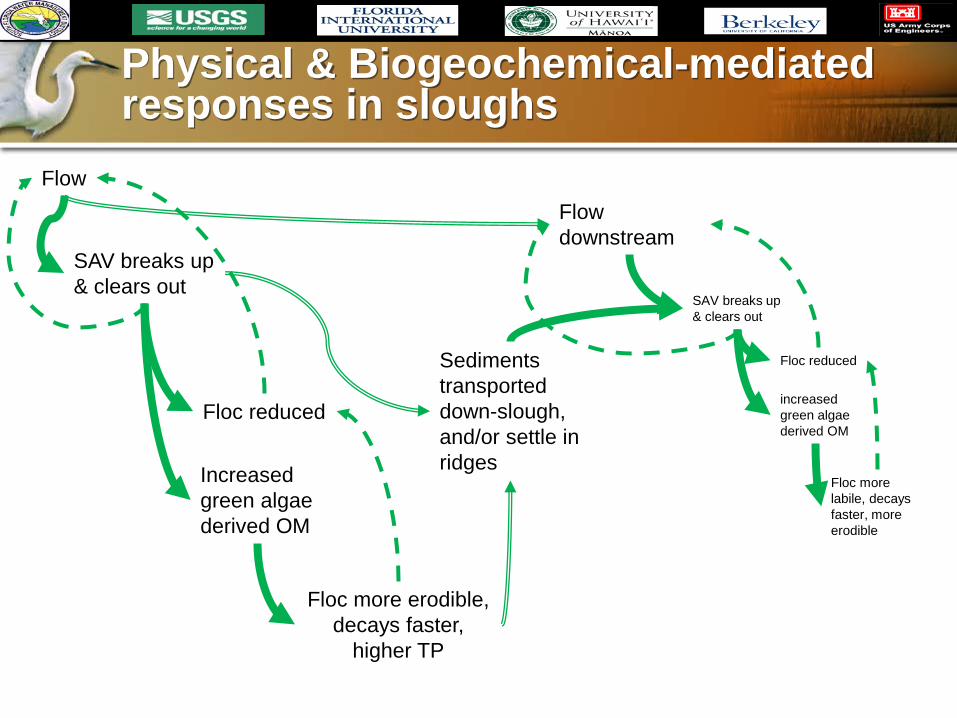
Physical & Biogeochemical-mediated responses in sloughs
Flow
SAV breaks up& clears out
Floc reduced
Increasedgreen algaederived OM
Floc more erodible, decays faster,
higher TP
Sediments transported down-slough, and/or settle in ridges
Flow downstream
SAV breaks up& clears out
Floc reduced
increasedgreen algaederived OM
Floc more labile, decays faster, more erodible
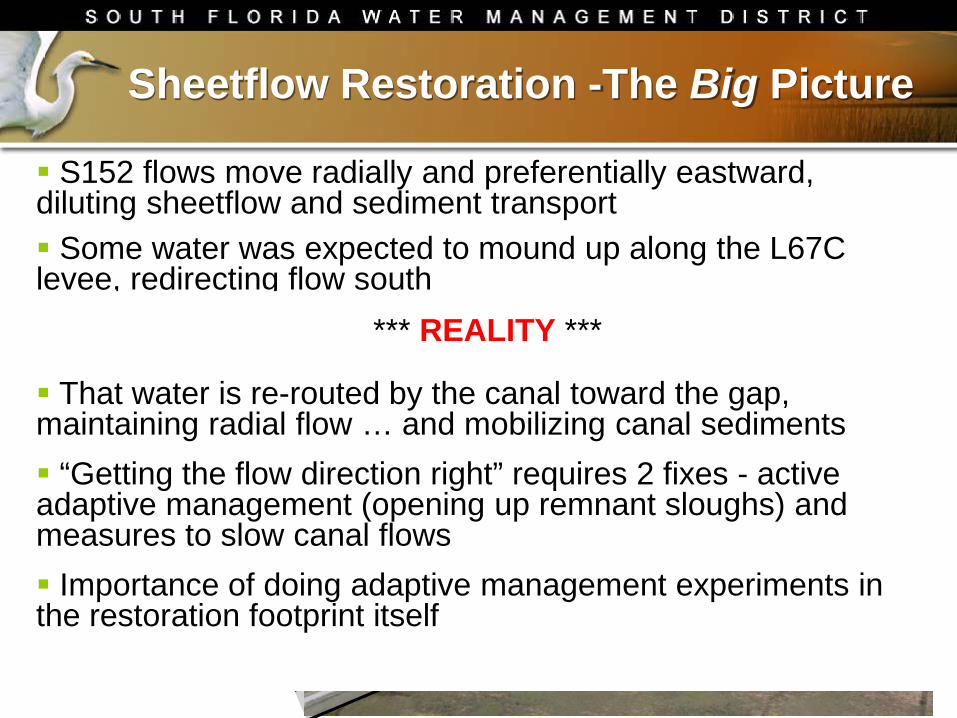
Sheetflow Restoration -The Big Picture
S152
S152 flows move radially and preferentially eastward, diluting sheetflow and sediment transport Some water was expected to mound up along the L67C levee, redirecting flow south
*** REALITY ***
That water is re-routed by the canal toward the gap, maintaining radial flow … and mobilizing canal sediments “Getting the flow direction right” requires 2 fixes - active adaptive management (opening up remnant sloughs) and measures to slow canal flows Importance of doing adaptive management experiments in the restoration footprint itself