Embed Size (px)
Citation preview
How do Neighbor Effects influence Institutional Change?
Evidence from Turnpike Trusts in Eighteenth-Century England
Dan Bogart1
Department of Economics, UC Irvine
Abstract
Turnpike trusts were private organizations that improved and maintained toll roads in eighteenth
century England. They contributed to economic growth by increasing road investment and
lowering transport costs. Turnpike trusts were adopted slowly before the 1750s and 1760s when
they came to control large portions of the road network. Turnpikes were also adopted in
particular regions within a short time period. This paper shows that neighbor effects can explain
this diffusion pattern. The results suggest that individuals learned about the benefits of turnpikes
through a demonstration of their effects in neighboring locations. They also suggest that the
benefits increased as more neighboring cities adopted turnpike trusts. More generally, the paper
provides an example of how neighbor effects influence the process of institutional change.
1 I would like to thank Jean-Laurent Rosenthal, Ken Sokoloff, Gary Richardson, Linda Cohen, and Ken Small for helpful comments on earlier versions. I would also like to thank participants at the University of British Columbia, and the 2005 Joint Cliometrics Socieity and All-UC Economic History Group meetings. Finally I would like to thank Larry Bush for valuable research assistance.

Neighbor effects are believed to influence a wide range of social and economic
phenomenon, such as poverty, educational attainment, and technology adoption (see Durlaf,
2004). The idea is that individuals are more likely to take a particular action, if more of their
neighbors also take the same action. The presence of neighbor effects implies that aggregate
behavior can differ across space, even when conditions are otherwise similar. For instance, if
one individual adopts a new technology then their neighbors may want to adopt as well, resulting
in a high level of technology diffusion. By contrast, if an individual does not adopt a technology,
then their neighbors may not either, resulting in a low level of diffusion.
Neighbor effects have been studied in a variety of settings, but less is known about how
they affect institutional changes, such as the adoption of legal or regulatory structures. As in the
case of technologies, there may be network externalities in which the benefits or the costs of an
institution decrease with the number of individuals who adopt or follow it. There could also be
demonstration effects, in which individuals learn about the benefits and costs by observing the
experiences of others. In either case, the adoption of an institution in one location can influence
its adoption in neighboring locations.
In this paper, I show that neighbor effects contributed to the passage of turnpike Acts in
eighteenth century England. Turnpike Acts had an important impact on the economy by
increasing road investment and reducing transport costs (Bogart, 2005). Each Act created an
organization known as a turnpike trust. The trustees were granted authority over a roadway
previously maintained by local governments. They were also given the right to levy tolls and
issue bonds. However, trustees were required to keep the tolls below a maximum schedule, and
they were not allowed to earn profits.
1

Turnpike Acts were initiated by local landowners and merchants who submitted petitions to
Parliament. The petitions usually stated that communications and transport would be improved
if a turnpike trust was allowed to levy tolls along a road. Initially, Parliament was resistant to the
idea, and many petitions failed. Over time Parliament changed its attitude, and began passing
large numbers of turnpike Acts, especially during the 1750s and 1760s. By the early nineteenth
century, turnpikes formed the largest toll road network in history with nearly 1000 turnpike trusts
managing 20,000 miles.
Many turnpike trusts were adopted in neighboring locations around the same time period. I
analyze whether neighbor effects contributed to the adoption of turnpikes by studying their
diffusion along the road network connecting London with all major cities in 1700. I identify the
first year when each major city had a turnpike trust managing its segment of the London road
network. I also define a set of neighbors as all major cities that shared a common route to
London. Last, I collect data on the characteristics of major cities, such as their distance to
London, whether they had water transport to London, and the number of weekly wagon and
coach services to London. My main finding is that cities were more likely to have turnpikes
established along their segment of the London network when neighboring cities did the same.
I also study the adoption of turnpike trusts along any road leading into a major city. Here I
define the set of neighbors as all major cities that lie within a 50-mile radius. The results
produce a similar conclusion, namely that cities were more likely to adopt turnpike trusts when
more of the neighbors did the same.
The preceding findings could reflect unobserved characteristics that were shared by
neighboring cities, rather than neighbor effects per se. I address this issue by using an
instrumental variable approach. In particular, I first predict whether neighboring cities had
2

turnpike trusts using characteristics, such as their number of weekly wagon and coach services to
London. I then use the predicted values to identify the whether neighboring adoption made cities
more likely to have turnpikes. The results are consistent with the earlier findings and show that
neighbor effects were present.
I interpret these results as evidence of demonstration effects or network externalities.
Demonstration effects occurred when local groups learned about the benefits of levying tolls by
observing the experiences of their neighbors. Network externalities were different because they
did not involve learning. Instead they occurred when the benefits increased (or the costs
decreased) as more turnpikes were adopted in neighboring areas.
My findings add to the literature on turnpike trusts in eighteenth century England. In
particular, they provide new evidence supporting William Albert’s (1972) argument that
demonstration effects influenced the adoption of turnpike trusts. My analysis also extends the
literature by analyzing the role of network externalities. I show that cities often adopted turnpike
trusts along their London segment, after their neighbors closer to London. This finding suggests
that the benefits increased when turnpikes were adopted on connecting road segments.
More generally, the results illustrate how neighbor effects influence institutional change. It
is often observed that more efficient institutions are slow to emerge (see North, 1990). Neighbor
effects provide one explanation for this phenomenon. If individuals believe that others will not
change their institutions, then the status quo becomes self-enforcing, and the efficiency gains
associated with the new institution are lost. Turnpike trusts provides one example of this
phenomenon. Local landowners and merchants were slow to adopt turnpike trusts because not
enough of their neighbors adopted. As a result, it took over 100 years for the turnpike network
to fully develop, and for roads to be improved.
3

The paper is organized as follows. Section 1 presents an overview of the English economy
and the rise of turnpike trusts. Section 2 discusses the data. Section 3 examines whether
neighbor effects influenced the adoption of turnpike trusts. Section 4 interprets the results.
Section 5 concludes.
1. Overview
In 1700 the English economy was already undergoing the early stages of economic
development. Agricultural output per worker was rising, as were real wages (Allen, 2001; Clark,
forthcoming). Higher agricultural productivity and real wages were caused, in part, by greater
urbanization. Cities provided markets for agricultural goods, which gave farmers an incentive to
adopt new techniques. Cities also produced manufacturing goods which they exported to
farmers in their hinterland. As the eighteenth century progressed, cities began to specialize in
particular manufacturing products. For instance, Leeds became specialized in woolen textile
production, Birmingham in metalworking, and Manchester in cotton textiles (Corfield, 1983).
Specialization led to increasing trade between cities. The most significant trade occurred
between London and major provincial cities (Chartes and Turnbull, 1983). The growth in long
distance trade led to a higher demand for road investment, but the existing institutions were not
well-suited to meet this higher demand. In 1700, most roads were maintained by local
governments, known as parishes. Parishes were required by law to pay for road improvements in
their jurisdiction. They were given the authority to claim labor services from their residents, or
levy taxes on property income, but they could not levy tolls on road-users.
Parishes were generally ineffective in providing road maintenance and investment. The
problem was that parishes were small, and therefore, most of the benefits went to through-
4

travelers (Pawson, 1977; Bogart, 2005). The through-traffic problem was especially relevant
along the highways leading into London, where wagons and carriages often passed through
dozens of parishes along their route. In such cases, parishes had to pay for all the costs.
Moreover, their expenditures would increase through traffic, which lowered prices in the London
market or added to congestion.
The reluctance of parishes to finance road improvements led to higher transportation costs
and less internal trade. Lost trade was detrimental for a number of groups in the economy, and in
particular cities whose manufacturing production was growing. Some cities addressed this
problem by submitted petitions to Parliament. The petitions stated that a local road was in poor
condition, and that a turnpike Act was necessary to improve the road.
A turnpike Act transferred authority from parishes to a body of trustees. Trustees had the
right to levy tolls, issue debt, and purchase land along a particular roadway. The ability to levy
tolls was especially crucial because it helped resolve the through-traffic problem.2 The result
was that expenditures typically increased by a factor of more than 10 after turnpikes took over
the road (Bogart, 2005).
Greater road expenditure affected the economy by contributing to lower transport costs.
Between 1750 and 1820, freight charges fell by around 40%, while passenger travel times were
reduced by 60%.3 At the same time there was a significant increase in freight and passenger
traffic, especially between London and major cities, like Birmingham, Leeds, Liverpool,
Manchester, and Newcastle. The aggregate impact of turnpike trusts was substantial and
2 Borrowing constraints were another reason why the parish system was unsuccessful in financing road investment. Legal restrictions on issuing debt forced parishes to rely on current tax revenues, and as a result, they had little incentive to undertake road investments that yielded benefits over the long run. Turnpikes resolved this problem because they could issue debt. See Bogart (2005) for more details. 3 There is a large literature on the relationship between turnpike trusts and transport costs. See Jackman (1916), Albert (1972), Pawson (1977), Chartres and Turnbull (1983), Gerhold (1988, 1996), and Bogart (forthcoming).
5

amounted to a social savings of nearly 1% of national income by the early nineteenth century
(Bogart, 2005, 2006).
Despite producing large benefits, turnpike trusts were adopted slowly. The first turnpike
Act was passed in 1663 and applied to a 15 mile-stretch along the Great North Road connecting
London with Newcastle. The next two turnpike trusts were created in 1695, and also applied to
short road segments connecting London with major provincial cities. Diffusion accelerated
during the 1720s and 1740s, as turnpikes were adopted along several routes leading into London
and near provincial cities in the West and North. Turnpikes finally proliferated throughout the
network during the ‘turnpike boom’ of the 1750s and 1760s. This period witnessed the adoption
of over 300 trusts along 10,000 miles of road (Pawson, 1977). The two final waves of adoption
occurred during the 1790s and 1820s, when most trusts were established on secondary roads near
major cities.
Figure 1 shows the diffusion curve for turnpike trusts and the mileage managed by turnpike
trusts. Both curves have the familiar S-shape, in which adoption starts slow, then accelerates
rapidly, and then slows once again. The steep portion of the diffusion curve corresponds to the
turnpike boom of the 1750s and 1760s. Closer inspection also reveals that the diffusion curve
was steep during the 1720s and the 1790s.
There are a number of hypotheses about why certain decades, like the 1750s and 1760s,
experienced more rapid turnpike adoption. Eric Pawson (1977) argues that macroeconomic
variables were crucial, especially population, international trade, agricultural prices, and
industrial production. Another hypothesis is that local factors, like demonstration effects, also
influenced diffusion. William Albert argues that “trusts themselves were a major influence on
6

expansion” (1972, p. 51). He based his claim on the observation that many new trusts were near
or directly linked to existing turnpike roads.
It is difficult to determine, however, if demonstration effects or some other type of
neighbor effect caused the clustering of adoption. It is possible that turnpikes were adopted
along several neighboring roads because they shared some characteristic, like high demand for
road improvements. In my analysis, I focus on the adoption of turnpikes near major cities and
examine whether neighboring adoption had an effect after controlling for observable
characteristics of cities. I also use instrumental variables to address the possibility that
neighboring cities had similar unobservable characteristics. Before discussing the methodology
in detail, it is necessary to introduce the data.
2. Data
I focus on the adoption of turnpike trusts near cities with a population above 2500 in 1700
(hereafter major cities). The list of 67 major cities includes Birmingham, Leeds, Norwich, and
Manchester, which were the main manufacturing centers. It also includes Bristol, Liverpool,
Hull, and Newcastle, which were the main ports, as well as cities like Derby, Salisbury, and
Nottingham, which provided a mixture of manufacturing and services.4
London has a special place in the urban hierarchy because it was the ‘central place’ of the
English economy. I do not include London among my list of major cities because it was so large
relative to all other major cities. The size imbalance makes it unlikely that Londoners adopted
turnpike trusts because one of its smaller neighboring cities did the same.
4 See Corfield (1983) for a list of major cities in 1700, 1750, and 1800, along with estimates of their population.
7

I first examine turnpike adoption along road segments that connected London with major
cities. The London road network is identified using the seventeenth century travel guide
Britannia (see Bowen, 1970). I also use the database of turnpike Acts in Albert (1972) and
Pawson (1977) to identify when turnpike trusts were established on each segment. Finally, I
identify the year when a turnpike trust was established along any segment of the London network
that begins or ends with a major city.
Second, I examine turnpike adoption along any road segment that begins or ends with a
major city. I use the database from Albert and Pawson to identify the first year when turnpikes
were established near major cities. It is worth emphasizing that turnpike adoption along any road
segment includes turnpike adoption along the London road network. I distinguish between the
two because some cities first had turnpikes along their non-London roads.
I also matched each city with information on the weighted fraction of neighboring cities
that adopted turnpike trusts. For the London network, the set of neighboring cities is defined as
all major cities that were on the same route to London. For example, Plymouth, Exeter, and
Salisbury shared the same route to London. Plymouth had a turnpike on its portion of the
London road beginning in 1757. Exeter had a turnpike on its portion in 1753, and Salisbury in
1755. For Plymouth, the fraction of neighboring cities that adopted turnpike trusts would be 0
for all years up to 1752, 0.5 in 1753 and 1754, and 1.0 in 1755 and beyond.
My analysis focuses on the weighted-fraction of neighboring cities with turnpikes because
neighbor effects are likely to be stronger when cities are closer. Specifically, I use the inverse of
8

distance as my weight, and then calculate the weighted fraction of neighboring cities with
turnpikes in each year t.5
Neighbors are defined differently for the analysis of turnpike adoption along any road
segment. Here the set includes all cities that lie within a 50-mile radius of each city. As before,
I calculate the weighted-fraction of neighboring cities with turnpike trusts using the inverse of
distance as the weight.
Lastly, I match cities with data on their characteristics. The city characteristics include
distance to London, an indicator if they had water transport to London, an indicator if they had a
population above 5000 in 1700, and the number of weekly coach and wagon services to London.
Distance is provided in Britannia. Cities are defined as having water transport if they were
located on the coast, or next to a navigable river which led to London (see Stevens). Population
comes from Corfield (1983). The number of weekly coach and wagon services are drawn from a
series of London travel directories published in 1705, 1715, 1740, 1749, 1760, 1770, 1779, 1790
and 1800.6 Directories were designed for travelers and merchants who wanted to know when
coach and wagon services were available to particular cities. They are generally regarded as the
best source on the volume of transport services between London and major cities (Chartres and
Turnbull, 1983; Gerhold, 1988; Bogart, 2005).
3. Neighbor Effects and the Adoption of Turnpike Trusts
5 For example, the distance between Plymouth and Exeter is 35 miles, and the distance between Plymouth and Salisbury is 103 miles. For Plymouth, the weighted fraction of neighboring cities with turnpike trusts is 0.746 in 1753 or (1/35)*1/[(1/35)+(1/103)]. 6 The travel directories include the Traveller’s and Chapman’s Daily Instructor, The Merchants and Traders Necessary Companion, the New and Complete Guide to all Persons who have any Trade or Concern with London, and The Shopkeepers and Tradesman’s Assistant.
9

This section investigates whether neighbor effects influenced the adoption of turnpikes. I
first focus on the adoption of turnpikes along segments of the London road network that began or
ended with major cities. Second, I examine turnpike adoption along any road segment near
major cities. The results show that neighbor effects were present in both contexts.
3.1 Neighbor Effects along the London road Network
The London road network was the main trade route between London and major cities.
Figure 2 provides a series of maps that illustrate the adoption of turnpike trusts along the London
road network in 1720, 1730, 1750, and 1770. The maps also show the location of all major
cities. The darker lines represent road segments managed by turnpike trusts, and the white lines
are segments that were still under the control of parishes. The grey lines are major waterways,
which provided an alternative form of transport to London.
Panel A shows that turnpike trusts managed little of the road network in 1720. Most
turnpikes were in the hinterland of London, or near cities like Bath, Reading, Gloucester,
Oxford, Northampton, Portsmouth, and Colchester. Panel B shows that turnpikes spread deeper
into the London network during the 1720s. In particular, there was an expansion to the west and
northwest of London. Along some of these routes, turnpike trusts were established in a short
time span. For example, turnpikes were adopted on 74% of the 110 miles between London and
Bristol between 1726 and 1728.
Few turnpikes were created in the 1730s, but the rate of adoption accelerated in the 1740s.
Panel C shows that by 1750 turnpike trusts controlled most of the mileage to cities like
Manchester, Newcastle, Bristol, Hereford, Worcester, Shrewsbury, Chester, Canterbury, and
Portsmouth. The pattern of development was geographically uneven, however, as trusts
10

controlled little of the mileage to cities like Plymouth, Tiverton, Southampton, Lincoln,
Norwich, King’s Lynn, Yarmouth and Carlisle. As in the 1720s, some routes had turnpike trusts
adopted in only a handful of years. For instance, they were adopted on 32% of the 275 miles
between London and Newcastle between 1741 and 1747.
Panel D shows that turnpike trusts were adopted along most remaining segments between
1750 and 1770. For example, in the southwest, turnpikes were established on 112 miles of the
London-Exeter-Plymouth road between 1753 and 1759.
The maps in figure 2 show that major cities had turnpike trusts adopted along their London
roads at different times. What explains these differences? If first investigate this question using
survival analysis. For my purposes, a city has ‘survived’ in year t if no turnpikes have been
established along a London segment that begins or ends with the city. Table 1 presents estimates
of the hazard ratio for various city characteristics at the beginning of the eighteenth century. The
results are based on a Weibull distribution, but they were similar for other distributions as well.
They show that if a city had a larger number of wagon or coach services in 1705 then its hazard
ratio was larger than 1, and therefore its predicted survival time decreased. If a city had a water
route to London then its hazard ratio was less than 1, and thus its predicted survival time
increased. Surprisingly, the estimates suggest that greater population in 1700 and distance to
London had little impact on the hazard ratio.
Survival analysis can determine whether observable city characteristics in 1700 influenced
the time to turnpike adoption, but it cannot be used to study neighbor effects. Instead, I examine
neighbor effects by exploiting the panel structure of my data. I consider the adoption of turnpike
trusts as non-repeated events. In other words, I assume that in year one a city decides whether to
adopt a turnpike trust along their London road. If they adopt, then they continue to have a
11

turnpike trust for all future periods. If they do not adopt, then in year two they face the same
choice. I encode these adoption decisions as a sequence of indicator variables. If a city has a
turnpike trust in year t then the adoption variable equals 1 and otherwise it is 0.
It is useful to analyze the adoption decision in a latent variable framework. Let be the
benefits of adopting a turnpike trust near city i in year t, and let be a variable that equals 1 if
city i has a turnpike trust adopted in year t. I assume that a turnpike trust is adopted whenever
the benefits are strictly positive. Thus whenever .
*ity
ity
1=ity 0* >ity
I also assume that the benefits are a linear function of city characteristics and the
adoption decisions of neighboring cities. Specifically I consider the following equation:
*ity
itiititit ecaxy +++= δβ* (1)
where are the observable characteristics of city i in year t, is the weighted-fraction of
city i’s neighbors that have turnpike trusts in year t, is an unobserved city effect, and is the
error term. includes the distance to London, a dummy variable equal to 1 if the city had
water transport to London in 1700, the year, and the number of weekly coach and wagon services
between city i and London in year t.
itx ita
ic ite
itx
Following Wooldridge (2002), it is necessary to make some assumptions about the
distribution of conditional on . I analyze several specifications. The first is a
fixed effects linear probability model (hereafter, FEL). In this case, I assume that:
ity ),,,( itiitit ecax
itiitititiititit ecaxecaxyprob +++== δβ),,,1( (2)
where is now a city fixed effect and is independent of and . The main
advantage of this specification is that it allows and to be correlated. In other words, the
ic ite ita itx
ic ita
12

unobservable characteristics of a city can be related with the fraction of neighbors that have
turnpikes in any given year. One disadvantage of the FEL model is that it imposes a linear
structure on a binary outcome variable, like turnpike adoption. It also assumes that the error is
independent of .
ite
ita
The second specification is based on the instrumental variables, fixed effects linear
probability model (IVFEL hereafter).7 Here I assume that is not independent of in
equation (2). That is, I allow for some unobservable shock that raises the benefits of adopting
turnpike trusts for several neighboring cities. The IVFEL model first predicts the weighted-
fraction of neighboring cities with turnpikes in each year, and then uses the predicted value as an
explanatory variable in equation (2). The first stage includes city dummies, the year, and the
weighted-average of weekly coach and wagon services between neighboring cities and London.
ite ita
The weighted-average of weekly coach and wagon services are the instrumental variables.
I assume they are correlated with but are independent of ita itit xe . The idea is that neighboring
cities experience a unique ‘demand-shock’ that leads to more transport services to London, and
hence a greater likelihood of having a turnpike. Consider the example of Plymouth and Exeter
discussed earlier. If Exeter experienced a productivity shock, then it will have more trade with
London, and thus a greater value in adopting turnpikes. If Plymouth does not experience this
productivity shock, then its value of adopting turnpikes will not change, unless Exeter adopts a
turnpike.
7 The third model is an application of the methodology originally proposed by Manski (1993), where the characteristics of neighbors are used to predict neighbor adoption. It has been applied in the network externalities literature by Gowriskankaran and Stavins (2004).
13

The IVFEL model is preferred over the FEL model if is not independent of .
However, the IVFEL model is not entirely correct, because its linear structure implies that the
predicted probability of adoption can be below 0 or above 1.
ite ita
The third specification is based on the ‘traditional’ random effects probit model (hereafter
REP).8 As in the usual probit model, I assume that is drawn from the standard normal
distribution and is independent of and . This implies the following equation:
ite
ita itx
)(),,1( iititiititit caxcaxyprob ++Φ== δβ (3)
In this case, it is not possible to directly estimate , but if I assume that ic
),0(~, 2cititt Naxc σ then I can find the maximum likelihood estimator of β and δ .9 The REP
model is preferred over the FEL and IVFEL models because it does not impose a linear structure.
However, it assumes that has a particular functional form and that is uncorrelated with . ic ic ita
The fourth specification is based on the Chamberlain’s random effects probit model
(hereafter CREP).10 Here I assume that equation (3) holds and that iiii daxc +++Ψ= ςξ , where
ix is the average number of weekly wagon and coach services over time, ia is the average
weighted-fraction of neighboring cities with turnpikes over time, and is city-specific constant.
In addition, the CREP model assumes that
id
),(~, 2diiititt axNaxc σςξ ++Ψ , where is the
variance of . Estimation of the CREP model is identical to the REP model, but it includes
2dσ
id ix
and ia as additional explanatory variables.
8 See Wooldridge (2004), p. 485 for a discussion of the traditional random effects probit model. 9 This model also assumes that are independent conditional on , , and . iTi yy ,..1 itx )( ityf − ic10 See Wooldridge, pp. 487-88 for a discussion of the Chamberlain’s random effects probit model.
14
The main advantage of the CREP model is that it allows for dependence between and
. The CREP model also provides a test of the key assumption of the REP model. If we reject
the hypothesis that the coefficients on
ic
ita
ix and ia are equal to zero, then we can reject the
assumption that ),0(~, 2cititt Naxc σ .
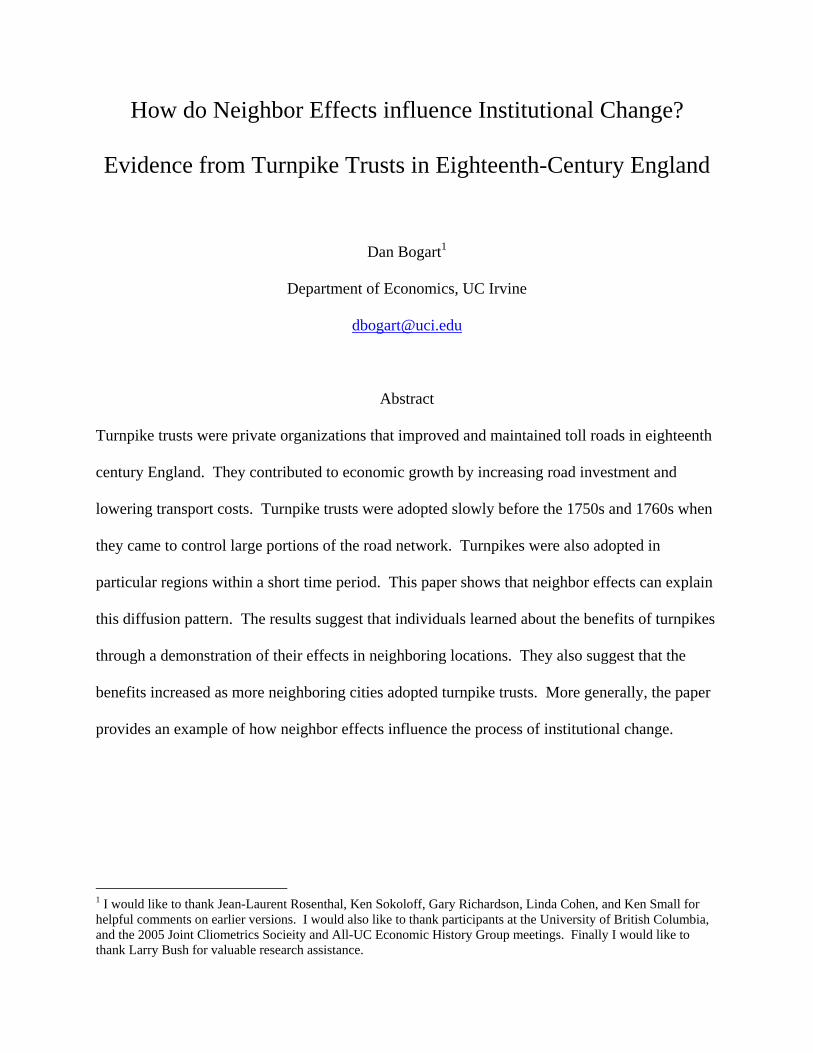
Table 2 presents the estimates based on 278 observations covering the years 1705, 1715,
1740, 1749, 1760, 1770, 1779, 1790 and 1800. Recall that I drop all observations beyond the
first year in which a city has a turnpike trust, because I assume that adoption is irreversible.
Column (1) presents estimates from the FEL model, column (2) shows the IVFEL model,
column (3) the REP model, and column (4) the CREP model.
Across all specifications in Table 2 higher weekly wagon services to London raised the
probability of turnpike adoption. This result suggests that observable city characteristics affected
adoption. In particular, higher road traffic led to a higher demand for turnpike trusts.
The main finding in table 2 is that cities were more likely to adopt turnpike trusts along the
London road network if their neighboring cities did the same. The estimates in the FEL and
IVFEL models imply that if half of neighboring cities adopted turnpikes, then the probability that
a city adopted increased by 35 or 33 percent respectively. The finding that the
FEL and IVFEL estimators are similar suggests that any dependence between the error and the
weighted fraction of neighboring cities with turnpikes has little effect on the estimates.
ite
ita
Figure 3 shows the distribution of predicted probabilities for each city-year observation
under the FEL and IVFEL models. In the FEL model the predicted probability is less than zero
for 116 of the 278 city-year observations. Most come from the years 1705 and 1715, in which
only 3 out of 67 major cities had turnpike trusts. The IVEL model also predicts a negative
15

probability of adoption for most observations in 1705 and 1715. These results suggest that the
FEL and IVFEL estimates may be misleading, because they predict a negative probability of
adoption for some observations. However, it should be emphasized that the predicted
probabilities are not significantly below zero in most cases. In addition, the predicted probability
in the FEL and IVFEL models at the sample means are very similar to the predicted probability
of the REP and CREP models.
Column (3) shows the results from the REP model. The main finding is that a higher
fraction of neighboring cities with turnpikes increased the probability of turnpike adoption. I
evaluate the magnitude of this coefficient by calculating the probability when no neighbors adopt
turnpike trusts, and other variables are evaluated at the sample mean. I also calculate the
probability when half of neighboring cities adopted turnpike trusts, and other variables are
evaluated at the mean. The results show there is a 2 percent probability that a city adopts when
none of its neighbors adopt. By comparison, the probability increases to 21.3 percent when half
of its neighbors adopt (a difference of 19.2 percent).
The estimated impact of neighboring adoption is lower in the REP model than in the linear
probability models. Still the impact of neighboring adoption is large compared to the effects of
other variables. For instance, the probability of adoption increases by only 1 percent if there is a
one standard deviation increase in the number of wagon services, and all other variables are
evaluated at their mean.
Column (4) shows the results for the CREP model. A higher fraction of neighboring cities
with turnpikes continues to increase the probability of turnpike adoption. The coefficients on the
average fraction of neighbors with turnpikes and the average number of weekly wagon services
to London are also of interest. The coefficients on both variables are economically and
16

statistically different from zero. Thus we can reject the assumption of the REP model that
),0(~, 2cititt Naxc σ . In other words, the random effect is not independent of city
characteristics and the fraction of neighboring cities that adopted turnpike trusts.
ic
I evaluate the magnitude of the coefficients in the CREP model by comparing the
probability of adoption when no neighbors adopt and when half of neighbors adopt. The results
show that the probability of adoption increases by 21.5 percent when half of neighboring cities
adopt turnpikes and other variables are at the sample mean. Thus the coefficients in the CREP
model are of a similar magnitude as the REP model.
3.2 Neighbor Effects and along Any Road Near a Major City
Major cities traded with smaller cities in their hinterland, as well as other major cities that
were on a different route to London (see Chartres and Turnbull, 1983). Therefore, focusing
solely on the London road network will not capture all relevant neighbor effects. In this section,
I provide a broader measure of neighbor effects by focusing on the adoption of turnpike trusts
along any road leading into a major city. Figure 4 shows the survival curve for all major cities,
where survival means there were no turnpikes along any road segment that begins or ends with
the city in year t. For comparison, the figure also shows the survival curve for major cities along
the London road network. The curves are similar because most cities had turnpikes adopted first
along their London road network. There were cases, however, where cities adopted turnpike
trusts on other roads first. For example, Ipswich had its first turnpike trust in 1711, but it did not
have a turnpike trust along its London segment until 1785.
I estimate the impact of neighbor effects in the same manner as before, except now
neighboring cities are defined as all cities that lie within a 50-mile radius of a major city. The
17
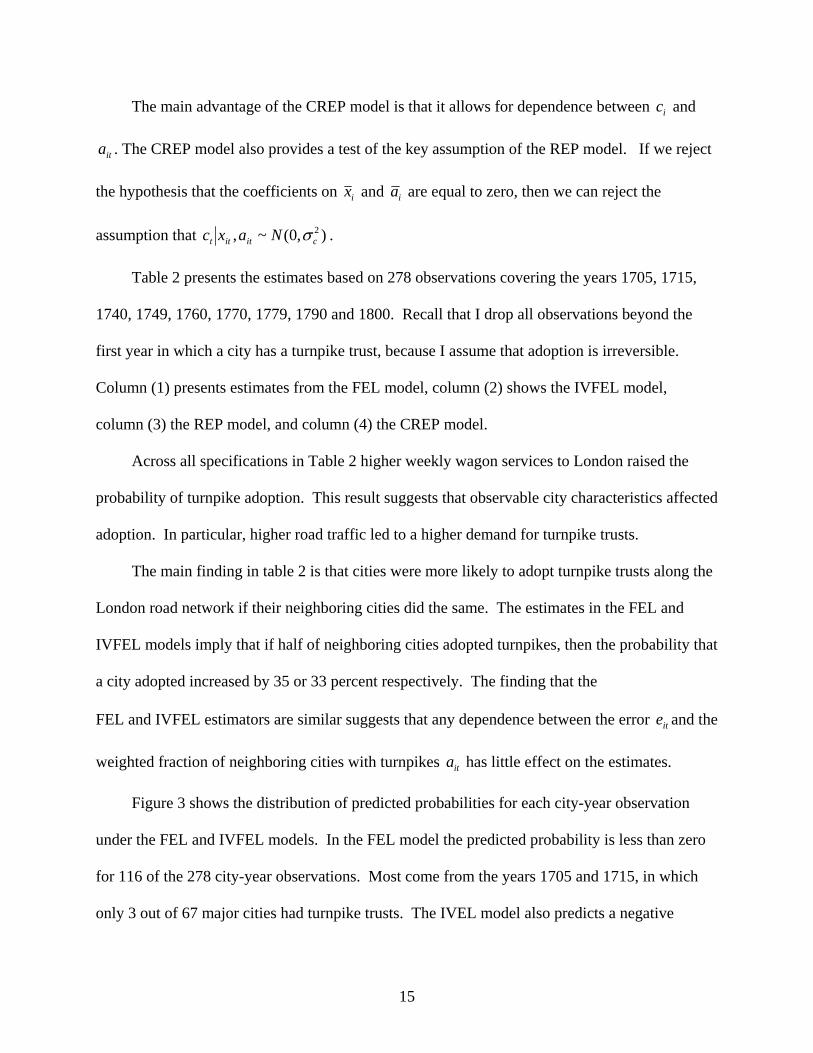
idea is that the adoption of a turnpike within 50 miles could create a neighbor effect, even if it
was not on the same route to London. I continue to use city dummies, the year, and weekly
wagon and coach services to London as controls. I also continue to use the weighted-average of
weekly wagon and coach services among neighboring cities as my instruments. Ideally, I would
like to have weekly transport services to all cities, but this data is not presently available.
Table 3 presents the estimates for all four specifications using 257 observations covering
the years 1705, 1715, 1740, 1749, 1760, 1770, 1779, 1790 and 1800. The FEL estimates imply
that if half of neighboring cities adopted turnpikes, then the probability of adoption increased by
33 percent. The IVFEL estimates suggest that if half of neighboring cities adopted, then the
probability of adoption increased by over 50 percent. The IV estimates suggest that neighboring
adoption played a larger role if we include all major cities within 50 miles. In fact, they imply
that neighboring adoption explains a substantial portion of the variation in the data.
Figure 5 shows the predicted probabilities of turnpike adoption for city-year observations
under the FEL and IVFEL models. Once again we see that the linear models predict that some
cities have a negative probability of turnpike adoption. The predictions are negative for 91 of
258 observations in the FEL model, and for 137 observations in the IVFEL model. As before,
most of these observations come from the years 1705 and 1715.
Columns (3) and (4) show the estimates from the REP and CREP models. They also show
that the weighted-fraction of neighboring cities with turnpikes is positive and significant. In the
CREP model, the coefficients on the average fraction of neighboring cities with turnpikes, the
average number of weekly wagon services, and the average number of coach services are also
significant. This implies that we can reject the independence assumption of the REP model.
Lastly, I evaluate the magnitude of neighboring adoption by subtracting the probability when no
18

neighbors adopt turnpike trusts from the probability when half of the neighboring cities adopt (all
other variables are evaluated at their sample mean). Under the CREP model, the calculations
show that a city was 22.0 percent more likely to adopt a turnpike trust when half of its neighbors
adopted turnpike trusts.
Overall, the impact of neighboring adoption appears to be similar regardless of whether I
define neighbors as all major cities that shared a common route to London, or all cities within a
50-mile radius. The finding that the coefficient on neighboring adoption does not decline after
using instrumental variables suggests that we can interpret these results as being causal. The
estimates from the Chamberlain random effects probit model are probably the most informative
because it does not impose a linear structure, and it does not assume independence between
neighboring adoption and the city-specific constant . It shows that a city was around 21
percent more likely to adopt a turnpike, when half of their neighbors did the same.
ic
4. Interpreting Neighbor Effects
My results show that neighbor effects influenced the adoption of turnpike trusts. It is not
obvious, however, why neighbor effects mattered. One explanation is that local groups learned
about the benefits of turnpike trusts by observing a demonstration of the effects in neighboring
locations. Learning was necessary if groups were uncertain about whether the tolls would
provide enough revenues to finance road improvements. Similarly, investors may have been
uncertain about the risks associated with turnpike bonds. These uncertainties could be overcome
if groups were able to observe the effects of turnpikes in their area. Local demonstrations were
likely to have been most informative, because regional economies were similar and most
investors were local.
19

Network externalities are another explanation for why neighboring adoption mattered.
Network externalities would be present if the benefits increased when turnpike trusts were
adopted in neighboring locations. The benefits would increase if the value of improving one
road segment increased as connecting road segments were improved. This would be a likely
scenario if road-users traveled over connecting segments when going to their destination.
Neighboring adoption could also affect the benefits of turnpikes if cities were in competition
with one another. Suppose, for example, that two cities were competing to become the
commercial center of their region. If one city adopts a turnpike and gains a comparative
advantage, then the other city may want to adopt as well to offset this advantage.11
At the moment, I cannot distinguish between different types of neighbor effects, but I do
have evidence that network externalities were important in some cases. Network externalities
imply that the value of improving a road segment increased as connecting segments were
improved. As are result, we might expect that turnpikes will be adopted along a particular
segment of the London road network, after turnpikes were adopted along segments that were
closer to London.
The maps in figure 2 suggest that along some routes turnpikes did indeed spread outwards
from London. For instance, along the London-Durham-Newcastle road segments further away
from London got turnpikes shortly after segments closer to London. Starting in 1741, a turnpike
trust was established along the Doncaster to Boroughbridge segment. In 1745, a second turnpike
was established along the Boroughbridge to Durham segment. In 1747, a third turnpike was
adopted along the Durham to Newcastle segment, as well as a fourth along the segment from
Durham to Sunderland.
11 Network externalities would also be present if the costs of creating turnpike trusts went down when more were adopted along neighboring roads. The costs could fall if the adoption of turnpike trusts in neighboring areas raised
20

The London-Salisbury-Exeter road provides an example where some turnpikes were
adopted away from London first. There were four segments between Salisbury and Exeter. The
first was Salisbury to Shaftesbury, which had a turnpike in 1762. The second was Shaftesbury to
Crewkerne which had two separate turnpikes in 1753. The third was the Crewkerne to
Axminster, which had two turnpikes in 1758 and 1759. The fourth was the segment between
Axminster and Exeter, which had a turnpike in 1753. Here the second and fourth segments were
the first to have turnpikes, followed by the third and the first. In this case, demonstration effects
or some other type of network externality must have played a role.
A final example from the West of Yorkshire illustrates how different types of neighbor
effects influenced the adoption of turnpike trusts. In 1735, the West Riding had one turnpike
trust managing 13 miles between Halifax and Elland. In 1741, 6 turnpike trusts were established
along 239 miles linking cities like Doncaster and Wakefield, Wakefield and Pontefract, Leeds
and Elland, Doncaster and Boroughbridge, Doncaster and Saltersbrook, as well as Leeds and
Selby. The Halifax and Elland turnpike may have encouraged the other turnpikes by providing a
demonstration of the benefits between 1735 and 1741. Later, network effects were more
important because several turnpikes linked with Doncaster, which was a central point in the local
transport network. 12
Inter-city competition is likely to have been a factor in the adoption of turnpike trusts near
Leeds and Wakefield. These two cities were the main marketing centers for woolen textiles in
the West Riding. They had an advantage in the region because they were located on the Aire and
Calder rivers, which flowed to the eastern sea coast (Wilson, 1971). In 1741, Leeds improved its
toll revenues by increased local road traffic. 12 The adoption spurt in the West Riding was partly due to the expansion of its main industry, woolen textile manufacturing. Between 1730 and 1735, the average annual growth rate for woolen textile production in the West
21

transport links to the east by promoting the Leeds to Selby turnpike trust. Wakefield did the
same in 1741 by promoting the Wakefield to Pontefract turnpike trust. The latter improved
Wakefield’s transport links to the eastern coast and was parallel to the Leeds-Selby turnpike.
The behavior of Leeds and Wakefield suggests that each city adopted in response to the adoption
of the other. One possibility is that Wakefield tried to offset the advantages that might have gone
to Leeds, if Leeds was the only city with a turnpike trust to the eastern seaboard.
5. Conclusion
In 1700, there were a handful of turnpike trusts managing roadways in England and Wales.
By the 1830s there were nearly 1000 turnpike trusts managing 20,000 miles. Why did it take so
long for this institutional innovation to diffuse? In this paper, I show that neighbor effects are
one reason why turnpike trusts were adopted slowly. My results show that turnpikes were more
likely to be adopted in one location, when they were also adopted in neighboring locations. One
reason is that the local benefits from turnpikes increased as turnpikes were adopted in
neighboring locations. Another reason is that local groups learned about the benefits of
turnpikes by observing their effects in neighboring locations. The combination of network
externalities and demonstration effects meant that local groups did not want to promote turnpike
trusts unless their neighbors did as well. As a result, there was a pattern in which turnpike trusts
were absent until several neighboring cities adopted simultaneously. Afterwards, more cities
followed and within a short time period most major roads had turnpike trusts.
It is worth emphasizing that my results do not dismiss the importance of economic growth
as a contributing factor to turnpike adoption. For instance, I find that cities with more wagon
Riding was zero. It increased to 5.75% between 1735 and 1740, and was 4.04% between 1740 and 1745 (Mitchell,
22

and coach services to London had a higher probability of turnpike adoption. Thus as the
economy developed and traffic increased, more turnpike trusts would have been adopted.
Therefore, the results support the view that a combination of neighbor effects and economic
growth influenced the diffusion process.
More generally, my findings provide an illustration of how neighbor effects influence
institutional changes like new legislation. There are often uncertainties about how new
legislation will influence the economy. In such cases, lobbyists and politicians may learn about
the benefits of legislation by observing its effects in neighboring jurisdictions. It is also possible
that the benefits increase when neighboring jurisdictions pass similar legislation. These factors
can lead to a coordination problem, in which political actors will enact new legislation only if
they believe others will as well. The result is that the status quo becomes self-enforcing, and the
efficiency gains associated with the new institution are lost.
Appendix: Data Sources for the London road network
Table 4 lists the 22 London routes, along with the major cities on each route. Each route
can be identified in Figure 2. There are two types of routes. The first is a major highway that
linked London to several major cities. For instance, route 9 connected London with Colchester,
Ipswich, and Yarmouth. Another example of the first type is route 12, or the Great North Road,
which linked London with Newcastle, Berwick, Durham, Sunderland, and South Shields. The
second type was a branch highway that linked with a major highway. For instance, route 14 was
a branch highway that connected Whitby, Scarborough, and York to the Great North road. It
was classified as being separate from the Great North Road because of its length and the distance
1971).
23

to other branches. Another example of a branch highway is route 18, which linked Whitehaven,
Carlisle, Kendal, Lancaster, Liverpool, and Macclesfield with route 22, which was the major
highway between Chester and London.
References
Albert, William. The Turnpike Road System in England 1663-1840. Cambridge: Cambridge
University Press, 1972.
Allen, Robert. “Economic Structure and Agricultural Productivity in Europe, 1300-1800.”
European Review of Economic History, 2000, 4(1), pp. 1-27.
Bogart, Dan. “Did Turnpike Trusts Increase Transportation Investment in 18th century England?”
Journal of Economic History, 65 (2005): 439-468.
Bogart, Dan. “Turnpike Trusts and the Transport Revolution in Eighteenth Century England,”
Explorations in Economic History, 42 (2005):479-508.
Bogart, Dan. “Turnpike Trusts and Property Income: New Evidence on the Effects of Transport
Improvements and Legislation in Eighteenth Century England,” Working Paper, 2006.
Bowen , Emanuel. Britannia Depicta. Newcastle: Frank Graham, 1971.
Chartres, John and Turnbull, Gerard. “Road Transport.” In Transport in the Industrial
Revolution, edited by Aldcroft, Derek and Freeman, Michael, 64-99. Manchester:
Manchester University Press, 1983.
Clark, Gregory. “The Condition of the Working Class in England.” Journal of Political Economy
(forthcoming).
Corfield, Penelope. The Impact of English Towns, 1700-1800. Oxford: Oxford Univ. Press,
24

1982.
Durlaf, S. “Neighborhood Effects,” in Handbook of Regional and Urban Economics 4, edited by
Henderson, V. and Thisse, J. Elsevier, 2004.
Gerhold, Dorian. “The Growth of the London Carrying Trade, 1681-1838.” Economic History
Review 41 (1988): 392-410.
Gerhold, D. “Productivity Change in Road Transport before and after Turnpiking, 1690-1840.”
Economic History Review 49 (1996): 491-515.
Geroski, P.A. “Models of Technology Diffusion.” Research Policy, 29 (2000): 603-625.
Gowrisankaran, Gautam, and Joanna Stavins. “Network Externalities and Technology Adoption:
lessons from electronic payments.” Rand Journal of Economics 35 (2004): 260-276.
Great Britain. House of Commons. “Report of the Commissioners for Inquiry into the State of
Roads in England and Wales.” Parliamentary Papers, 1840, XXVII.
Jackman, W. T. The Development of Transportation in Modern England. Cambridge:
Cambridge University Press, 1916.
Manski, Charles. “Identification of Endogenous Social Effects: The Reflection Problem. The
Review of Economic Studies 60 (1993): 531-542.
Mitchell. Brian. Second Abstract of British Historical Statistics. Cambridge: Cambridge
University Press, 1971.
North, Douglass. Institutions, Institutional Change, and Economic Performance. Cambridge:
Cambridge University Press, 1990.
Pawson, Eric. Transport and Economy: The Turnpike Roads of Eighteenth Century Britain. New
York: Academic Press, 1977.
25

Stevens, M. “Waterways of England Wales: Their History in Maps”, Accessed on 12/6/2005.
http://www.mike-stevens.co.uk/maps/
Webb, Beatrice, and Webb, Sydney. English Local Government: The Story of the King's
Highway. New Impression, London: Archon, 1963.
Wilson, R. G. Gentlemen Merchants: The Merchant Community in Leeds, 1700-1830.
Manchester, Manchester University Press, 1971.
26

Tables Table 1: Survival Analysis of Turnpike Adoption along the London Network Variable
Hazard Ratio (standard error)
Dummy variable if city had a population above 2500 in 1700
0.7235123
(0.2076907) Distance from London
1.001602
(0.0020118) The Number of weekly wagon services from London in 1705
1.132877
(.0898938) The Number of weekly coach services from London in 1705
1.252795
(.0774167)* Dummy variable if city had water transport to London in 1700
0.5771038
(0.1609982)* N
67 Log Likelihood 201.21602 LR Chi-square(5) 13.71 Notes and Sources:
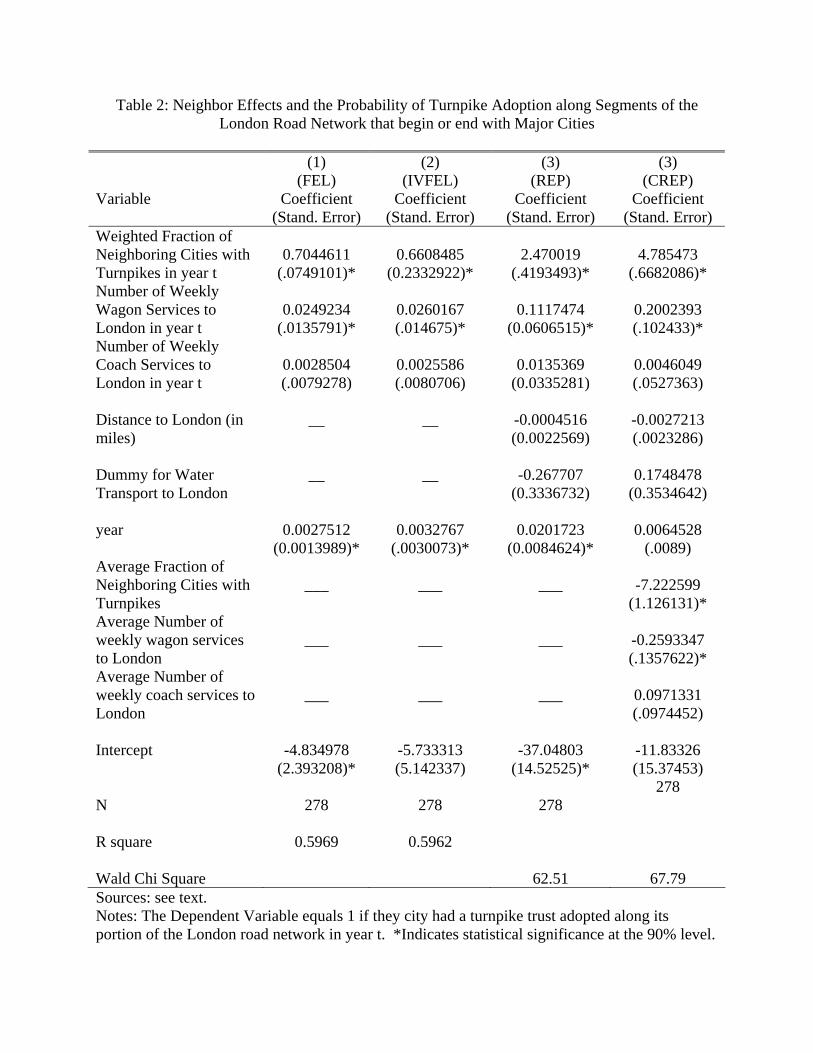
Table 2: Neighbor Effects and the Probability of Turnpike Adoption along Segments of the London Road Network that begin or end with Major Cities
Variable
(1) (FEL)
Coefficient (Stand. Error)
(2) (IVFEL)
Coefficient (Stand. Error)
(3) (REP)
Coefficient (Stand. Error)
(3) (CREP)
Coefficient (Stand. Error)
Weighted Fraction of Neighboring Cities with Turnpikes in year t
0.7044611
(.0749101)*
0.6608485
(0.2332922)*
2.470019
(.4193493)*
4.785473
(.6682086)* Number of Weekly Wagon Services to London in year t
0.0249234
(.0135791)*
0.0260167 (.014675)*
0.1117474
(0.0606515)*
0.2002393 (.102433)*
Number of Weekly Coach Services to London in year t
0.0028504 (.0079278)
0.0025586 (.0080706)
0.0135369
(0.0335281)
0.0046049 (.0527363)
Distance to London (in miles)
__
__
-0.0004516 (0.0022569)
-0.0027213 (.0023286)
Dummy for Water Transport to London
__
__
-0.267707
(0.3336732)
0.1748478
(0.3534642) year
0.0027512
(0.0013989)*
0.0032767
(.0030073)*
0.0201723
(0.0084624)*
0.0064528
(.0089) Average Fraction of Neighboring Cities with Turnpikes
___
___
___
-7.222599
(1.126131)* Average Number of weekly wagon services to London
___
___
___
-0.2593347 (.1357622)*
Average Number of weekly coach services to London
___
___
___
0.0971331 (.0974452)
Intercept
-4.834978
(2.393208)*
-5.733313 (5.142337)
-37.04803
(14.52525)*
-11.83326 (15.37453)
N
278
278
278
278
R square
0.5969
0.5962
Wald Chi Square
62.51
67.79
Sources: see text. Notes: The Dependent Variable equals 1 if they city had a turnpike trust adopted along its portion of the London road network in year t. *Indicates statistical significance at the 90% level.
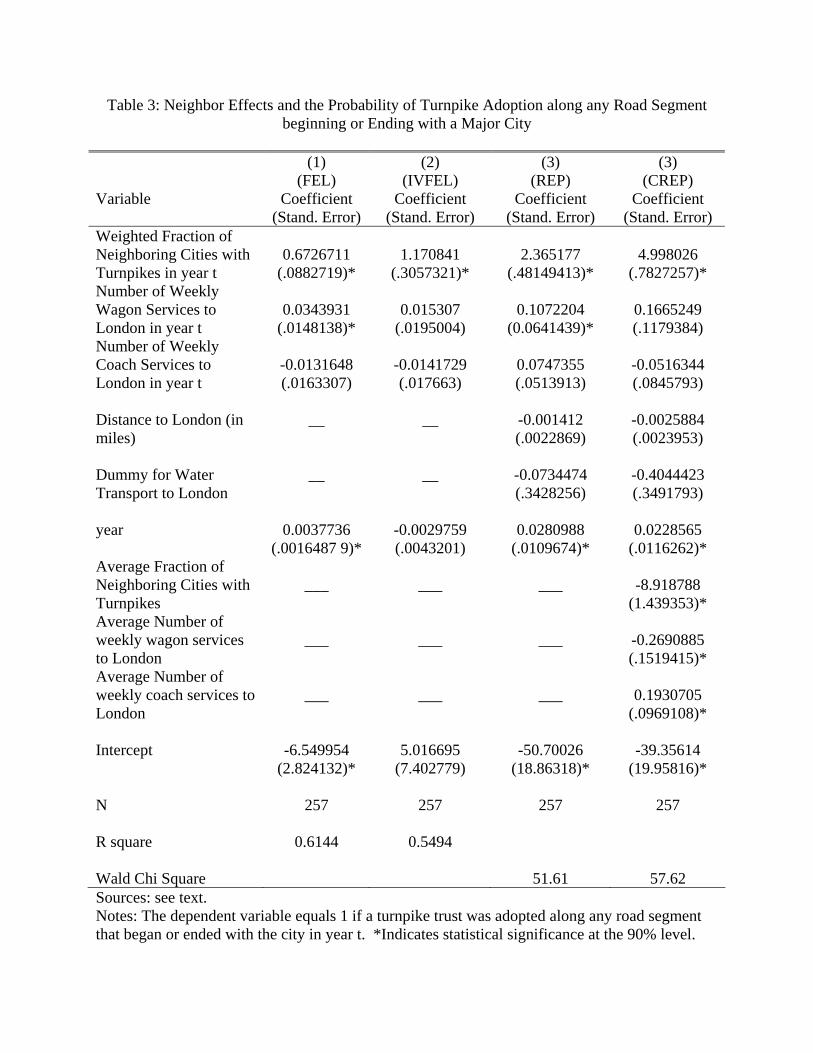
Table 3: Neighbor Effects and the Probability of Turnpike Adoption along any Road Segment beginning or Ending with a Major City
Variable
(1) (FEL)
Coefficient (Stand. Error)
(2) (IVFEL)
Coefficient (Stand. Error)
(3) (REP)
Coefficient (Stand. Error)
(3) (CREP)
Coefficient (Stand. Error)
Weighted Fraction of Neighboring Cities with Turnpikes in year t
0.6726711
(.0882719)*
1.170841
(.3057321)*
2.365177
(.48149413)*
4.998026
(.7827257)* Number of Weekly Wagon Services to London in year t
0.0343931
(.0148138)*
0.015307
(.0195004)
0.1072204
(0.0641439)*
0.1665249 (.1179384)
Number of Weekly Coach Services to London in year t
-0.0131648 (.0163307)
-0.0141729 (.017663)
0.0747355 (.0513913)
-0.0516344 (.0845793)
Distance to London (in miles)
__
__
-0.001412 (.0022869)
-0.0025884 (.0023953)
Dummy for Water Transport to London
__
__
-0.0734474 (.3428256)
-0.4044423 (.3491793)
year
0.0037736
(.0016487 9)*
-0.0029759 (.0043201)
0.0280988
(.0109674)*
0.0228565
(.0116262)* Average Fraction of Neighboring Cities with Turnpikes
___
___
___
-8.918788
(1.439353)* Average Number of weekly wagon services to London
___
___
___
-0.2690885 (.1519415)*
Average Number of weekly coach services to London
___
___
___
0.1930705
(.0969108)* Intercept
-6.549954
(2.824132)*
5.016695
(7.402779)
-50.70026
(18.86318)*
-39.35614
(19.95816)* N
257
257
257
257
R square
0.6144
0.5494
Wald Chi Square
51.61
57.62
Sources: see text. Notes: The dependent variable equals 1 if a turnpike trust was adopted along any road segment that began or ended with the city in year t. *Indicates statistical significance at the 90% level.

Table 4: The London Road Network Route
Number City 1 City 2 City 3 City 4 City 5 City 6
1 Halifax Sheffield Nottingham Bedford 2 Plymouth Exeter Salisbury 3 Tiverton Taunton Frome 4 Bristol Bath Reading 5 Southampton Winchester 6 Portsmouth Chichester 7 Canterbury Rochester 8 Maidstone 9 Yarmouth Ipswich Colchester 10 Norwich Bury 11 King’s Lynn Ely Cambridge 12 Berwick Newcastle South Shields Sunderland Durham 13 Bradford Leeds 14 Whitby Scarborough York 15 Manchester Derby Northampton Leicester 16 Hereford Gloucester Circenster 17 Beverley Hull Lincoln Boston 18 Whitehaven Liverpool Macclesfield Lancaster Carlisle Kendal 19 Shrewsbury Birmingham Wolverhampton Coventry Dudley 20 Worcester Oxford 21 Kidderminster Warwick Banbury 22 Chester Lichfield Coventry
Notes and Sources: The network was constructed using data from Albert (1972), Pawson (1977), and the Great Britain, 1840).

Figures
Figure 1: The Diffusion of Turnpike Trusts, 1695-1840
0
100
200
300
400
500
600
700
800
900
1000
1700
1710
1720
1730
1740
1750
1760
1770
1780
1790
1800
1810
1820
1830
1840
Num
ber o
f Tru
sts
0
5000
10000
15000
20000
25000
Num
ber o
f Mile
s
cumulative trusts cumulative mileage Sources: Data on Acts and mileage comes from Albert (1972) and Pawson (1977).

Figure 2: Maps of the London Turnpike Network:
Panel A 1720

Panel B 1730

Panel C 1750

Panel D 1770
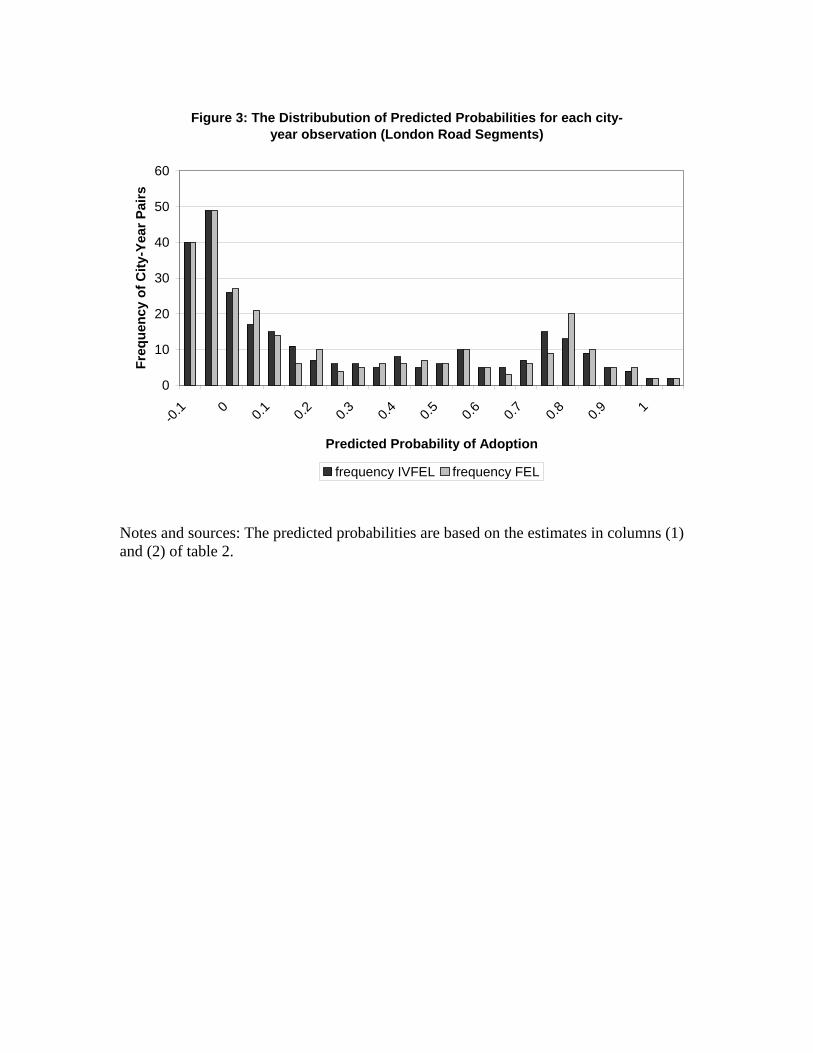
Figure 3: The Distribubution of Predicted Probabilities for each city-year observation (London Road Segments)
0
10
20
30
40
50
60
-0.1 0 0.1 0.2 0.3 0.4 0.5 0.6 0.7 0.8 0.9 1
Predicted Probability of Adoption
Freq
uenc
y of
City
-Yea
r Pai
rs
frequency IVFEL frequency FEL Notes and sources: The predicted probabilities are based on the estimates in columns (1) and (2) of table 2.

Figure 4: Survival Curve for City Turnpike Adoption along London Road Segments and all Road Segments
0
0.2
0.4
0.6
0.8
1
1.2
1694
1699
1704
1709
1714
1719
1724
1729
1734
1739
1744
1749
1754
1759
1764
1769
1774
1779
1784
1789
1794
Prop
ortio
n of
citi
es w
ithou
t tur
npik
es
london road network all roads

Figure 5: The Distribution of Predicted Probabilities for each City-year Observation (All Road Segments)
0
10
20
30
40
50
60
70
-0.25
-0.15
-0.05 0.0
50.1
50.2
50.3
50.4
50.5
50.6
50.7
50.8
50.9
51.0
51.1
5
Predicted Probability
Freq
uenc
y
IVFEL Model FEL Model Notes and sources: The predicted probabilities are based on the estimates in columns (1) and (2) of table 3.