Embed Size (px)
Citation preview
How clean isEngland?The Local Environmental Quality Survey of England 2014/15
Local Environmental Quality Survey of England (LEQSE); Analysis of 2014/15 data
Commissioned by Defra | Project ID EQ0107 | December 2015
Keep Britain Tidy is one of the nation’s leading environmental charities. Our goal is to reduce litter, improve local places and prevent waste.
We understand that we cannot reach our goals by working alone, so we work with businesses, schools, communities, individuals, government - local and national – and other charities and voluntary organisations.
We know that if people care for the environment on their own doorstep – the local park, the street in which they live, the river that runs through their area – then the environment, the community and the individual will all benefit.
How can we expect people to understand and care about global environmental issues if they don’t understand the importance of, or care about, their own local environment?
Keep Britain Tidy is an independent charity with a wealth of experience and expertise. We have been working and campaigning to eliminate litter, improve local places and prevent waste for many years. We want to share that experience and expertise with others, supporting businesses, communities, schools and government.
We fund our work by offering services and expertise to those who can benefit from them, by delivering accreditation schemes for parks, beaches, schools and public spaces and by developing relationships with partners in the corporate sector to support our research and campaign activities.
About Keep Britain Tidy
1 Keep Britain Tidy
ContentsChief Executive’s foreword
Ministerial foreword
1. Introduction to the survey ..................................... 5
2. Headline results ...................................................... 7
3. Some key findings ................................................ 10
4. Other findings from the LEQSE 2014/15 ............ 28
5. Litter mapped against deprivation ..................... 34
6. Conclusion ............................................................ 35
An illustrated overview of the Local Environmental Quality Survey of England can be viewed online.
www.keepbritaintidy.org/howcleanisengland
How clean is England? 2
Chief Executive’s forewordThere has been much talk in the recent months about litter. Is England the dirtiest country in Europe? The world? Are we getting dirtier?
There is no doubt that litter is an issue that impacts on people in communities up and down the country and, where it is a problem, it can depress property prices, increase the fear of crime and impact on economic development.
Over the past 14 years, the Local Environmental Quality Survey of England (LEQSE) has measured the cleanliness of the country, looking at indicators such as littering, graffiti and fly-posting.
And, despite all the commentaries suggesting that litter is getting worse, this report shows that litter levels have improved – if only marginally – since 2001. In fact, 90% of the 7,200 sites monitored for this report were at or above an acceptable standard for litter.
This statistic – which looks at the cleanliness of places at a given moment, not the amount of litter dropped over a period of time - is a testament to the hard work of local authorities and land managers who have managed to maintain overall standards despite years of budget cuts due to austerity.
However, efficiency savings and innovation can only take things so far and English local authorities are still spending more than £700million on street cleansing every year.
These broad statistics do not tell the whole story; the impact of litter is not felt equally by everyone. Many people will live in places where the streets are clean and tidy; where parks and beaches are litter-free.
However, what the LEQSE report does reveal is that those who live in the most deprived places in the country, also live in the places where there is the most litter, graffiti and dog fouling.
In fact, while only two per cent of sites in the most affluent areas are at an unacceptable standard for litter, in the most deprived areas this rises to 25%.
This is an unacceptable state of affairs. Keep Britain Tidy believes that everyone has the right to live and work in a place that is clean and litter-free. Until this is the case, we cannot claim to be winning the war on litter.
This year four types of litter have seen an increase – fast-food related, snack packs (e.g. crisp packets, biscuit wrappers), discarded food and drink and supermarket or retail carrier bags. 80% of sites surveyed had some ‘food-on-the-go’-related litter present.
With the rise in carrier-bag litter, large retailers in England now charge 5p for single-use plastic carrier bags. It will be interesting to see how much this contributes to a reduction in the amount of highly-visible carrier bag litter blowing about; litter that does so much environmental damage, especially when it reaches the marine environment.
We cannot assume that any single measure – whether it is a campaign, enforcement or, indeed, a charge on an item – will solve the litter problem in this country.
What we can do is test new ideas and innovations and better understand the drivers that mean that people either litter their environment or do the right thing.
If we are to reduce the amount of litter dropped in our country and, ultimately, reduce the bill we all pay to clean it up, we must change the behaviour of the one in five people who regularly drop litter. The fact that overall litter standards in this country reach a level that is deemed to be ‘acceptable’ is not the whole story.
Keep Britain Tidy is working tirelessly to deliver better quality public spaces in this country, but we cannot do it alone. Government, businesses, local authorities, communities and individuals all have a part to play and it is only by working together that we will achieve the changes and improvements that everyone wants to see.
Keep Britain Tidy’s new Centre for Social Innovation aims to act as a test bed to try out new things and see what impact they have. Not everything will work and there won’t be a single ‘magic bullet’, but ultimately, it will be a combination of things that turn our country into one where littering is socially unacceptable and we can all live and work in a place of which we can be proud – regardless of how affluent we are.
Allison Ogden-NewtonChief Executive, Keep Britain Tidy
3 Keep Britain Tidy
Ministerial forewordMargaret Thatcher, the Bee Gees, ABBA, Morecambe and Wise and Frank Bruno may not seem to have much in common, but they are all united in fighting for cleaner streets.
Tens of thousands of volunteers have worked alongside such campaigns. I am particularly grateful to Keep Britain Tidy for their hard work and dedication in developing and improving this survey – which has continued to improve over the years – and provide us with a really important insight into the problem of litter. I’d also like to thank the local council workers, the land managers, and the volunteer teams who do their utmost to ensure England is a pleasant place to live.
The environment is quite literally the land on which we walk, the water we drink, and the air that we breathe; it is with us whenever we step outside our houses. Britain has always been proud of being a tidy nation and of having parks which are safe for our children. We have only
maintained this reputation because millions of citizens are responsible in the ways in which they dispose of litter and show respect for our environment. Today, with a growing population and more and more disposable goods, the problem of litter is getting more challenging. This report demonstrates how much we should value a beautiful and well-looked after local environment in our cities and towns, and on our roads as much as in our national parks. It shows how over the last decade, we have kept the vast majority of these areas pleasant and litter-free. And for that, many people deserve praise.
But, as always, we can do better. Fast food litter is increasing. Cigarette butts and discarded chewing gum continue to be found on most sites inspected. The individual items may be small, but this persistent littering leads to considerable clean-up costs every year. I would like the industries that make these products to do more to consign
this waste to the bin, by helping to change consumers’ behaviour or by changing the products themselves.
There is no place for plastic bags wrapped around trees or floating down a stream. Even one can be a jarring sight and blight an entire area. If the experience of Wales is anything to go by, our new charge on carrier bags, coupled with a positive response from shoppers, will work well to change this for the better. We are already seeing some businesses putting the money collected into environmental causes, including tackling littering, and I hope to see more.
Ultimately, it is people’s behaviour that needs to change. I encourage Keep Britain Tidy, local authorities and others to continue to work together and preserve what we love about our beautiful country.
Rory Stewart MPParliamentary Under Secretary for Environment and Rural Affairs
How clean is England? 4
Introduction to the survey
The Local Environmental Quality Survey of England (LEQSE) has been carried out annually by Keep Britain Tidy on behalf of the Department for Environment, Food and Rural Affairs (Defra) since 2001.
The survey measures the presence of litter, but it also measures six other indicators of cleanliness:
• Detritus
• Weed growth
• Staining
• Graffiti
• Fly-posting
• Recent leaf and blossom fall
Taken as a whole, these indicators are used for assigning a qualitative score to the environmental quality of an area based on the presence of these indicators.
The result of the survey provides information on the overall cleanliness of England, which can be used by Government, local authorities, businesses and land managers to improve local environmental quality.
With litter, readers should note that many of the statistics relate to the presence or absence of litter, rather than the volume or amount dropped. However, the standards against which sites are graded as “acceptable” or not, as used for the headline results, does take into account the volume and amount of litter and the other headline indicators seen on site. Surveys are a snapshot of a site at the time surveyors arrive, so results for all elements are sensitive to how thoroughly or how recently the survey site has been cleansed before data is recorded.
Changes to the sampling methodology
In 2013/14, the way we collected the sample data was improved to better reflect the different land uses and enable us to link the data we collected to other data sets.
This revised sampling methodology has been retained for the 2014/15 survey and historic data has been weighted so that it fits with the new methodology, enabling direct comparisons to be made over time.
1
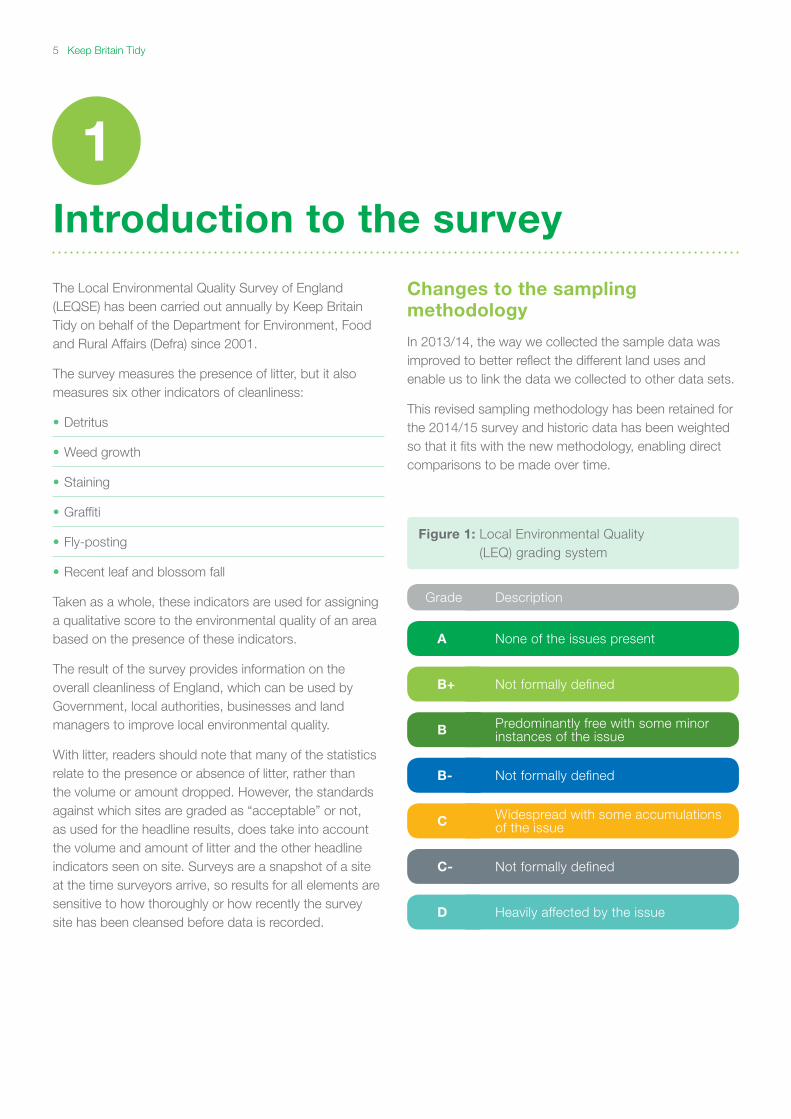
A None of the issues present
B+ Not formally defined
B Predominantly free with some minor instances of the issue
B- Not formally defined
C Widespread with some accumulations of the issue
C- Not formally defined
D Heavily affected by the issue
Grade Description
Figure 1: Local Environmental Quality (LEQ) grading system
5 Keep Britain Tidy
Survey methodology1
The surveys were carried out between April 2014 and March 2015 across 7,200 sites. The sites were selected in five local authority areas in each of the nine English regions, with GIS software used to randomly select sites where councils are responsible for their cleanliness. At each of the sites the appropriate land use was recorded for land use analysis. The ten land uses are:
• Main retail and commercial areas (MRC)
• Other retail and commercial areas (ORC)
• High-obstruction housing areas (HOH)
• Medium-obstruction housing areas (MOH)
• Low-obstruction housing areas (LOH)
• Industry, warehousing, retail sheds and science parks (I+W)
• Main roads (MR)
• Rural roads (RR)
• Other highways (OH)
• Recreation areas (REC)
In order to assess each indicator, the LEQSE survey uses a grading system based on the same principles used in Defra’s Code of Practice on Litter and Refuse2. The grades are A, B, C and D. Three additional intermediary grades have been added to the LEQSE survey to provide greater granularity to the data. The additional grades are B+, B- and C-, with grades B- and below being a fail.
1 More detailed information on the LEQSE methodology, including the definitions of the different land uses and glossary of terms, can be found at www.keepbritaintidy.org/leqse
2 Defra (2006) Code of Practice on Litter and Refuse.
How clean is England? 6
Litter
90%
Detritus
73%
Graffiti
98%
Fly-posting
100%
Re
cent
leaf and blossom
fall
88%
W
eed growth
86%
Staining
90%
Headline results
Overall standard of local environmental quality across England
Headline indicators
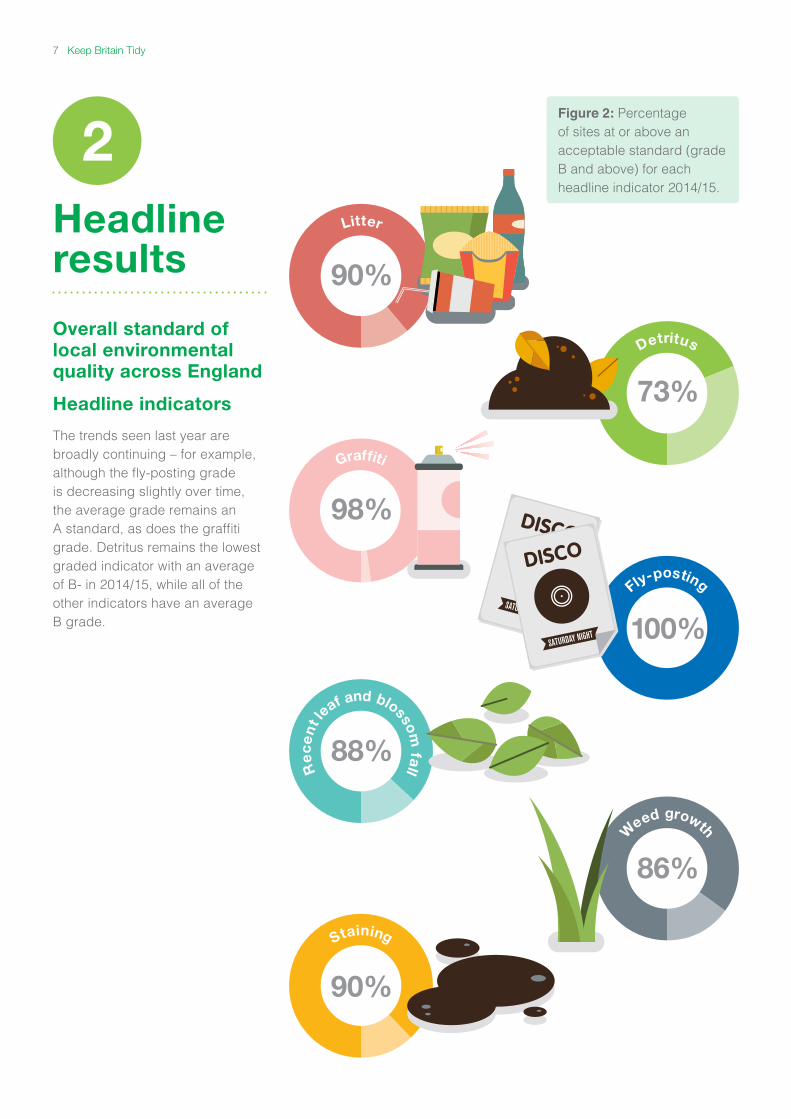
The trends seen last year are broadly continuing – for example, although the fly-posting grade is decreasing slightly over time, the average grade remains an A standard, as does the graffiti grade. Detritus remains the lowest graded indicator with an average of B- in 2014/15, while all of the other indicators have an average B grade.
Figure 2: Percentage of sites at or above an acceptable standard (grade B and above) for each headline indicator 2014/15.
2
7 Keep Britain Tidy
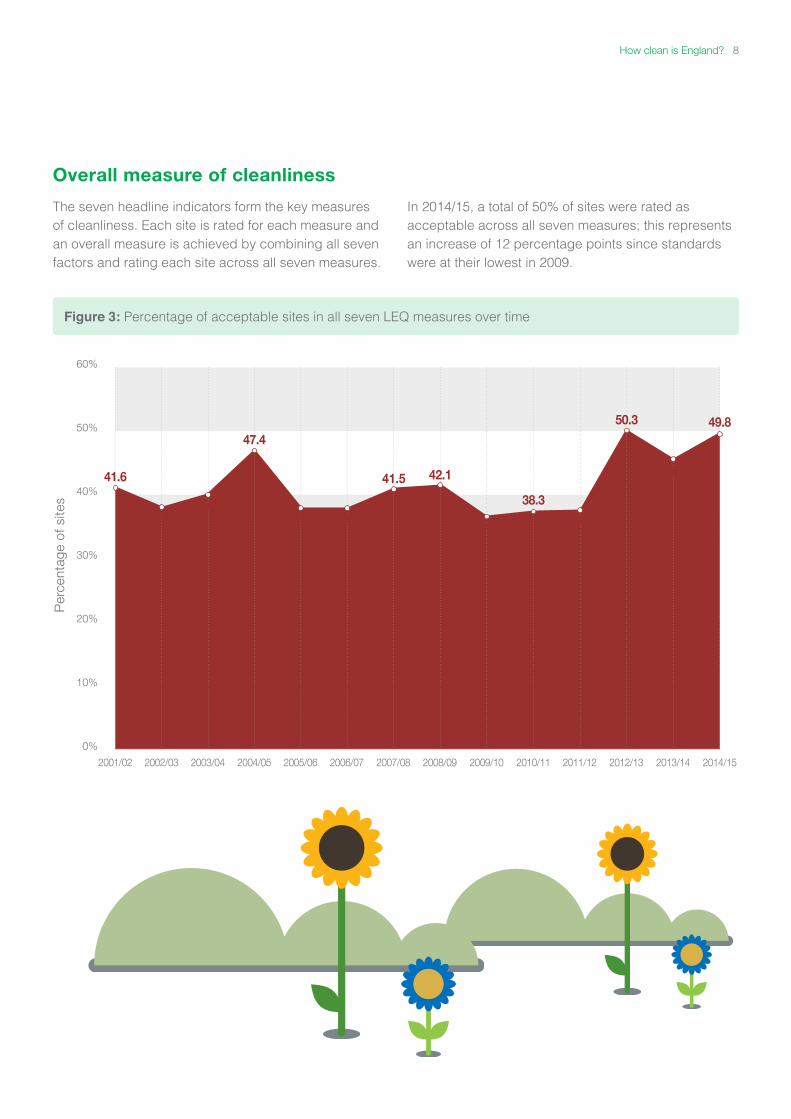
Figure 3: Percentage of acceptable sites in all seven LEQ measures over time
Overall measure of cleanliness
The seven headline indicators form the key measures of cleanliness. Each site is rated for each measure and an overall measure is achieved by combining all seven factors and rating each site across all seven measures.
In 2014/15, a total of 50% of sites were rated as acceptable across all seven measures; this represents an increase of 12 percentage points since standards were at their lowest in 2009.
Per
cent
age
of s
ites
60%
50%
40%
30%
20%
10%
0%
2005/062003/04 2004/05 2006/07 2007/08 2008/09 2009/10 2010/11 2011/12 2012/13 2014/152013/142001/02 2002/03
38.640.7
47.4
38.7
41.5 42.1
37.4
38.338.4
50.3 49.8
46.041.6
38.7
How clean is England? 8
Assessment of indicators over time
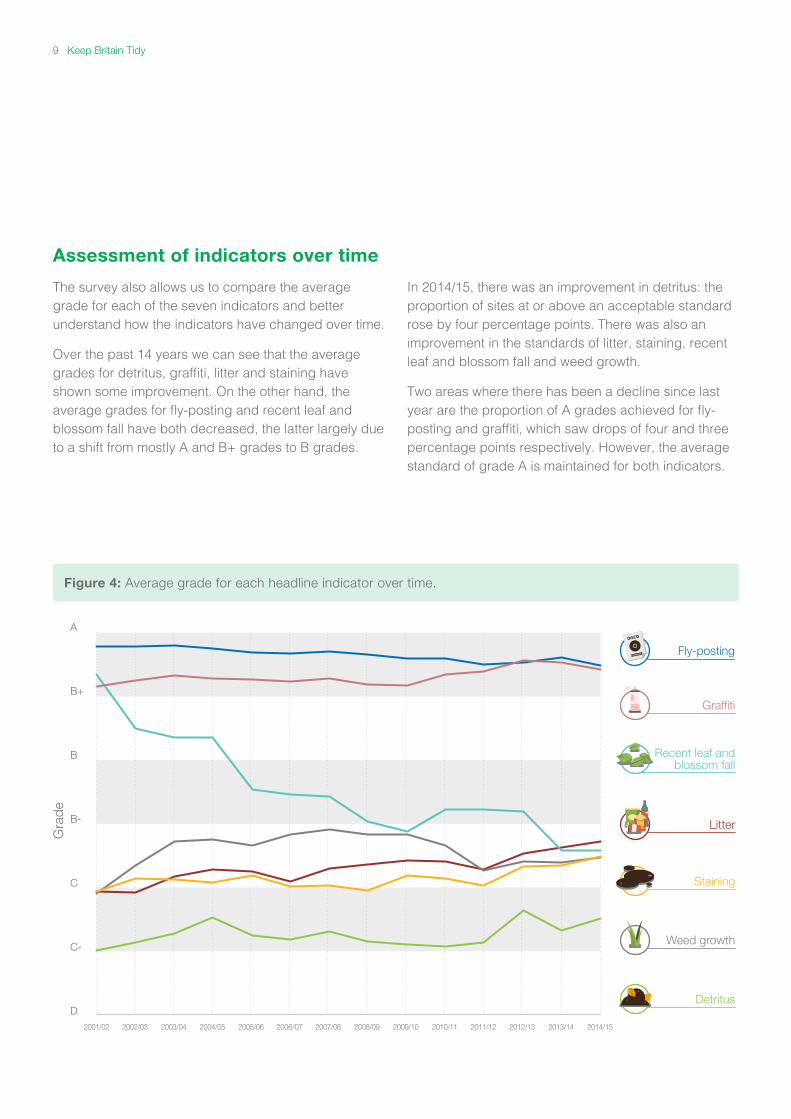
The survey also allows us to compare the average grade for each of the seven indicators and better understand how the indicators have changed over time.
Over the past 14 years we can see that the average grades for detritus, graffiti, litter and staining have shown some improvement. On the other hand, the average grades for fly-posting and recent leaf and blossom fall have both decreased, the latter largely due to a shift from mostly A and B+ grades to B grades.
In 2014/15, there was an improvement in detritus: the proportion of sites at or above an acceptable standard rose by four percentage points. There was also an improvement in the standards of litter, staining, recent leaf and blossom fall and weed growth.
Two areas where there has been a decline since last year are the proportion of A grades achieved for fly-posting and graffiti, which saw drops of four and three percentage points respectively. However, the average standard of grade A is maintained for both indicators.
Gra
de
A
B+
B
B-
C
C-
DDetritus
Weed growth
Recent leaf andblossom fall
Staining
Fly-posting
Graffiti
2001/02 2013/14 2014/152012/132011/122010/112009/102008/092007/082006/072005/062004/052003/042002/03
Litter
Figure 4: Average grade for each headline indicator over time.
9 Keep Britain Tidy
Some key findings
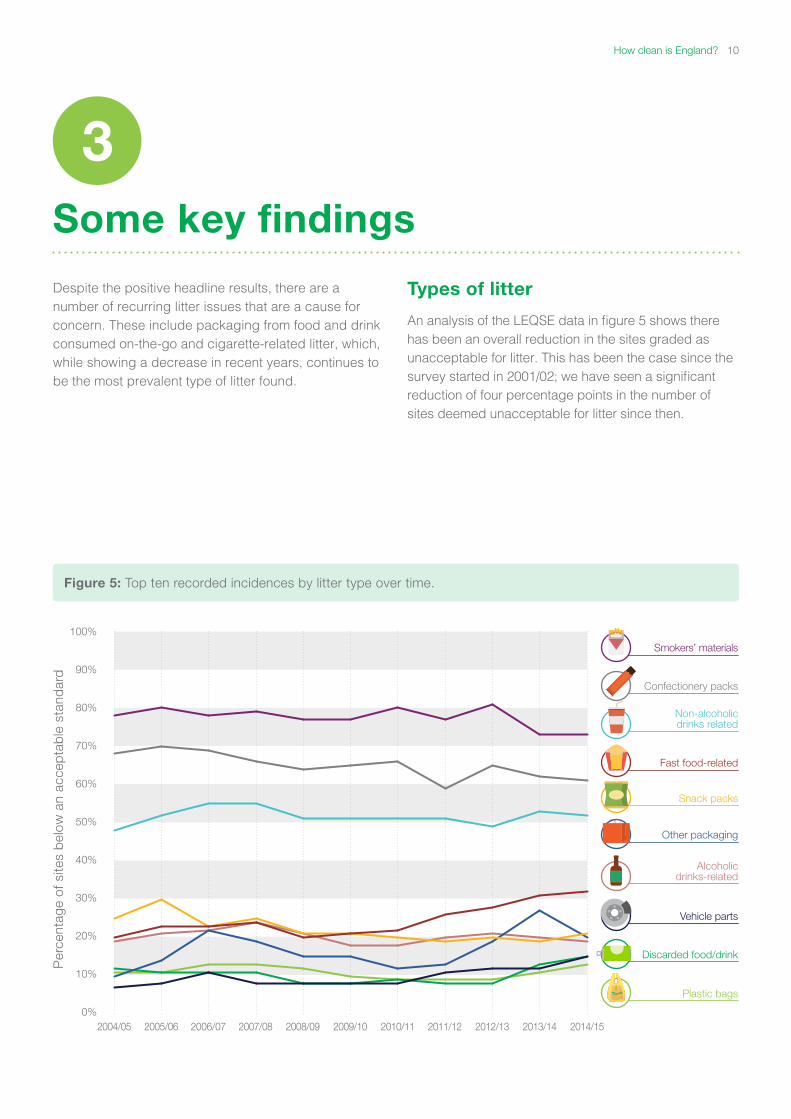
Despite the positive headline results, there are a number of recurring litter issues that are a cause for concern. These include packaging from food and drink consumed on-the-go and cigarette-related litter, which, while showing a decrease in recent years, continues to be the most prevalent type of litter found.
Types of litter
An analysis of the LEQSE data in figure 5 shows there has been an overall reduction in the sites graded as unacceptable for litter. This has been the case since the survey started in 2001/02; we have seen a significant reduction of four percentage points in the number of sites deemed unacceptable for litter since then.
3
Per
cent
age
of s
ites
bel
ow a
n ac
cep
tab
le s
tand
ard
100%
90%
80%
70%
60%
50%
40%
30%
20%
10%
0%2006/07 2007/082005/06 2008/092004/05 2009/10 2010/11 2011/12 2012/13 2014/152013/14
Smokers’ materials
Confectionery packs
Non-alcoholicdrinks related
Fast food-related
Other packaging
Alcoholicdrinks-related
Vehicle parts
Discarded food/drink
Snack packs
Plastic bags
Figure 5: Top ten recorded incidences by litter type over time.
How clean is England? 10
Prevalence of litter types
The top four litter types, comprising smokers’ materials, confectionery packs, non-alcoholic drinks-related litter and fast food-related litter, remain the most prevalent. The most noticeable and encouraging change since last year has been the reduction of “other packaging” from a high level of 27% of sites, falling to 20% in 2014/15. Alcoholic drinks-related litter has also fallen slightly from 20% of sites to 19% in 2014/15.
Fast food-related litter continues to increase, and although snack-pack litter (which includes packaging litter that is associated with pre-baked/pre-prepared snack foods, e.g. crisp packets, biscuit packaging, cake wrappers or containers) has significantly decreased over the past 5 years from 30% to 21%, it did rise slightly in 2014/15.
Three types of litter that have significantly increased in the past two years have been plastic bags, discarded food and drink and vehicle parts; further research is needed to establish why this is the case.
Litter in some commonly observed categories carried recognisable brand identities. Roper and Parker3 undertook a pilot study that assessed the occurrence of branded litter in an urban environment. Branded litter consisted of commonly observed categories, including soft drinks, tobacco, alcohol and fast food, i.e. popular fast-moving consumer goods.
Further research by Roper and Parker found that there can be a negative effect on the public’s perception of a brand when its packaging is seen as litter4. As well as damage to the brand’s reputation, evidence suggests that branded litter may also have a financial impact. The same study found that the price customers were willing to pay for an item declined when that product was observed as litter. From a recent survey by Keep Britain Tidy, it was found that a third of respondents (34%) said they would be less inclined to buy from a brand they see as litter on the street5.
3 Roper and Parker, 2006. How (and where) the mighty have fallen: Branded Litter.
4 Roper and Parker, 2012. Doing Well by Doing Good: A Quantitative Investigation of the Litter Effect.
5 Keep Britain Tidy, 2013. Public Litter Survey.
11 Keep Britain Tidy
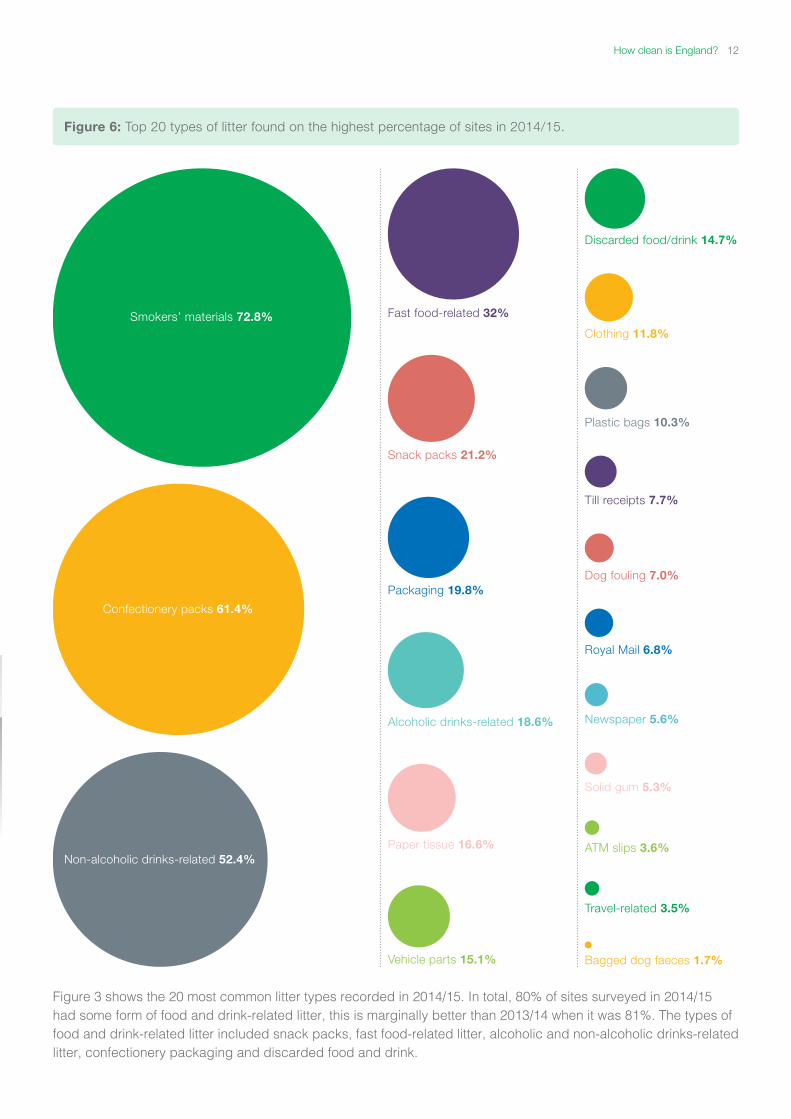
Figure 3 shows the 20 most common litter types recorded in 2014/15. In total, 80% of sites surveyed in 2014/15 had some form of food and drink-related litter, this is marginally better than 2013/14 when it was 81%. The types of food and drink-related litter included snack packs, fast food-related litter, alcoholic and non-alcoholic drinks-related litter, confectionery packaging and discarded food and drink.
Figure 6: Top 20 types of litter found on the highest percentage of sites in 2014/15.
Smokers’ materials 72.8% Fast food-related 32%
Snack packs 21.2%
Packaging 19.8%
Alcoholic drinks-related 18.6%
Paper tissue 16.6%
Vehicle parts 15.1%
Discarded food/drink 14.7%
Clothing 11.8%
Plastic bags 10.3%
Till receipts 7.7%
Dog fouling 7.0%
Royal Mail 6.8%
Newspaper 5.6%
Solid gum 5.3%
ATM slips 3.6%
Travel-related 3.5%
Bagged dog faeces 1.7%
Confectionery packs 61.4%
Non-alcoholic drinks-related 52.4%
How clean is England? 12
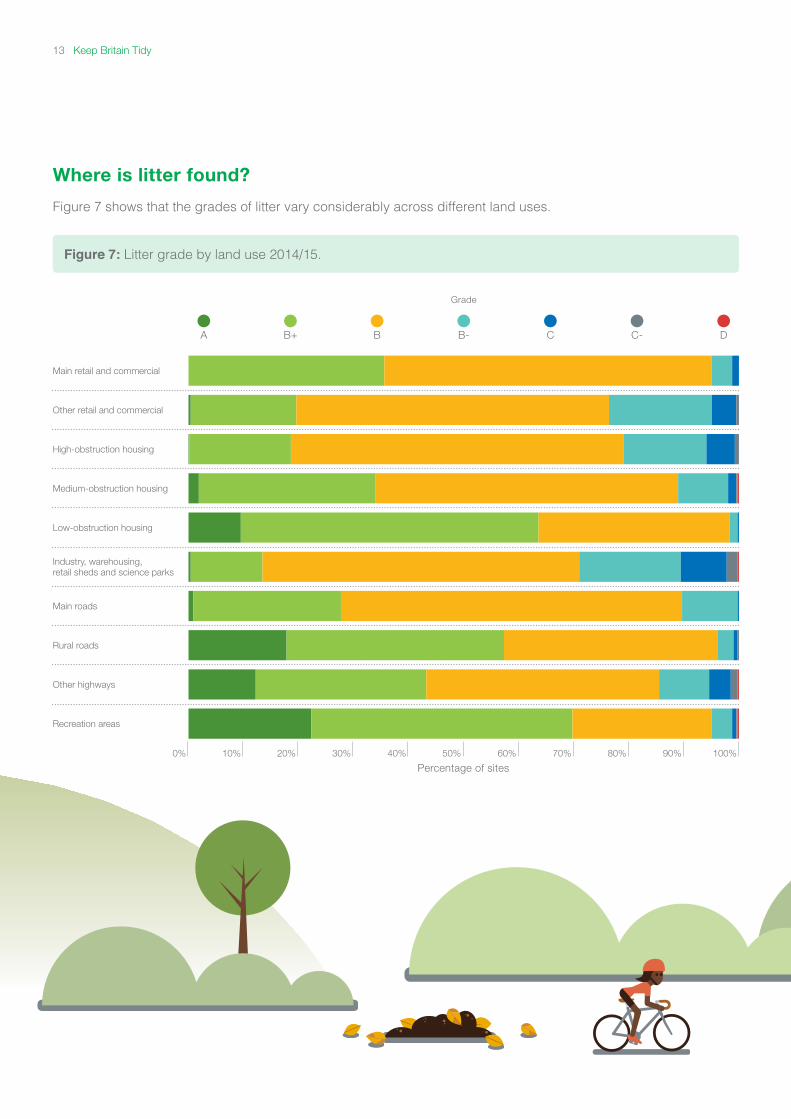
Where is litter found?
Figure 7 shows that the grades of litter vary considerably across different land uses.
Figure 7: Litter grade by land use 2014/15.
Recreation areas
Other highways
Industry, warehousing, retail sheds and science parks
High-obstruction housing
Rural roads
Low-obstruction housing
Other retail and commercial
Main roads
Medium-obstruction housing
Main retail and commercial
Grade
100%30% 60% 70%10% 40%0% 80% 90%20% 50%
Percentage of sites
A B C-B+ CB- D
13 Keep Britain Tidy
The survey results show that generally the less intensively used an area is, such as low-obstruction housing (housing where more than 50% of properties have purpose-made off-road garaging/parking within the property boundary for three or more modern day family cars) or rural roads (adopted highways that are located outside built-up areas), the less litter that is found there. Land uses that are more intensively used, including other retail and commercial (those outside main city and town retail and commercial centres) and high-obstruction housing (the proportion of dwellings with purpose-made off-street parking facilities less than or equal to 50%) are often seen to have a poorer average standard for litter. Further research could help establish why this is the case. For example, is it due to the difficulty in implementing an effective cleansing regime in areas with lots of obstructions, or are there other reasons that affect the cleansing of such areas? Standards in main retail and commercial areas, recreation areas (such as public open spaces including parks, recreation, grassed, picnic sites), and paved areas tend to be higher, as they are usually cleansed more intensively than other land uses.
The survey shows that, while other retail and commercial areas are overwhelmingly a grade B on average, this compares relatively poorly to recreation areas or low-obstruction housing, which average at a grade B+, with over 21% of recreation areas achieving a grade A for litter.
Similar to the results of the 2013/14 survey, the proportion of sites below an acceptable standard in low-obstruction housing areas (2%), recreation areas (4%) and rural roads (3%) is very low. Medium-obstruction housing (where more than 50% of dwellings have purpose-made off-street parking/garaging facilities for up to two modern day family cars) and main roads (ie all “A” roads) also have relatively few failing sites, with only around 10% of the sites surveyed failing to reach an acceptable standard.
On the other hand, in 2014/15, industry and warehousing (this includes industrial and warehousing developments, out-of-town retail parks including food and non-food developments and science parks containing offices, laboratories and manufacturing processes) had the highest number of sites that failed to meet the acceptable standard, increasing from 25% to 29%. High-obstruction housing and other retail and commercial areas also faired relatively poorly, with 21% and 22% of sites respectively failing to meet the acceptable standard of grade B and above.
How clean is England? 14
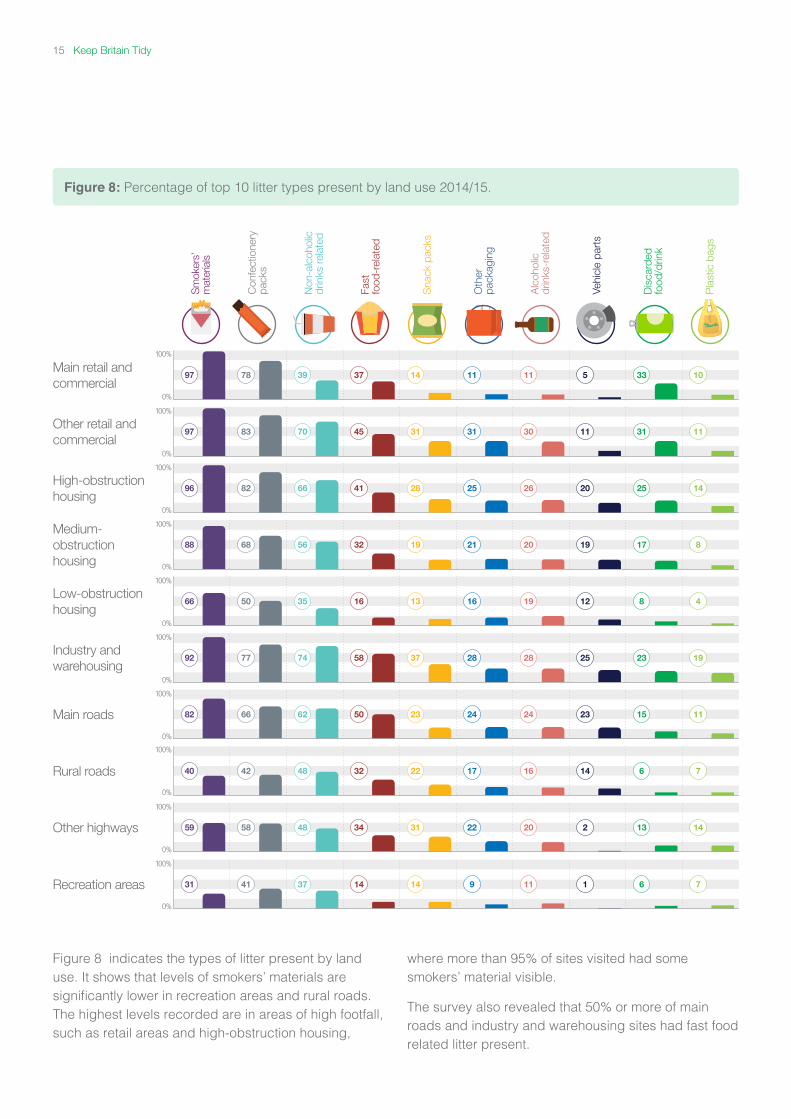
Figure 8 indicates the types of litter present by land use. It shows that levels of smokers’ materials are significantly lower in recreation areas and rural roads. The highest levels recorded are in areas of high footfall, such as retail areas and high-obstruction housing,
where more than 95% of sites visited had some smokers’ material visible.
The survey also revealed that 50% or more of main roads and industry and warehousing sites had fast food related litter present.
Figure 8: Percentage of top 10 litter types present by land use 2014/15.
Main retail and commercial
Other retail and commercial
High-obstruction housing
Medium-obstruction housing
Low-obstruction housing
Industry and warehousing
Main roads
Rural roads
Other highways
Recreation areas
97 78 39 37 14 11 11 5 10
96 82 66 41 28 25 26 20 14
88 68 56 32 19 21 20 19 8
97 83 70 45 31 31 30 11 11
66 50 35 16 13 16 19 12 4
92 77 74 58 37 28 28 25 19
82 66 62 50 23 24 24 23 11
40 42 48 32 22 17 16 14 7
59 58 48 34 31 22 20 2 14
31 41 37 14 14 9 11 1 7
Sm
oker
s’m
ater
ials
Con
fect
ione
rypa
cks
Non
-alc
ohol
icdr
inks
rela
ted
Fast
fo
od-r
elat
ed
Oth
erpa
ckag
ing
Alc
ohol
icdr
inks
-rel
ated
Vehi
cle
part
s
Dis
card
edfo
od/d
rink
Sna
ck p
acks
Pla
stic
bag
s
100%
0%
100%
0%
100%
0%
100%
0%
100%
0%
100%
0%
100%
0%
100%
0%
100%
0%
100%
0%
33
25
17
31
8
23
15
6
13
6
15 Keep Britain Tidy
Per
cent
age
of s
ites
100%
90%
80%
70%
60%
50%
40%
30%
20%
10%
0%2004/05
20.1
2005/06
23.2
2006/07
23.3
2007/08
23.8
2008/09
20
2009/10
21.3
2010/11
21.7
2011/12
26.4
2012/13
28.1
2014/15
32.0
2013/14
31.1
Fast food-related litter
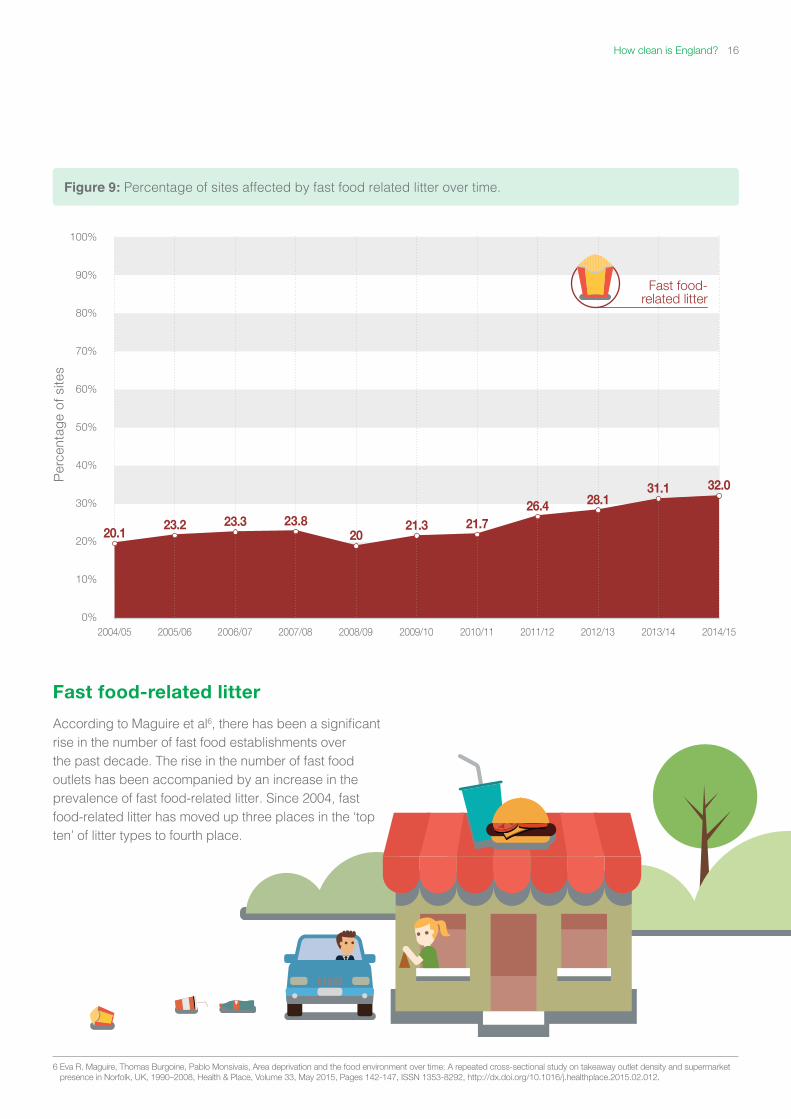
Figure 9: Percentage of sites affected by fast food related litter over time.
6 Eva R. Maguire, Thomas Burgoine, Pablo Monsivais, Area deprivation and the food environment over time: A repeated cross-sectional study on takeaway outlet density and supermarket presence in Norfolk, UK, 1990–2008, Health & Place, Volume 33, May 2015, Pages 142-147, ISSN 1353-8292, http://dx.doi.org/10.1016/j.healthplace.2015.02.012.
Fast food-related litter
According to Maguire et al6, there has been a significant rise in the number of fast food establishments over the past decade. The rise in the number of fast food outlets has been accompanied by an increase in the prevalence of fast food-related litter. Since 2004, fast food-related litter has moved up three places in the ‘top ten’ of litter types to fourth place.
How clean is England? 16
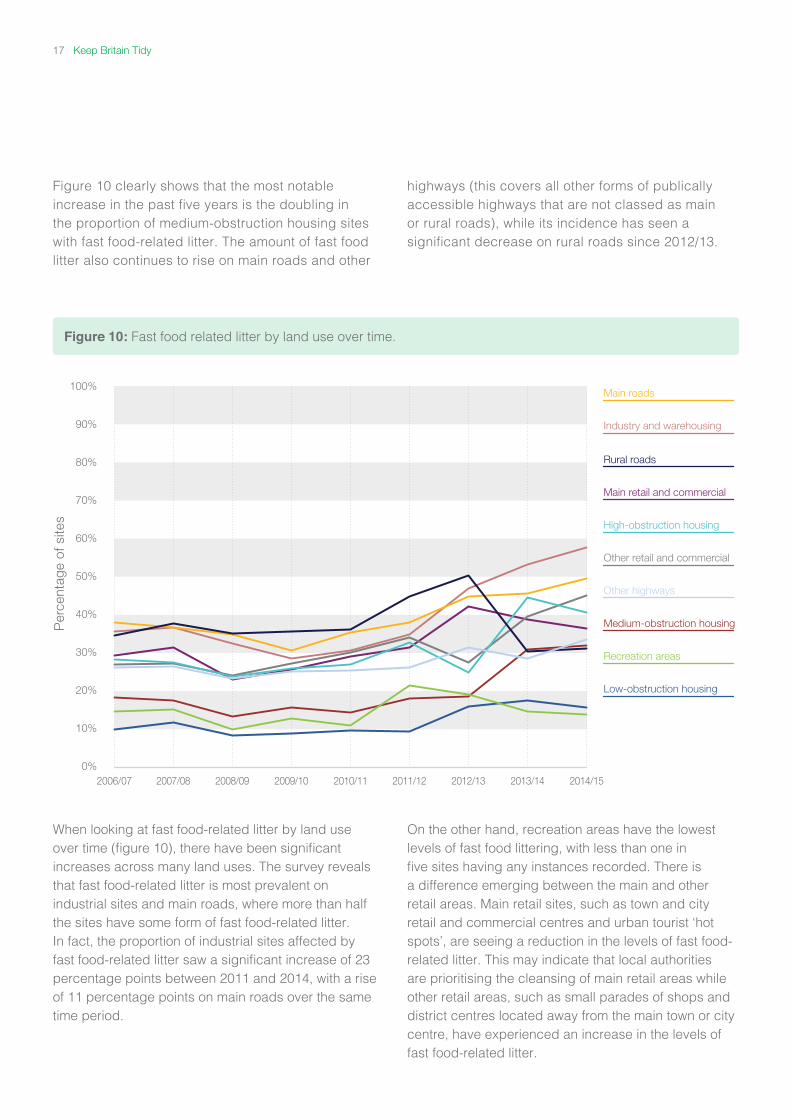
Figure 10 clearly shows that the most notable increase in the past five years is the doubling in the proportion of medium-obstruction housing sites with fast food-related litter. The amount of fast food litter also continues to rise on main roads and other
highways (this covers all other forms of publically accessible highways that are not classed as main or rural roads), while its incidence has seen a significant decrease on rural roads since 2012/13.
When looking at fast food-related litter by land use over time (figure 10), there have been significant increases across many land uses. The survey reveals that fast food-related litter is most prevalent on industrial sites and main roads, where more than half the sites have some form of fast food-related litter. In fact, the proportion of industrial sites affected by fast food-related litter saw a significant increase of 23 percentage points between 2011 and 2014, with a rise of 11 percentage points on main roads over the same time period.
On the other hand, recreation areas have the lowest levels of fast food littering, with less than one in five sites having any instances recorded. There is a difference emerging between the main and other retail areas. Main retail sites, such as town and city retail and commercial centres and urban tourist ‘hot spots’, are seeing a reduction in the levels of fast food-related litter. This may indicate that local authorities are prioritising the cleansing of main retail areas while other retail areas, such as small parades of shops and district centres located away from the main town or city centre, have experienced an increase in the levels of fast food-related litter.
Figure 10: Fast food related litter by land use over time.
Per
cent
age
of s
ites
100%
90%
80%
70%
60%
50%
40%
30%
20%
10%
0%2007/08 2008/09 2009/10 2010/11 2011/12 2012/13 2014/152013/142006/07
Main retail and commercial
Other retail and commercial
High-obstruction housing
Medium-obstruction housing
Low-obstruction housing
Industry and warehousing
Main roads
Rural roads
Other highways
Recreation areas
17 Keep Britain Tidy
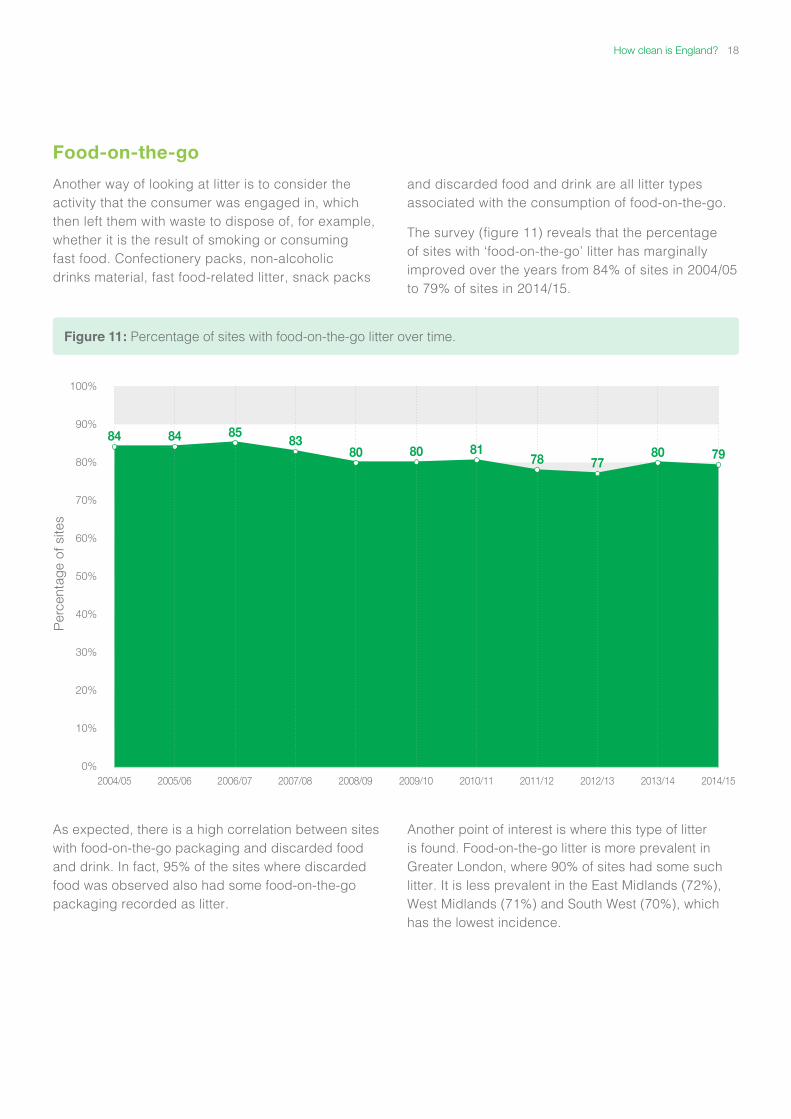
Food-on-the-go
Another way of looking at litter is to consider the activity that the consumer was engaged in, which then left them with waste to dispose of, for example, whether it is the result of smoking or consuming fast food. Confectionery packs, non-alcoholic drinks material, fast food-related litter, snack packs
and discarded food and drink are all litter types associated with the consumption of food-on-the-go.
The survey (figure 11) reveals that the percentage of sites with ‘food-on-the-go’ litter has marginally improved over the years from 84% of sites in 2004/05 to 79% of sites in 2014/15.
As expected, there is a high correlation between sites with food-on-the-go packaging and discarded food and drink. In fact, 95% of the sites where discarded food was observed also had some food-on-the-go packaging recorded as litter.
Another point of interest is where this type of litter is found. Food-on-the-go litter is more prevalent in Greater London, where 90% of sites had some such litter. It is less prevalent in the East Midlands (72%), West Midlands (71%) and South West (70%), which has the lowest incidence.
Figure 11: Percentage of sites with food-on-the-go litter over time.
Per
cent
age
of s
ites
100%
90%
80%
70%
60%
50%
40%
30%
20%
10%
0%2004/05 2005/06 2006/07 2007/08 2008/09 2009/10 2010/11 2011/12 2012/13 2014/152013/14
84 84 8583
80 80 8178 77
80 79
How clean is England? 18
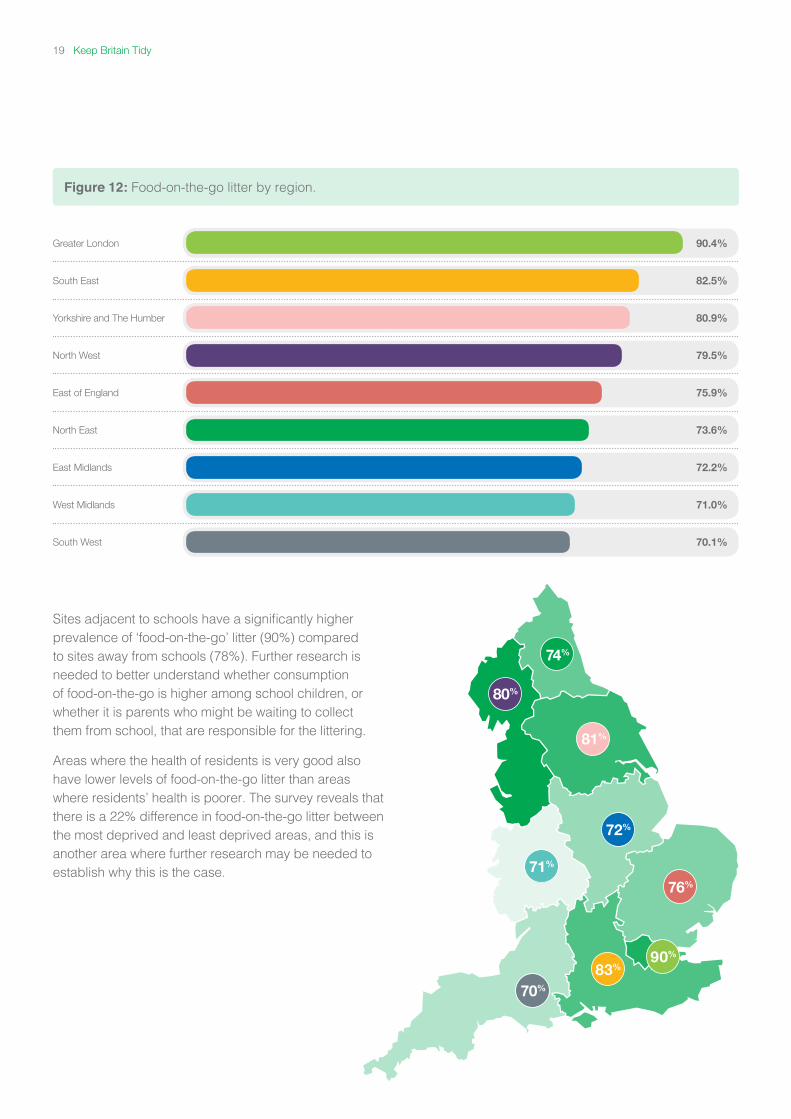
Figure 12: Food-on-the-go litter by region.
Greater London
South East
East of England
West Midlands
Yorkshire and The Humber
North East
South West
North West
East Midlands
90.4%
82.5%
75.9%
71.0%
80.9%
73.6%
70.1%
79.5%
72.2%
Sites adjacent to schools have a significantly higher prevalence of ‘food-on-the-go’ litter (90%) compared to sites away from schools (78%). Further research is needed to better understand whether consumption of food-on-the-go is higher among school children, or whether it is parents who might be waiting to collect them from school, that are responsible for the littering.
Areas where the health of residents is very good also have lower levels of food-on-the-go litter than areas where residents’ health is poorer. The survey reveals that there is a 22% difference in food-on-the-go litter between the most deprived and least deprived areas, and this is another area where further research may be needed to establish why this is the case.
76%
83%90%
70%
72%
81%
71%
74%
80%
19 Keep Britain Tidy
Smokers’ materials
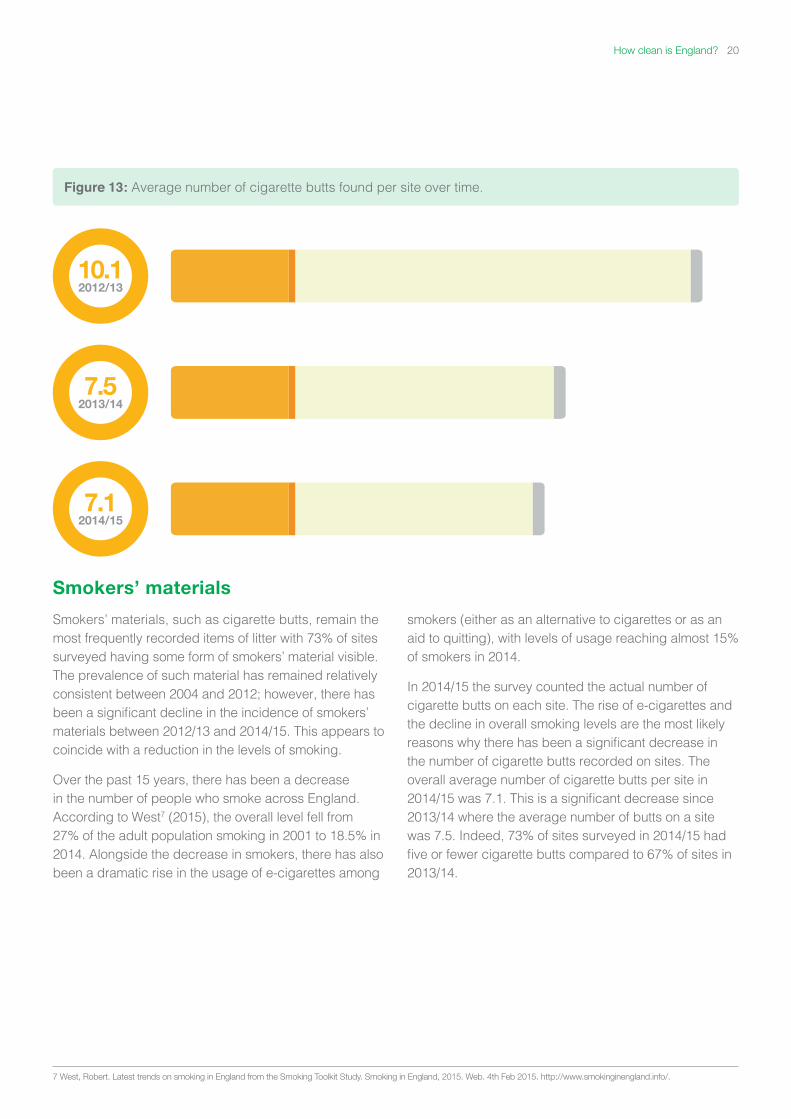
Smokers’ materials, such as cigarette butts, remain the most frequently recorded items of litter with 73% of sites surveyed having some form of smokers’ material visible. The prevalence of such material has remained relatively consistent between 2004 and 2012; however, there has been a significant decline in the incidence of smokers’ materials between 2012/13 and 2014/15. This appears to coincide with a reduction in the levels of smoking.
Over the past 15 years, there has been a decrease in the number of people who smoke across England. According to West7 (2015), the overall level fell from 27% of the adult population smoking in 2001 to 18.5% in 2014. Alongside the decrease in smokers, there has also been a dramatic rise in the usage of e-cigarettes among
smokers (either as an alternative to cigarettes or as an aid to quitting), with levels of usage reaching almost 15% of smokers in 2014.
In 2014/15 the survey counted the actual number of cigarette butts on each site. The rise of e-cigarettes and the decline in overall smoking levels are the most likely reasons why there has been a significant decrease in the number of cigarette butts recorded on sites. The overall average number of cigarette butts per site in 2014/15 was 7.1. This is a significant decrease since 2013/14 where the average number of butts on a site was 7.5. Indeed, 73% of sites surveyed in 2014/15 had five or fewer cigarette butts compared to 67% of sites in 2013/14.
7.52013/14
7.12014/15
10.12012/13
Figure 13: Average number of cigarette butts found per site over time.
7 West, Robert. Latest trends on smoking in England from the Smoking Toolkit Study. Smoking in England, 2015. Web. 4th Feb 2015. http://www.smokinginengland.info/.
How clean is England? 20
8.7
4.4
2.8
13.6
13.7
10.1
8.7
2.6
1.0
6.5
3.8
2.7
1.1
35.9
20.6
30.6
15.3
14.1
11.8
8.4
Littered cigarette butts and land use
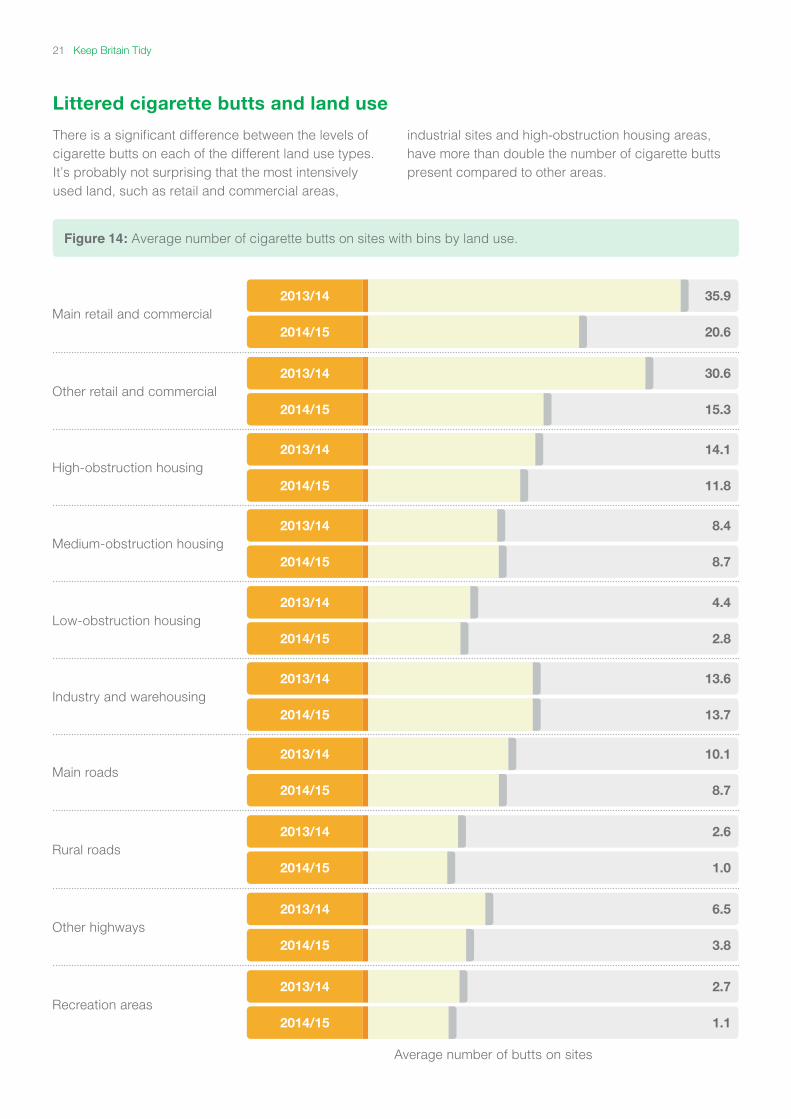
There is a significant difference between the levels of cigarette butts on each of the different land use types. It’s probably not surprising that the most intensively used land, such as retail and commercial areas,
industrial sites and high-obstruction housing areas, have more than double the number of cigarette butts present compared to other areas.
Figure 14: Average number of cigarette butts on sites with bins by land use.
Main retail and commercial
Other retail and commercial
High-obstruction housing
Medium-obstruction housing
Low-obstruction housing
Industry and warehousing
Main roads
Rural roads
Other highways
Recreation areas
2013/14
2013/14
2013/14
2013/14
2013/14
2013/14
2013/14
2013/14
2014/15
2014/15
2014/15
2014/15
2014/15
2014/15
2014/15
2014/15
2014/15
2013/14
2013/14
2014/15
Average number of butts on sites
21 Keep Britain Tidy
There have been decreases across most of the land use types (medium-obstruction housing and industry and warehousing being the exception) in the past year, with the greatest improvements being seen in retail and commercial areas (the areas identified as particularly problematic in 2013/14). It is difficult to establish why there have been such improvements in these areas. It may be as a result of more intense cleansing or enforcement regimes, or it could be linked to the reduction in smoking levels. Whatever the reason, the reduction in the number of cigarette butts by up to half is significant and welcome. Conversely and disappointingly, this improvement has not been seen in housing or industrial sites, where we have seen little or no reduction in the number of cigarette butts.
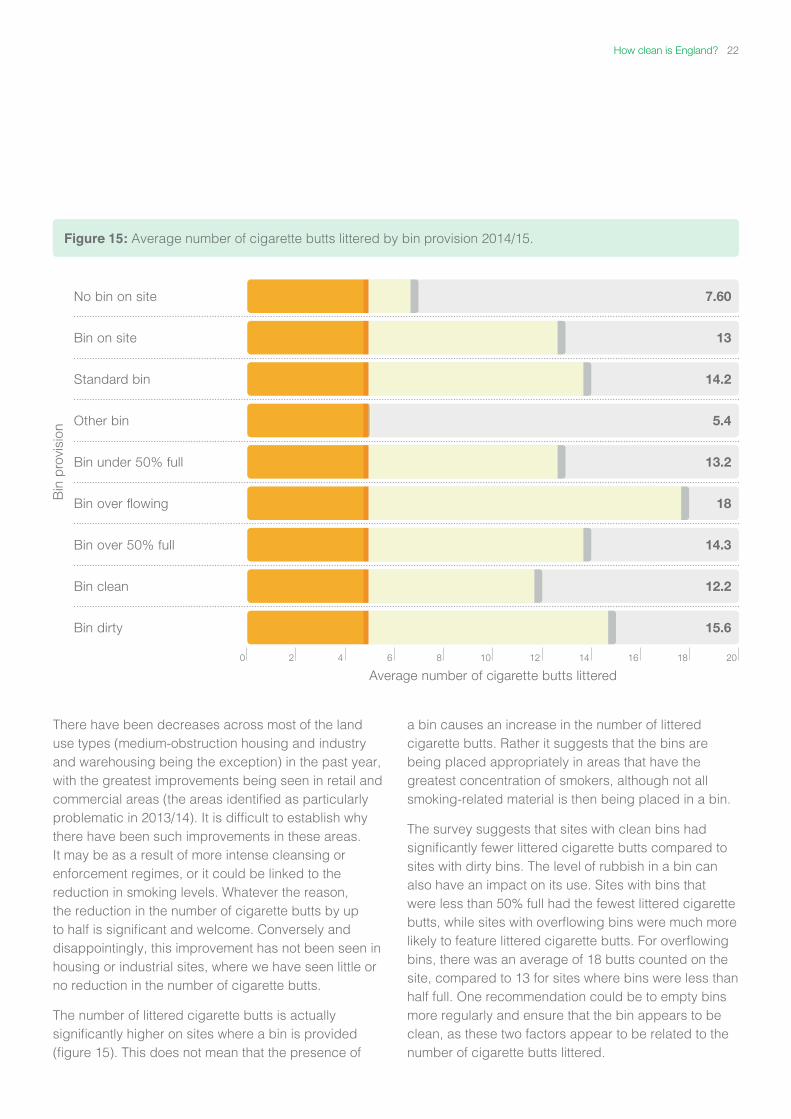
The number of littered cigarette butts is actually significantly higher on sites where a bin is provided (figure 15). This does not mean that the presence of
a bin causes an increase in the number of littered cigarette butts. Rather it suggests that the bins are being placed appropriately in areas that have the greatest concentration of smokers, although not all smoking-related material is then being placed in a bin.
The survey suggests that sites with clean bins had significantly fewer littered cigarette butts compared to sites with dirty bins. The level of rubbish in a bin can also have an impact on its use. Sites with bins that were less than 50% full had the fewest littered cigarette butts, while sites with overflowing bins were much more likely to feature littered cigarette butts. For overflowing bins, there was an average of 18 butts counted on the site, compared to 13 for sites where bins were less than half full. One recommendation could be to empty bins more regularly and ensure that the bin appears to be clean, as these two factors appear to be related to the number of cigarette butts littered.
Figure 15: Average number of cigarette butts littered by bin provision 2014/15.
7.60
13
14.2
5.4
13.2
18
14.3
12.2
15.6
No bin on site
Bin on site
Standard bin
Other bin
Bin under 50% full
Bin over flowing
Bin over 50% full
Bin clean
Bin dirty
6 12 14 182 80 16 204 10
Average number of cigarette butts littered
Bin
pro
visi
onHow clean is England? 22
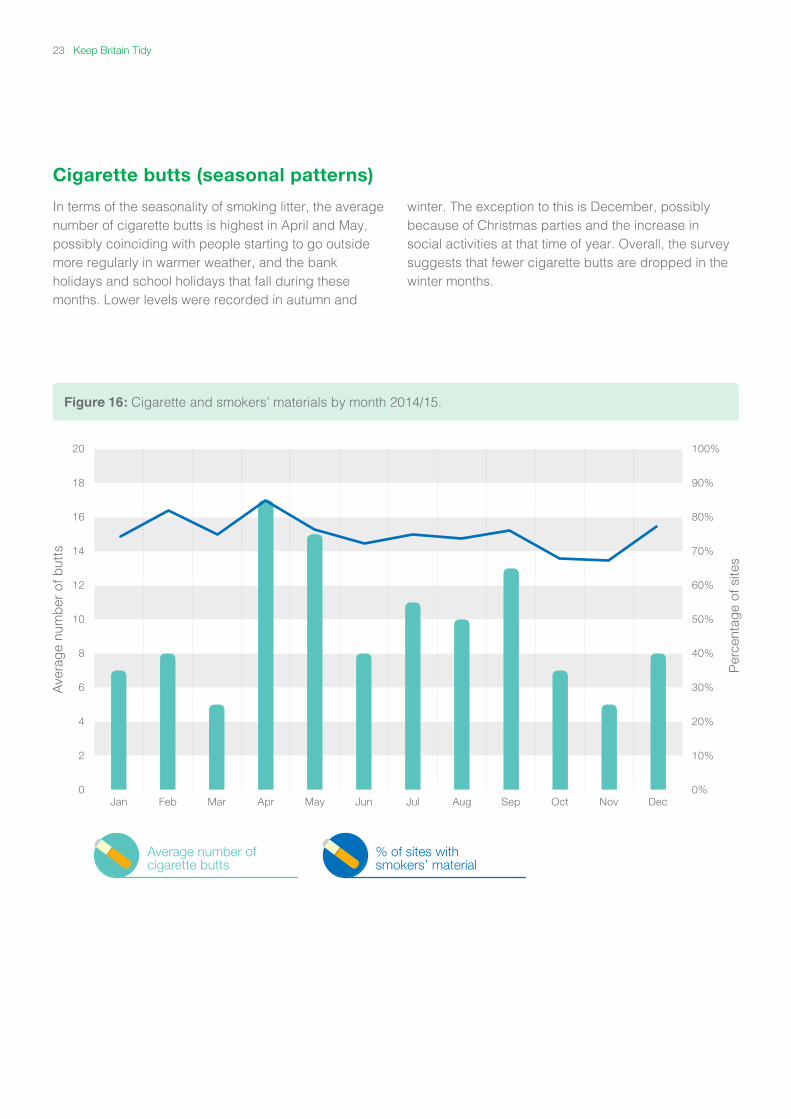
Cigarette butts (seasonal patterns)
In terms of the seasonality of smoking litter, the average number of cigarette butts is highest in April and May, possibly coinciding with people starting to go outside more regularly in warmer weather, and the bank holidays and school holidays that fall during these months. Lower levels were recorded in autumn and
winter. The exception to this is December, possibly because of Christmas parties and the increase in social activities at that time of year. Overall, the survey suggests that fewer cigarette butts are dropped in the winter months.
Figure 16: Cigarette and smokers’ materials by month 2014/15.
Jan MayMar Jul Oct Nov DecFeb Jun SepApr Aug
20
18
16
14
12
10
8
6
4
2
0
100%
90%
80%
70%
60%
50%
40%
30%
20%
10%
0%
Ave
rage
num
ber
of b
utts
Per
cent
age
of s
ites
Average number of cigarette butts
% of sites with smokers’ material
23 Keep Britain Tidy
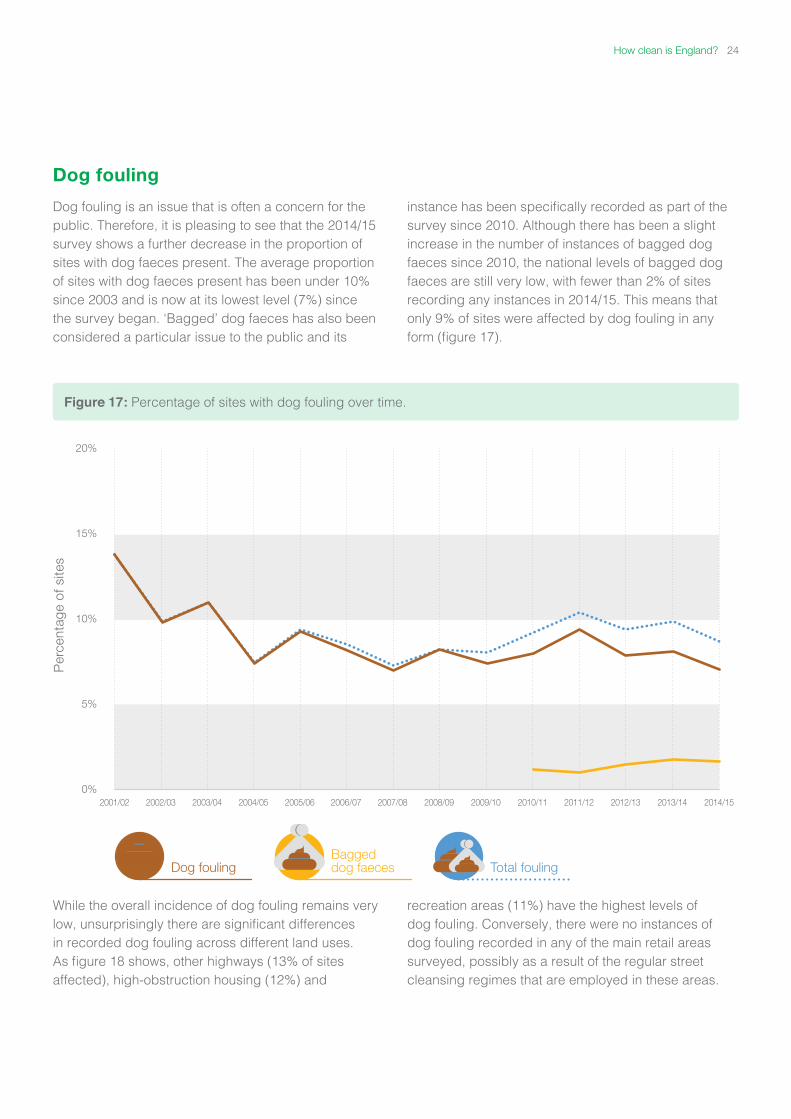
Dog fouling
Dog fouling is an issue that is often a concern for the public. Therefore, it is pleasing to see that the 2014/15 survey shows a further decrease in the proportion of sites with dog faeces present. The average proportion of sites with dog faeces present has been under 10% since 2003 and is now at its lowest level (7%) since the survey began. ‘Bagged’ dog faeces has also been considered a particular issue to the public and its
instance has been specifically recorded as part of the survey since 2010. Although there has been a slight increase in the number of instances of bagged dog faeces since 2010, the national levels of bagged dog faeces are still very low, with fewer than 2% of sites recording any instances in 2014/15. This means that only 9% of sites were affected by dog fouling in any form (figure 17).
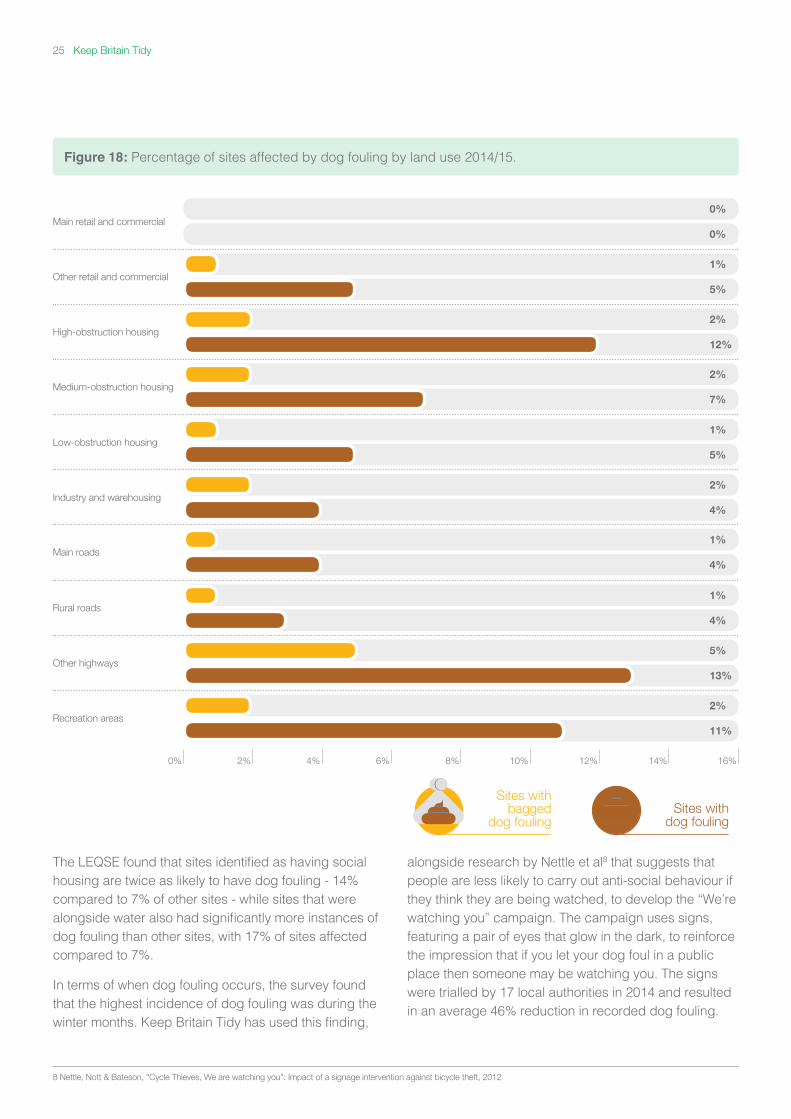
While the overall incidence of dog fouling remains very low, unsurprisingly there are significant differences in recorded dog fouling across different land uses. As figure 18 shows, other highways (13% of sites affected), high-obstruction housing (12%) and
recreation areas (11%) have the highest levels of dog fouling. Conversely, there were no instances of dog fouling recorded in any of the main retail areas surveyed, possibly as a result of the regular street cleansing regimes that are employed in these areas.
Per
cent
age
of s
ites
20%
15%
10%
5%
0%2001/02 2003/04 2005/062004/052002/03 2006/07 2007/08 2008/09 2009/10 2010/11 2011/12 2012/13 2014/152013/14
Figure 17: Percentage of sites with dog fouling over time.
Baggeddog faecesDog fouling Total fouling
How clean is England? 24
The LEQSE found that sites identified as having social housing are twice as likely to have dog fouling - 14% compared to 7% of other sites - while sites that were alongside water also had significantly more instances of dog fouling than other sites, with 17% of sites affected compared to 7%.
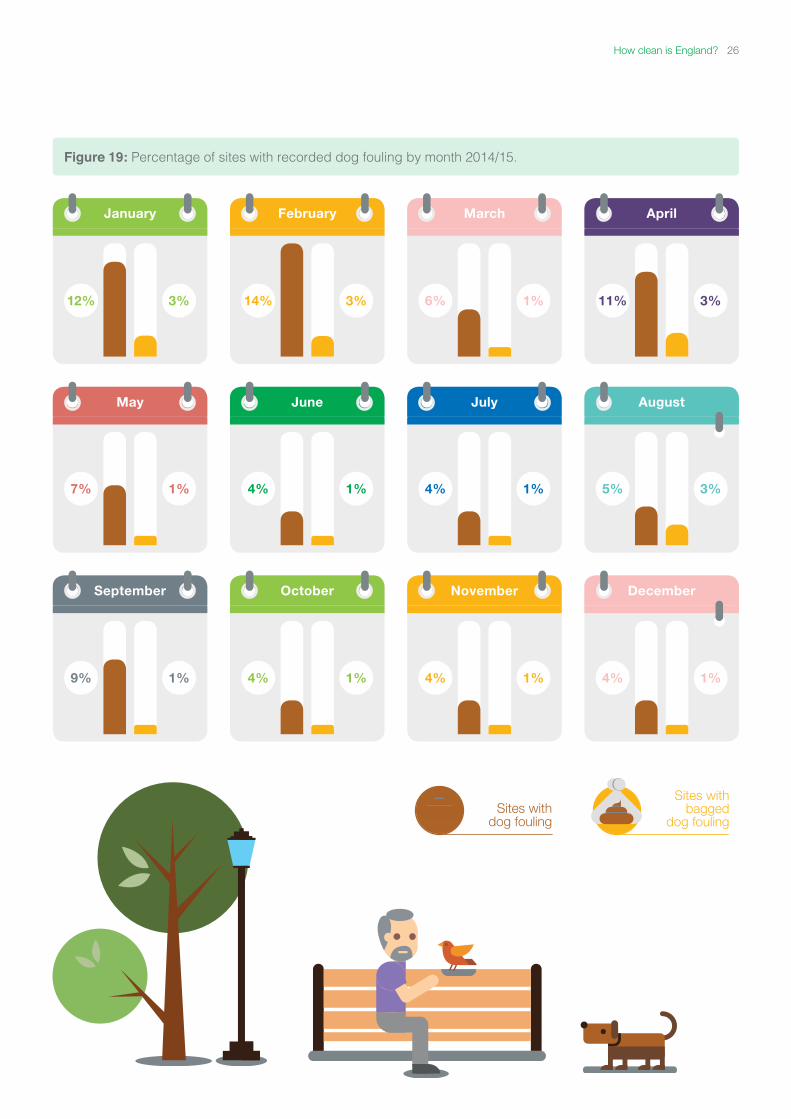
In terms of when dog fouling occurs, the survey found that the highest incidence of dog fouling was during the winter months. Keep Britain Tidy has used this finding,
alongside research by Nettle et al8 that suggests that people are less likely to carry out anti-social behaviour if they think they are being watched, to develop the “We’re watching you” campaign. The campaign uses signs, featuring a pair of eyes that glow in the dark, to reinforce the impression that if you let your dog foul in a public place then someone may be watching you. The signs were trialled by 17 local authorities in 2014 and resulted in an average 46% reduction in recorded dog fouling.
Figure 18: Percentage of sites affected by dog fouling by land use 2014/15.
Sites withdog fouling
Sites withbagged
dog fouling
6% 12% 14%2% 8%0% 16%4% 10%
Recreation areas2%
11%
Industry and warehousing2%
4%
Other highways5%
13%
Low-obstruction housing1%
5%
Rural roads1%
4%
Medium-obstruction housing2%
7%
Other retail and commercial1%
5%
Main roads1%
4%
High-obstruction housing2%
12%
Main retail and commercial0%
0%
8 Nettle, Nott & Bateson, “Cycle Thieves, We are watching you”: Impact of a signage intervention against bicycle theft, 2012
25 Keep Britain Tidy
12% 3% 14% 3% 6% 1% 11% 3%
May
September
June
October
March
July
November
April
August
December
Figure 19: Percentage of sites with recorded dog fouling by month 2014/15.
Sites withdog fouling
Sites withbagged
dog fouling
January February
7% 1% 4% 1% 4% 1% 5% 3%
9% 1% 4% 1% 4% 1% 4% 1%
How clean is England? 26
Per
cent
age
of s
ites
20%
18%
16%
14%
12%
10%
8%
6%
4%
2%
0%2005/062004/05 2006/07 2007/08 2008/09 2009/10 2010/11 2011/12 2012/13 2014/152013/14
Other/non-branded
bagsAll plastic bagsSupermarket
bags
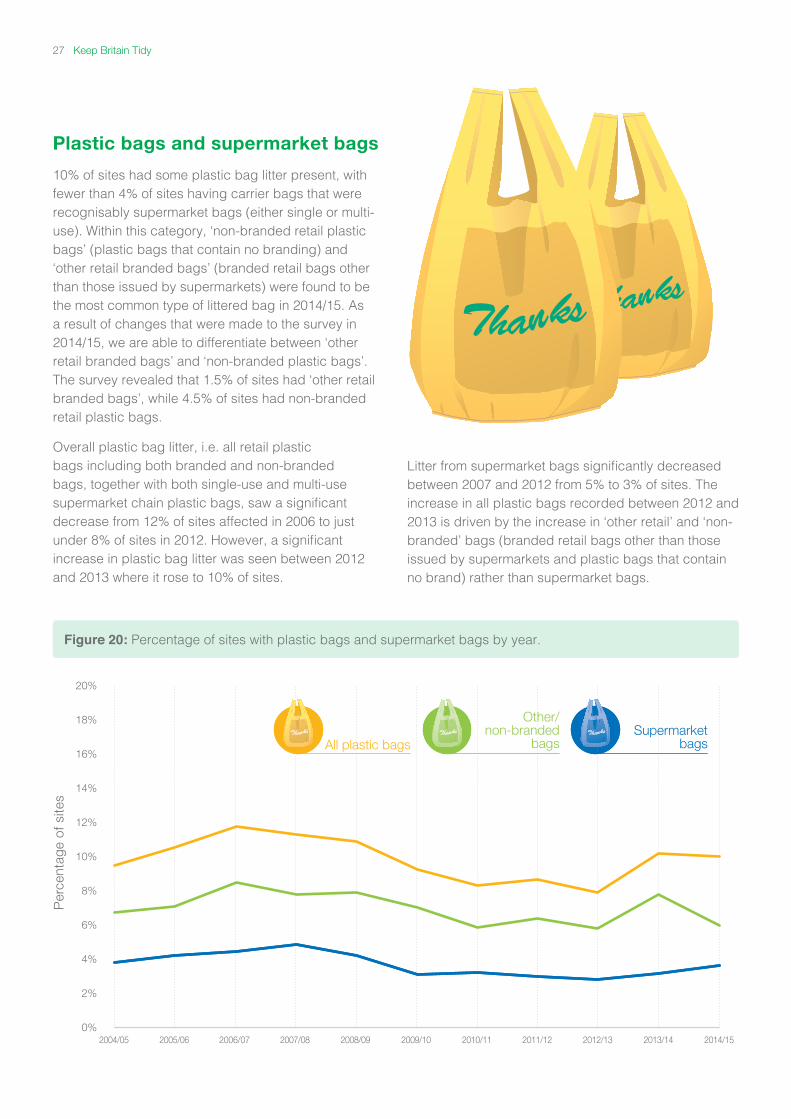
Figure 20: Percentage of sites with plastic bags and supermarket bags by year.
Plastic bags and supermarket bags
10% of sites had some plastic bag litter present, with fewer than 4% of sites having carrier bags that were recognisably supermarket bags (either single or multi-use). Within this category, ‘non-branded retail plastic bags’ (plastic bags that contain no branding) and ‘other retail branded bags’ (branded retail bags other than those issued by supermarkets) were found to be the most common type of littered bag in 2014/15. As a result of changes that were made to the survey in 2014/15, we are able to differentiate between ‘other retail branded bags’ and ‘non-branded plastic bags’. The survey revealed that 1.5% of sites had ‘other retail branded bags’, while 4.5% of sites had non-branded retail plastic bags.
Overall plastic bag litter, i.e. all retail plastic bags including both branded and non-branded bags, together with both single-use and multi-use supermarket chain plastic bags, saw a significant decrease from 12% of sites affected in 2006 to just under 8% of sites in 2012. However, a significant increase in plastic bag litter was seen between 2012 and 2013 where it rose to 10% of sites.
Litter from supermarket bags significantly decreased between 2007 and 2012 from 5% to 3% of sites. The increase in all plastic bags recorded between 2012 and 2013 is driven by the increase in ‘other retail’ and ‘non-branded’ bags (branded retail bags other than those issued by supermarkets and plastic bags that contain no brand) rather than supermarket bags.
27 Keep Britain Tidy
Other findings from the LEQSE 2014/15
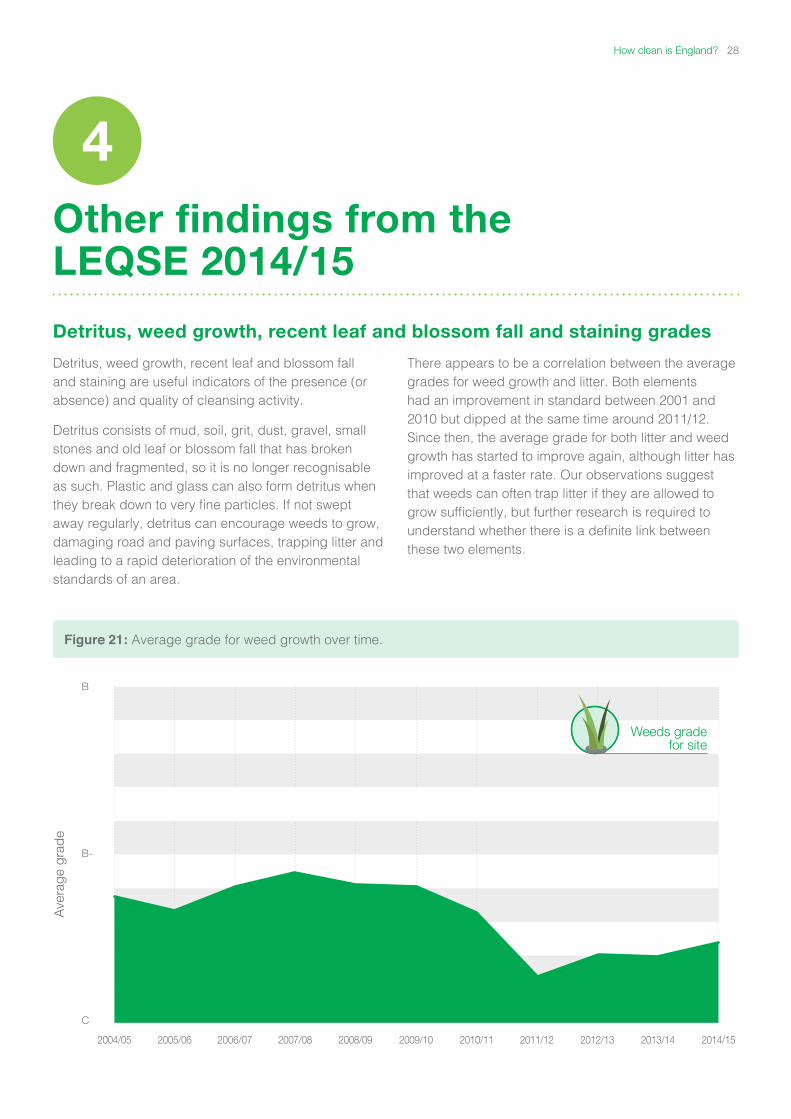
Detritus, weed growth, recent leaf and blossom fall and staining grades
Detritus, weed growth, recent leaf and blossom fall and staining are useful indicators of the presence (or absence) and quality of cleansing activity.
Detritus consists of mud, soil, grit, dust, gravel, small stones and old leaf or blossom fall that has broken down and fragmented, so it is no longer recognisable as such. Plastic and glass can also form detritus when they break down to very fine particles. If not swept away regularly, detritus can encourage weeds to grow, damaging road and paving surfaces, trapping litter and leading to a rapid deterioration of the environmental standards of an area.
There appears to be a correlation between the average grades for weed growth and litter. Both elements had an improvement in standard between 2001 and 2010 but dipped at the same time around 2011/12. Since then, the average grade for both litter and weed growth has started to improve again, although litter has improved at a faster rate. Our observations suggest that weeds can often trap litter if they are allowed to grow sufficiently, but further research is required to understand whether there is a definite link between these two elements.
4
Figure 21: Average grade for weed growth over time.
Ave
rage
gra
de
B
B-
C
2004/05 2005/06 2006/07 2007/08 2008/09 2009/10 2010/11 2011/12 2012/13 2014/152013/14
Weeds gradefor site
How clean is England? 28
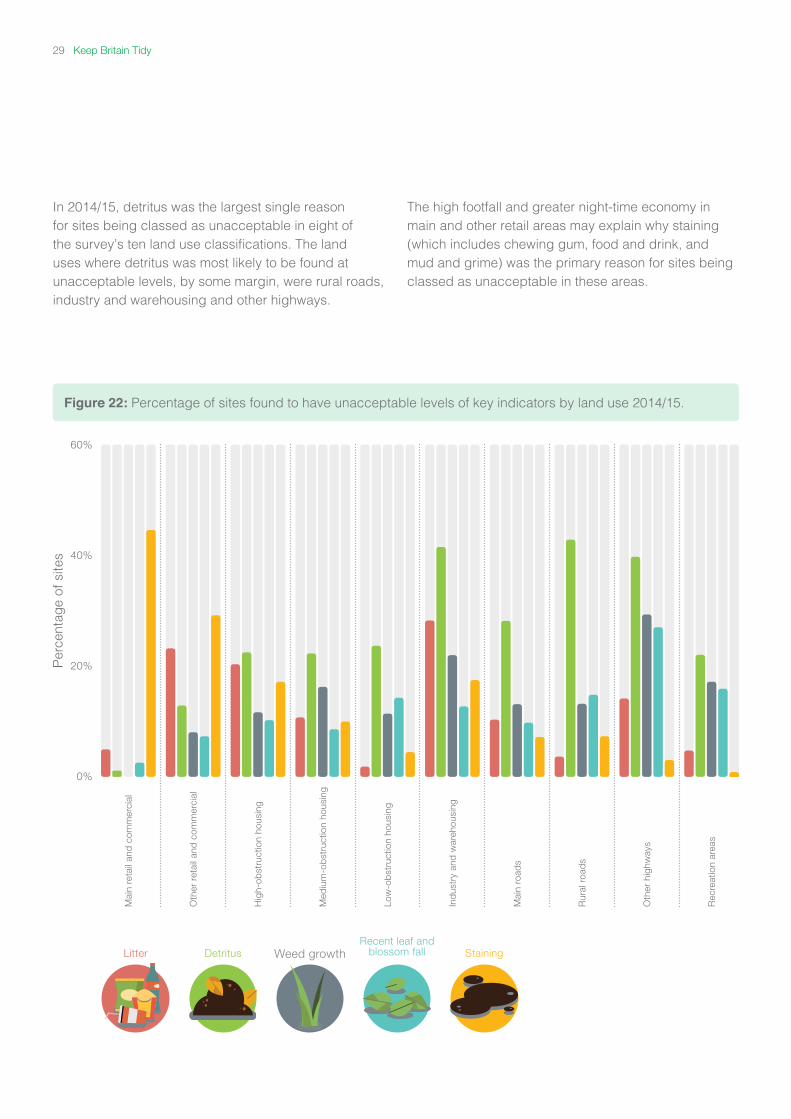
In 2014/15, detritus was the largest single reason for sites being classed as unacceptable in eight of the survey’s ten land use classifications. The land uses where detritus was most likely to be found at unacceptable levels, by some margin, were rural roads, industry and warehousing and other highways.
The high footfall and greater night-time economy in main and other retail areas may explain why staining (which includes chewing gum, food and drink, and mud and grime) was the primary reason for sites being classed as unacceptable in these areas.
Figure 22: Percentage of sites found to have unacceptable levels of key indicators by land use 2014/15.
Per
cent
age
of s
ites
60%
20%
40%
0%
Detritus Weed growthRecent leaf and
blossom fall StainingLitter
Mai
n re
tail
and
com
mer
cial
Oth
er r
etai
l and
com
mer
cial
Hig
h-ob
stru
ctio
n ho
usin
g
Med
ium
-ob
stru
ctio
n ho
usin
g
Low
-ob
stru
ctio
n ho
usin
g
Ind
ustr
y an
d w
areh
ousi
ng
Mai
n ro
ads
Rur
al r
oad
s
Oth
er h
ighw
ays
Rec
reat
ion
area
s
29 Keep Britain Tidy
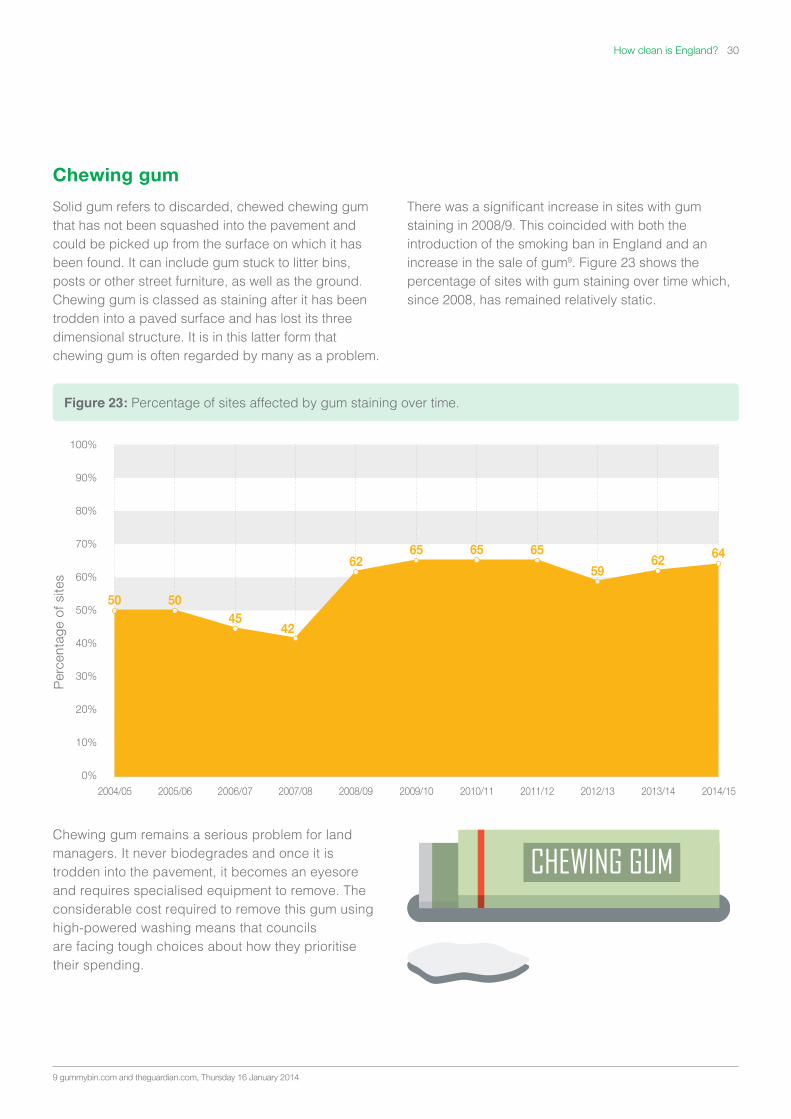
Chewing gum
Solid gum refers to discarded, chewed chewing gum that has not been squashed into the pavement and could be picked up from the surface on which it has been found. It can include gum stuck to litter bins, posts or other street furniture, as well as the ground. Chewing gum is classed as staining after it has been trodden into a paved surface and has lost its three dimensional structure. It is in this latter form that chewing gum is often regarded by many as a problem.
There was a significant increase in sites with gum staining in 2008/9. This coincided with both the introduction of the smoking ban in England and an increase in the sale of gum9. Figure 23 shows the percentage of sites with gum staining over time which, since 2008, has remained relatively static.
Chewing gum remains a serious problem for land managers. It never biodegrades and once it is trodden into the pavement, it becomes an eyesore and requires specialised equipment to remove. The considerable cost required to remove this gum using high-powered washing means that councils are facing tough choices about how they prioritise their spending.
Figure 23: Percentage of sites affected by gum staining over time.
9 gummybin.com and theguardian.com, Thursday 16 January 2014
Per
cent
age
of s
ites
100%
90%
80%
70%
60%
50%
40%
30%
20%
10%
0%
2004/05 2005/06 2006/07 2007/08 2008/09 2009/10 2010/11 2011/12 2012/13 2014/152013/14
5045
42
6265 65 65
5962 64
50
How clean is England? 30
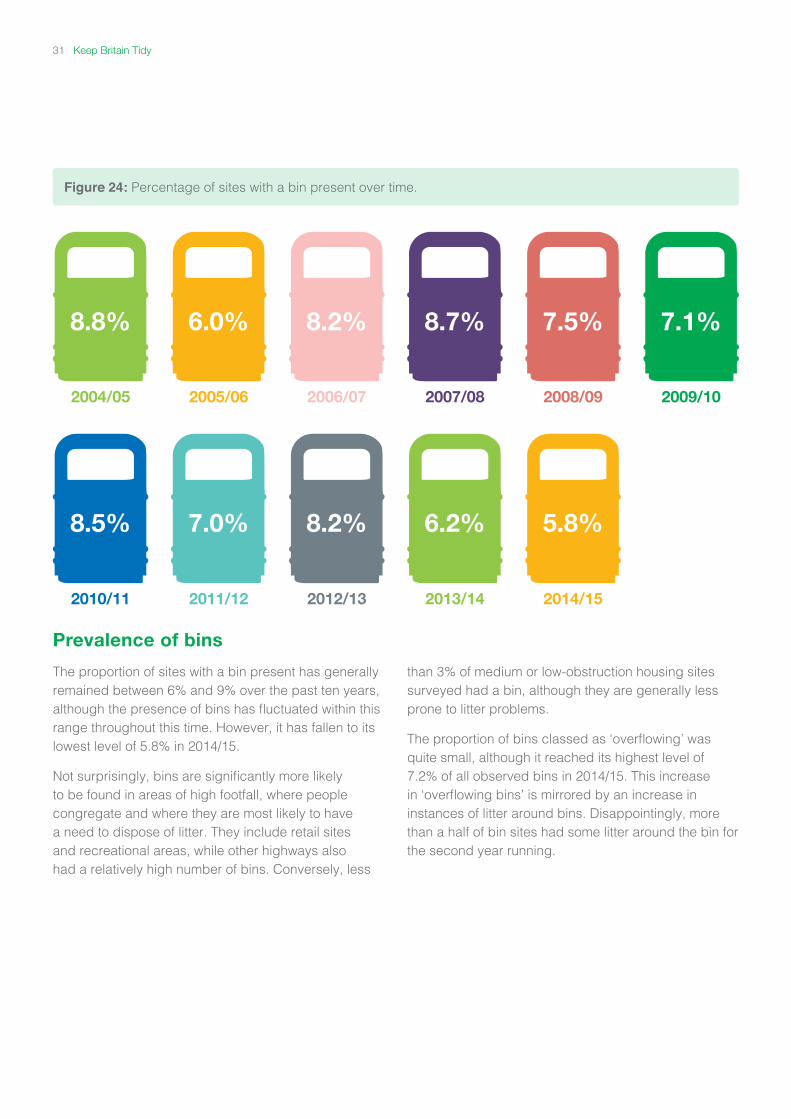
Prevalence of bins
The proportion of sites with a bin present has generally remained between 6% and 9% over the past ten years, although the presence of bins has fluctuated within this range throughout this time. However, it has fallen to its lowest level of 5.8% in 2014/15.
Not surprisingly, bins are significantly more likely to be found in areas of high footfall, where people congregate and where they are most likely to have a need to dispose of litter. They include retail sites and recreational areas, while other highways also had a relatively high number of bins. Conversely, less
than 3% of medium or low-obstruction housing sites surveyed had a bin, although they are generally less prone to litter problems.
The proportion of bins classed as ‘overflowing’ was quite small, although it reached its highest level of 7.2% of all observed bins in 2014/15. This increase in ‘overflowing bins’ is mirrored by an increase in instances of litter around bins. Disappointingly, more than a half of bin sites had some litter around the bin for the second year running.
Figure 24: Percentage of sites with a bin present over time.
8.8%
6.2%8.5% 7.0% 8.2%
6.0%
5.8%
8.2% 8.7% 7.5% 7.1%
2004/05
2013/142010/11 2011/12 2012/13
2005/06
2014/15
2006/07 2007/08 2008/09 2009/10
31 Keep Britain Tidy
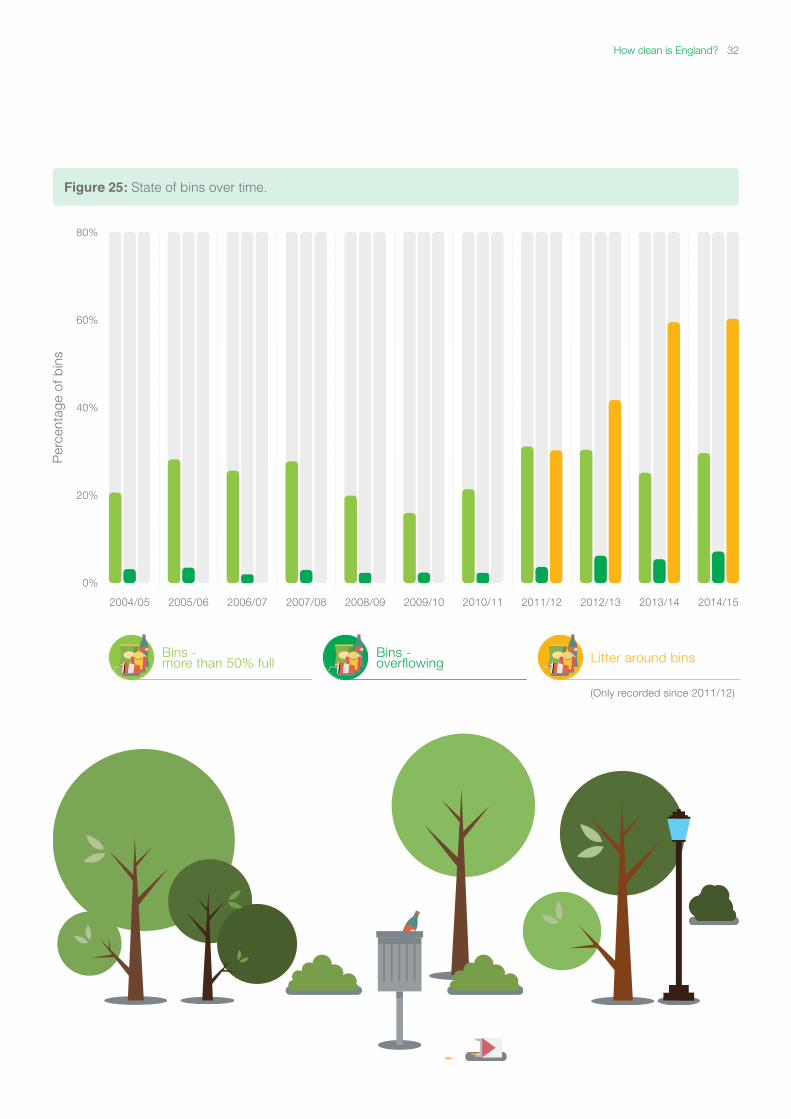
Figure 25: State of bins over time.
2004/05 2008/092006/07 2010/11 2013/142005/06 2009/10 2012/132007/08 2011/12 2014/15
80%
40%
60%
20%
0%
Per
cent
age
of b
ins
(Only recorded since 2011/12)
Bins - more than 50% full
Bins - overflowing Litter around bins
How clean is England? 32
17% 10% 18% 11% 13% 28% 33% 14% 25%30% 25%
40
Per
cent
age
of u
nacc
epta
ble
litt
er
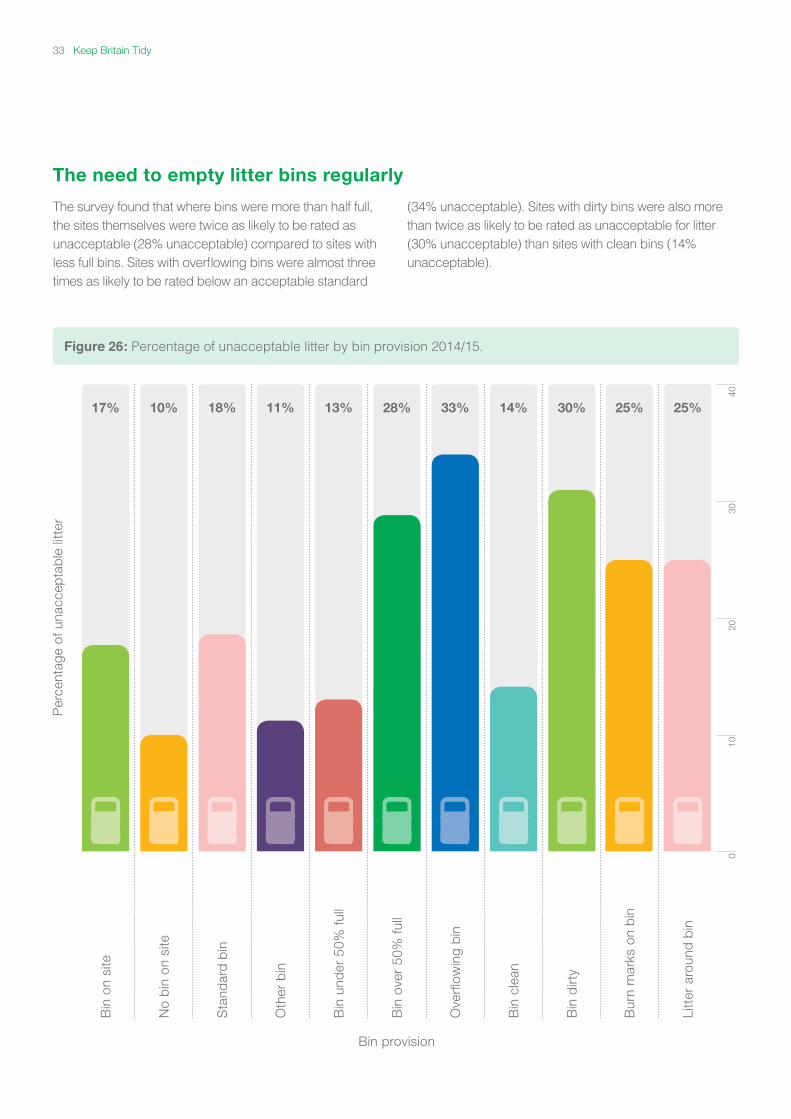
The need to empty litter bins regularly
The survey found that where bins were more than half full, the sites themselves were twice as likely to be rated as unacceptable (28% unacceptable) compared to sites with less full bins. Sites with overflowing bins were almost three times as likely to be rated below an acceptable standard
(34% unacceptable). Sites with dirty bins were also more than twice as likely to be rated as unacceptable for litter (30% unacceptable) than sites with clean bins (14% unacceptable).
Figure 26: Percentage of unacceptable litter by bin provision 2014/15.
Bin
on
site
No
bin
on
site
Sta
ndar
d b
in
Oth
er b
in
Bin
und
er 5
0% fu
ll
Bin
ove
r 50
% fu
ll
Ove
rflow
ing
bin
Bin
cle
an
Bur
n m
arks
on
bin
Bin
dirt
y
Litt
er a
roun
d b
in
100
2030
Bin provision
33 Keep Britain Tidy
Litter mapped against deprivation
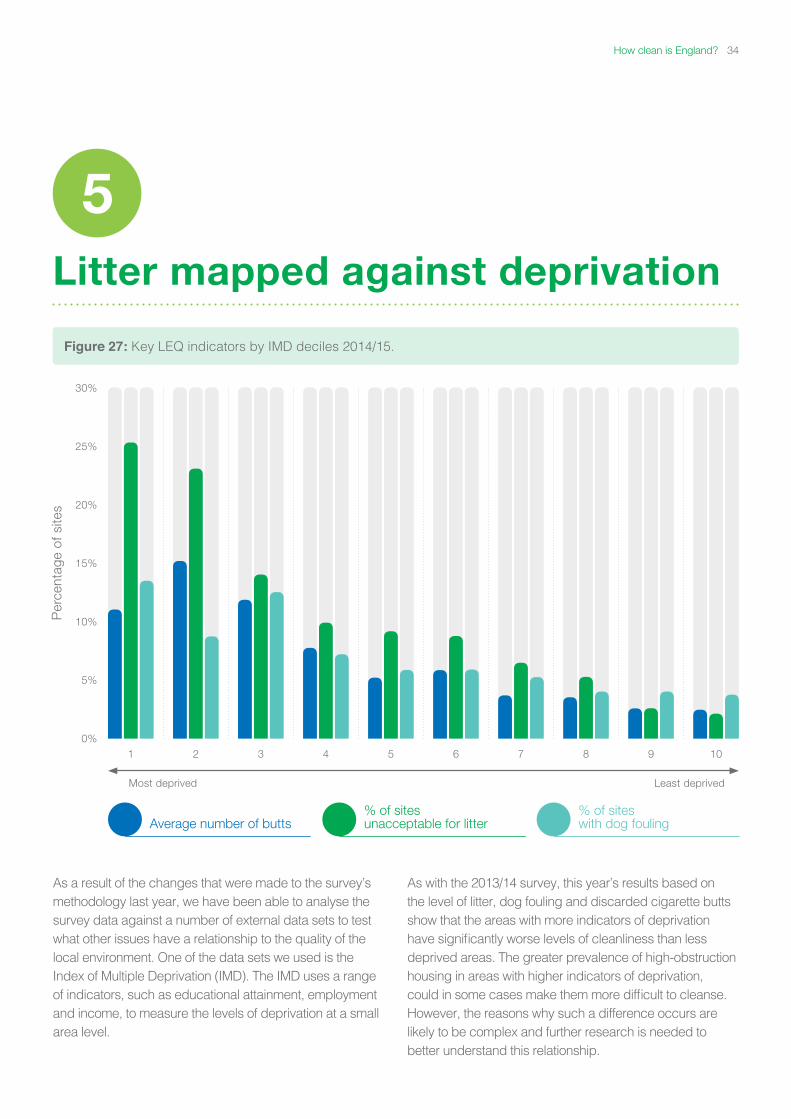
As a result of the changes that were made to the survey’s methodology last year, we have been able to analyse the survey data against a number of external data sets to test what other issues have a relationship to the quality of the local environment. One of the data sets we used is the Index of Multiple Deprivation (IMD). The IMD uses a range of indicators, such as educational attainment, employment and income, to measure the levels of deprivation at a small area level.
As with the 2013/14 survey, this year’s results based on the level of litter, dog fouling and discarded cigarette butts show that the areas with more indicators of deprivation have significantly worse levels of cleanliness than less deprived areas. The greater prevalence of high-obstruction housing in areas with higher indicators of deprivation, could in some cases make them more difficult to cleanse. However, the reasons why such a difference occurs are likely to be complex and further research is needed to better understand this relationship.
5
Figure 27: Key LEQ indicators by IMD deciles 2014/15.
1
Most deprived Least deprived
53 7 102 6 94 8
30%
20%
25%
15%
10%
5%
0%
Per
cent
age
of s
ites
Average number of butts% of sites unacceptable for litter
% of sites with dog fouling
How clean is England? 34
Conclusion
Despite recent reductions in local authority budgets, the 2014/15 LEQSE shows a continuing picture of improvement since the survey started in 2001. Most sites surveyed continue to have an acceptable standard of local environmental quality and this is a testimony to all those involved in keeping the country clean - local authorities, contractors, businesses, volunteer groups and individuals who work within their local communities.
It is unlikely that local authority budgets for street cleansing will be increased in the foreseeable future, so it is important that all of those groups involved in
reducing litter continue to work together in partnership so that people can enjoy a litter-free environment throughout the country.
This is particularly relevant in the most deprived areas of our society, where conditions can differ significantly from those in the least deprived areas. It is also important that solutions are found to these issues, such as fast food-related littering, which continues to increase year-on-year. Innovation and behaviour change are vital in ensuring that we can all live in a clean and pleasant environment.
6
The percentage of sites recorded as unacceptable in terms of litter levels saw a significant decrease across the IMD scale, falling from 25% of sites in the most deprived areas to just 2% of sites in the least deprived areas. There was also a significant decrease in the percentage of sites affected by dog fouling, falling from 14% in the most deprived areas to 4% in the least. Similarly, there is a significant decrease in the average number of cigarette butts per transect, from 12 in the most deprived areas to two in the least deprived areas. The average number of cigarette butts is actually even higher in the second decile (second most deprived level), reaching 15 butts per site.
The survey’s results confirm the findings of the Joseph Rowntree Foundation10, which in 2009 found a link between social deprivation and the occurrence of litter. The Rowntree survey found that those in more affluent neighbourhoods tended to have higher levels of street cleanliness than deprived neighbourhoods, although this difference was smaller in some local authorities than others. Areas of higher deprivation were found to suffer more severely from a poor quality local environment, including litter, graffiti, fly-tipped waste as well as other issues, such as a lack of access to green spaces. This is a complex issue that warrants further investigation, particularly as this year’s results support those of the 2013/14 LEQSE and the Joseph Rowntree Foundation study.
10 Joseph Rowntree Foundation, 2009. Street cleanliness in deprived and better off neighbourhoods.
35 Keep Britain Tidy
Glossary of Terms
Alcoholic drinks-related – all items associated with alcoholic drinks. This includes cans, bottles, wine cartons, identifiable bottle tops and ring pulls, labels from bottles, beer/spirit/shot glasses, etc.
All plastic bags – all retail plastic bags including both branded and non-branded bags, together with supermarket chain plastic bags, both single-use and multi-use.
Bagged dog faeces – dog faeces that is placed in a bag and left, whether the bag is on the ground or in a shrub/tree, etc.
Confectionery material – all types of confectionery material, such as sweet wrappers, chocolate wrappers, lollipop/iced lollipop sticks, chewing gum wrappers, etc., but not the confectionery itself.
Detritus - comprises dust, mud, soil, grit, gravel, stones, rotted leaf and vegetable residues, and fragments of twigs, glass, plastic and other finely divided materials. Detritus includes leaf and blossom fall which has substantially lost its structure and has become mushy or fragmented (i.e. it can no longer be considered as recent leaf and blossom fall).
Discarded food/drink – small amounts of dropped or spilt food and drink. If there is evidence that it has been discarded from a food outlet or retail premises, it is classified as commercial waste. If the amounts of spilt food/drink are deemed large enough to attract vermin or produce an unpleasant odour due to decay, then they should be classified as putrescible waste.
Domestic waste - all materials normally found in domestic (household) waste containers - this can include waste stored in bags and wheeled bins. Domestic refuse can be spillage from a collection vehicle or waste arising from the dwelling.
Fast food-related – packaging and paraphernalia related to freshly prepared, ready-to-eat food and drink, which is dropped by customers while sitting in, or passing through, an area. This includes wrappings, boxes, drinks containers, plastic straws, plastic cutlery, branded paper napkins, all sandwich cartons, salt sachets, etc. Fast food premises include hot food takeaway premises, coffee shops, and all other retail outlets that sell pre-prepared foods (with short shelf lives) in a format that can be consumed in public places, including bakeries, supermarkets and mobile catering units.
Fly-posting - any printed material which is unauthorised and either informally or illegally fixed to any structure. It includes all sizes of material, from small self-adhesive stickers to large posters – often advertising popular music recordings, concerts and other events. It excludes formally managed and approved advertising hoardings and any other authorised legally placed signs and notices (unless they are out-of-date).
Fly-tipping - comprises quantities of dumped materials, where there is evidence of attempted abandonment of the materials in question. The sources may vary, for example domestic refuse, bulky household goods, commercial or construction wastes, or travel/vehicle related wastes (old tyres, abandoned/burnt out cars).
General litter - items dropped or discarded by people (e.g. pedestrians, cyclists or drivers and passengers in vehicles) in public spaces. This category includes the types of materials that most people regard as litter – smokers’ materials, sweet papers, fast food packaging, drinks containers, etc.
Graffiti - any informal or illegal marks, scratchings, carvings, drawings or paintings that have been deliberately made by a person or persons on any physical element comprising public space.
7
How clean is England? 36
Newspaper/magazines – part or whole newspapers and/or magazines including those which have been purchased, those which are available free of charge, and any supplements and inserts.
Multi use plastic bags – often sold by retailers at a nominal charge, the plastic bags are intended to be used more than once.
Non-alcoholic drinks related – all items associated with non-alcoholic drinks, including cans, bottles, cartons, identifiable bottle tops and ring-pulls, straws, labels from bottles, etc. This excludes those items arising from fast food outlets, which should be classified as fast food litter.
Non-branded retail plastic bags – plastic bags that contain no branding.
Other packaging - any packaging material which is deemed to have been dropped by a member of the public, rather than originating from a commercial or domestic source, but which is not captured by another category. For example, a soft drinks bottle is packaging but will be recorded as non-alcoholic drinks related litter. Examples of ‘other packaging’ include cellophane wrapping from around CDs and blister packaging from toys.
Other retail branded bags – branded retail bags other than those issued by supermarkets.
Paper bags – used for the carrying of shopping whether branded or not.
Retail litter (all types) - waste that appears to have originated from all types of retail premises; for example, from fast food outlets, bakeries, cafés, fruit and veg. stores, butchers, convenience stores, clothing and electrical stores.
Royal Mail-related – includes small, thick elastic bands used by the Royal Mail to fasten groups of mail together, which are often discarded by postal workers. This also includes information cards; for example, those used to advise that a parcel is waiting at a collection point.
Single-use plastic bags – given out by retailers often free of charge and are of such material that they are often intended to be used only once.
Smokers’ materials – all types of items discarded by people using tobacco products, including cigarettes and cigarette ends, cigars, matchsticks/boxes, cigarette and cigar boxes/wrappers, disposable lighters, etc.
Snack packs – all items of packaging litter (excluding the contents) that are associated with pre-baked/pre-prepared snack foods, e.g. crisp packets, biscuit packaging, cake wrappers or containers, etc.
Solid gum – discarded, chewed chewing gum that has not been squashed into the pavement. This could include gum stuck to litter bins, posts or other street furniture.
Staining - any material that discolours surfaces comprising public spaces in an unplanned way, including chewing gum after it has been trodden into a paved surface, and general mud and grime that can build up in the absence of rainfall or street washing.
Supermarket plastic bags – supermarket chain branded plastic carrier bags, both single-use and multi-use.
Vehicle parts – these include any part of a motorised vehicle, including bodywork, engine parts, number-plates, wheel trims, exhaust (or part(s) of), and light or window glass, which appear to have originated from a vehicle. They may have been displaced by wear and tear (i.e. falling off), roadside repairs or due to accidents. However, if the vehicle parts appear to have been deliberately dumped then they are assessed as ‘fly-tipping’. If they appear to have originated from a commercial garage, they are classified as ‘industry’ under commercial waste.
Weed growth - any plant that is growing in a location where it is not intended, including where plants or grass are encroaching on paved areas in an unplanned way – usually in colonising accumulations of detritus or along cracks and joints in paving. ‘Weed growth’ includes weeds that have been sprayed with weed killer and may be dead but have not yet been removed.
37 Keep Britain Tidy

This report was first published in 2015 by Keep Britain Tidy Copyright © 2015 Keep Britain Tidy
No part of this report may be reproduced in any form whatsoever without prior permission in writing from Keep Britain Tidy. Permission will normally be given free of charge to charitable and other non-profit making organisations.
Keep Britain Tidy is a registered charity. No. 1071737.
Designed by www.carboncreative.net
Printed on 100% recycled material
Elizabeth House The Pier Wigan WN3 4EX
T 01942 612621
Development House 56-64 Leonard Street London EC2A 4LT
T 020 7549 0300
Keep Britain Tidy
[email protected] keepbritaintidy.org
facebook.com/keepbritaintidy @keepbritaintidy