Embed Size (px)
Citation preview
lable at ScienceDirect
Energy 36 (2011) 305e313
Contents lists avai
Energy
journal homepage: www.elsevier .com/locate/energy
How carbon pricing changes the relative competitiveness of low-carbon baseloadgenerating technologies
Martin Nicholson a, Tom Biegler b, Barry W. Brook c,*
aMNIT Group, Skyline Road, The Pocket, NSW 2483, AustraliabDelta-G Research, PO Box 1357, Werribee Plaza, Vic 3029, AustraliacCentre for Energy Technology, School of Earth and Environmental Sciences, University of Adelaide, Mawson Laboratories, North Terrace Campus, Adelaide, SA 5005, Australia
a r t i c l e i n f o
Article history:Received 25 May 2010Received in revised form13 October 2010Accepted 16 October 2010Available online 18 November 2010
Keywords:Baseload electricityLevelized cost of electricityLife-cycle analysisCarbon PriceNuclearSolar thermal
* Corresponding author. Tel.: þ61 8 8303 3745; faxE-mail address: [email protected] (B.W
1 ppm CO2eq¼ parts per million of carbon dioxide
0360-5442/$ e see front matter � 2010 Elsevier Ltd.doi:10.1016/j.energy.2010.10.039
a b s t r a c t
There is wide public debate about which electricity generating technologies will best be suited to reducegreenhouse gas emissions (GHG). Sometimes this debate ignores real-world practicalities and leads toover-optimistic conclusions. Here we define and apply a set of fit-for-service criteria to identify tech-nologies capable of supplying baseload electricity and reducing GHGs by amounts and within thetimescale set by the Intergovernmental Panel on Climate Change (IPCC). Only five current technologiesmeet these criteria: coal (both pulverised fuel and integrated gasification combined cycle) with carboncapture and storage (CCS); combined cycle gas turbine with CCS; Generation III nuclear fission; and solarthermal backed by heat storage and gas turbines. To compare costs and performance, we undertooka meta-review of authoritative peer-reviewed studies of levelised cost of electricity (LCOE) and life-cycleGHG emissions for these technologies. Future baseload electricity technology selection will be influencedby the total cost of technology substitution, including carbon pricing, which is synergistically related toboth LCOE and emissions. Nuclear energy is the cheapest option and best able to meet the IPCC timetablefor GHG abatement. Solar thermal is the most expensive, while CCS will require rapid major advances intechnology to meet that timetable.
� 2010 Elsevier Ltd. All rights reserved.
1. Introduction
The Copenhagen Accord that emerged from the 2009 UnitedNations Climate Change Conference recognised the scientific viewthat any increase in global temperature should be kept below 2 �C[1]. According to the International Panel on Climate Change (IPCC)this target would require atmospheric GHG levels to be stabilisedbelow 450 ppm CO2eq1 and future emissions to be reduced by 85%below 2000 levels by 2050 [2]. Such reductions call for a switch tolow-emission technologies, particularly for electricity generation e
a major source of fossil-fuel-derived CO2.Economists generally agree that the most effective way to
encourage technology switching is to introduce a price on emis-sions, commonly referred to as a carbon price, that must be paid bythe emitter. The options for, and costs of, low-emission technolo-gies are of considerable interest to those tasked with mitigatingclimate change and there are numerous reviews available. These
: þ61 8 8303 4347.. Brook).equivalent.
All rights reserved.
reviews often start with different premises and arrive at differentconclusions. An important cause of these differences is the degreeof optimism adopted regarding long-term improvements inemerging technologies and their costs. That is to say, there aredifferences in the levels of risk that different observers tend toattach to future technology development, including cost projec-tions. While this is understandable, the position taken here is thatfuture energy security is of utmost importance and that minimalreliance should be placed on inherently uncertain projections,especially given the relatively tight timeframes for large-scaleemissions reduction, as described above.
Thus, there is a need for an independent, objective analysis ofsuch reviews (a ‘meta-review’ [3]), which is based on a realisticassessment of market needs, current technology performance, andthe future prospects of seemingly attractive technologies that arestill on the horizon. In this paper, our intention is to fulfil that need.In this assessment of the authoritative technical literature, weexplore how the introduction of a price on carbon will impact therelative competitiveness of generating technologies. We take anexplicit, transparent but conservative approach to selecting thetechnologies that can properly be regarded as ‘fit-for-service’ insupplying future low-carbon baseload electricity needs.
M. Nicholson et al. / Energy 36 (2011) 305e313306
1.1. Substantial cuts needed in GHG emissions from electricitygeneration
Although a decrease in carbon emissions is needed across thewhole economy, the energy sector (and electricity in particular) iskey to achieving the reduction target by 2050. The energy sectorrepresents 73% of all anthropogenic global emissions, with elec-tricity generation contributing 43% of the energy emissions and 32%of all emissions. Transport is the next largest category at 19% ofenergy emissions [4]. The electrification of transport to reduceemissions from oil-based products will increase the total demandfor low-carbon electricity. Although the efficiency gains thisinvolves may lead to a reduction in total primary energy consumedin the transport sector, it will put further pressure on reducing GHGemissions from electricity generation.
The emission intensity (EI) of electricity plants is the full life-cycle emissions per unit of energy generated, including fuelproduction and construction and decommissioning of the plant.The average EI of world electricity generation today is around500 kg CO2eq/MWh.2 This figure will need to be below 50 kgCO2eq/MWh globally by 2050 to meet the IPCC’s 85% reductiontarget [5]. The IPCC indicates that by 2030 the average EI of elec-tricity generation has to be below 300 kg CO2eq/MWh [6]. These EItargets define the capacity requirements and construction schedulefor future low-carbon electricity generating technologies. Futureconstraints of fossil-fuel supplies may also influence regionaltechnology selection over the next few decades.
1.2. Need to target baseload
Electricity demand is generally categorised into baseload, inter-mediate load and peak load. In the medium term, baseload demanddoesnot changesignificantlyover timeand isdefinedastheminimumamount of power that an electricity utility or distribution companymust always make available to its customers [7]. Intermediate loaddoes vary but is predictable and influenced by time of day such asweekdaymornings and evenings. Peak load ismuch less certain and isoften influenced by climatic conditions that change demand forbuilding heating and cooling. Different generators service the threedifferent loads. An efficientmixof generation is onewhichminimisesthe total costofmeeting thedemand. The shapeof thedemandprofileis a key consideration. For example, a relatively flat demand profileimplies a greater role for baseload generation, while a very peakydemand profile implies a greater role for peaking generation [8].Baseload supply varies between countries and networks but cantypically represent 40e60% of peak load but 60e80% of total energysupply. Forexample, inAustralia in2009baseloadplantsprovided60%of the peak load and 76% of total energy [9].
Baseload plants using fossil fuels are typically the primarysource of electrical energy in most networks [10] and produce mostof the emissions. Intermediate and peaking plants (that are lesslikely to use fossil fuels) often havemuch lower EI levels than fossil-
Proven Has the technology been used at coScalable Can the technology be built in sufficDispatchable Can the output be allocated by the sFuel supply Is the energy source reliable and pleLoad access Can the generator be installed closeStorage Does the technology require electricEmission intensity Is the emission intensity high, modeCapacity factor Is the capacity factor high, moderate
2 kg CO2eq/MWh¼ kilograms of carbon dioxide equivalent per megawatt hour(electricity).
fuel baseload plants. Future technology is expected to progressivelyimprove all plant EI levels. Hypothetically, if by 2050, 40% of theenergy comes from intermediate and peaking plants (as is typicaltoday), and these plants have a low average EI of 20 kg CO2eq/MWh(typical for renewable energy plants [11]) then baseload average EIlevels will need to be below 70 kg CO2eq/MWh by 2050 to achievethe target of 50 kg CO2eq/MWh by 2050 discussed in Section 1.1.
Not all low-carbon generating technologies are suitable forbaseload plants. The US Energy Information Administration (EIA)defines baseload plants as facilities that operate almost continu-ously, generally at annual utilization rates (capacity factors) of 70%or higher [12]. In assessing technologies for costing, we adoptgenerally accepted selection criteria for technologies that are fit-for-service to provide baseload services (see Section 2.1).
1.3. Need for lowest cost solution
High generation costs obviously lead to high electricity pricesand high energy prices tend to have a negative impact on produc-tivity and economic competitiveness. The Commission on Engi-neering and Technical Systems in a paper titled Electricity inEconomic Growth [13] stated that:
“Productivity growth may be ascribed partly to technicalchange; in many industries technical change also tends toincrease the relative share of electricity in the value of output,and in these industries productivity growth is found to be thegreater the lower the real price of electricity, and vice versa.”
For social and political reasons it is therefore important thatelectricity costs, inclusive of a carbon price, are kept to a minimum.
Generation costs are a function of the capital cost of the plant,the running costs (operations, maintenance and fuel) and theamount of energy generated over the plant’s lifetime (see Section2.2). Baseload technologies are characterised by high initial capitalcosts and relatively low running costs [8]. Fossil-fuel dependentbaseload plants will be particularly sensitive to future coal and gasprices which are influenced by international supply and demand.Adding a carbon price to the cost of generation increases electricityprices and impacts the competitiveness of various baseload tech-nologies because of their differing EIs. This point is central to themessage of this paper.
2. Methods
2.1. Selecting ‘Fit-for-Service’ (FFS) technologies for low-carbonbaseload
Weconsideronly those low-emissiontechnologies thatcanprovidebaseload power. We use a set of objective criteria to select candidatesfrom present and proposed technologies commonly mentioned inthe context of future power generation (IEA [14], EIA [12]). Eachtechnology is assessed in Table 1 against the following criteria:
mmercial scale?ient quantity to replace significant proportions of existing fossil-fuel generators?ystem operator to meet the anticipated load?ntiful, even when, as with some kinds of renewable energy, it varies with time?to a load centre?ity storage in order to deliver a high capacity factor?rate or low (as defined in Table 1)?or low (as defined in Table 1)?
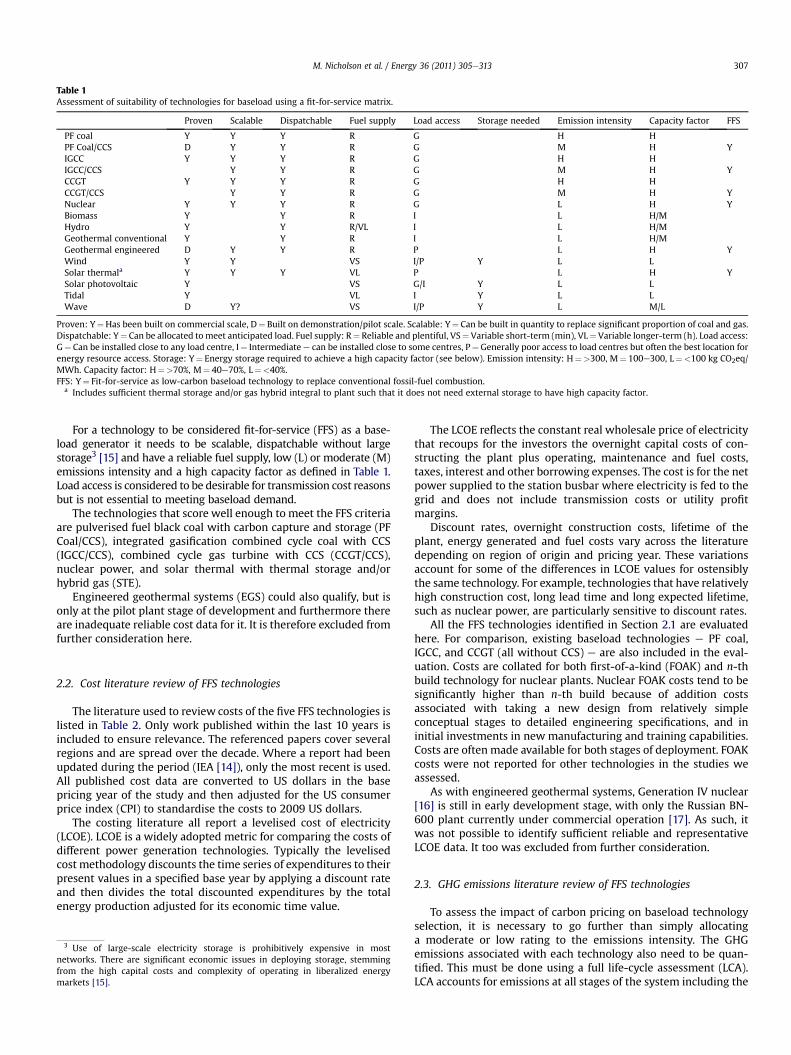
Table 1Assessment of suitability of technologies for baseload using a fit-for-service matrix.
Proven Scalable Dispatchable Fuel supply Load access Storage needed Emission intensity Capacity factor FFS
PF coal Y Y Y R G H HPF Coal/CCS D Y Y R G M H YIGCC Y Y Y R G H HIGCC/CCS Y Y R G M H YCCGT Y Y Y R G H HCCGT/CCS Y Y R G M H YNuclear Y Y Y R G L H YBiomass Y Y R I L H/MHydro Y Y R/VL I L H/MGeothermal conventional Y Y R I L H/MGeothermal engineered D Y Y R P L H YWind Y Y VS I/P Y L LSolar thermala Y Y Y VL P L H YSolar photovoltaic Y VS G/I Y L LTidal Y VL I Y L LWave D Y? VS I/P Y L M/L
Proven: Y¼Has been built on commercial scale, D¼ Built on demonstration/pilot scale. Scalable: Y¼ Can be built in quantity to replace significant proportion of coal and gas.Dispatchable: Y¼ Can be allocated tomeet anticipated load. Fuel supply: R¼ Reliable and plentiful, VS¼Variable short-term (min), VL¼Variable longer-term (h). Load access:G¼ Can be installed close to any load centre, I¼ Intermediate e can be installed close to some centres, P¼Generally poor access to load centres but often the best location forenergy resource access. Storage: Y¼ Energy storage required to achieve a high capacity factor (see below). Emission intensity: H¼>300, M¼ 100e300, L¼<100 kg CO2eq/MWh. Capacity factor: H¼>70%, M¼ 40e70%, L¼<40%.FFS: Y¼ Fit-for-service as low-carbon baseload technology to replace conventional fossil-fuel combustion.
a Includes sufficient thermal storage and/or gas hybrid integral to plant such that it does not need external storage to have high capacity factor.
M. Nicholson et al. / Energy 36 (2011) 305e313 307
For a technology to be considered fit-for-service (FFS) as a base-load generator it needs to be scalable, dispatchable without largestorage3 [15] and have a reliable fuel supply, low (L) or moderate (M)emissions intensity and a high capacity factor as defined in Table 1.Load access is considered to be desirable for transmission cost reasonsbut is not essential to meeting baseload demand.
The technologies that score well enough to meet the FFS criteriaare pulverised fuel black coal with carbon capture and storage (PFCoal/CCS), integrated gasification combined cycle coal with CCS(IGCC/CCS), combined cycle gas turbine with CCS (CCGT/CCS),nuclear power, and solar thermal with thermal storage and/orhybrid gas (STE).
Engineered geothermal systems (EGS) could also qualify, but isonly at the pilot plant stage of development and furthermore thereare inadequate reliable cost data for it. It is therefore excluded fromfurther consideration here.
2.2. Cost literature review of FFS technologies
The literature used to review costs of the five FFS technologies islisted in Table 2. Only work published within the last 10 years isincluded to ensure relevance. The referenced papers cover severalregions and are spread over the decade. Where a report had beenupdated during the period (IEA [14]), only the most recent is used.All published cost data are converted to US dollars in the basepricing year of the study and then adjusted for the US consumerprice index (CPI) to standardise the costs to 2009 US dollars.
The costing literature all report a levelised cost of electricity(LCOE). LCOE is a widely adopted metric for comparing the costs ofdifferent power generation technologies. Typically the levelisedcost methodology discounts the time series of expenditures to theirpresent values in a specified base year by applying a discount rateand then divides the total discounted expenditures by the totalenergy production adjusted for its economic time value.
3 Use of large-scale electricity storage is prohibitively expensive in mostnetworks. There are significant economic issues in deploying storage, stemmingfrom the high capital costs and complexity of operating in liberalized energymarkets [15].
The LCOE reflects the constant real wholesale price of electricitythat recoups for the investors the overnight capital costs of con-structing the plant plus operating, maintenance and fuel costs,taxes, interest and other borrowing expenses. The cost is for the netpower supplied to the station busbar where electricity is fed to thegrid and does not include transmission costs or utility profitmargins.
Discount rates, overnight construction costs, lifetime of theplant, energy generated and fuel costs vary across the literaturedepending on region of origin and pricing year. These variationsaccount for some of the differences in LCOE values for ostensiblythe same technology. For example, technologies that have relativelyhigh construction cost, long lead time and long expected lifetime,such as nuclear power, are particularly sensitive to discount rates.
All the FFS technologies identified in Section 2.1 are evaluatedhere. For comparison, existing baseload technologies e PF coal,IGCC, and CCGT (all without CCS) e are also included in the eval-uation. Costs are collated for both first-of-a-kind (FOAK) and n-thbuild technology for nuclear plants. Nuclear FOAK costs tend to besignificantly higher than n-th build because of addition costsassociated with taking a new design from relatively simpleconceptual stages to detailed engineering specifications, and ininitial investments in new manufacturing and training capabilities.Costs are often made available for both stages of deployment. FOAKcosts were not reported for other technologies in the studies weassessed.
As with engineered geothermal systems, Generation IV nuclear[16] is still in early development stage, with only the Russian BN-600 plant currently under commercial operation [17]. As such, itwas not possible to identify sufficient reliable and representativeLCOE data. It too was excluded from further consideration.
2.3. GHG emissions literature review of FFS technologies
To assess the impact of carbon pricing on baseload technologyselection, it is necessary to go further than simply allocatinga moderate or low rating to the emissions intensity. The GHGemissions associated with each technology also need to be quan-tified. This must be done using a full life-cycle assessment (LCA).LCA accounts for emissions at all stages of the system including the
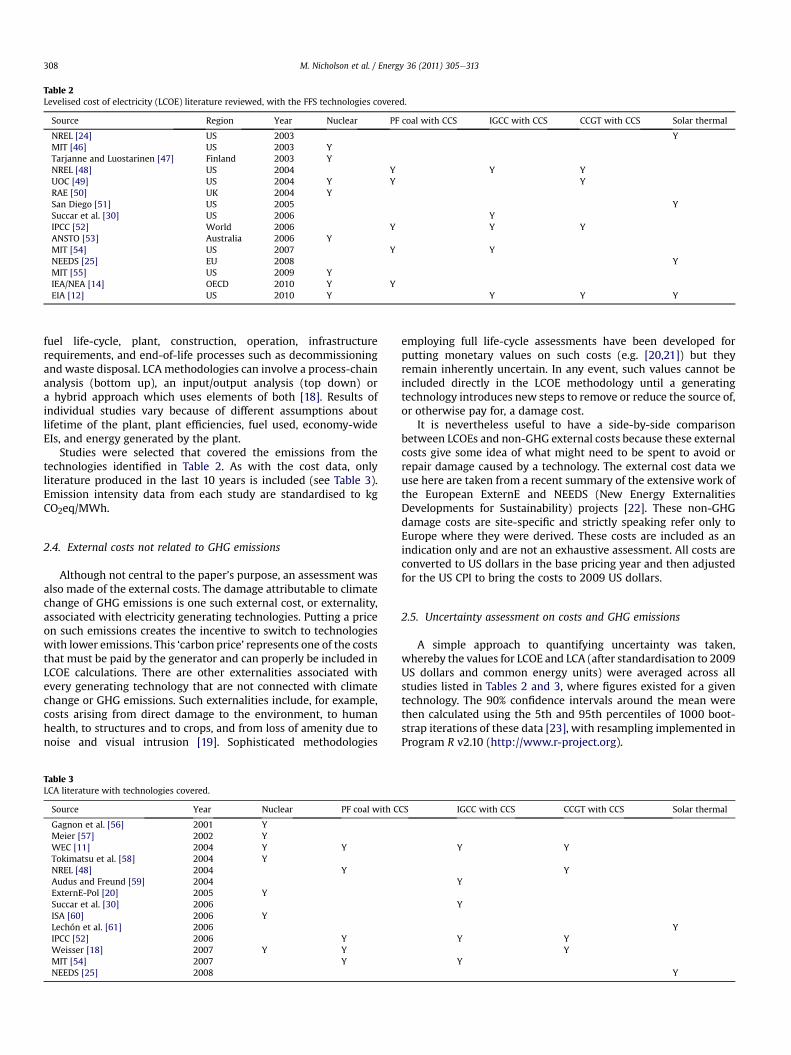
Table 2Levelised cost of electricity (LCOE) literature reviewed, with the FFS technologies covered.
Source Region Year Nuclear PF coal with CCS IGCC with CCS CCGT with CCS Solar thermal
NREL [24] US 2003 YMIT [46] US 2003 YTarjanne and Luostarinen [47] Finland 2003 YNREL [48] US 2004 Y Y YUOC [49] US 2004 Y Y YRAE [50] UK 2004 YSan Diego [51] US 2005 YSuccar et al. [30] US 2006 YIPCC [52] World 2006 Y Y YANSTO [53] Australia 2006 YMIT [54] US 2007 Y YNEEDS [25] EU 2008 YMIT [55] US 2009 YIEA/NEA [14] OECD 2010 Y YEIA [12] US 2010 Y Y Y Y
M. Nicholson et al. / Energy 36 (2011) 305e313308
fuel life-cycle, plant, construction, operation, infrastructurerequirements, and end-of-life processes such as decommissioningand waste disposal. LCA methodologies can involve a process-chainanalysis (bottom up), an input/output analysis (top down) ora hybrid approach which uses elements of both [18]. Results ofindividual studies vary because of different assumptions aboutlifetime of the plant, plant efficiencies, fuel used, economy-wideEIs, and energy generated by the plant.
Studies were selected that covered the emissions from thetechnologies identified in Table 2. As with the cost data, onlyliterature produced in the last 10 years is included (see Table 3).Emission intensity data from each study are standardised to kgCO2eq/MWh.
2.4. External costs not related to GHG emissions
Although not central to the paper’s purpose, an assessment wasalso made of the external costs. The damage attributable to climatechange of GHG emissions is one such external cost, or externality,associated with electricity generating technologies. Putting a priceon such emissions creates the incentive to switch to technologieswith lower emissions. This ‘carbon price’ represents one of the coststhat must be paid by the generator and can properly be included inLCOE calculations. There are other externalities associated withevery generating technology that are not connected with climatechange or GHG emissions. Such externalities include, for example,costs arising from direct damage to the environment, to humanhealth, to structures and to crops, and from loss of amenity due tonoise and visual intrusion [19]. Sophisticated methodologies
Table 3LCA literature with technologies covered.
Source Year Nuclear PF coal with C
Gagnon et al. [56] 2001 YMeier [57] 2002 YWEC [11] 2004 Y YTokimatsu et al. [58] 2004 YNREL [48] 2004 YAudus and Freund [59] 2004ExternE-Pol [20] 2005 YSuccar et al. [30] 2006ISA [60] 2006 YLechón et al. [61] 2006IPCC [52] 2006 YWeisser [18] 2007 Y YMIT [54] 2007 YNEEDS [25] 2008
employing full life-cycle assessments have been developed forputting monetary values on such costs (e.g. [20,21]) but theyremain inherently uncertain. In any event, such values cannot beincluded directly in the LCOE methodology until a generatingtechnology introduces new steps to remove or reduce the source of,or otherwise pay for, a damage cost.
It is nevertheless useful to have a side-by-side comparisonbetween LCOEs and non-GHG external costs because these externalcosts give some idea of what might need to be spent to avoid orrepair damage caused by a technology. The external cost data weuse here are taken from a recent summary of the extensive work ofthe European ExternE and NEEDS (New Energy ExternalitiesDevelopments for Sustainability) projects [22]. These non-GHGdamage costs are site-specific and strictly speaking refer only toEurope where they were derived. These costs are included as anindication only and are not an exhaustive assessment. All costs areconverted to US dollars in the base pricing year and then adjustedfor the US CPI to bring the costs to 2009 US dollars.
2.5. Uncertainty assessment on costs and GHG emissions
A simple approach to quantifying uncertainty was taken,whereby the values for LCOE and LCA (after standardisation to 2009US dollars and common energy units) were averaged across allstudies listed in Tables 2 and 3, where figures existed for a giventechnology. The 90% confidence intervals around the mean werethen calculated using the 5th and 95th percentiles of 1000 boot-strap iterations of these data [23], with resampling implemented inProgram R v2.10 (http://www.r-project.org).
CS IGCC with CCS CCGT with CCS Solar thermal
Y Y
YY
Y
YY Y
YY
Y
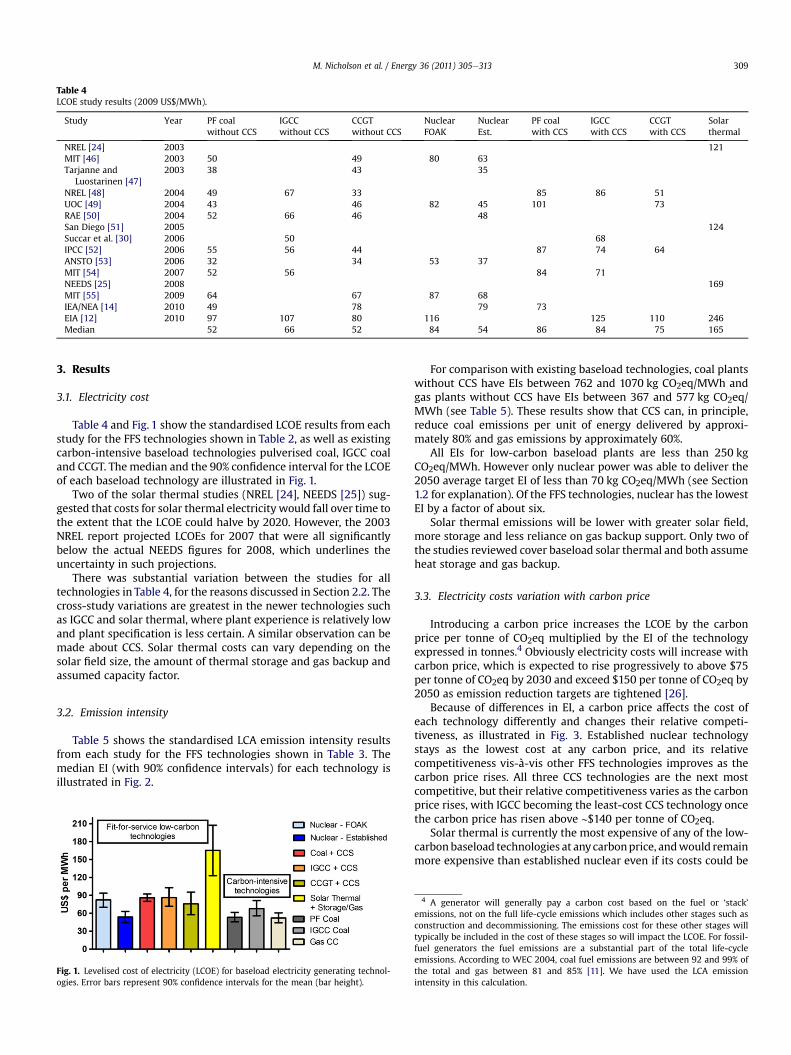
Table 4LCOE study results (2009 US$/MWh).
Study Year PF coalwithout CCS
IGCCwithout CCS
CCGTwithout CCS
NuclearFOAK
NuclearEst.
PF coalwith CCS
IGCCwith CCS
CCGTwith CCS
Solarthermal
NREL [24] 2003 121MIT [46] 2003 50 49 80 63Tarjanne and
Luostarinen [47]2003 38 43 35
NREL [48] 2004 49 67 33 85 86 51UOC [49] 2004 43 46 82 45 101 73RAE [50] 2004 52 66 46 48San Diego [51] 2005 124Succar et al. [30] 2006 50 68IPCC [52] 2006 55 56 44 87 74 64ANSTO [53] 2006 32 34 53 37MIT [54] 2007 52 56 84 71NEEDS [25] 2008 169MIT [55] 2009 64 67 87 68IEA/NEA [14] 2010 49 78 79 73EIA [12] 2010 97 107 80 116 125 110 246Median 52 66 52 84 54 86 84 75 165
M. Nicholson et al. / Energy 36 (2011) 305e313 309
3. Results
3.1. Electricity cost
Table 4 and Fig. 1 show the standardised LCOE results from eachstudy for the FFS technologies shown in Table 2, as well as existingcarbon-intensive baseload technologies pulverised coal, IGCC coaland CCGT. Themedian and the 90% confidence interval for the LCOEof each baseload technology are illustrated in Fig. 1.
Two of the solar thermal studies (NREL [24], NEEDS [25]) sug-gested that costs for solar thermal electricity would fall over time tothe extent that the LCOE could halve by 2020. However, the 2003NREL report projected LCOEs for 2007 that were all significantlybelow the actual NEEDS figures for 2008, which underlines theuncertainty in such projections.
There was substantial variation between the studies for alltechnologies in Table 4, for the reasons discussed in Section 2.2. Thecross-study variations are greatest in the newer technologies suchas IGCC and solar thermal, where plant experience is relatively lowand plant specification is less certain. A similar observation can bemade about CCS. Solar thermal costs can vary depending on thesolar field size, the amount of thermal storage and gas backup andassumed capacity factor.
3.2. Emission intensity
Table 5 shows the standardised LCA emission intensity resultsfrom each study for the FFS technologies shown in Table 3. Themedian EI (with 90% confidence intervals) for each technology isillustrated in Fig. 2.
Fig. 1. Levelised cost of electricity (LCOE) for baseload electricity generating technol-ogies. Error bars represent 90% confidence intervals for the mean (bar height).
For comparison with existing baseload technologies, coal plantswithout CCS have EIs between 762 and 1070 kg CO2eq/MWh andgas plants without CCS have EIs between 367 and 577 kg CO2eq/MWh (see Table 5). These results show that CCS can, in principle,reduce coal emissions per unit of energy delivered by approxi-mately 80% and gas emissions by approximately 60%.
All EIs for low-carbon baseload plants are less than 250 kgCO2eq/MWh. However only nuclear power was able to deliver the2050 average target EI of less than 70 kg CO2eq/MWh (see Section1.2 for explanation). Of the FFS technologies, nuclear has the lowestEI by a factor of about six.
Solar thermal emissions will be lower with greater solar field,more storage and less reliance on gas backup support. Only two ofthe studies reviewed cover baseload solar thermal and both assumeheat storage and gas backup.
3.3. Electricity costs variation with carbon price
Introducing a carbon price increases the LCOE by the carbonprice per tonne of CO2eq multiplied by the EI of the technologyexpressed in tonnes.4 Obviously electricity costs will increase withcarbon price, which is expected to rise progressively to above $75per tonne of CO2eq by 2030 and exceed $150 per tonne of CO2eq by2050 as emission reduction targets are tightened [26].
Because of differences in EI, a carbon price affects the cost ofeach technology differently and changes their relative competi-tiveness, as illustrated in Fig. 3. Established nuclear technologystays as the lowest cost at any carbon price, and its relativecompetitiveness vis-à-vis other FFS technologies improves as thecarbon price rises. All three CCS technologies are the next mostcompetitive, but their relative competitiveness varies as the carbonprice rises, with IGCC becoming the least-cost CCS technology oncethe carbon price has risen above ∼$140 per tonne of CO2eq.
Solar thermal is currently the most expensive of any of the low-carbonbaseload technologies at anycarbonprice, andwould remainmore expensive than established nuclear even if its costs could be
4 A generator will generally pay a carbon cost based on the fuel or ‘stack’emissions, not on the full life-cycle emissions which includes other stages such asconstruction and decommissioning. The emissions cost for these other stages willtypically be included in the cost of these stages so will impact the LCOE. For fossil-fuel generators the fuel emissions are a substantial part of the total life-cycleemissions. According to WEC 2004, coal fuel emissions are between 92 and 99% ofthe total and gas between 81 and 85% [11]. We have used the LCA emissionintensity in this calculation.
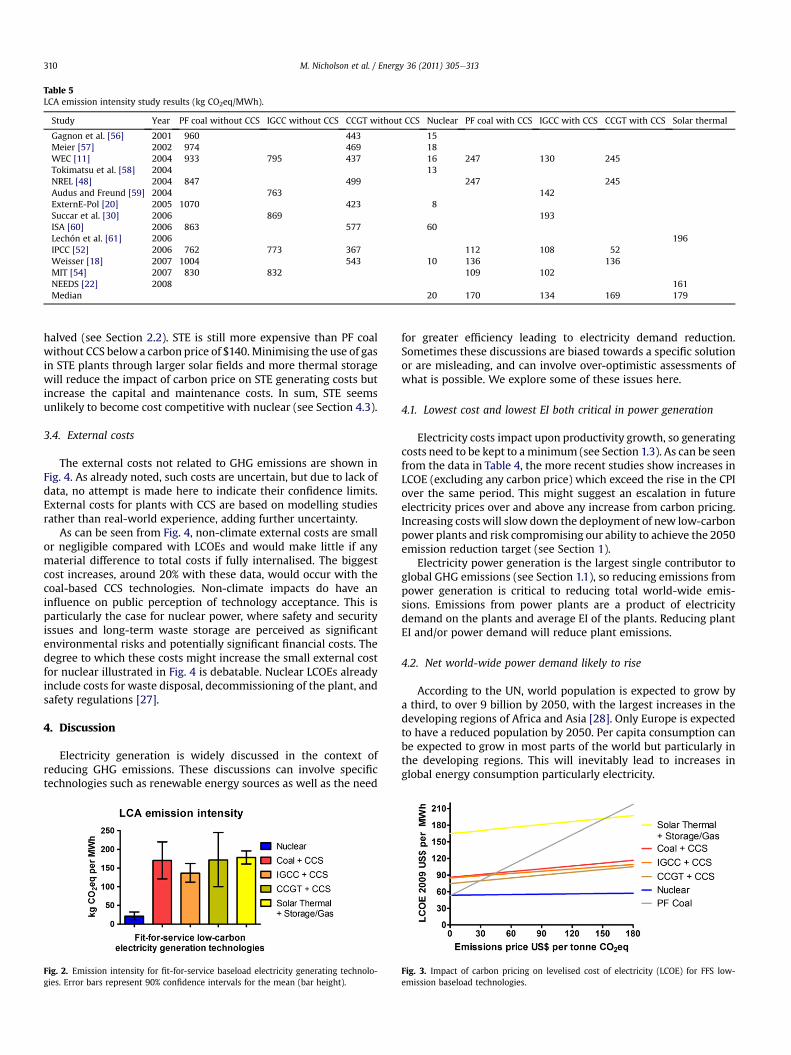
Table 5LCA emission intensity study results (kg CO2eq/MWh).
Study Year PF coal without CCS IGCC without CCS CCGT without CCS Nuclear PF coal with CCS IGCC with CCS CCGT with CCS Solar thermal
Gagnon et al. [56] 2001 960 443 15Meier [57] 2002 974 469 18WEC [11] 2004 933 795 437 16 247 130 245Tokimatsu et al. [58] 2004 13NREL [48] 2004 847 499 247 245Audus and Freund [59] 2004 763 142ExternE-Pol [20] 2005 1070 423 8Succar et al. [30] 2006 869 193ISA [60] 2006 863 577 60Lechón et al. [61] 2006 196IPCC [52] 2006 762 773 367 112 108 52Weisser [18] 2007 1004 543 10 136 136MIT [54] 2007 830 832 109 102NEEDS [22] 2008 161Median 20 170 134 169 179
M. Nicholson et al. / Energy 36 (2011) 305e313310
halved (see Section 2.2). STE is still more expensive than PF coalwithout CCS belowa carbon price of $140. Minimising the use of gasin STE plants through larger solar fields and more thermal storagewill reduce the impact of carbon price on STE generating costs butincrease the capital and maintenance costs. In sum, STE seemsunlikely to become cost competitive with nuclear (see Section 4.3).
3.4. External costs
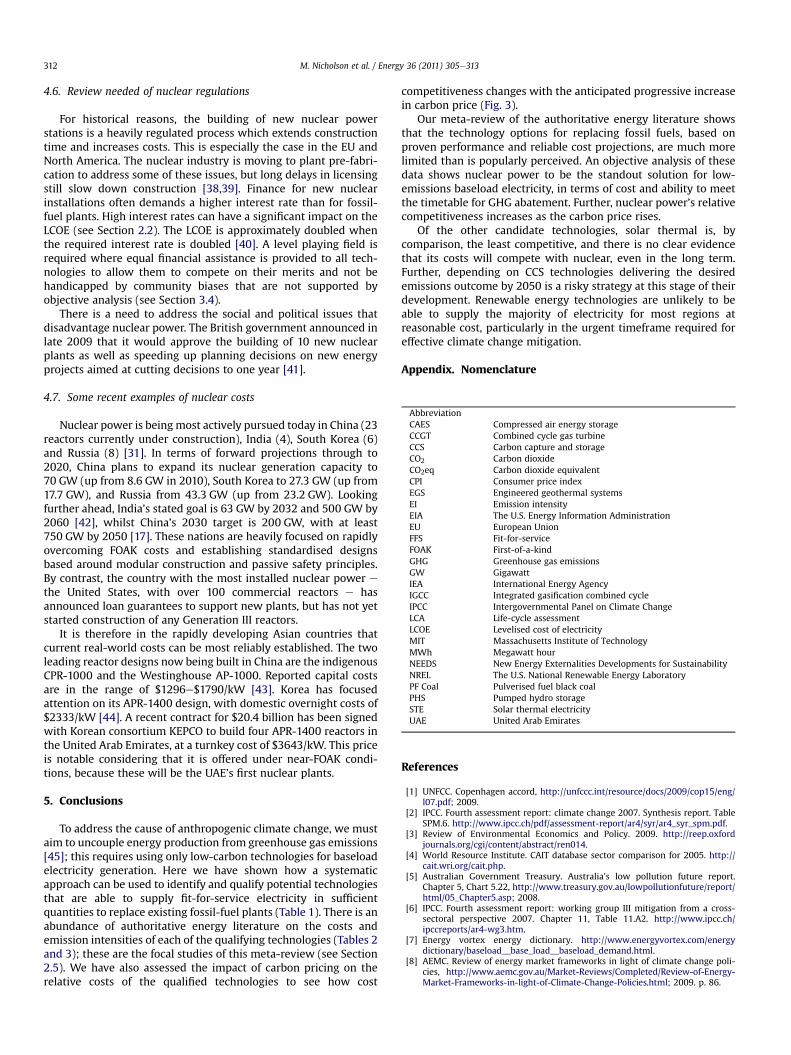
The external costs not related to GHG emissions are shown inFig. 4. As already noted, such costs are uncertain, but due to lack ofdata, no attempt is made here to indicate their confidence limits.External costs for plants with CCS are based on modelling studiesrather than real-world experience, adding further uncertainty.
As can be seen from Fig. 4, non-climate external costs are smallor negligible compared with LCOEs and would make little if anymaterial difference to total costs if fully internalised. The biggestcost increases, around 20% with these data, would occur with thecoal-based CCS technologies. Non-climate impacts do have aninfluence on public perception of technology acceptance. This isparticularly the case for nuclear power, where safety and securityissues and long-term waste storage are perceived as significantenvironmental risks and potentially significant financial costs. Thedegree to which these costs might increase the small external costfor nuclear illustrated in Fig. 4 is debatable. Nuclear LCOEs alreadyinclude costs for waste disposal, decommissioning of the plant, andsafety regulations [27].
4. Discussion
Electricity generation is widely discussed in the context ofreducing GHG emissions. These discussions can involve specifictechnologies such as renewable energy sources as well as the need
Fig. 2. Emission intensity for fit-for-service baseload electricity generating technolo-gies. Error bars represent 90% confidence intervals for the mean (bar height).
for greater efficiency leading to electricity demand reduction.Sometimes these discussions are biased towards a specific solutionor are misleading, and can involve over-optimistic assessments ofwhat is possible. We explore some of these issues here.
4.1. Lowest cost and lowest EI both critical in power generation
Electricity costs impact upon productivity growth, so generatingcosts need to be kept to aminimum (see Section 1.3). As can be seenfrom the data in Table 4, the more recent studies show increases inLCOE (excluding any carbon price) which exceed the rise in the CPIover the same period. This might suggest an escalation in futureelectricity prices over and above any increase from carbon pricing.Increasing costs will slow down the deployment of new low-carbonpower plants and risk compromising our ability to achieve the 2050emission reduction target (see Section 1).
Electricity power generation is the largest single contributor toglobal GHG emissions (see Section 1.1), so reducing emissions frompower generation is critical to reducing total world-wide emis-sions. Emissions from power plants are a product of electricitydemand on the plants and average EI of the plants. Reducing plantEI and/or power demand will reduce plant emissions.
4.2. Net world-wide power demand likely to rise
According to the UN, world population is expected to grow bya third, to over 9 billion by 2050, with the largest increases in thedeveloping regions of Africa and Asia [28]. Only Europe is expectedto have a reduced population by 2050. Per capita consumption canbe expected to grow in most parts of the world but particularly inthe developing regions. This will inevitably lead to increases inglobal energy consumption particularly electricity.
Fig. 3. Impact of carbon pricing on levelised cost of electricity (LCOE) for FFS low-emission baseload technologies.
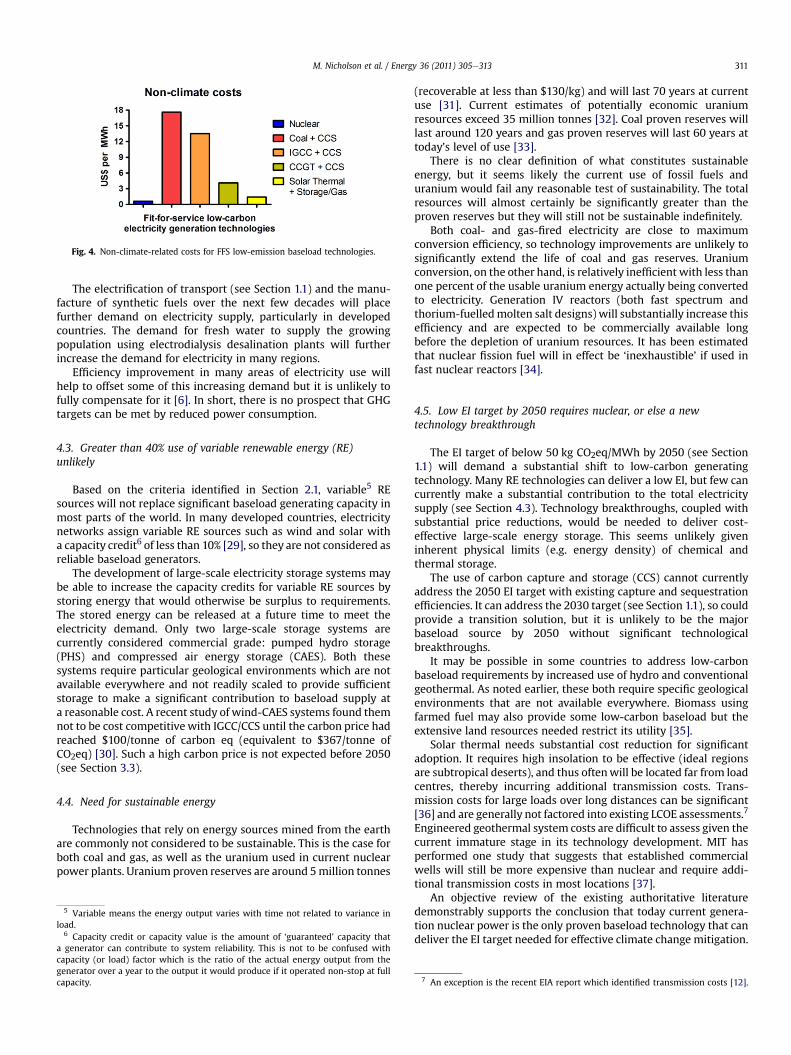
Fig. 4. Non-climate-related costs for FFS low-emission baseload technologies.
M. Nicholson et al. / Energy 36 (2011) 305e313 311
The electrification of transport (see Section 1.1) and the manu-facture of synthetic fuels over the next few decades will placefurther demand on electricity supply, particularly in developedcountries. The demand for fresh water to supply the growingpopulation using electrodialysis desalination plants will furtherincrease the demand for electricity in many regions.
Efficiency improvement in many areas of electricity use willhelp to offset some of this increasing demand but it is unlikely tofully compensate for it [6]. In short, there is no prospect that GHGtargets can be met by reduced power consumption.
4.3. Greater than 40% use of variable renewable energy (RE)unlikely
Based on the criteria identified in Section 2.1, variable5 REsources will not replace significant baseload generating capacity inmost parts of the world. In many developed countries, electricitynetworks assign variable RE sources such as wind and solar witha capacity credit6 of less than 10% [29], so they are not considered asreliable baseload generators.
The development of large-scale electricity storage systems maybe able to increase the capacity credits for variable RE sources bystoring energy that would otherwise be surplus to requirements.The stored energy can be released at a future time to meet theelectricity demand. Only two large-scale storage systems arecurrently considered commercial grade: pumped hydro storage(PHS) and compressed air energy storage (CAES). Both thesesystems require particular geological environments which are notavailable everywhere and not readily scaled to provide sufficientstorage to make a significant contribution to baseload supply ata reasonable cost. A recent study of wind-CAES systems found themnot to be cost competitive with IGCC/CCS until the carbon price hadreached $100/tonne of carbon eq (equivalent to $367/tonne ofCO2eq) [30]. Such a high carbon price is not expected before 2050(see Section 3.3).
4.4. Need for sustainable energy
Technologies that rely on energy sources mined from the earthare commonly not considered to be sustainable. This is the case forboth coal and gas, as well as the uranium used in current nuclearpower plants. Uranium proven reserves are around 5million tonnes
5 Variable means the energy output varies with time not related to variance inload.
6 Capacity credit or capacity value is the amount of ‘guaranteed’ capacity thata generator can contribute to system reliability. This is not to be confused withcapacity (or load) factor which is the ratio of the actual energy output from thegenerator over a year to the output it would produce if it operated non-stop at fullcapacity.
(recoverable at less than $130/kg) and will last 70 years at currentuse [31]. Current estimates of potentially economic uraniumresources exceed 35 million tonnes [32]. Coal proven reserves willlast around 120 years and gas proven reserves will last 60 years attoday’s level of use [33].
There is no clear definition of what constitutes sustainableenergy, but it seems likely the current use of fossil fuels anduranium would fail any reasonable test of sustainability. The totalresources will almost certainly be significantly greater than theproven reserves but they will still not be sustainable indefinitely.
Both coal- and gas-fired electricity are close to maximumconversion efficiency, so technology improvements are unlikely tosignificantly extend the life of coal and gas reserves. Uraniumconversion, on the other hand, is relatively inefficient with less thanone percent of the usable uranium energy actually being convertedto electricity. Generation IV reactors (both fast spectrum andthorium-fuelledmolten salt designs) will substantially increase thisefficiency and are expected to be commercially available longbefore the depletion of uranium resources. It has been estimatedthat nuclear fission fuel will in effect be ‘inexhaustible’ if used infast nuclear reactors [34].
4.5. Low EI target by 2050 requires nuclear, or else a newtechnology breakthrough
The EI target of below 50 kg CO2eq/MWh by 2050 (see Section1.1) will demand a substantial shift to low-carbon generatingtechnology. Many RE technologies can deliver a low EI, but few cancurrently make a substantial contribution to the total electricitysupply (see Section 4.3). Technology breakthroughs, coupled withsubstantial price reductions, would be needed to deliver cost-effective large-scale energy storage. This seems unlikely giveninherent physical limits (e.g. energy density) of chemical andthermal storage.
The use of carbon capture and storage (CCS) cannot currentlyaddress the 2050 EI target with existing capture and sequestrationefficiencies. It can address the 2030 target (see Section 1.1), so couldprovide a transition solution, but it is unlikely to be the majorbaseload source by 2050 without significant technologicalbreakthroughs.
It may be possible in some countries to address low-carbonbaseload requirements by increased use of hydro and conventionalgeothermal. As noted earlier, these both require specific geologicalenvironments that are not available everywhere. Biomass usingfarmed fuel may also provide some low-carbon baseload but theextensive land resources needed restrict its utility [35].
Solar thermal needs substantial cost reduction for significantadoption. It requires high insolation to be effective (ideal regionsare subtropical deserts), and thus oftenwill be located far from loadcentres, thereby incurring additional transmission costs. Trans-mission costs for large loads over long distances can be significant[36] and are generally not factored into existing LCOE assessments.7
Engineered geothermal system costs are difficult to assess given thecurrent immature stage in its technology development. MIT hasperformed one study that suggests that established commercialwells will still be more expensive than nuclear and require addi-tional transmission costs in most locations [37].
An objective review of the existing authoritative literaturedemonstrably supports the conclusion that today current genera-tion nuclear power is the only proven baseload technology that candeliver the EI target needed for effective climate change mitigation.
7 An exception is the recent EIA report which identified transmission costs [12].
M. Nicholson et al. / Energy 36 (2011) 305e313312
4.6. Review needed of nuclear regulations
For historical reasons, the building of new nuclear powerstations is a heavily regulated process which extends constructiontime and increases costs. This is especially the case in the EU andNorth America. The nuclear industry is moving to plant pre-fabri-cation to address some of these issues, but long delays in licensingstill slow down construction [38,39]. Finance for new nuclearinstallations often demands a higher interest rate than for fossil-fuel plants. High interest rates can have a significant impact on theLCOE (see Section 2.2). The LCOE is approximately doubled whenthe required interest rate is doubled [40]. A level playing field isrequired where equal financial assistance is provided to all tech-nologies to allow them to compete on their merits and not behandicapped by community biases that are not supported byobjective analysis (see Section 3.4).
There is a need to address the social and political issues thatdisadvantage nuclear power. The British government announced inlate 2009 that it would approve the building of 10 new nuclearplants as well as speeding up planning decisions on new energyprojects aimed at cutting decisions to one year [41].
4.7. Some recent examples of nuclear costs
Nuclear power is beingmost actively pursued today in China (23reactors currently under construction), India (4), South Korea (6)and Russia (8) [31]. In terms of forward projections through to2020, China plans to expand its nuclear generation capacity to70 GW (up from 8.6 GW in 2010), South Korea to 27.3 GW (up from17.7 GW), and Russia from 43.3 GW (up from 23.2 GW). Lookingfurther ahead, India’s stated goal is 63 GW by 2032 and 500 GW by2060 [42], whilst China’s 2030 target is 200 GW, with at least750 GW by 2050 [17]. These nations are heavily focused on rapidlyovercoming FOAK costs and establishing standardised designsbased around modular construction and passive safety principles.By contrast, the country with the most installed nuclear power ethe United States, with over 100 commercial reactors e hasannounced loan guarantees to support new plants, but has not yetstarted construction of any Generation III reactors.
It is therefore in the rapidly developing Asian countries thatcurrent real-world costs can be most reliably established. The twoleading reactor designs now being built in China are the indigenousCPR-1000 and the Westinghouse AP-1000. Reported capital costsare in the range of $1296e$1790/kW [43]. Korea has focusedattention on its APR-1400 design, with domestic overnight costs of$2333/kW [44]. A recent contract for $20.4 billion has been signedwith Korean consortium KEPCO to build four APR-1400 reactors inthe United Arab Emirates, at a turnkey cost of $3643/kW. This priceis notable considering that it is offered under near-FOAK condi-tions, because these will be the UAE’s first nuclear plants.
5. Conclusions
To address the cause of anthropogenic climate change, we mustaim to uncouple energy production from greenhouse gas emissions[45]; this requires using only low-carbon technologies for baseloadelectricity generation. Here we have shown how a systematicapproach can be used to identify and qualify potential technologiesthat are able to supply fit-for-service electricity in sufficientquantities to replace existing fossil-fuel plants (Table 1). There is anabundance of authoritative energy literature on the costs andemission intensities of each of the qualifying technologies (Tables 2and 3); these are the focal studies of this meta-review (see Section2.5). We have also assessed the impact of carbon pricing on therelative costs of the qualified technologies to see how cost
competitiveness changes with the anticipated progressive increasein carbon price (Fig. 3).
Our meta-review of the authoritative energy literature showsthat the technology options for replacing fossil fuels, based onproven performance and reliable cost projections, are much morelimited than is popularly perceived. An objective analysis of thesedata shows nuclear power to be the standout solution for low-emissions baseload electricity, in terms of cost and ability to meetthe timetable for GHG abatement. Further, nuclear power’s relativecompetitiveness increases as the carbon price rises.
Of the other candidate technologies, solar thermal is, bycomparison, the least competitive, and there is no clear evidencethat its costs will compete with nuclear, even in the long term.Further, depending on CCS technologies delivering the desiredemissions outcome by 2050 is a risky strategy at this stage of theirdevelopment. Renewable energy technologies are unlikely to beable to supply the majority of electricity for most regions atreasonable cost, particularly in the urgent timeframe required foreffective climate change mitigation.
Appendix. Nomenclature
Abbreviation
CAES Compressed air energy storage CCGT Combined cycle gas turbine CCS Carbon capture and storage CO2 Carbon dioxide CO2eq Carbon dioxide equivalent CPI Consumer price index EGS Engineered geothermal systems EI Emission intensity EIA The U.S. Energy Information Administration EU European Union FFS Fit-for-service FOAK First-of-a-kind GHG Greenhouse gas emissions GW Gigawatt IEA International Energy Agency IGCC Integrated gasification combined cycle IPCC Intergovernmental Panel on Climate Change LCA Life-cycle assessment LCOE Levelised cost of electricity MIT Massachusetts Institute of Technology MWh Megawatt hour NEEDS New Energy Externalities Developments for Sustainability NREL The U.S. National Renewable Energy Laboratory PF Coal Pulverised fuel black coal PHS Pumped hydro storage STE Solar thermal electricity UAE United Arab EmiratesReferences
[1] UNFCC. Copenhagen accord, http://unfccc.int/resource/docs/2009/cop15/eng/l07.pdf; 2009.
[2] IPCC. Fourth assessment report: climate change 2007. Synthesis report. TableSPM.6. http://www.ipcc.ch/pdf/assessment-report/ar4/syr/ar4_syr_spm.pdf.
[3] Review of Environmental Economics and Policy. 2009. http://reep.oxfordjournals.org/cgi/content/abstract/ren014.
[4] World Resource Institute. CAIT database sector comparison for 2005. http://cait.wri.org/cait.php.
[5] Australian Government Treasury. Australia’s low pollution future report.Chapter 5, Chart 5.22, http://www.treasury.gov.au/lowpollutionfuture/report/html/05_Chapter5.asp; 2008.
[6] IPCC. Fourth assessment report: working group III mitigation from a cross-sectoral perspective 2007. Chapter 11, Table 11.A2. http://www.ipcc.ch/ipccreports/ar4-wg3.htm.
[7] Energy vortex energy dictionary. http://www.energyvortex.com/energydictionary/baseload__base_load__baseload_demand.html.
[8] AEMC. Review of energy market frameworks in light of climate change poli-cies, http://www.aemc.gov.au/Market-Reviews/Completed/Review-of-Energy-Market-Frameworks-in-light-of-Climate-Change-Policies.html; 2009. p. 86.
M. Nicholson et al. / Energy 36 (2011) 305e313 313
[9] Abare. Energy in Australia. Table 11, http://www.abareconomics.com/publications_html/energy/energy_09/auEnergy09.pdf; 2009.
[10] US Energy Information Administration. World net electricity generation bytype, http://www.eia.doe.gov/iea/elec.html; 2005.
[11] World Energy Council. Comparison of energy systems using life cycleassessment, http://www.worldenergy.org/documents/lca2.pdf; 2004.
[12] US Energy Information Administration. Annual energy outlook, http://www.eia.doe.gov/oiaf/aeo/electricity_generation.html; 2010.
[13] Commission on Engineering and Technical Systems. Electricity in economicgrowth. The National Academies Press, http://www.nap.edu/openbook.php?record_id¼900&page¼8; 1986. p. 8.
[14] OECD. Projected costs of generating electricity. 2010. https://www.iea.org/publications/free_new_Desc.asp?PUBS_ID¼2207.
[15] UK Parliamentary Office of Science and Technology. Post Note 306. ElectricityStorage April 2008. http://www.parliament.uk/documents/upload/postpn306.pdf.
[16] Gen IV International Forum. http://www.gen-4.org.[17] World Nuclear Association. Nuclear power in China, http://www.world-
nuclear.org/info/inf63.html; April 2010.[18] Weisser D. A guide to life-cycle greenhouse gas (GHG) emissions from electric
supply technologies. Energy 2007;32(9):1543e59.[19] ATSE. The hidden costs of electricity: externalities of power generation in
Australia, http://www.atse.org.au/uploads/ATSEHiddenCostsElecreport.pdf;2009.
[20] ExternE-Pol. Externalities of energy: extension of accounting framework andpolicy applications: new energy technologies. Final Report on Work Package6, European Commission, http://www.externe.info/expolwp6.pdf; 2005.
[21] ExternE. Extern E: Externalities of energy. In: National implementation, vol.XX. CIEMAT, ES, European Commission; 1999.
[22] NEEDS. Technology assessment under stakeholder perspectives. StefanHirschberg. Feb 2009. www.needs-project.org/2009/16-02-2009/Hirschberg.ppt.
[23] Efron B, Gong G. A leisurely look at the bootstrap, the jackknife, and cross-validation. The American Statistician 1983;37:36e48, http://www.jstor.org/pss/2685844.
[24] NREL. Assessment of parabolic trough and power tower solar technology costand performance forecasts, http://www.nrel.gov/docs/fy04osti/34440.pdf;2003.
[25] NEEDS. Final report on technical data, costs, and life cycle inventories of solarthermal power plants, http://www.needs-project.org/docs/results/RS1a/RS1a%20D12.2%20Final%20report%20concentrating%20solar%20thermal%20power%20plants.pdf; 2008.
[26] Australian Government Treasury. Australia’s low pollution future report.Chapter 5, Chart 5.2, http://www.treasury.gov.au/lowpollutionfuture/report/html/05_Chapter5.asp; 2008.
[27] Cohen B. Reducing the hazards of nuclear power: insanity in action. Physicsand Society 1987;16(3), http://www.cab.cnea.gov.ar/difusion/Cohen.html.
[28] UN Population Division. World population prospects: the 2008 revision.http://esa.un.org/UNPP.
[29] AEMO. Electricity statement of opportunities for the national electricitymarket.Executive Briefing, http://www.aemo.com.au/planning/0410-0002.pdf; 2009.
[30] Succar Samir, Greenblatt Jeffery B, Williams Robert H. Comparing coal IGCCwith CCS and wind-CAES baseload power options, http://www.princeton.edu/∼ssuccar/recent/Succar_NETLPaper_May06.pdf; 2006.
[31] World Nuclear Association. World nuclear power reactors & uraniumrequirements, http://www.world-nuclear.org/info/reactors.html; Feb 2010.
[32] IPCC. Fourth assessment report: working group III energy supply. Chapter 4,http://www.ipcc.ch/pdf/assessment-report/ar4/wg3/ar4-wg3-chapter4.pdf;2007.
[33] Victor David, Morse Richard. Living with coal. Boston Review, http://bostonreview.net/BR34.5/victor_morse.php; Sep/Oct 2009.
[34] Computare. Nuclear fission fuel is inexhaustible. IEEE Xplore, http://www.computare.org/Support%20documents/Fora%20Input/CCC2006/Nuclear%20Paper%2006_05.htm; 2006.
[35] Wisconsin DOA. Biomass power plant in central Wisconsin, http://www.doa.state.wi.us/docs_view2.asp?docid¼54; Nov 2000.
[36] AEMO. Network extensions to remote areas: part 2, http://www.aemo.com.au/planning/0400-0005.pdf; Nov 2009.
[37] MIT. Future of geothermal energy. Massachusetts Institute of Technology,http://geothermal.inel.gov/publications/future_of_geothermal_energy.pdf;2006.
[38] Nuclear energy policy. Washington DC: Library of Congress, http://oai.dtic.mil/oai/oai?verb¼getRecord&metadataPrefix¼html&identifier¼ADA513533;Dec 2009.
[39] Weisser, et al. Nuclear power and post-2012 energy and climate changepolicies, http://dx.doi.org/10.1016/j.envsci.2008.04.001; 2009.
[40] EPRI. Review and comparison of recent studies for Australian electricitygeneration planning, http://pandora.nla.gov.au/pan/66043/20061201-0000/www.dpmc.gov.au/umpner/docs/commissioned/EPRI_report.pdf; 2006.
[41] The Independent. 10 new nuclear power stations named, http://www.independent.co.uk/news/uk/politics/10-new-nuclear-power-stations-named-1817643.html; Nov 2009.
[42] World Nuclear Association. Nuclear power in India, http://www.world-nuclear.org/info/inf53.html; April 2010.
[43] World Nuclear Association. The economics of nuclear power, http://www.world-nuclear.org/info/inf02.html; April 2010.
[44] World Nuclear Association. Nuclear power in South Korea, http://www.world-nuclear.org/info/inf81.html; April 2010.
[45] Shellenberger Michael, Nordhaus Ted, et al. Fast, clean, & cheap: cuttingglobal, warming’s Gordian knot. Harvard Law and Policy Review, http://thebreakthrough.org/blog/Fast%20Clean%20Cheap.pdf; 2008.
[46] MIT. The future of nuclear power, http://web.mit.edu/nuclearpower/pdf/nuclearpower-full.pdf; 2003.
[47] Tarjanne R, Luostarinen K. Competitiveness comparison of the electricityproduction alternatives. Lappeenranta University of Technology; 2003.
[48] NREL. Biomass power and conventional fossil systems with and without CO2sequestration, http://www.nrel.gov/docs/fy04osti/32575.pdf; 2004.
[49] University of Chicago. The economic future of nuclear power, http://www.ne.doe.gov/np2010/reports/NuclIndustryStudy-Summary.pdf; 2004.
[50] Royal Academy of Engineers. The cost of generating electricity, http://www.raeng.org.uk/news/publications/list/reports/Cost_Generation_Commentary.pdf;2004.
[51] San Diego Regional Renewable Energy Group. Potential for renewable energyin the San Diego region. Appendix E; 2005.
[52] IPCC. Carbon capture and storage, http://www.ipcc.ch/pdf/special-reports/srccs/srccs_wholereport.pdf; 2006.
[53] ANSTO. Introducing nuclear power to Australia, http://www.ansto.gov.au/__data/assets/pdf_file/0016/12445/nuclear_options_paper_Gittus_complete.pdf;2006.
[54] MIT. The future of coal e options for a carbon constrained world, http://www.ipcc.ch/pdf/special-reports/srccs/srccs_wholereport.pdf; 2007.
[55] MIT. Update of the MIT 2003 future of nuclear power, http://web.mit.edu/nuclearpower/pdf/nuclearpower-update2009.pdf; 2009.
[56] Gagnon Luc, et al. Life-cycle assessment of electricity generation options: thestatus of research in year 2001. Energy Policy 2002;30:1267e78.
[57] Meier Paul. Life-cycle assessment of electricity generation systems andapplications for climate change policy. University of Wisconsin; 2002.
[58] Tokimatsu Koji, et al. Evaluation of lifecycle CO2 emissions from the Japaneseelectric power sector in the 21st century under various nuclear scenarios.Energy Policy 2006;34:833e52.
[59] Audus H, Freund P. Climate change mitigation by biomass gasificationcombined with CO2 capture and storage. UK: IEA Greenhouse Gas R&D Pro-gramme; 2005.
[60] ISA University of Sydney. Life-cycle energy balance and greenhouse gasemissions of nuclear energy in Australia, http://www.isa.org.usyd.edu.au/publications/documents/ISA_Nuclear_Report.pdf; 2006.
[61] Lechón Yolanda, et al. Life cycle environmental impacts of electricityproduction by solar thermal technology in Spain. SolarPACES; 2006.