Embed Size (px)
Citation preview
//FS2/CUP/3-PAGINATION/HIL/2-PROOFS/3B2/9780521861724C15.3D 286 [286–305] 5.2.2007 7:22PM
C H A P T E R F I F T E E N
How body size mediates the roleof animals in nutrient cyclingin aquatic ecosystems
ROBERT O. HALL JR.University of Wyoming, USA
BENJAMIN J. KOCHUniversity of Wyoming, USA
MICHAEL C. MARSHALLUniversity of Wyoming, USA
BRAD W. TAYLORUniversity of Wyoming, USA
LUSHA M. TRONSTADUniversity of Wyoming, USA
IntroductionAquatic ecosystems have been fertile ground for understanding the extent to
which animals can alter nutrient cycling. Although animals have been included
in ecosystem models for years (for example, Teal, 1962), it is only more recently
that investigators have looked at animals, either as individuals, single species,
or assemblages, as agents regulating nutrient cycling (Kitchell et al., 1979;
Meyer, Schultz & Helfman, 1983; Grimm, 1988; Jones & Lawton, 1995). A recent
review details how animals can affect nutrient cycling in freshwater ecosystems
(Vanni, 2002), but the next step is to understand the controls on which animals
are important regulators of nutrient dynamics in ecosystems. One controlling
factor is determined by attributes of the animals themselves, such as their
body size.
Animals can regulate nutrient cycling directly or indirectly (Kitchell et al.,
1979; Vanni, 2002). Direct regulation is the transformation and transportation
of nutrients by animal ingestion, egestion, production and excretion. For exam-
ple, animal excretion can constitute the largest source of plant-available nitro-
gen (N) within an ecosystem (Hall, Tank & Dybdahl, 2003) and animals can move
nutrients between habitats (Meyer et al., 1983). Perhaps more common are
indirect controls, whereby animals alter nutrient cycling by changing the bio-
mass, production or distribution of the plants or microbes that take up
nutrients. For example, predatory fish can regulate phosphorus (P) dynamics
or nitrogen retention via a trophic cascade (Elser et al., 1998; Simon et al., 2004).
Body Size and the Structure and Function of Aquatic Ecosystems, eds. Alan G. Hildrew, David G. Raffaelli and RonniEdmonds-Brown. Published by Cambridge University Press. # British Ecological Society 2007.
//FS2/CUP/3-PAGINATION/HIL/2-PROOFS/3B2/9780521861724C15.3D 287 [286–305] 5.2.2007 7:22PM
In this paper we consider only direct effects of animals on nutrient cycling,
because predicting indirect effects in food webs contains much more uncer-
tainty (Wootton, 1994).
A point mentioned by Vanni (2002), that we expand on here, is the role of body
size in controlling the degree to which animals contribute to ecosystem nutrient
fluxes. Body size may control animal-mediated nutrient cycling by three main
mechanisms. First, small animals have higher metabolism and, therefore, higher
mass-specific excretion rates (Wen & Peters, 1994; Brown, Allen & Gillooly, this
volume). Thus, total biomass being equal, an assemblage with small animals may
have higher animal-mediated nutrient fluxes than one with large animals.
Second, as body size increases, allometric variation in structural tissue (e.g.
P-rich bone) may alter ratios of excreted nutrients. Third, large animals have larger
home ranges and are more likely to migrate long distances, so nutrient trans-
location by animals may also be a function of body size.
In this chapter we first address how body size controls nutrient fluxes in the
context of the first two mechanisms described above by using published and
unpublished data to examine the relationship between nutrient excretion and
body size. We also consider the spatial and temporal translocation of nutrients
by animal movements as a function of body size. In the second part of the
chapter we apply these findings to address how ecosystem-level nutrient cycling
will change as a function of variation in animal body size. In short, we know
excretion can vary as a function of body size, but does this variation matter in
ecosystems? We explore other factors that affect animal-mediated nutrient
cycling, such as variation in the biomass of animal assemblages and their
taxonomic composition, so that we can compare their influence to the effects
of body size. Lastly, predators, especially humans, may alter the size structure of
animal assemblages, and we consider how loss of large-bodied organism may
indirectly alter nutrient cycling (see also Jennings & Reynolds, this volume).
Body size and nutrient excretionRates
Aquatic animals excrete N and P in mostly mineral forms which are readily
taken up by microbes. The primary form of N is ammonium, which is excreted
via the gut in insects, or diffuses across the integument and gills of other
animals. Animals primarily excrete P in the form of PO43�. Nutrient excretion
rates vary with body size. In general, excretion rates (E) scale allometrically with
body mass (M):
E ¼ aMb (15:1)
where a and b are constants (Huxley, 1932; Peters, 1983; Wen & Peters, 1994;
Gillooly et al., 2001). For most aquatic animals, the relationship has an exponent
b< 1 indicating that excretion rates increase at a rate less than isometric with
B O D Y S I Z E A N D N U T R I E N T C Y C L I N G 287
//FS2/CUP/3-PAGINATION/HIL/2-PROOFS/3B2/9780521861724C15.3D 288 [286–305] 5.2.2007 7:22PM
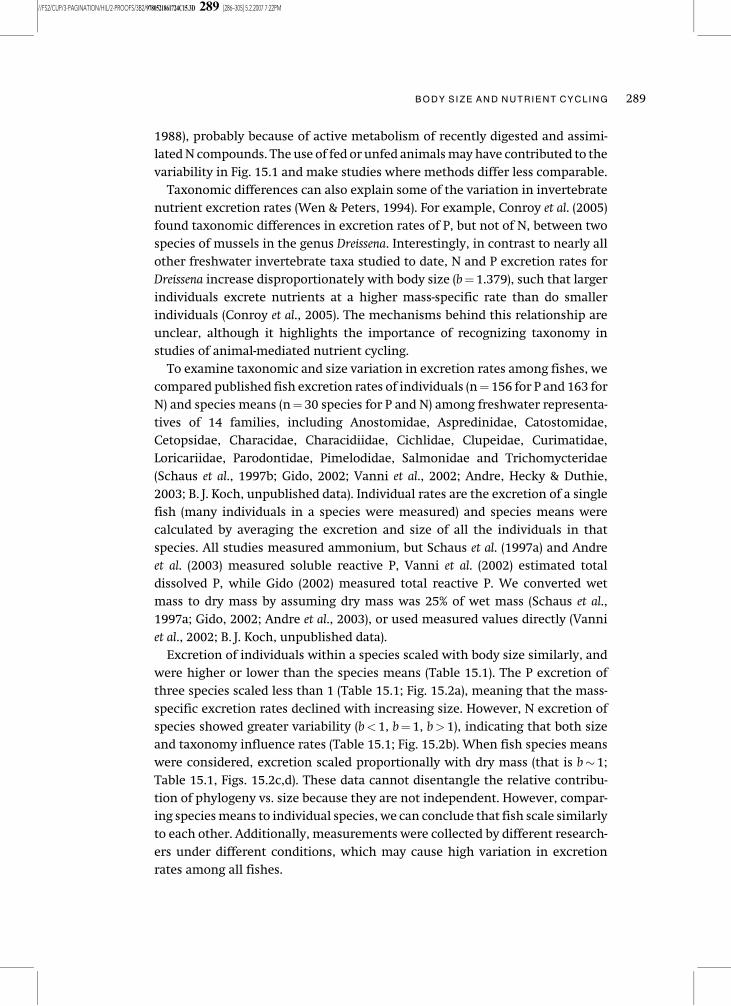
increasing body size (Wen & Peters, 1994). For example, individual ammonium
excretion rates for stream invertebrates, from at least 18 taxonomic orders,
scale to the 0.85 power of body mass (Fig. 15.1), implying that larger taxa excrete
at a lower rate for their size than smaller taxa. The mechanism for the less than
proportional increase in excretion rate is probably linked to metabolism, which
scales as the 3/4 power of body size (Brown et al., 2004; Brown et al., this volume).
However, for many specific groups of animals, b can be higher or lower than 3/4.
For example, b¼ 0.67 for N and 0.54 for P in zooplankton (Wen & Peters, 1994),
whereas macroinvertebrates (Fig. 15.1) are higher.
However, body size is not the sole factor controlling variation in animal
excretion rate. It is worth considering the influence of other variables, that
may alter or interact with the effects of body size, on animal-mediated nutrient
cycling in aquatic ecosystems. For example, temperature influences metabolic
processes, such as excretion rate (Peters, 1983; Fukuhara & Yasuda, 1989;
Zhuang, 2005) Metabolic theory (Gillooly et al., 2001; Brown et al., 2004; Brown
et al., this volume) provides a mechanistic framework for incorporating the
effects of both temperature and body size on excretion rate. Fed animals have
higher excretion rates than unfed animals (Gardner & Scavia, 1981; Grimm,
Figure 15.1 Ammonium excretion rates increase less than proportionally with body size
(b< 1) for many benthic stream invertebrate taxa, indicating that larger invertebrates
excrete ammonium at a lower rate per mg of body mass than do smaller invertebrates.
The regression line (log10 [excretion rate]¼�1.057þ 0.853log10 [mean individual body
mass]; n¼ 320, r2¼ 0.381, 95% CI on b [0.776� 0.937]) was estimated using type II, reduced
major axis linear regression (Bohonak & van der Linde, 2004). Data points were gathered
using identical methods on field-caught animals from six streams and represent total
excretion rates computed from one or more similarly-sized individuals of the same taxon
within the same incubated container (Hall et al., 2003; R. O. Hall, unpublished data; Koch,
2005; M. C. Marshall, unpublished data).
R . O . H A L L E T A L .288
//FS2/CUP/3-PAGINATION/HIL/2-PROOFS/3B2/9780521861724C15.3D 289 [286–305] 5.2.2007 7:22PM
1988), probably because of active metabolism of recently digested and assimi-
lated N compounds. The use of fed or unfed animals may have contributed to the
variability in Fig. 15.1 and make studies where methods differ less comparable.
Taxonomic differences can also explain some of the variation in invertebrate
nutrient excretion rates (Wen & Peters, 1994). For example, Conroy et al. (2005)
found taxonomic differences in excretion rates of P, but not of N, between two
species of mussels in the genus Dreissena. Interestingly, in contrast to nearly all
other freshwater invertebrate taxa studied to date, N and P excretion rates for
Dreissena increase disproportionately with body size (b¼1.379), such that larger
individuals excrete nutrients at a higher mass-specific rate than do smaller
individuals (Conroy et al., 2005). The mechanisms behind this relationship are
unclear, although it highlights the importance of recognizing taxonomy in
studies of animal-mediated nutrient cycling.
To examine taxonomic and size variation in excretion rates among fishes, we
compared published fish excretion rates of individuals (n¼ 156 for P and 163 for
N) and species means (n¼30 species for P and N) among freshwater representa-
tives of 14 families, including Anostomidae, Aspredinidae, Catostomidae,
Cetopsidae, Characidae, Characidiidae, Cichlidae, Clupeidae, Curimatidae,
Loricariidae, Parodontidae, Pimelodidae, Salmonidae and Trichomycteridae
(Schaus et al., 1997b; Gido, 2002; Vanni et al., 2002; Andre, Hecky & Duthie,
2003; B. J. Koch, unpublished data). Individual rates are the excretion of a single
fish (many individuals in a species were measured) and species means were
calculated by averaging the excretion and size of all the individuals in that
species. All studies measured ammonium, but Schaus et al. (1997a) and Andre
et al. (2003) measured soluble reactive P, Vanni et al. (2002) estimated total
dissolved P, while Gido (2002) measured total reactive P. We converted wet
mass to dry mass by assuming dry mass was 25% of wet mass (Schaus et al.,
1997a; Gido, 2002; Andre et al., 2003), or used measured values directly (Vanni
et al., 2002; B. J. Koch, unpublished data).
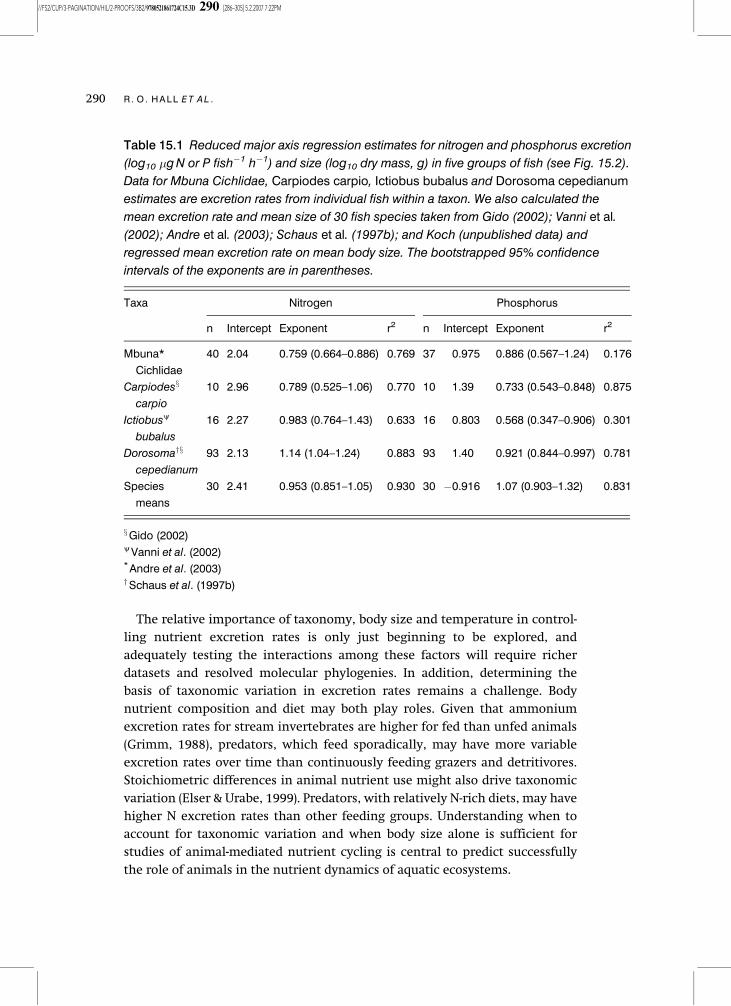
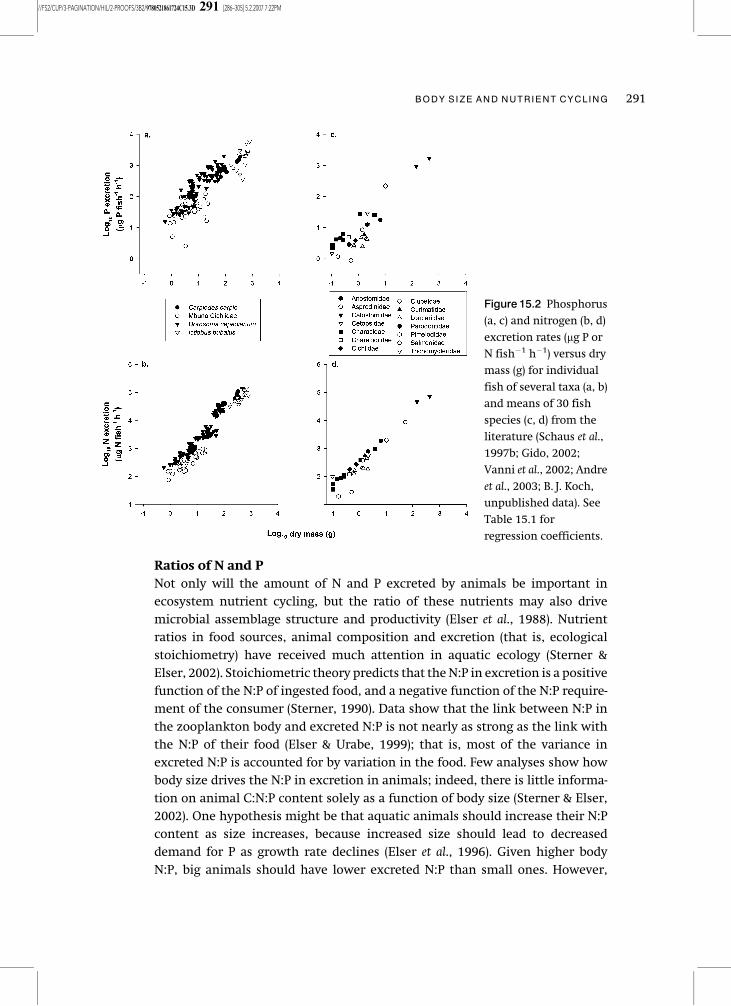
Excretion of individuals within a species scaled with body size similarly, and
were higher or lower than the species means (Table 15.1). The P excretion of
three species scaled less than 1 (Table 15.1; Fig. 15.2a), meaning that the mass-
specific excretion rates declined with increasing size. However, N excretion of
species showed greater variability (b<1, b¼ 1, b>1), indicating that both size
and taxonomy influence rates (Table 15.1; Fig. 15.2b). When fish species means
were considered, excretion scaled proportionally with dry mass (that is b�1;
Table 15.1, Figs. 15.2c,d). These data cannot disentangle the relative contribu-
tion of phylogeny vs. size because they are not independent. However, compar-
ing species means to individual species, we can conclude that fish scale similarly
to each other. Additionally, measurements were collected by different research-
ers under different conditions, which may cause high variation in excretion
rates among all fishes.
B O D Y S I Z E A N D N U T R I E N T C Y C L I N G 289
//FS2/CUP/3-PAGINATION/HIL/2-PROOFS/3B2/9780521861724C15.3D 290 [286–305] 5.2.2007 7:22PM
The relative importance of taxonomy, body size and temperature in control-
ling nutrient excretion rates is only just beginning to be explored, and
adequately testing the interactions among these factors will require richer
datasets and resolved molecular phylogenies. In addition, determining the
basis of taxonomic variation in excretion rates remains a challenge. Body
nutrient composition and diet may both play roles. Given that ammonium
excretion rates for stream invertebrates are higher for fed than unfed animals
(Grimm, 1988), predators, which feed sporadically, may have more variable
excretion rates over time than continuously feeding grazers and detritivores.
Stoichiometric differences in animal nutrient use might also drive taxonomic
variation (Elser & Urabe, 1999). Predators, with relatively N-rich diets, may have
higher N excretion rates than other feeding groups. Understanding when to
account for taxonomic variation and when body size alone is sufficient for
studies of animal-mediated nutrient cycling is central to predict successfully
the role of animals in the nutrient dynamics of aquatic ecosystems.
Table 15.1 Reduced major axis regression estimates for nitrogen and phosphorus excretion
(log10 �g N or P fish�1 h�1) and size (log10 dry mass, g) in five groups of fish (see Fig. 15.2).
Data for Mbuna Cichlidae, Carpiodes carpio, Ictiobus bubalus and Dorosoma cepedianum
estimates are excretion rates from individual fish within a taxon. We also calculated the
mean excretion rate and mean size of 30 fish species taken from Gido (2002); Vanni et al.
(2002); Andre et al. (2003); Schaus et al. (1997b); and Koch (unpublished data) and
regressed mean excretion rate on mean body size. The bootstrapped 95% confidence
intervals of the exponents are in parentheses.
Taxa Nitrogen Phosphorus
n Intercept Exponent r2 n Intercept Exponent r2
Mbuna*
Cichlidae
40 2.04 0.759 (0.664–0.886) 0.769 37 0.975 0.886 (0.567–1.24) 0.176
Carpiodesx
carpio
10 2.96 0.789 (0.525–1.06) 0.770 10 1.39 0.733 (0.543–0.848) 0.875
Ictiobusy
bubalus
16 2.27 0.983 (0.764–1.43) 0.633 16 0.803 0.568 (0.347–0.906) 0.301
Dorosomayx
cepedianum
93 2.13 1.14 (1.04–1.24) 0.883 93 1.40 0.921 (0.844–0.997) 0.781
Species
means
30 2.41 0.953 (0.851–1.05) 0.930 30 �0.916 1.07 (0.903–1.32) 0.831
xGido (2002)yVanni et al. (2002)* Andre et al. (2003)ySchaus et al. (1997b)
R . O . H A L L E T A L .290
//FS2/CUP/3-PAGINATION/HIL/2-PROOFS/3B2/9780521861724C15.3D 291 [286–305] 5.2.2007 7:22PM
Ratios of N and P
Not only will the amount of N and P excreted by animals be important in
ecosystem nutrient cycling, but the ratio of these nutrients may also drive
microbial assemblage structure and productivity (Elser et al., 1988). Nutrient
ratios in food sources, animal composition and excretion (that is, ecological
stoichiometry) have received much attention in aquatic ecology (Sterner &
Elser, 2002). Stoichiometric theory predicts that the N:P in excretion is a positive
function of the N:P of ingested food, and a negative function of the N:P require-
ment of the consumer (Sterner, 1990). Data show that the link between N:P in
the zooplankton body and excreted N:P is not nearly as strong as the link with
the N:P of their food (Elser & Urabe, 1999); that is, most of the variance in
excreted N:P is accounted for by variation in the food. Few analyses show how
body size drives the N:P in excretion in animals; indeed, there is little informa-
tion on animal C:N:P content solely as a function of body size (Sterner & Elser,
2002). One hypothesis might be that aquatic animals should increase their N:P
content as size increases, because increased size should lead to decreased
demand for P as growth rate declines (Elser et al., 1996). Given higher body
N:P, big animals should have lower excreted N:P than small ones. However,
Figure 15.2 Phosphorus
(a, c) and nitrogen (b, d)
excretion rates (mg P or
N fish�1 h�1) versus dry
mass (g) for individual
fish of several taxa (a, b)
and means of 30 fish
species (c, d) from the
literature (Schaus et al.,
1997b; Gido, 2002;
Vanni et al., 2002; Andre
et al., 2003; B. J. Koch,
unpublished data). See
Table 15.1 for
regression coefficients.
B O D Y S I Z E A N D N U T R I E N T C Y C L I N G 291
//FS2/CUP/3-PAGINATION/HIL/2-PROOFS/3B2/9780521861724C15.3D 292 [286–305] 5.2.2007 7:22PM
this effect may be hidden by phylogeny and allometric constraints, as taxonomy
correlates with body size because large animals are often vertebrates that have
high P storage in bone apatite, and presumably a high N:P in excreta.
Data on aquatic animals suggest that excreted N:P increases with body size.
Wen and Peters (1994), showed that log N excretion rate (mg N/d) increased more
steeply with body mass than did excreted P for zooplankton. The difference in
the exponents is 0.13, which corresponds to the exponent for N:P of excretion
vs. body mass. Thus the N:P of excretion increases with body mass, suggesting
that mechanisms other than growth rate control the relationship of excreted
N:P with body size.
Data from some vertebrates also suggest increases in the N:P excreted with
body size. Excretion N:P in fishes and amphibians from a Piedmont stream in
Venezuela was positively related to body size, which agrees with qualitative
predictions based on a decreasing body N:P with increasing body mass in
vertebrates (Vanni et al., 2002b). For example, bony-scaled armoured catfishes
(Loricariidae) had particularly low body N:P and therefore high N:P in excretion
(Vanni et al., 2002). Tadpoles (families Bufonidae and Ranidae) had low excreted
N:P; because they do not have ossified bones (low skeletal demand for P). These
studies, although few, suggest that not only will body size determine the rates of
nutrient regeneration, but it will also determine the ratio of these nutrients,
with the data so far suggesting mostly increasing N:P with body size.
Mechanisms for this increase are unclear, and certainly vary across taxa. For
example, vertebrates will have proportionally more bone as their size increases
(Sterner & Elser, 2002), which will increase P demand (lowering P excretion)
with body size.
Body size and nutrient translocationAquatic animals can alter nutrient cycling by moving nutrients from one loca-
tion to another, thus subsidizing the receiving habitat (Kitchell et al., 1979;
Vanni, 2002). In some instances this nutrient movement is between habitats
within an ecosystem such as, for example, benthic feeding fish that excrete
nutrients in the pelagic zone (Vadeboncoeur, Vander Zanden & Lodge, 2002) or
haemulid grunts that feed in seagrass beds at night and rest above coral heads
during the day, where they release nutrients that stimulate coral growth (Meyer
et al., 1983). In other cases, animals move nutrients between ecosystems on a
daily basis; e.g. ocean-foraging river otters (Lontra canadensis) excrete nutrients in
discrete locations in terrestrial habitat (Ben-David et al., 2005). Less mobile or
small-sized animals may actually concentrate nutrients at high levels in local-
ized areas (Reinertsen et al., 1986). In contrast, Pacific salmon (Onchorhynchus
spp.) transport nutrients from the ocean to rivers via an annual long-distance
spawning migration (Gende et al., 2002). The degree of movement will be
determined in part by the speed at which animals move and the behavioural
R . O . H A L L E T A L .292
//FS2/CUP/3-PAGINATION/HIL/2-PROOFS/3B2/9780521861724C15.3D 293 [286–305] 5.2.2007 7:22PM
constraints on their home range. Both of these controls on movements should
scale with body size.
The distance moved by aquatic animals will depend on their body size because
swimming speed scales with animal body size (Peters, 1983). For a given time
travelled, a big animal can migrate further than a small one. Over large size
ranges, an animal’s Reynolds number constrains movement (e.g. zooplankter
versus a salmon). Small animals (e.g. rotifers) move very slowly because their
short length confers a low Reynolds number, and therefore viscous forces
are much higher than inertial forces. Within fishes that have high Reynolds
numbers, swimming speed scales at about M0.14 (Weihs, 1977) assuming
M/ length2.6 (Peters, 1983). These modelled swimming speeds include both
Reynolds number effects plus allometric scaling of swimming force and meta-
bolic costs. Animals with lower Reynolds numbers have a steeper positive
relationship between body mass and swimming speed, probably because of
the more pronounced effects of viscous forces at small sizes. Swimming speed
in diving beetles (Dytiscidae), increases as M0.36 (Nachtigall, 1977) assuming
M/ L2.5 (Benke et al., 1999). Thus, the decline in swimming speed for small
animals probably decreases more quickly with body size than it does for fish.
Behavioural constraints on home-range size and migration will also control
nutrient movement by animals. Home range scales with body size in mammals
at roughly M1 (Jetz et al., 2004). Home-range sizes of fishes are similar to
mammals, scaling as M1.1, while insects and crustaceans are at M0.7 and mol-
luscs at M0.55 (Alimov, 2003). Given that distance moved will scale as the square-
root of area, distance moved for fishes should then scale as approximately M0.5.
This rate of increase with body size in the actual distance moved by animals is
higher than that for speed alone, because home range is determined by many
more attributes than is speed. These include, for example, resource require-
ments and interactions with conspecifics (Jetz et al., 2004). Animals that trans-
port substantial nutrients among habitats are likely to be large, as in Pacific
salmon (Gende et al., 2002), river otters, (Ben-David et al., 2005), and the long-
distance migratory fish, sapuara (Semaprochilodus kneri) (Winemiller & Jepsen,
2004). It is important to consider the strong effect of behaviour; the much
smaller sapuara migrates long distances along rivers, and therefore transfers
nutrients much further than does the coastal river otter. Coral reef fishes are
large enough to travel long distances, but many stay in one spot on the reef all
their lives. Thus, while large animals are more likely to move nutrients, behav-
ioural characteristics also control this distance.
Consequences of size-varying nutrient cyclingVariation in body-size distributions
Because excretion rates typically increase less than proportionally with animal
body size, variation in size distributions can partially control animal-driven
B O D Y S I Z E A N D N U T R I E N T C Y C L I N G 293
//FS2/CUP/3-PAGINATION/HIL/2-PROOFS/3B2/9780521861724C15.3D 294 [286–305] 5.2.2007 7:22PM
nutrient mineralization and storage in ecosystems. Here we ask to what degree
does variation in animal size distribution regulate nutrient mineralization?
Researchers have described a wide variety of biomass-size distributions (also
called size spectra) for aquatic animal assemblages, including flat or smooth,
uni-, bi- and poly-modal, and step or asymptotic functions. Size distributions
can vary considerably in space and time within and among aquatic habitats
(Hanson, Prepas & Mackay, 1989; Stead et al., 2005), complicating generalizations
(see Warwick, this volume). The diversity of methods in body-size estimations (for
example, Morin & Nadon, 1991; Ramsay et al., 1997; Baca & Threlkeld, 2000) and
analytical techniques, such as different sieve or size classes, further complicate
size-spectra summaries (Cyr & Pace, 1993; Robson, Barmuta & Fairweather, 2005).
However, when only the invertebrate portions of published aquatic assemblage
spectra are included (that is, smaller and larger portions excluded), clearer pat-
terns of shape categories emerge. Most size spectra have biomass peaks that are
skewed left, meaning larger animals generally account for most of the total
biomass, even though they may be outnumbered by smaller ones.
Size distributions in lakes vary as a function of habitat. Studies that include
multiple habitat types within the same lake suggest that pelagic and littoral
assemblages tend to have bimodal distributions of invertebrates (Hanson et al.,
1989; Cyr & Pace, 1993; Rasmussen, 1993) and polymodal distributions when
fishes are included (Gaedke, 1992), whereas profundal (and sublittoral) distri-
butions tend to be unimodal (Hanson et al., 1989). The magnitude and locations
of biomass peaks and troughs also vary among habitats within lakes; littoral
habitats have peaks at larger body sizes. For example, the two biomass maxima
for littoral habitats tended to occur between 1–4 mg and 64–256 mg wet mass
(Rasmussen, 1993), whereas the two peak densities of pelagic zooplankton
occurred between 0.044–0.125 mg and 2.0–11.3mg dry mass for small and large
animals, respectively (Cyr & Pace, 1993).
Streams generally have unimodal biomass size distributions (Cattaneo, 1993;
Bourassa & Morin, 1995; Mercier et al., 1999; Schmid, Tokeshi & Schmid-Araya,
2002). Body-size maxima, as equivalent to a spherical diameter, were between
2–4 mm in streams (Cattaneo, 1993), and the average individual biomass
increased slightly with increasing trophic status from 24–40 mg dry mass in
oligotrophic to urban eutrophic streams, respectively (Bourassa & Morin,
1995). Overall, although unimodality is robust across many streams, total bio-
mass can vary by an order of magnitude (for example, Bourassa & Morin, 1995)
suggesting possible dramatic differences in animal driven nutrient fluxes
within a stream system.
Estimating nutrient flux from biomass size distributions
Animal assemblages with different size distributions should have different
nutrient supply rates to ecosystems, all else being equal. To illustrate this
R . O . H A L L E T A L .294
//FS2/CUP/3-PAGINATION/HIL/2-PROOFS/3B2/9780521861724C15.3D 295 [286–305] 5.2.2007 7:22PM
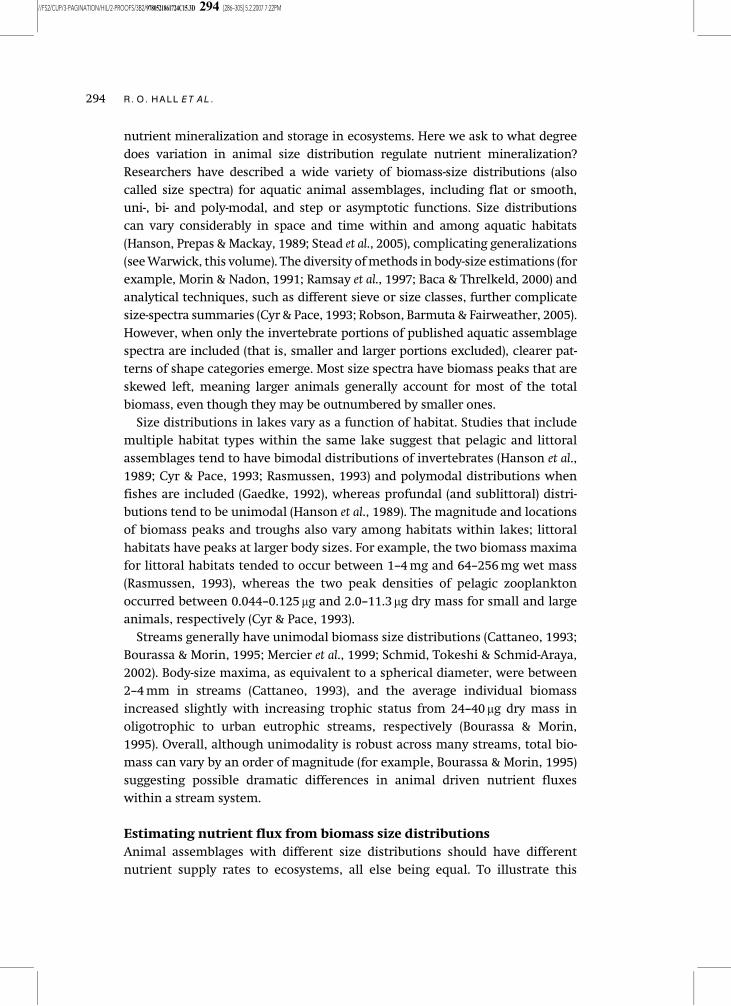
point we used data-capturing software to extract published size spectra from
plots. We gathered three representative aquatic animal size spectra: a bimodal
distribution with proportionally more large individuals (Fig. 15.3a), a strongly
peaked bimodal distribution (Fig. 15.3b) and a unimodal distribution (Fig. 15.3c,
Rasmussen, 1993). We assumed dry mass was 25% of wet mass (Feller &
Warwick, 1988) and normalized the literature spectra data to have equivalent
total biomasses (1000 mg dry mass m�2) while preserving the same distribution
shape in the original data sets. For each of these three animal assemblages, we
then calculated the P flux supplied by excretion for each size class (Figs. 15.3d–f ),
using a negative relationship between mass-specific excretion rate and body size
(mg P mg dry mass�1 h�1¼ 0.0954[dry mass](0.54�1); Wen & Peters, 1994). While
this analysis accounts for variation in animal excretion rate due to body size, it
does not incorporate the effects of potentially different temperatures or taxo-
nomic composition among animal assemblages. Nevertheless, despite total
biomass being the same for the three communities, total nutrient flux (cumu-
lative area of rectangles) from each of the three animal communities is not
equivalent, varying by almost a factor of two in this example (60, 115 and 104 mg
P m�2 h�1 for Figs. 15.3d,e & f, respectively). Furthermore, the shapes of the
Figure 15.3 (a–c) Representative
animal size spectra from three
littoral ecosystems: (a) Lake
Brome, (b) Lake Waterloo, (c) Lake
Bromont (Rasmussen, 1993).
Total biomass (mg dry mass m�2)
has been normalized to 1000 mg
dry mass m�2 for the three
communities. Size classes are
Log2 (mg dry mass). (d–f) Modelled
P fluxes (mg P m�2 h�1) supplied
by excretion for the three
assemblages, assuming a
negative relationship between
mass-specific excretion rate and
body size. Total nutrient flux
varies nearly two-fold for the
three communities (60, 115 and
104 mgP m�2 h�1 for panels d, e
and f, respectively) and the
shapes of nutrient flux
distributions changed relative to
size spectra.
B O D Y S I Z E A N D N U T R I E N T C Y C L I N G 295
//FS2/CUP/3-PAGINATION/HIL/2-PROOFS/3B2/9780521861724C15.3D 296 [286–305] 5.2.2007 7:22PM
nutrient flux distributions differ from their respective biomass size spectra. For
example, although larger animals comprise most of the total biomass in
Fig. 15.3a, small- and medium-sized animals supply the bulk of the nutrient
flux from this assemblage (Fig. 15.3d). Thus the size spectra of animal commun-
ities have important consequences on the supply and cycling of nutrients, and
those size classes that contribute most to total assemblage nutrient flux are not
necessarily the most biomass-rich size classes in the assemblage.
Predator control of prey body size and nutrient cycling
The well-known impact of predators on prey size structure may alter nutrient
cycling in aquatic ecosystems. Fish predators can decrease average size of prey
by eating large zooplankton (for example, Brooks & Dodson, 1965; Li, Wetterer &
Hairston, 1985) and large benthic invertebrates in lakes (Blumenshine, Lodge &
Hodgson, 2000). Alternatively, planktonic invertebrate predators, such as
Chaoborus, select small zooplankton (for example, Dodson, 1974), increasing
average prey body size. In streams, predatory invertebrates, fish and mammals
tend to consume the largest individuals of their prey (Quinn & Kinnison, 1999;
Allan, 2001; Woodward & Warren, this volume).
In addition to changes in size structure via consumptive effects, the presence
of predators can alter prey-size distribution simply through non-consumptive
effects, such as chemical cues (for example, Tollrian, 1995; Peckarsky et al.,
2002) and excretion (Ramcharan, France & McQueen, 1996). Simultaneous to
their effects on body size, predators can also affect prey physiology by increas-
ing the allocation of nutrients to structural cells, (for example, Lively, 1986;
Vanni, 1987; Crowl & Covich, 1990; Stibor, 1992; Barry, 1994; Arendt & Wilson,
2000; Dahl & Peckarsky, 2002), which may change the composition of con-
sumer-mineralized nutrients.
Altered size structure of the prey assemblage may change nutrient cycling,
because mass-specific excretion rate decreases with increasing animal size.
Additionally, body size affects the nutrient ratios at which animals excrete.
Changes in excretion N:P can alter the supply of the nutrient that limits primary
producers. Elser et al. (1988) suggest that phytoplankton communities are more
likely P-limited when the zooplankton assemblage includes large-bodied indi-
viduals and N-limited when the zooplankton assemblage is mainly small-bodied
individuals.
Understanding how changes in the size structure of prey can affect nutrient
cycling is not straightforward, because predators can simultaneously alter prey
abundance and biomass, and regenerate nutrients by consuming prey. Bartell
(1981) modelled P cycling under differing levels of predation using previously
published data on zooplankton size and biomass in lakes, and a mass-specific
excretion model for zooplankton. Nutrient fluxes from zooplankton did
not always increase when the assemblage switched from large-bodied to the
R . O . H A L L E T A L .296
//FS2/CUP/3-PAGINATION/HIL/2-PROOFS/3B2/9780521861724C15.3D 297 [286–305] 5.2.2007 7:22PM
small-bodied individuals that have greater mass-specific excretion rates. In fact,
P fluxes either remained similar, increased or decreased when lakes were
altered from low to high planktivore abundance, depending on changes in
total zooplankton biomass. However, nutrients may be more available in lakes
with abundant zooplanktivorous fish, because smaller zooplankton turn P over
faster than larger-bodied zooplankton (Henry, 1985). In addition to zooplank-
ton, fish can also be an important source of nutrients to primary producers.
Some studies have reported that the nutrient flux from zooplankton is much
larger than fluxes from fish (Ramcharan et al., 1996), while others found the
reverse (Vanni & Findlay, 1990; Carpenter et al., 1992). Boers, Vanballegooijen &
Uunk, (1991) showed that the main P source switched from zooplankton to fish
as planktivore biomass increased.
Regardless of which animal supplies more nutrients, their body size can affect
nutrient cycling. To illustrate how size structure can change nutrient supply and
demand we use lakes with low and high planktivorous fish abundance. In lakes
with low planktivore abundance, both large and small zooplankton may be
present (Fig. 15.4a), but the assemblage is mainly composed of small zooplank-
ton when planktivores are abundant (solid line, Fig. 15.4c). Compensatory
increases in the number of small zooplankton may result when fish are present
(dashed line, Fig. 15.4c); however, most studies show an overall decrease in total
zooplankton biomass (for example, Vanni & Findlay, 1990). When the density of
planktivorous fish is low (that is, both large and small zooplankton are present),
zooplankton excrete at a range of N:P ratios (grey line is N; black line is P;
Figure 15.4b); however, zooplankton excrete at a lower N:P ratio when plank-
tivorous fish are abundant (causing N to be potentially limiting). Based on
modelling by Bartell (1981), changes in zooplankton size structure may either
increase, decrease or not change lake nutrient fluxes (Fig. 15.4d), depending on
compensatory changes in assemblage biomass. In contrast to planktivorous
fish, planktonic-invertebrate predators selectively consume small zooplankton,
resulting in a large-bodied prey assemblage excreting at a high N:P ratio.
Depending on biomass, prey nutrient fluxes could change in either direction
but may cause P to be limiting.
The effect of predators on zooplankton body size in temperate lakes is well
known; however, to our knowledge no studies have investigated how shifts in
body size of stream invertebrates could alter nutrient cycling. Because stream
predators selectively consume large-bodied prey, similar to planktivores feeding
on zooplankton, we suggest that a decline in N:P mineralization and an increase
in mineralization rates may hold for streams. However, even with the advances
in methods to estimate pools and fluxes of nutrients in streams, the effects of
predators on prey body size and nutrient cycling has not been investigated, even
though in certain cases stream invertebrates can be an important source of
ammonium (Grimm, 1988; Hall et al., 2003; Koch, 2005).
B O D Y S I Z E A N D N U T R I E N T C Y C L I N G 297
//FS2/CUP/3-PAGINATION/HIL/2-PROOFS/3B2/9780521861724C15.3D 298 [286–305] 5.2.2007 7:22PM
The effect of harvesting-induced changes in animal size
structure on nutrient cycling
Harvesting by humans affects the size structure of aquatic animal assemblages,
and these altered size distributions may affect the rates and types of nutrients
mineralized by animals (Jennings & Reynolds, this volume; Persson & De Roos,
this volume). Similar to many other animals, humans selectively harvest large
individuals and species (Pauly et al., 1998; Jackson et al., 2001; Roy et al., 2003;
Allan et al., 2005). Size-selective harvesting can substantially change species
composition and food-web structure (for example, removal of predators), lead-
ing to fishing down the food web – a process by which larger species, often
predators, with slower growth rates are successively removed from the assem-
blage, leaving smaller species with faster growth rates (and thus higher mass-
specific nutrient excretion) that occupy lower trophic levels (Pauly et al., 1998;
Welcomme, 1999). In addition, size-selective harvesting can decrease body size
indirectly, by causing earlier maturation at smaller sizes via rapid evolutionary
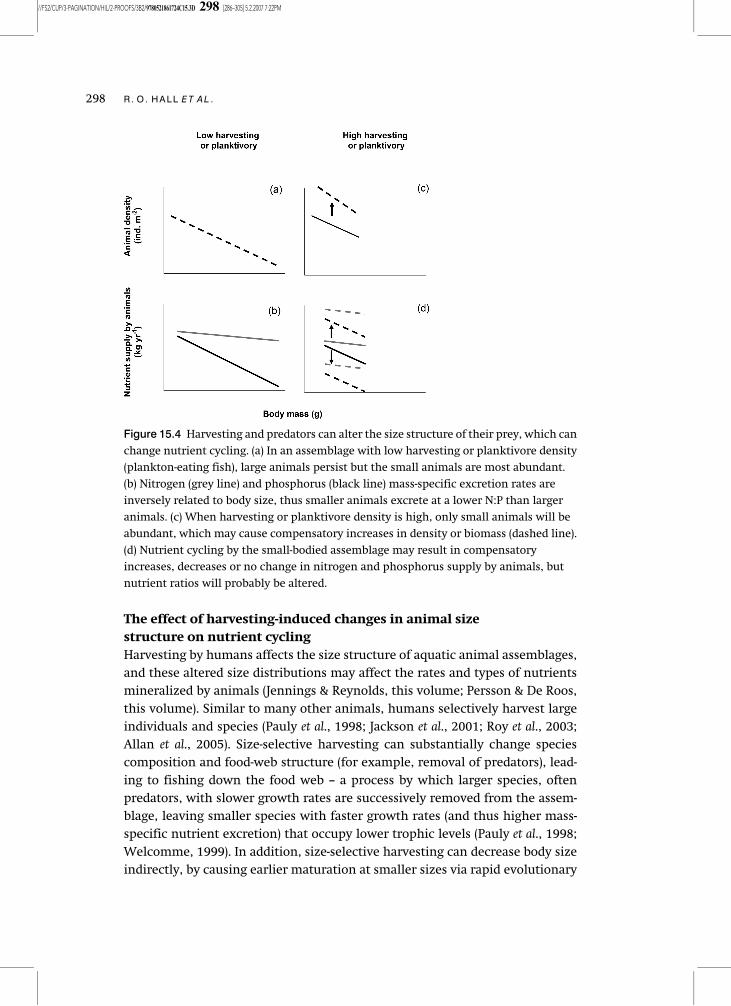
Figure 15.4 Harvesting and predators can alter the size structure of their prey, which can
change nutrient cycling. (a) In an assemblage with low harvesting or planktivore density
(plankton-eating fish), large animals persist but the small animals are most abundant.
(b) Nitrogen (grey line) and phosphorus (black line) mass-specific excretion rates are
inversely related to body size, thus smaller animals excrete at a lower N:P than larger
animals. (c) When harvesting or planktivore density is high, only small animals will be
abundant, which may cause compensatory increases in density or biomass (dashed line).
(d) Nutrient cycling by the small-bodied assemblage may result in compensatory
increases, decreases or no change in nitrogen and phosphorus supply by animals, but
nutrient ratios will probably be altered.
R . O . H A L L E T A L .298
//FS2/CUP/3-PAGINATION/HIL/2-PROOFS/3B2/9780521861724C15.3D 299 [286–305] 5.2.2007 7:22PM
change or increased resource availability that accelerates growth and decreases
time to maturity of the remaining individuals (Trippel, 1995). Taken together,
human harvesting generally decreases or eliminates the biomass of large ani-
mals from an ecosystem (Myers & Worm, 2003; Allan et al., 2005; Ward & Myers,
2005).
There are several mechanisms by which harvest-induced changes in animal
body size may alter the role of aquatic animals in mineralizing nutrients.
Foremost, size-selective harvesting results in the loss of large-bodied individuals
and species with high excretion rates per individual, but low mass-specific
excretion. There are also important differences in the ratios at which limiting
nutrients, such as N and P, are released by animals of different size (Wen &
Peters, 1994; Schindler & Eby, 1997; Sterner & Elser, 2002; Vanni et al., 2002). As a
result, the removal of large individuals may disproportionately reduce the
amount of N relative to P supplied by animal assemblages (Fig. 15.4a,b), assum-
ing there is no compensatory increase in abundances of smaller individuals or
species (solid line; Fig. 15.4c). If there are compensatory increases in abundance
of smaller individuals or species (dashed line; Fig. 15.4c) with higher mass-
specific mineralization rates, then the total supply of nutrients by the assem-
blage experiencing harvesting may equal or surpass the amount supplied by the
assemblage before harvesting (Fig. 15.4d). In addition, because home-range size
and migration distance increases with body size (Brown, 1995; Alimov, 2003;
Jetz et al., 2004), reduced body size due to harvesting could also decrease the
spatial scale over which nutrients are distributed by animals. This impact has
been realized; harvesting of large, migratory salmon may have decreased
marine nutrient loads to inland rivers, potentially lowering their productivity
(Thomas et al., 2003). Moreover, the larger animals, which are often the first and
most intensely harvested, generally have longer lifespans and more stable
population cycles than the smaller, short-lived species that are less frequently
harvested. Therefore, the removal of large, long-lived animals could increase the
fluctuations of nutrients mineralized by animal populations.
Overharvesting of large animals is a hallmark of all aquatic environments
(Myers & Worm, 2003; Allan et al., 2005). However, surprisingly little is known
about how the removal of larger animals alters the type or supply rate of
nutrients mineralized by animal assemblages and, more importantly, whether
such changes in nutrients are large enough to alter ecosystem-level processes. In
the Baltic sea, Hjerne and Hansson (2002) estimated that the removal of N and P
in fish biomass by harvesting to be 1.4–7% of the total nutrient load, although
the nutrient loss due to decreased mineralization by fish was not quantified.
Although information is available on how predators can mediate nutrient
mineralization rates by altering the size-structure of their prey, the process
and long-term effects of harvesting by humans are likely to be very different.
Humans typically remove the biomass of the largest animals, rarely switch
B O D Y S I Z E A N D N U T R I E N T C Y C L I N G 299
//FS2/CUP/3-PAGINATION/HIL/2-PROOFS/3B2/9780521861724C15.3D 300 [286–305] 5.2.2007 7:22PM
prey until populations are severely reduced or regulatory restrictions are
imposed, and harvest at maximal rates, which are often supported by external
factors such as economic subsidies. In freshwater, species removals for biomani-
pulation (Horppila, 1998; Tarvainen, Sarvala & Helminen, 2002), and declines
in introduced species, affect nutrient fluxes (Kraft, 1993); however, few studies
have documented the direct effects of size-selective harvesting on nutrient
fluxes. One reason is the mismatch in the data that are available on nutrient
mineralization rates and harvesting rates of aquatic animals between marine
and freshwater ecosystems. There are comparatively better data on catch size
and body size of marine animals (Pauly et al., 1998; Myers & Worm, 2003; Ward &
Myers, 2005) than freshwater animals (Allan et al., 2005), whereas there are more
empirical data on nutrient regeneration rates for freshwater animals (Sterner &
Elser, 2002). In marine systems, it may be useful to apply bioenergetic models to
estimate the amount and type of nutrients lost from these systems as a result of
having removed 80% of the large predatory fish biomass (Myers & Worm, 2003).
Predicting the effects of harvesting-induced changes in body size on nutrient
cycling is a new challenge that could improve our understanding of the role of
animals in ecosystem functioning, and provide urgently needed guidance for
managing and restoring these systems.
The next steps?Given that animals can often be important regenerators, storers and transport-
ers of nutrients in ecosystems (Kitchell et al., 1979; Gende et al., 2002; Vanni,
2002; Koch, 2005), body size may be the single most important trait of the
animals themselves in controlling these processes. There are plenty of avenues
in which to further explore the role of body size in conjunction with other
animal attributes (for example, phylogeny), and ecosystem processes. Below we
give some of these examples.
1. Taxonomic identity probably determines a large fraction of variation in
excretion rates, and taxonomy covaries with body size. To what degree
does size alone determine nutrient excretion rates? Can we integrate size
and phylogeny to improve predictions of nutrient excretion rate?
2. Body size allows us to examine how traits of animals impact ecosystem
processes, but we cannot forget that the attributes of the ecosystems them-
selves will, in part, determine the impact. For example, plant nutrient
demand, disturbance and hydrologic flushing rates are certainly important.
How important is animal assemblage structure relative to physical controls
and plant/microbial demand for nutrients?
3. We can only speculate as to the potential role of many fisheries on changes
to nutrient cycling. Some are well known, (for example, salmon), but most
are unknown (for example, groundfish stocks). These human-induced
R . O . H A L L E T A L .300
//FS2/CUP/3-PAGINATION/HIL/2-PROOFS/3B2/9780521861724C15.3D 301 [286–305] 5.2.2007 7:22PM
changes present an opportunity to examine how changes in aquatic animal
assemblages affect ecosystem processes and may provide the means to
compare the relative importance of direct versus indirect effects of assem-
blage and size structure on nutrient cycling.
AcknowledgementsMike Vanni, Emidio Andre, Keith Gido and Maynard Schaus kindly provided
tables of their published data for analysis. Two anonymous reviewers provided
useful comments on an earlier draft of this manuscript. Financial support was
provided by National Science Foundation; Environmental Protection Agency;
and the Juneau Pacific Northwest Research Station, USDA Forest Service.
ReferencesAlimov, A. F. (2003). Territoriality in aquatic
animals and their sizes. Biology Bulletin,
30, 79–86.
Allan, J. D. (2001). Stream Ecology: Structure and
Function of Running Waters, Boston: Kluwer
Academic Publishers.
Allan, J. D., Abell, R., Hogan, Z., Revenga, C.,
Taylor, B. W., Welcomme, R. L. &
Winemiller, K. (2005). Overfishing of inland
waters. Bioscience, 55, 1041–1051.
Andre, E. R., Hecky, R. E. & Duthie, H. C. (2003).
Nitrogen and phosphorus regeneration by
cichlids in the littoral zone of Lake Malawi,
Africa. Journal of Great Lakes Research, 29,
190–201.
Arendt, J. D. & Wilson, D. S. (2000). Population
differences in the onset of cranial
ossification in pumpkinseed (Lepomis
gibbosus), a potential cost of rapid growth.
Canadian Journal of Fisheries and Aquatic
Sciences, 57, 351–356.
Baca, R. M. & Threlkeld, S. T. (2000). Using size
distributions to detect nutrient and
sediment effects within and between
habitats. Hydrobiologia, 435, 197–211.
Barry, M. J. (1994). The costs of crest induction
for Daphnia carinata. Oecologia, 97, 278–288.
Bartell, S. M. (1981). Potential impact of size-
selective planktivory on phosphorus release
by zooplankton. Hydrobiologia, 80, 139–145.
Ben-David, M., Blundell, G. M., Kern, J. W. et al.
(2005). Communication in river otters:
creation of variable resource shed for
terrestrial communities. Ecology, 86,
1331–1345.
Benke, A. C., Huryn, A. D., Smock, L. A. &
Wallace, J. B. (1999). Length-mass relation-
ships for freshwater macroinvertebrates in
North America with particular reference to
the southeastern United States. Journal of the
North American Benthological Society, 18,
308–343.
Blumenshine, S. C., Lodge, D. M. & Hodgson, J. R.
(2000). Gradient of fish predation alters
body size distributions of lake benthos.
Ecology, 81, 374–386.
Boers, P., Vanballegooijen, L. & Uunk, J. (1991).
Changes in phosphorus cycling in a shallow
lake due to food web manipulations.
Freshwater Biology, 25, 9–20.
Bohonak, A. J. & van der Linde, K. (2004). RMA:
Software for reduced major axis regression,
Java version. http://www.kimvdlinde.com/
professional/rma.html.
Bourassa, N. & Morin, A. (1995). Relationships
between size structure of invertebrate
assemblages and trophy and substrate
composition in streams. Journal of the
North American Benthological Society, 14,
393–403.
B O D Y S I Z E A N D N U T R I E N T C Y C L I N G 301
//FS2/CUP/3-PAGINATION/HIL/2-PROOFS/3B2/9780521861724C15.3D 302 [286–305] 5.2.2007 7:22PM
Brooks, J. L. & Dodson, S. I. (1965). Predation,
body size, and composition of plankton.
Science, 150, 28–35.
Brown, J. H. (1995). Macroecology. Chicago:
University of Chicago Press.
Brown, J. H., Gillooly, J. F., Allen, A. P., Savage,
V. M. & West, G. B. (2004). Toward a
metabolic theory of ecology. Ecology,
85, 1771–1789.
Carpenter, S. R., Kraft, C. E., Wright, R. et al.
(1992). Resilience and resistance of a lake
phosphorus cycle before and after food web
manipulation. American Naturalist, 140,
781–798.
Cattaneo, A. (1993). Size spectra of benthic
communities in Laurentian streams.
Canadian Journal of Fisheries and Aquatic
Sciences, 50, 2659–2666.
Conroy, J. D., Edwards, W. J., Pontius, R. A. et al.
(2005). Soluble nitrogen and phosphorus
excretion of exotic freshwater
mussels (Dreissena spp.): potential
impacts for nutrient remineralisation in
western Lake Erie. Freshwater Biology,
50, 1146–1162.
Crowl, T. A. & Covich, A. P. (1990). Predator-
induced life-history shifts in a fresh-water
snail. Science, 247, 949–951.
Cyr, H. & Pace, M. L. (1993). Allometric theory:
extrapolations from individuals to
communities. Ecology, 74, 1234–1245.
Dahl, J. & Peckarsky, B. L. (2002). Induced
morphological defenses in the wild:
predator effects on a mayfly, Drunella
coloradensis. Ecology, 83, 1620–1634.
Dodson, S. I. (1974). Zooplankton competition
and predation: an experimental test of the
size-efficiency hypothesis. Ecology, 55,
605–613.
Elser, J. J. & Urabe, J. (1999). The stoichiometry of
consumer-driven nutrient recycling: theory,
observation and consequences. Ecology, 80,
735–751.
Elser, J. J., Elser, M. M., McKay, N. A. & Carpenter,
S. R. (1988). Zooplankton mediated
transitions between N and P limited algal
growth. Limnology and Oceanography, 33,
1–14.
Elser, J. J., Dobberfuhl, D. R., MacKay, N. A. &
Schampel, J. H. (1996). Organism size, life
history, and N:P stoichiometry: toward a
unified view of cellular and ecosystem
processes. Bioscience, 46, 674–684.
Elser, J. J., Chrzanowski, T. H., Sterner, R. W. &
Mills, K. H. (1998). Stoichiometric
constraints on food-web dynamics: a whole-
lake experiment on the Canadian Shield.
Ecosystems, 1, 120–136.
Feller, R. J. & Warwick, R. M. (1988). Energetics.
In Introduction to the Study of Meiofauna, ed.
R. P. Higgins and H. Thiel. Washington, DC:
Smithsonian Institution Press, pp. 181–196.
Fukuhara, H. & Yasuda, K. (1989). Ammonium
excretion by some freshwater zoobenthos
from a eutrophic lake. Hydrobiologia,
173, 1–8.
Gaedke, U. (1992). The size distribution of
plankton biomass in a large lake and its
seasonal variability. Limnology and
Oceanography, 37, 1202–1220.
Gardner, W. S. & Scavia, D. (1981). Kinetic
examination of nitrogen release by
zooplankters. Limnology and Oceanography
26, 801–810.
Gende, S. M., Edwards, R. T., Willson, M. F. &
Wipfli, M. S. (2002). Pacific salmon in
aquatic and terrestrial ecosystems.
Bioscience, 52, 917–928.
Gido, K. B. (2002). Interspecific comparisons
and the potential importance of nutrient
excretion by benthic fishes in a large
reservoir. Transactions of the American Fisheries
Society, 131, 260–270.
Gillooly, J. F., Brown, J. H., West, G. B., Savage,
V. M. & Charnov, E. L. (2001). Effects of size
and temperature on metabolic rate. Science,
293, 2248–2251.
Grimm, N. B. (1988). Role of macroinvertebrates
in nitrogen dynamics of a desert stream.
Ecology, 69, 1884–1893.
R . O . H A L L E T A L .302
//FS2/CUP/3-PAGINATION/HIL/2-PROOFS/3B2/9780521861724C15.3D 303 [286–305] 5.2.2007 7:22PM
Hall, R. O., Tank, J. L. & Dybdahl, M. F. (2003).
Exotic snails dominate nitrogen and carbon
cycling in a highly productive stream.
Frontiers in Ecology and the Environment, 1,
407–411.
Hanson, J. M., Prepas, E. E. & Mackay, W. C.
(1989). Size distribution of
macroinvertebrate community in a
freshwater lake. Canadian Journal of Fisheries
and Aquatic Sciences, 46, 1510–1519.
Henry, R. L. (1985). The impact of
zooplankton size structure on
phosphorus cycling in field
enclosures. Hydrobiologia, 120, 3–9.
Hjerne, O. & Hansson, S. (2002). The role of
fish and fisheries in Baltic Sea nutrient
dynamics. Limnology and Oceanography,
47, 1023–1032.
Horppila, J. (1998). Effects of mass removal and
variable recruitment on nutrient excretion
by a planktivorous roach stock. Journal of
Fish Biology, 52, 951–961.
Huxley, J. S. (1932). Problems of Relative Growth,
London: Methuen.
Jackson, J. B. C., Kirby, M. X., Berger, W. H. et al.
(2001). Historical overfishing and the recent
collapse of coastal ecosystems. Science, 293,
629–638.
Jetz, W., Carbone, C., Fulford, J. & Brown, J. H.
(2004). The scaling of animal space use.
Science, 306, 266–268.
Jones, C. G. & Lawton, J. H. (1995). Linking
Species and Ecosystems. New York: Chapman
& Hall.
Kitchell, J. F., O’Neil, R. V., Webb, D. et al. (1979).
Consumer regulation of nutrient cycling.
Bioscience, 29, 28–34.
Koch, B. J. (2005). Invertebrate-mediated
nitrogen cycling in three connected aquatic
ecosystems, M. S. thesis, Laramie: University
of Wyoming, p. 54.
Kraft, C. E. (1993). Phosphorus regeneration by
Lake Michigan Alewives in the mid-1970s.
Transactions of the American Fisheries Society,
122, 749–755.
Li, K. T., Wetterer, J. K. & Hairston, N. G.
(1985). Fish size, visual resolution, and prey
selectivity. Ecology, 66, 1729–1735.
Lively, C. M. (1986). Competition, comparative
life histories, and maintenance of shell
dimorphism in a barnacle. Ecology, 67,
858–864.
Mercier, V., Vis, C., Morin, A. & Hudon, C. (1999).
Patterns in invertebrate and periphyton size
distributions from navigation buoys in the
St. Lawrence River. Hydrobiologia, 394,
83–91.
Meyer, J. L., Schultz, E. T. & Helfman, G. S. (1983).
Fish schools: an asset to corals. Science, 220,
1047–1049.
Morin, A. & Nadon, D. (1991). Size distribution of
epilithic lotic invertebrates and implications
for community metabolism. Journal of the
North American Benthological Society, 10,
300–308.
Myers, R. & Worm, B. (2003). Rapid worldwide
depletion of predatory fish communities.
Nature, 423, 280–283.
Nachtigall, W. (1977). Swimming mechanics and
energetics of locomotion in variously sized
water beetles-Dytiscidae, body length 2 to
35 mm. In Scale Effects in Animal Locomotion,
ed. T. J. Pedley. London: Academic Press,
pp. 269–283.
Pauly, D., Christensen, V., Dalsgaard, J., Froese,
R. & Torres, F., Jr. (1998). Fishing down
marine food webs. Science, 279, 860–863.
Peckarsky, B. L., McIntosh, A. R., Taylor, B. W. &
Dahl, J. (2002). Predator chemicals induce
changes in mayfly life history traits: a whole-
stream manipulation. Ecology, 83, 612–618.
Peters, R. H. (1983). The Ecological Implications of
Body Size. Cambridge: Cambridge University
Press.
Quinn, T. P. & Kinnison, M. T. (1999). Size-
selective and sex-selective predation by
brown bears on sockeye salmon. Oecologia,
121, 273–282.
Ramcharan, C. W., France, R. L. & McQueen, D. J.
(1996). Multiple effects of planktivorous fish
B O D Y S I Z E A N D N U T R I E N T C Y C L I N G 303
//FS2/CUP/3-PAGINATION/HIL/2-PROOFS/3B2/9780521861724C15.3D 304 [286–305] 5.2.2007 7:22PM
on algae through a pelagic trophic cascade.
Canadian Journal of Fisheries and Aquatic
Sciences, 53, 2819–2828.
Ramsay, P. M., Rundle, S. D., Attrill, M. J. et al.
(1997). A rapid method for estimating
biomass size spectra of benthic metazoan
communities. Canadian Journal of Fisheries and
Aquatic Sciences, 54, 1716–1724.
Rasmussen, J. B. (1993). Patterns in the size
structure of littoral zone macroinvertebrate
communities. Canadian Journal of Fisheries and
Aquatic Sciences, 50, 2192–2207.
Reinertsen, H. A., Jensen, A., Langeland, A. &
Olsen, Y. (1986). Algal competition for
phosphorus: the influence of zooplankton
and fish. Canadian Journal of Fisheries and
Aquatic Sciences, 43, 1135–1141.
Robson, B. J., Barmuta, L. A. & Fairweather, P. G.
(2005). Methodological and conceptual
issues in the search for relationship
between animal body-size distributions and
benthic habitat architecture. Marine and
Freshwater Research, 56, 1–11.
Roy, K., Collins, A. G., Becker, B. J., Begovic, E. &
Engle, J. M. (2003). Anthropogenic impacts
and historical decline in body size of rocky
intertidal gastropods in southern
California. Ecology Letters, 6, 205–211.
Schaus, M. H., Vanni, M. J., Wissing, T. E. et al.
(1997a). Nitrogen and phosphorus excretion
by detritivorous gizzard shad in a reservoir
ecosystem. Limnology and Oceanography, 42,
1386–1397.
Schaus, M. H., Vanni, M. J., Wissing, T. E. et al.
(1997b). Nitrogen and phosphorus excretion
by detritivorus gizzard shad in a reservoir
ecosystem. Limnology and Oceanography, 42,
1386–1397.
Schindler, D. E. & Eby, L. A. (1997). Stoichiometry
of fishes and their prey: implications for
nutrient recycling. Ecology, 78, 1816–1831.
Schmid, P. E., Tokeshi, M. & Schmid-Araya, J. M.
(2002). Scaling in stream communities.
Proceedings of the Royal Society of London B, 269,
2587–2594.
Simon, K. S., Townsend, C. R., Biggs,
B. J. F., Bowden, W. B. & Frew, R. D. (2004).
Habitat-specific nitrogen dynamics in New
Zealand streams containing native and
invasive fish. Ecosystems, 7, 777–792.
Stead, T. K., Schmid-Araya, J. M., Schmid, P. E. &
Hildrew, A. G. (2005). The distribution of
body size in a stream community: one
system, many patterns. Journal of Animal
Ecology, 74, 475–487.
Sterner, R. W. (1990). The ratio of nitrogen to
phosphorus resupplied by herbivores –
zooplankton and the algal competitive
arena. American Naturalist, 136, 209–229.
Sterner, R. W. & Elser, J. J. (2002). Ecological
Stoichiometry. Princeton: Princeton
University Press.
Stibor, H. (1992). Predator induced life-history
shifts in a fresh-water cladoceran. Oecologia,
92, 162–165.
Tarvainen, M., Sarvala, J. & Helminen, H. (2002).
The role of phosphorus release by roach
Rutilus rutilus (L.) in the water quality
changes of a biomanipulated lake.
Freshwater Biology, 47, 2325–2336.
Teal, J. M. (1962). Energy flow in the salt marsh
ecosystem of Georgia. Ecology, 43, 614–649.
Thomas, S. A., Royer, T. V., Minshall, G. W. &
Snyder, E. (2003). Assessing the role of
marine derived nutrients in Idaho streams.
In Nutrients in Salmonid Ecosystems: Sustaining
Productivity and Biodiversity, ed. J. G. Stockner.
Bethesda, Maryland: American Fisheries
Society, pp. 41–55.
Tollrian, R. (1995). Predator-induced
morphological defenses: costs, life history
shifts, and maternal effects in Daphnia pulex.
Ecology, 76, 1691–1705.
Trippel, E. A. (1995). Age at maturity as a stress
indicator in fisheries. Bioscience, 45,
759–771.
Vadeboncoeur, Y., Vander Zanden, M. J. & Lodge,
D. M. (2002). Putting the lake back together:
reintegrating benthic pathways into lake
food web models. Bioscience, 52, 44–54.
R . O . H A L L E T A L .304
//FS2/CUP/3-PAGINATION/HIL/2-PROOFS/3B2/9780521861724C15.3D 305 [286–305] 5.2.2007 7:22PM
Vanni, M. J. (1987). Effects of nutrients and
zooplankton size on the structure of a
phytoplankton community. Ecology, 68,
624–635.
Vanni, M. J. (2002). Nutrient cycling by
animals in freshwater ecosystems.
Annual Review of Ecology and Systematics, 33,
341–370.
Vanni, M. J. & Findlay, D. L. (1990). Trophic
cascades and phytoplankton community
structure. Ecology, 71, 921–937.
Vanni, M. J., Flecker, A. S., Hood, J. M. &
Headworth, J. L. (2002). Stoichiometry of
nutrient recycling by vertebrates in a
tropical stream: linking species idenitity
and ecosystem processes. Ecology Letters, 5,
285–293.
Ward, P. & Myers, R. A. (2005). Shifts in open-
ocean fish communities coinciding with the
commencement of commercial fishing.
Ecology, 86, 835–847.
Weihs, D. (1977). Effects of size on sustained
swimming speeds of aquatic organisms. In
Scale Effects in Animal Locomotion, ed.
T. J. Pedley. London: Academic Press,
pp. 299–313.
Welcomme, R. L. (1999). A review of a model
for qualitative evaluation of exploitation
levels in multi-species fisheries. Fisheries
Management and Ecology, 6, 1–19.
Wen, Y. H. & Peters, R. H. (1994). Empirical
models of phosphorus and nitrogen-
excretion rates by zooplankton. Limnology
and Oceanography, 39, 1669–1679.
Winemiller, K. & Jepsen, D. B. (2004). Migratory
neotropical fish subsidize food webs of
oligotrophic blackwater rivers. In Food Webs
at the Landscape Level, ed. G. A. Polis, M. E.
Power and G. R. Huxel. Chicago: University
of Chicago Press, pp. 115–132.
Wootton, J. T. (1994). Predicting direct and
indirect effects: an integrated approach
using experiments and path analysis.
Ecology, 75, 151–165.
Zhuang, S. (2005). The influence of body size
and water temperature on metabolism
and energy budget in Laternula marilina
Reeve. Aquaculture Research, 36, 768–775.
B O D Y S I Z E A N D N U T R I E N T C Y C L I N G 305